detection of bacterial metabolic volatile indole using a
TRANSCRIPT

Detection of Bacterial Metabolic Volatile Indole Using a Graphene-Based Field-EffectTransistor Biosensor
Lin, Zihong; Wu, Guangfu; Zhao, Ling; Lai, King Wai Chiu
Published in:Nanomaterials
Published: 01/05/2021
Document Version:Final Published version, also known as Publisher’s PDF, Publisher’s Final version or Version of Record
License:CC BY
Publication record in CityU Scholars:Go to record
Published version (DOI):10.3390/nano11051155
Publication details:Lin, Z., Wu, G., Zhao, L., & Lai, K. W. C. (2021). Detection of Bacterial Metabolic Volatile Indole Using aGraphene-Based Field-Effect Transistor Biosensor. Nanomaterials, 11(5), [1155].https://doi.org/10.3390/nano11051155
Citing this paperPlease note that where the full-text provided on CityU Scholars is the Post-print version (also known as Accepted AuthorManuscript, Peer-reviewed or Author Final version), it may differ from the Final Published version. When citing, ensure thatyou check and use the publisher's definitive version for pagination and other details.
General rightsCopyright for the publications made accessible via the CityU Scholars portal is retained by the author(s) and/or othercopyright owners and it is a condition of accessing these publications that users recognise and abide by the legalrequirements associated with these rights. Users may not further distribute the material or use it for any profit-making activityor commercial gain.Publisher permissionPermission for previously published items are in accordance with publisher's copyright policies sourced from the SHERPARoMEO database. Links to full text versions (either Published or Post-print) are only available if corresponding publishersallow open access.
Take down policyContact [email protected] if you believe that this document breaches copyright and provide us with details. We willremove access to the work immediately and investigate your claim.
Download date: 14/03/2022

nanomaterials
Article
Detection of Bacterial Metabolic Volatile Indole Using aGraphene-Based Field-Effect Transistor Biosensor
Zihong Lin 1, Guangfu Wu 2 , Ling Zhao 1 and King Wai Chiu Lai 1,*
Citation: Lin, Z.; Wu, G.; Zhao, L.;
Lai, K.W.C. Detection of Bacterial
Metabolic Volatile Indole Using a
Graphene-Based Field-Effect
Transistor Biosensor. Nanomaterials
2021, 11, 1155. https://doi.org/
10.3390/nano11051155
Academic Editor: Simone Morais
Received: 9 April 2021
Accepted: 25 April 2021
Published: 28 April 2021
Publisher’s Note: MDPI stays neutral
with regard to jurisdictional claims in
published maps and institutional affil-
iations.
Copyright: © 2021 by the authors.
Licensee MDPI, Basel, Switzerland.
This article is an open access article
distributed under the terms and
conditions of the Creative Commons
Attribution (CC BY) license (https://
creativecommons.org/licenses/by/
4.0/).
1 Department of Biomedical Engineering, Centre for Robotics and Automation, City University of Hong Kong,Kowloon Tong, Hong Kong 999077, China; [email protected] (Z.L.);[email protected] (L.Z.)
2 Department of Biomedical Engineering, University of Connecticuit, Storrs, CT 06269, USA;[email protected]
* Correspondence: [email protected]
Abstract: The existence of bacteria is a great threat to food safety. Volatile compounds secreted bybacteria during their metabolic process can be dissected to evaluate bacterial contamination. Indole,as a major volatile molecule released by Escherichia coli (E. coli), was chosen to examine the presenceof E. coli in this research. In this work, a graphene field-effect transistor (G-FET) was employedto detect the volatile molecule-indole based on a π-π stacking interaction between the indole andthe graphene. The exposure of G-FET devices to the indole provokes a change in electrical signal,which is ascribed to the adsorption of the indole molecule onto the graphene surface via π-π stacking.The adsorption of the indole causes a charge rearrangement of the graphene-indole complex, whichleads to changes in the electrical signal of G-FET biosensors with a different indole concentration.Currently, the indole biosensor can detect indole from 10 ppb to 250 ppb and reach a limit of detectionof 10 ppb for indole solution detection. We believe that our detection strategy for detecting bacterialmetabolic gas molecules will pave a way to developing an effective platform for bacteria detection infood safety monitoring.
Keywords: indole; graphene; field-effect transistor; indole detector; bacterial metabolic indole
1. Introduction
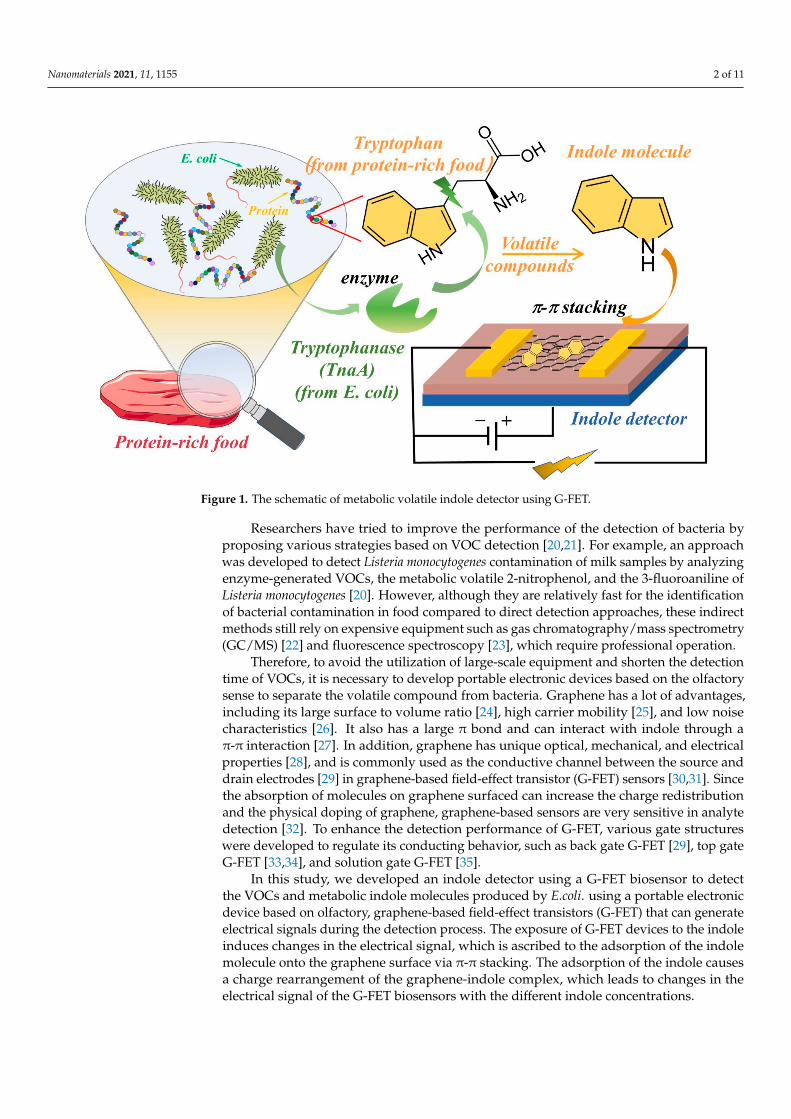
Pathogenic bacteria significantly impact human health and the environment dueto their ability to cause food-borne illness [1–3]. More than 2 million people die fromunsafe foods every year, according to the 2015 WHO report [4]. Various methods havebeen developed to directly or indirectly detect foodborne pathogenic bacteria [5–8]. Thedirect methods, such as viable cell enumeration [9], the selective isolation of bacteria oncommercial media [10], and immunoassays [11], can directly detect bacteria, which isoften tenuous with molecular-based technologies. Using these conventional methods istime-consuming for sample pretreatment and the proliferation of pathogenic bacteria [12].Additionally, even though these agents and the equipment for detecting bacteria arecommercially available, significant fluctuations in the detection results often happen whileusing these methods. It is of great importance to develop a novel method to detect bacteriarapidly and simply. Therefore, some indirect methods have been developed [13,14] whichtranslate the direct detection of bacteria into the detection of their metabolites, such asvolatile organic compounds (VOCs) [15,16]. Generally, spoiled food has an unpleasantodor, which can be used for the identification of food quality [17,18]. Specifically, variousbacteria can produce different VOCs. For example, yeast can transform polysaccharide intovolatile alcohol, which indicates fruit spoilage [19]. Escherichia coli (E. coli) can transformamino acids, such as tryptophan, into indole, which is extensively present in milk, meats,and seafood, as shown in Figure 1.
Nanomaterials 2021, 11, 1155. https://doi.org/10.3390/nano11051155 https://www.mdpi.com/journal/nanomaterials
Nanomaterials 2021, 11, 1155 2 of 11
Figure 1. The schematic of metabolic volatile indole detector using G-FET.
Researchers have tried to improve the performance of the detection of bacteria byproposing various strategies based on VOC detection [20,21]. For example, an approachwas developed to detect Listeria monocytogenes contamination of milk samples by analyzingenzyme-generated VOCs, the metabolic volatile 2-nitrophenol, and the 3-fluoroaniline ofListeria monocytogenes [20]. However, although they are relatively fast for the identificationof bacterial contamination in food compared to direct detection approaches, these indirectmethods still rely on expensive equipment such as gas chromatography/mass spectrometry(GC/MS) [22] and fluorescence spectroscopy [23], which require professional operation.
Therefore, to avoid the utilization of large-scale equipment and shorten the detectiontime of VOCs, it is necessary to develop portable electronic devices based on the olfactorysense to separate the volatile compound from bacteria. Graphene has a lot of advantages,including its large surface to volume ratio [24], high carrier mobility [25], and low noisecharacteristics [26]. It also has a large π bond and can interact with indole through aπ-π interaction [27]. In addition, graphene has unique optical, mechanical, and electricalproperties [28], and is commonly used as the conductive channel between the source anddrain electrodes [29] in graphene-based field-effect transistor (G-FET) sensors [30,31]. Sincethe absorption of molecules on graphene surfaced can increase the charge redistributionand the physical doping of graphene, graphene-based sensors are very sensitive in analytedetection [32]. To enhance the detection performance of G-FET, various gate structureswere developed to regulate its conducting behavior, such as back gate G-FET [29], top gateG-FET [33,34], and solution gate G-FET [35].
In this study, we developed an indole detector using a G-FET biosensor to detectthe VOCs and metabolic indole molecules produced by E.coli. using a portable electronicdevice based on olfactory, graphene-based field-effect transistors (G-FET) that can generateelectrical signals during the detection process. The exposure of G-FET devices to the indoleinduces changes in the electrical signal, which is ascribed to the adsorption of the indolemolecule onto the graphene surface via π-π stacking. The adsorption of the indole causesa charge rearrangement of the graphene-indole complex, which leads to changes in theelectrical signal of the G-FET biosensors with the different indole concentrations.
Nanomaterials 2021, 11, 1155 3 of 11
2. Materials and Methods2.1. Indole Preparation
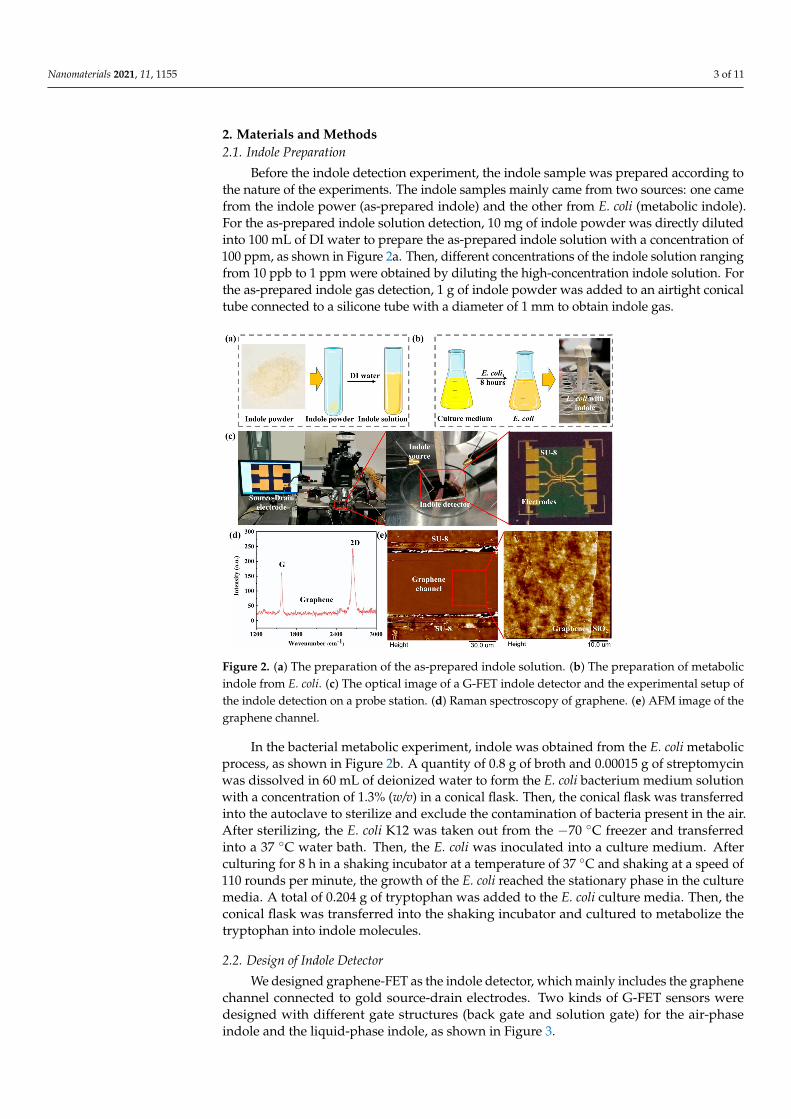
Before the indole detection experiment, the indole sample was prepared according tothe nature of the experiments. The indole samples mainly came from two sources: one camefrom the indole power (as-prepared indole) and the other from E. coli (metabolic indole).For the as-prepared indole solution detection, 10 mg of indole powder was directly dilutedinto 100 mL of DI water to prepare the as-prepared indole solution with a concentration of100 ppm, as shown in Figure 2a. Then, different concentrations of the indole solution rangingfrom 10 ppb to 1 ppm were obtained by diluting the high-concentration indole solution. Forthe as-prepared indole gas detection, 1 g of indole powder was added to an airtight conicaltube connected to a silicone tube with a diameter of 1 mm to obtain indole gas.
Figure 2. (a) The preparation of the as-prepared indole solution. (b) The preparation of metabolicindole from E. coli. (c) The optical image of a G-FET indole detector and the experimental setup ofthe indole detection on a probe station. (d) Raman spectroscopy of graphene. (e) AFM image of thegraphene channel.
In the bacterial metabolic experiment, indole was obtained from the E. coli metabolicprocess, as shown in Figure 2b. A quantity of 0.8 g of broth and 0.00015 g of streptomycinwas dissolved in 60 mL of deionized water to form the E. coli bacterium medium solutionwith a concentration of 1.3% (w/v) in a conical flask. Then, the conical flask was transferredinto the autoclave to sterilize and exclude the contamination of bacteria present in the air.After sterilizing, the E. coli K12 was taken out from the −70 C freezer and transferredinto a 37 C water bath. Then, the E. coli was inoculated into a culture medium. Afterculturing for 8 h in a shaking incubator at a temperature of 37 C and shaking at a speed of110 rounds per minute, the growth of the E. coli reached the stationary phase in the culturemedia. A total of 0.204 g of tryptophan was added to the E. coli culture media. Then, theconical flask was transferred into the shaking incubator and cultured to metabolize thetryptophan into indole molecules.
2.2. Design of Indole Detector
We designed graphene-FET as the indole detector, which mainly includes the graphenechannel connected to gold source-drain electrodes. Two kinds of G-FET sensors weredesigned with different gate structures (back gate and solution gate) for the air-phaseindole and the liquid-phase indole, as shown in Figure 3.

Nanomaterials 2021, 11, 1155 4 of 11
Figure 3. (a) The back-gate FET for gas-phase indole detection. (b) The solution-gate FET for liquid-phase indole detection.
The device fabrication mainly included two parts: the fabrication of the source-drainelectrodes and graphene patterning, as shown in Figure 4. Firstly, cleaned silicon wafer(p-type, 100 crystallographic orientations, 0.001–0.005 Ω cm resistivity) with a 300 nm SiO2(Zhejiang Lijing Materials Technology Co., Zhejiang, China) was used as a substrate for thesource and drain electrode fabrication. The metal electrodes were made by a conventionallithography process that started with the spin coating of photoresist (AZ5214) on the wafer,followed by baking at 90 C for 3 min on a hot plate. Afterwards, it was exposed to amask aligner at a wavelength of 365 nm for 7 s. The patterns were then developed byusing a resist developer/DI water solution with a volume ratio of 1:3. Then, 15 nm Cr and90 nm Au were deposited on the wafer by RF sputtering. The substrate with source-drainelectrodes was ready after immersing the wafer in acetone for 1 h to remove the remainingphotoresist. Secondly, a monolayer chemical vapor deposition (CVD) grown graphenewith a lateral size of 100 µm was adopted as the conductive channel. The CVD grapheneon copper foil was a commercial sample purchased from Xiamen G-CVD TechnologyCo., Ltd., Fujian, China. To achieve the repeatability of the G-FET sensor, a well-shapeduniform graphene pattern was obtained by photolithography with a size of 100 × 100 µm.PMMA-assisted graphene transfer was adopted for graphene patterning [36]. This wasstarted by spin-coated graphene on copper foil with a layer of PMMA with a concentrationof 20 mg/mL. Next, the graphene/PMMA film was immersed in an Iron (III) ChlorideHexahydrate solution (FeCl3·6H2O, 1 M) to etch the underneath copper foil, followed bywashing the film sequentially with a 5% HCl solution and deionized water. Then, it wascarefully transferred on a silicon wafer followed by a drying procedure at a temperatureof 80 C. This substrate was further immersed in acetone for 24 h to remove the PMMAfilm, and bare graphene was obtained. The graphene film obtained on the silicon substratewas spin-coated with a layer of photoresist and cured at a temperature of 90 C. Aftersolidification, the photoresist-covered graphene was exposed to a UV light for 9 s using aphotomask, followed by a developing process. Then, the chip was transferred to oxygenplasma for 20 min. The uncovered parts of graphene were oxidized and removed. Lastly,the substrate was immersed in acetone to remove the photoresist, and a graphene patternwith a certain size was obtained. Finally, after the preparation of the source-drain electrodeand the graphene pattern, the graphene pattern was transferred to the metal electrodeby the Figure 2c. Raman spectroscopy and atomic force microscopy (AFM) were usedto characterize the monolayer graphene on the SiO2/Si wafer, as shown in Figure 2d,e,respectively. According to the research, the G and 2D peaks of the monolayer grapheneRaman spectra G are at around 1582 cm−1 and the 2D peak at around 2629.7 cm−1 canbe fitted with a single Lorentzian line shape [37], which demonstrates that the grapheneis unilaminar. Moreover, the morphology of the graphene channel was also investigatedby AFM. As can be observed from the AFM image (Figure 2e), the graphene film wascontinuous and uniform [31].

Nanomaterials 2021, 11, 1155 5 of 11
Figure 4. The fabrication process of the indole detector.
2.3. Electrical Measurements
The electrical characterizations of G-FETs were conducted using a semiconductordevice analyzer (Semiconductor Analyzer, B1500, Keysight Co. Ltd., Santa Rosa, CA, USA)coupled with a probe station. The source and drain electrodes were connected to thesemiconductor analyzer, which could provide a voltage to our device by two probes onthe probe station, as shown in Figure 2c. The probes could move from x, y, and z and inthree directions by adjusting the manipulators with an accuracy at the micrometer level toachieve a proper position to make good contact with the two gold electrodes. The sourceelectrode ground as a reference potential and a voltage (Vds) were applied to the sourceand drain electrodes with a value of 100 mV. The gate voltages (Vg) of the solution and gasdetection were 0.1 V and 25 V, respectively.
3. Results and Discussion3.1. Indole Solution Detection
During the experiment for the detection of liquid-phase indole using G-FET, the sourceand drain electrodes of the G-FET were first insulated by SU-8 to prevent possible leakagecurrent from the solution during the detection process. After that, silicone rubber was usedto form a recording chamber on the device’s surface, in which graphene was introduced todetect indole molecules, as shown in Figure 5a.
Firstly, the characteristic transfer curve of the as-prepared G-FET device was char-acterized before and after the interaction of liquid-phase indole molecules. As shown inFigure 5b, the black and red lines represent the transfer curves of graphene before and afterexposure to indole. A right shift of the transfer curve was observed, which indicated thatindole could interact with the graphene channel and impose a p-doping effect of graphene.The shift in the Dirac point, resulting from a change in the electric charge on the graphenesurface, confirmed the successive surface attachment of indole molecules. The resultsshowed that the real-time Ids could reflect the state of the molecular adsorption on thegraphene surface. Secondly, from the transfer curve the carrier mobility of hole carriersreached the maximum value at a gate voltage equal to 0.1 V. Therefore, a real-time detectionexperiment will be conducted with the gate voltage of 0.1 V. Various concentrations (10 ppb,20 ppb, 50 ppb, and 100 ppb) of the indole solution were added to our G-FET biosensor. Ineach drop, the volume of the solution was 10 µL, so the final concentration of the indolesolution on the sensor was estimated to be 253 ppb. The real-time detection result is shownin Figure 5c. After each drop of indole solution, the signal of the sensor increased because

Nanomaterials 2021, 11, 1155 6 of 11
of the attachment of the indole molecules to the surface of the graphene. It was also foundthat the change in current (∆Ids) was related to the concentration of the indole solution.When the concentration was at 100 ppb, the ∆Ids turned to the highest value. However,further adding of the indole solution did not lead to a higher signal change because thedevice was saturated at the end of each experiment. As the attachment of the indolemolecules on the graphene surface was a complex process, some indole molecules alsodisassociated from the graphene surface, resulting in an equilibrium of association anddisassociation. To gain a better understanding of the relationship between the electricalresponse and the concentration of the indole sample, we analyzed the electrical responsesby repeating the experiment with multiple sensors (n = 5). The electrical response wasdefined as the percentage ratio of ∆Ids over the initial source-drain current, as shown inFigure 5c. For different concentrations of indole, the response changes are summarizedin Figure 5d. The electrical response and the indole concentration have a good linearrelationship, especially at low concentrations. When the concentration of indole was low,all indole molecules could easily attach to the graphene surface because sufficient vacantbinding sites were provided. However, when the concentration of indole became very high,the indole molecules adsorbed on the graphene surface tended to saturate due to the finitesurface area of the graphene, which was why the response–concentration curve no longerobeyed a linear relationship. The results demonstrate that our G-FET sensors can be usedfor quantitative liquid-phase indole detection.
Figure 5. (a) The experimental setup of liquid-phase indole detection. (b) The transfer characteristics of graphene channelbefore and after the exposure of indole. (c) The real-time detection of indole solution using the G-FET biosensor. (d) Thecorrelation between the electrical responses and various concentrations of the indole solution.
3.2. Indole Gas Detection
To detect the gas-phase indole, the experimental setup is demonstrated in Figure 6a.The back gate was adopted, and the gate voltage was applied to the backside of the silicon

Nanomaterials 2021, 11, 1155 7 of 11
directly. The indole solid was put into a plastic test-tube which was connected to twotubules. The short tubule was connected to a syringe which was driven by a syringe pump.The long tubule was fixed on top of our G-FET biosensor. During the detection experiment,the syringe pump was operated at a rate of 200 µL/min, in order for the volatile indoleto reach the surface of the G-FET biosensor. The experiments were conducted using atemperature of 20 C. Since E. coli can produce various metabolites which can interfere withindole detection, such as different types of alcohols and esters of alcohols, we investigatedthe interference experiments of alcohols and ketones to observe the influence of hydroxyand carbonyl groups. Both alcohol and ketones can provoke small changes in the electricalsignal, but the signal change (∆Ids) disappeared upon the ceasing of exposure of our sensorto alcohols and ketones (Figure 6b,c). However, even after the pump was stopped, thesignal change (∆Ids) induced by the indole was constant.
Figure 6. (a) The experimental setup of gas-phase indole detection. (b) The real-time response of acetone using the G-FETbiosensor. (c) The real-time response of ethanol using the G-FET biosensor. (d) The transfer characteristics of graphenechannel before and after the exposure of the gas-phase indole. (e) The control experiment using air gas. (f) The real-timedetection of indole gas molecules using the G-FET biosensor.
Nanomaterials 2021, 11, 1155 8 of 11
As the ambient condition of indole gas detection is under an atmosphere, a controlexperiment was conducted using air gas, as shown in Figure 6e. The real-time resultdemonstrates that before and after the air interacts with the graphene surface, there is noobvious change in the electrical properties of the graphene. Moreover, the characterizationof the transfer curve followed, as shown in Figure 6d. The dark line barely shows changescompared to the transfer curve (red line) of the bare graphene, which also indicated thatthe electrical signal was not influenced by the airflow. The real-time detection of indole gaswas conducted at the gate voltage of 25 V. As shown in Figure 6f, when the syringe pumpwas turned on, the source-drain current (Ids) visibly increased. However, the Ids tendedto keep constant when the pump was stopped. The real-time response tended to be flataround 81.5 µA and led to a signal change of 13.4 µA, which showed a response of 19.7%for the gas-phase indole detection. Indole is an aromatic heterocyclic organic compoundconsisting of a six-membered benzene ring fused to a five-membered pyrrole ring. It canbe absorbed on a graphene surface due to the π-π interactions attributed to its moleculestructure [38], and leads to a signal change in G-FET. This result demonstrated that ourG-FET sensor can be utilized for indole gas detection. Moreover, the transfer curve afterthe indole detection was described. The transfer curve obviously shifted to the right, asshown in Figure 6d (blue line), which indicates that the indole molecule has a p-dopingeffect on the graphene channel. This result was consistent with the liquid-phase indoledetection and indicated that the G-FET sensor can effectively detect the indole molecules.
3.3. Bacterial Metabolic Indole Detection
As indole is a metabolic volatile organic compound (VOC) of E. coli, it is possibleto detect the presence of E. coli by detecting the metabolic volatile indole. The E. colimetabolic indole can be present both in an E. coli culture medium and its surroundingair. In this experiment, we investigated the detection of the liquid-phase and air-phasemetabolic indoles.
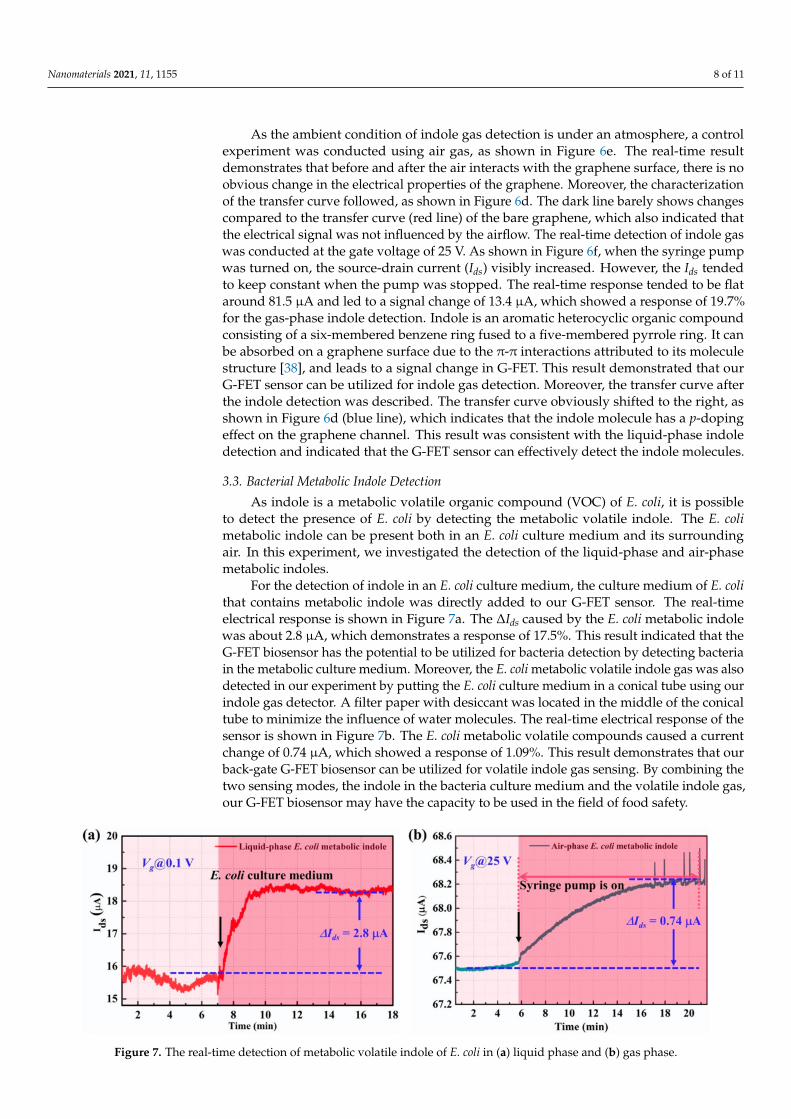
For the detection of indole in an E. coli culture medium, the culture medium of E. colithat contains metabolic indole was directly added to our G-FET sensor. The real-timeelectrical response is shown in Figure 7a. The ∆Ids caused by the E. coli metabolic indolewas about 2.8 µA, which demonstrates a response of 17.5%. This result indicated that theG-FET biosensor has the potential to be utilized for bacteria detection by detecting bacteriain the metabolic culture medium. Moreover, the E. coli metabolic volatile indole gas was alsodetected in our experiment by putting the E. coli culture medium in a conical tube using ourindole gas detector. A filter paper with desiccant was located in the middle of the conicaltube to minimize the influence of water molecules. The real-time electrical response of thesensor is shown in Figure 7b. The E. coli metabolic volatile compounds caused a currentchange of 0.74 µA, which showed a response of 1.09%. This result demonstrates that ourback-gate G-FET biosensor can be utilized for volatile indole gas sensing. By combining thetwo sensing modes, the indole in the bacteria culture medium and the volatile indole gas,our G-FET biosensor may have the capacity to be used in the field of food safety.
Figure 7. The real-time detection of metabolic volatile indole of E. coli in (a) liquid phase and (b) gas phase.
Nanomaterials 2021, 11, 1155 9 of 11
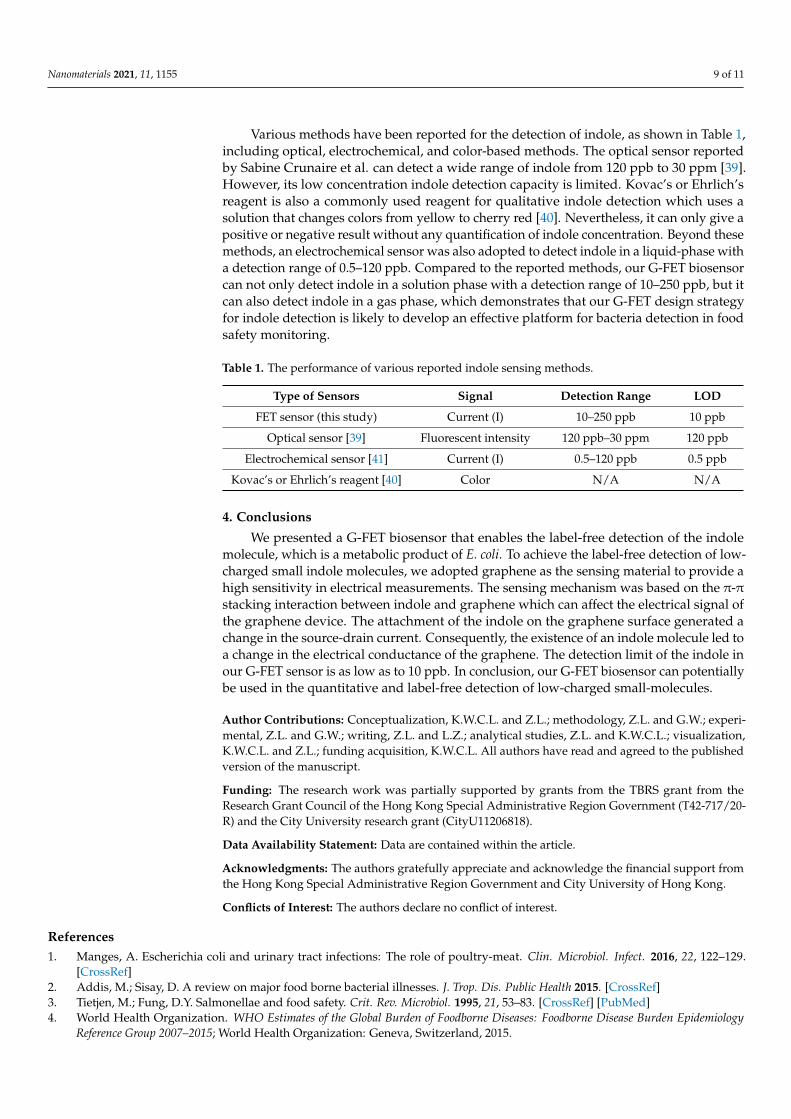
Various methods have been reported for the detection of indole, as shown in Table 1,including optical, electrochemical, and color-based methods. The optical sensor reportedby Sabine Crunaire et al. can detect a wide range of indole from 120 ppb to 30 ppm [39].However, its low concentration indole detection capacity is limited. Kovac’s or Ehrlich’sreagent is also a commonly used reagent for qualitative indole detection which uses asolution that changes colors from yellow to cherry red [40]. Nevertheless, it can only give apositive or negative result without any quantification of indole concentration. Beyond thesemethods, an electrochemical sensor was also adopted to detect indole in a liquid-phase witha detection range of 0.5–120 ppb. Compared to the reported methods, our G-FET biosensorcan not only detect indole in a solution phase with a detection range of 10–250 ppb, but itcan also detect indole in a gas phase, which demonstrates that our G-FET design strategyfor indole detection is likely to develop an effective platform for bacteria detection in foodsafety monitoring.
Table 1. The performance of various reported indole sensing methods.
Type of Sensors Signal Detection Range LOD
FET sensor (this study) Current (I) 10–250 ppb 10 ppb
Optical sensor [39] Fluorescent intensity 120 ppb–30 ppm 120 ppb
Electrochemical sensor [41] Current (I) 0.5–120 ppb 0.5 ppb
Kovac’s or Ehrlich’s reagent [40] Color N/A N/A
4. Conclusions
We presented a G-FET biosensor that enables the label-free detection of the indolemolecule, which is a metabolic product of E. coli. To achieve the label-free detection of low-charged small indole molecules, we adopted graphene as the sensing material to provide ahigh sensitivity in electrical measurements. The sensing mechanism was based on the π-πstacking interaction between indole and graphene which can affect the electrical signal ofthe graphene device. The attachment of the indole on the graphene surface generated achange in the source-drain current. Consequently, the existence of an indole molecule led toa change in the electrical conductance of the graphene. The detection limit of the indole inour G-FET sensor is as low as to 10 ppb. In conclusion, our G-FET biosensor can potentiallybe used in the quantitative and label-free detection of low-charged small-molecules.
Author Contributions: Conceptualization, K.W.C.L. and Z.L.; methodology, Z.L. and G.W.; experi-mental, Z.L. and G.W.; writing, Z.L. and L.Z.; analytical studies, Z.L. and K.W.C.L.; visualization,K.W.C.L. and Z.L.; funding acquisition, K.W.C.L. All authors have read and agreed to the publishedversion of the manuscript.
Funding: The research work was partially supported by grants from the TBRS grant from theResearch Grant Council of the Hong Kong Special Administrative Region Government (T42-717/20-R) and the City University research grant (CityU11206818).
Data Availability Statement: Data are contained within the article.
Acknowledgments: The authors gratefully appreciate and acknowledge the financial support fromthe Hong Kong Special Administrative Region Government and City University of Hong Kong.
Conflicts of Interest: The authors declare no conflict of interest.
References1. Manges, A. Escherichia coli and urinary tract infections: The role of poultry-meat. Clin. Microbiol. Infect. 2016, 22, 122–129.
[CrossRef]2. Addis, M.; Sisay, D. A review on major food borne bacterial illnesses. J. Trop. Dis. Public Health 2015. [CrossRef]3. Tietjen, M.; Fung, D.Y. Salmonellae and food safety. Crit. Rev. Microbiol. 1995, 21, 53–83. [CrossRef] [PubMed]4. World Health Organization. WHO Estimates of the Global Burden of Foodborne Diseases: Foodborne Disease Burden Epidemiology
Reference Group 2007–2015; World Health Organization: Geneva, Switzerland, 2015.

Nanomaterials 2021, 11, 1155 10 of 11
5. Yang, L.; Bashir, R. Electrical/electrochemical impedance for rapid detection of foodborne pathogenic bacteria. Biotechnol. Adv.2008, 26, 135–150. [CrossRef] [PubMed]
6. Mandal, P.; Biswas, A.; Choi, K.; Pal, U. Methods for rapid detection of foodborne pathogens: An overview. Am. J. Food Technol.2011, 6, 87–102. [CrossRef]
7. Swaminathan, B.; Feng, P. Rapid detection of food-borne pathogenic bacteria. Annu. Rev. Microbiol. 1994, 48, 401–426. [CrossRef]8. Law, J.W.-F.; Ab Mutalib, N.-S.; Chan, K.-G.; Lee, L.-H. Rapid methods for the detection of foodborne bacterial pathogens:
Principles, applications, advantages and limitations. Front. Microbiol. 2015, 5, 770. [CrossRef]9. Gracias, K.S.; McKillip, J.L. A review of conventional detection and enumeration methods for pathogenic bacteria in food. Can. J.
Microbiol. 2004, 50, 883–890. [CrossRef] [PubMed]10. Jenkins, D.M.; Kubota, R.; Dong, J.; Li, Y.; Higashiguchi, D. Handheld device for real-time, quantitative, LAMP-based detection of
Salmonella enterica using assimilating probes. Biosens. Bioelectron. 2011, 30, 255–260. [CrossRef] [PubMed]11. You, Y.; Lim, S.; Hahn, J.; Choi, Y.J.; Gunasekaran, S. Bifunctional linker-based immunosensing for rapid and visible detection of
bacteria in real matrices. Biosens. Bioelectron. 2018, 100, 389–395. [CrossRef] [PubMed]12. Lazcka, O.; Del Campo, F.J.; Munoz, F.X. Pathogen detection: A perspective of traditional methods and biosensors. Biosens.
Bioelectron. 2007, 22, 1205–1217. [CrossRef]13. Sethi, S.; Nanda, R.; Chakraborty, T. Clinical application of volatile organic compound analysis for detecting infectious diseases.
Clin. Microbiol. Rev. 2013, 26, 462–475. [CrossRef] [PubMed]14. Bayn, A.; Nol, P.; Tisch, U.; Rhyan, J.; Ellis, C.K.; Haick, H. Detection of volatile organic compounds in brucella abortus-seropositive
Bison. Anal. Chem. 2013, 85, 11146–11152. [CrossRef] [PubMed]15. Lough, F.; Perry, J.D.; Stanforth, S.P.; Dean, J.R. Detection of exogenous VOCs as a novel inávitro diagnostic technique for the
detection of pathogenic bacteria. Trac Trends Anal. Chem. 2017, 87, 71–81. [CrossRef]16. Bos, L.D.; Sterk, P.J.; Schultz, M.J. Volatile metabolites of pathogens: A systematic review. Plos Pathog. 2013, 9, e1003311. [CrossRef]17. Schnürer, J.; Olsson, J.; Börjesson, T. Fungal volatiles as indicators of food and feeds spoilage. Fungal Genet. Biol. 1999, 27, 209–217.
[CrossRef] [PubMed]18. Ellis, D.I.; Goodacre, R. Rapid and quantitative detection of the microbial spoilage of muscle foods: Current status and future
trends. Trends Food Sci. Technol. 2001, 12, 414–424. [CrossRef]19. Barth, M.; Hankinson, T.R.; Zhuang, H.; Breidt, F. Microbiological Spoilage of Fruits and Vegetables. In Compendium of the
Microbiological Spoilage of Foods and Beverages; Springer: Berlin/Heidelberg, Germany, 2009; pp. 135–183.20. Tait, E.; Perry, J.D.; Stanforth, S.P.; Dean, J.R. Bacteria detection based on the evolution of enzyme-generated volatile organic
compounds: Determination of Listeria monocytogenes in milk samples. Anal. Chim. Acta 2014, 848, 80–87. [CrossRef]21. Senecal, A.G.; Magnone, J.; Yeomans, W.; Powers, E.M. In Rapid Detection of Pathogenic Bacteria by Volatile Organic Compound (VOC)
Analysis; Chemical and Biological Early Warning Monitoring for Water, Food, and Ground, International Society for Optics andPhotonics: Boston, MA, USA, 2002; pp. 121–132.
22. Zhu, J.; Bean, H.D.; Kuo, Y.-M.; Hill, J.E. Fast detection of volatile organic compounds from bacterial cultures by secondaryelectrospray ionization-mass spectrometry. J. Clin. Microbiol. 2010, 48, 4426–4431. [CrossRef]
23. Dolai, S.; Bhunia, S.K.; Beglaryan, S.S.; Kolusheva, S.; Zeiri, L.; Jelinek, R. Colorimetric Polydiacetylene–Aerogel Detector forVolatile Organic Compounds (VOCs). ACS Appl. Mater. Interfaces 2017, 9, 2891–2898. [CrossRef]
24. Eda, G.; Chhowalla, M. Chemically derived graphene oxide: Towards large-area thin-film electronics and optoelectronics. Adv.Mater. 2010, 22, 2392–2415. [CrossRef]
25. Das Sarma, S.; Adam, S.; Hwang, E.H.; Rossi, E. Electronic transport in two-dimensional graphene. Rev. Mod. Phys. 2011, 83,407–470. [CrossRef]
26. Neto, A.C.; Guinea, F.; Peres, N.M.; Novoselov, K.S.; Geim, A.K. The electronic properties of graphene. Rev. Mod. Phys. 2009, 81,109. [CrossRef]
27. Warner, J.H.; Schäffel, F.; Bachmatiuk, A.; Rümmeli, M.H. Graphene; Elecvier: Oxford, UK, 2013; pp. 61–127.28. Avouris, P. Graphene: Electronic and photonic properties and devices. Nano Lett. 2010, 10, 4285–4294. [CrossRef] [PubMed]29. Schwierz, F. Graphene transistors. Nat Nanotechnol 2010, 5, 487–496. [CrossRef] [PubMed]30. Lin, Z.; Wu, G.; Zhao, L.; Lai, K.W.C. Carbon nanomaterial-based biosensors: A review of design and applications. IEEE
Nanotechnol. Mag. 2019, 13, 4–14. [CrossRef]31. Huang, Y.; Dong, X.; Liu, Y.; Li, L.-J.; Chen, P. Graphene-based biosensors for detection of bacteria and their metabolic activities. J.
Mater. Chem. 2011, 21, 12358–12362. [CrossRef]32. Mao, H.Y.; Lu, Y.H.; Lin, J.D.; Zhong, S.; Wee, A.T.S.; Chen, W. Manipulating the electronic and chemical properties of graphene
via molecular functionalization. Prog. Surf. Sci. 2013, 88, 132–159. [CrossRef]33. Lin, Y.-M.; Dimitrakopoulos, C.; Jenkins, K.A.; Farmer, D.B.; Chiu, H.-Y.; Grill, A.; Avouris, P. 100-GHz transistors from wafer-scale
epitaxial graphene. Science 2010, 327, 662. [CrossRef]34. Meric, I.; Han, M.Y.; Young, A.F.; Ozyilmaz, B.; Kim, P.; Shepard, K.L. Current saturation in zero-bandgap, top-gated graphene
field-effect transistors. Nat. Nanotechnol. 2008, 3, 654–659. [CrossRef]35. Dankerl, M.; Hauf, M.V.; Lippert, A.; Hess, L.H.; Birner, S.; Sharp, I.D.; Mahmood, A.; Mallet, P.; Veuillen, J.Y.; Stutzmann,
M. Graphene Solution-Gated Field-Effect Transistor Array for Sensing Applications. Adv. Funct. Mater. 2010, 20, 3117–3124.[CrossRef]

Nanomaterials 2021, 11, 1155 11 of 11
36. Ghoneim, M.T.; Smith, C.E.; Hussain, M.M. Simplistic graphene transfer process and its impact on contact resistance. Appl. Phys.Lett. 2013, 102, 183115. [CrossRef]
37. Wu, J.B.; Lin, M.L.; Cong, X.; Liu, H.N.; Tan, P.H. Raman spectroscopy of graphene-based materials and its applications in relateddevices. Chem. Soc. Rev. 2018, 47, 1822–1873. [CrossRef] [PubMed]
38. Björk, J.; Hanke, F.; Palma, C.-A.; Samori, P.; Cecchini, M.; Persson, M. Adsorption of aromatic and anti-aromatic systems ongraphene through π− π stacking. J. Phys. Chem. Lett. 2010, 1, 3407–3412. [CrossRef]
39. Crunaire, S.; Marcoux, P.R.; Ngo, K.-Q.; Moy, J.-P.; Mallard, F.; Tran-Thi, T.-H. Discriminating bacteria with optical sensors basedon functionalized nanoporous xerogels. Chemosensors 2014, 2, 171–181. [CrossRef]
40. Miller, J.M.; Wright, J.W. Spot indole test: Evaluation of four reagents. J. Clin. Microbiol. 1982, 15, 589–592. [CrossRef]41. Zhou, Y.; Ding, M.; Lyu, W.; Zhen, Q.; Chen, H.; Jiang, M.; Ding, Y.; Zhang, X. A sensitive electrochemical method for indole based
on the signal amplification strategy by gold/iron-oxide composite nanoparticles. Anal. Chim. Acta 2021, 1142, 56–64. [CrossRef][PubMed]