detection of melatonin-onset in real settings via wearable
TRANSCRIPT

Biomedical Signal Processing and Control 65 (2021) 102386
Available online 21 December 20201746-8094/© 2020 The Authors. Published by Elsevier Ltd. This is an open access article under the CC BY-NC-ND license(http://creativecommons.org/licenses/by-nc-nd/4.0/).
Detection of melatonin-onset in real settings via wearable sensors and artificial intelligence. A pilot study
R. Castaldo a,b, M.J. Chappell a, H. Byrne c, P.F. Innominato d,e,f, S. Hughes g, A. Pescape h, L. Pecchia a,* a School of Engineering, University of Warwick, Coventry, CV4 7AL, UK b IRCCS SDN, Naples, 80143, Italy c Mathematical Institute, University of Oxford, Oxford, OX1 3LB, UK d Warwick Medical School, University of Warwick, Coventry, CV4 7AL, UK e Unit 935, French National Institute for Health and Medical Research (INSERM), Villejuif, 94800, France f North Wales Cancer Centre, Ysbyty Gwynedd, Betsi Cadwaladr University Health Board, Bangor, LL57 2PW, UK g North Wales Clinical Research Centre, Wrexham, LL13 7YP, UK h Ingegneria Elettrica e delle Tecnologie dell’Informazione, University of Napoli Federico II, Napoli, 80125, Italy
A R T I C L E I N F O
Keywords: Circadian cycle Wearable sensors Heart rate variability Deep learning
A B S T R A C T
Circadian rhythms modulate physiological and behavioral processes of approximately 24-h periodicity. Alter-ations in the circadian timing system may lead to cardiovascular, metabolic or neurological diseases, cancers and sleep disorders, as well as to disruption of quality of life. Circadian rhythms can be tracked via laboratory tests measuring hormones in salivary, urinary or blood samples, which are collected in controlled environments. These tests are unsuitable for continuous monitoring in real-life, being expensive and time consuming, producing discrete information (i.e., few values per day) and requiring controlled environmental conditions (e.g., exposure to light can alter the samples). Thus, there is a need to develop non-invasive methods and tools to track circadian rhythms in real-life conditions.
In this study, 10 healthy participants wore commercial medical-rated (i.e., CE-marked) wearable sensors, which continuously measured ECG, skin body temperature and physical activity for two consecutive days. Up to 10 salivary samples per day were taken and sent to a laboratory for measuring melatonin, which was used as proxy for circadian rhythm tracking.
The results presented in this paper demonstrated that Heart Rate Variability (HRV) measures, physical activity and skin temperature changed significantly after the onset of melatonin. The deep-learning model presented in this study detected the onset of melatonin with 71 % accuracy, 67 % sensitivity, 75 % specificity and 77 % area under the curve (AUC).
The current study concluded that deep learning could be used to track melatonin-onset in real-life, using physiological and behavioral measures monitored via wearable and easy-to-use sensors.
1. Introduction
Our inner clock, also known as the biological clock, changes our physiology to the different stages of the day, it regulates our behavior, hormone levels, sleep, body temperature and metabolism [1]. While rhythms with a period of approximately 24 h (i.e., circadian) have been known since decades, the clinical relevance of circadian rhythms has emerged more recently [2]. Disruptions in circadian clock may have serious consequences for our health and mental well-being [3]. For
example, people, who suffer from chronic chronotype misalignment (e. g., shift worker), are more likely to experience cancer, obesity, type 2 diabetes and coronary heart disease [4,5]. A recent study has also shown that youngers with disruption in circadian cycles are more at the risk of developing drug and alcohol abuse [6,7], cognitive impairments and learning deficits [8]. Several studies have proved that patients with significant alterations in circadian cycles are less likely to respond to cancer treatments [9–11].
The impact of circadian misalignments on our well-being has shifted
* Corresponding author at: University of Warwick, School of Engineering, Coventry, CV4 7AL, UK. E-mail address: [email protected] (L. Pecchia).
Contents lists available at ScienceDirect
Biomedical Signal Processing and Control
journal homepage: www.elsevier.com/locate/bspc
https://doi.org/10.1016/j.bspc.2020.102386 Received 6 May 2020; Received in revised form 19 November 2020; Accepted 6 December 2020

Biomedical Signal Processing and Control 65 (2021) 102386
2
the attention on investigating new approaches to monitor the state of a person’s circadian rhythm in real-time. The development of multisen-sory wearable devices and artificial intelligence techniques offers un-precedented opportunities to precisely monitor sleep and circadian disruption. This would allow to accurately diagnose and precisely treat several pathologies associated with altered circadian function, paving the way to personalized medicine.
In the human body, several hormones can be used as circadian bio-markers. In particular, melatonin and cortisol are the most studied. The cyclic rise and fall of cortisol and melatonin have been used as markers of the circadian function [12]. Cortisol secretion follows a distinct circadian rhythm, with low circulating levels at sleep onset, beginning to increase during the last part of the night, then peaking within 1 h from waking, and finally, declining through the day [13]. Melatonin is pro-duced by the pineal gland during the hours of darkness and it is low during day-light hours [14]. Specifically, melatonin patterns is often preferred as a circadian marker of internal phase because they are more robust to external influences than cortisol [15]. Indeed, food intake and activity do not appear to influence the melatonin rhythm, whereas they have significant effects on cortisol. By measuring the Melatonin Onset (MO), a clearly demarcated event, internal circadian phase position can accurately be determined [16]. In particular, the most accurate, minimally-invasive, and reliable measure in laboratory setting is the Dim Light Melatonin Onset (DLMO) for the assessment of the internal phase [17]. DLMO is usually defined as the time during which salivary melatonin reaches 4 pg/mL (or when blood melatonin reaches 10 pg/mL) under controlled light conditions (<20 lx) for at least 2 h. Ac-cording to the literature, one of the most accurate methods to measure the DLMO is the so called “3k” threshold [18]. DLMO is considered as the best clinically useful characteristic of the 24 h melatonin rhythm and a useful parameter to identify circadian rhythm disorders [19]. How-ever, DLMO is measured, by definition, under controlled light condi-tions, resulting rather incompatible for real-life monitoring.
Melatonin is measured using laboratory tests of salivary, blood or urinary samples taken at regular intervals (e.g., every two hours in the morning, every hour in the afternoon) [20]. Although laboratory tests are very reliable and valid in measuring melatonin and cortisol and estimate circadian disruptions, they carry the high burden of taking regular samples and performing chromatography and/or mass spec-trometry analysis which make them less appropriate as a scalable in-strument [21]. Nonetheless, initial evidence is appearing promising for salivary melatonin sampling at home [22].
Other methods to assess circadian cycles are based on self-report survey or diary instruments, which are more appropriate approaches to capture sleep-wake cycles in wide populations, and therefore, indi-rectly estimating the underlying phase of the circadian rhythms [23]. However, self-reported surveys are not as well-suited for individual monitoring as sensor-based continuous monitoring over longitudinal periods, since they are subjected to the bias of self-reporting and repeated subjective measures.
Several studies have attempted to track circadian rhythms using non- invasive physiological signals such as body temperature [24–27], ac-tivity [28–30] and Heart Rate Variability (HRV) [31–33] via wearable sensors. A number of studies found that core body temperature dis-played a robust and precise circadian rhythm [34]. However, current techniques for measuring core body temperature are highly intrusive. Other studies [24–26] used less invasive techniques, but they reported that skin body temperature was “masked” by a number of variables, including sleep, posture, and activity levels [35]. Similarly, HRV mod-ulation is affected by several factors including posture, physical activity, mental stress or emotion [36]. Therefore, more than a single physio-logical signal is required to precisely determine the circadian phase. Thus, several studies [30,31,37–42] have attempted multidimensional circadian monitoring via wearable sensors. Most of those studies measured dim light melatonin onset (DLMO), skin body temperature, motor activity and light exposure in laboratory studies.
Although laboratory studies have a high-level control of the settings, they lack the fundamental exposures to the real-life environment.
In a previous study [43], preliminary analysis showed promising results in real-file settings to automatically detect high or low cortisol levels via HRV analysis and temperature data. These results provided encouragement that wearable devices may certainly be valuable to monitor circadian rhythm in real-time.
Here, we used a combination of synchronous monitoring of Heart Rate, tri-axial activity and posture, as well as proximal and distal limb skin temperature, with modern deep learning method, Recurrent Neural Networks (RNN), in order to estimate precisely, dynamically and non- invasively the internal circadian phase (melatonin onset) in free-living conditions. If successful, this approach could allow the estimation of the internal circadian phase over consecutive 24 -h spans from passive biosensor continuous monitoring, thus avoiding repeated biological sampling.
Since we wanted to investigate circadian cycles in real-life environ-ment, melatonin onset was measured in real-life settings and partici-pants were exposed to natural levels of light in line with their normal life habits. Several other studies have also shown that measuring melatonin onset in real-life condition can help estimating the effect of night shifts in circadian cycles [44–47].
2. Methods
2.1. Participants
A group of ten healthy volunteers with no medical history of circa-dian sleep alteration was recruited in the study. During a baseline assessment and briefing session, participant’s information was gathered. Age, height, weight, general health status and use of relevant medica-tions to the study were recorded. The participants did not report a his-tory of pathological conditions or consumption of any medication throughout the course of the study, which could alter the acquired physiological signals and circadian cycles. For female participants in fertile age, the phase of menstrual cycle was also recorded. All partici-pants had a healthy BMI (between 19.2–23.9).
Participants were asked to complete the Pittsburgh Sleep Quality Index (PSQI) questionnaire [48]. The PSQI questionnaire is designed in nineteen self-rated questions related to sleep quality, sleep latency, sleep duration, sleep efficiency, and sleep disturbances, use of sleeping medication and daytime dysfunction. It provides a global score to con-trol sleep-disturbance. None of the participants reported any sleep-disturbance.
Participants were also asked to complete a daily sleep diary [49], designed to gather information about their daily sleep pattern, as well as a daily food and activity diary. The latter was given to the participants to record activity, food, caffeine and alcohol intake through the day as circadian rhythms and metabolism are intimately linked [50–52].
Ethical approval for this study was granted by the Biomedical and Scientific Research Ethics Committee of the University of Warwick (ref. REGO-2018− 2205). The study assured anonymity and no side effects or possible disadvantages for the participants. All participants were care-fully instructed and signed an informed consent form prior to the ex-periments. A fixed fee was given to the participants. All methods were performed in accordance with the ethical approval and in the respect of all the relevant guidelines and regulations.
2.2. Study protocol
A schematic outline of the study protocol is shown in Fig. 1. During the briefing session, the participants were instructed about the study protocol and they filled in a general questionnaire on demographic and health history and the PSQI survey. After baseline assessment, partici-pants underwent continuous monitoring for two consecutive days. The participants were asked to wear wearable sensors from the night before
R. Castaldo et al.

Biomedical Signal Processing and Control 65 (2021) 102386
3
the start of the experiments (Day 1) and remove them the night after the second day (Day 2).
2.3. Wearable sensors
The participants’ physiological monitoring was performed using the Zephyr BioHarness™ 3.0 (Medtronic, Inc., Annapolis, MD, USA). and 4 iButton® sensors (Maxim/Dallas Semiconductor Corp., USA) as shown in Fig. 2. They were instructed to remove the sensors only in case of bathing, showering, or swimming and to wear them as soon as possible. The BioHarness™ was worn on the chest, below the sternal notch using 2 disposable gel electrodes. The Zephyr is a wireless patch device that measures tri-axial trunk acceleration (sampling frequency of 100 Hz) and one-lead electrocardiogram (ECG) signals (sampling frequency of 250 Hz). The resolution of this device is of 12 bits per sample. The Zephyr also provides information, based on internal algorithms, of user’s activity levels, and posture based on the tri-axial trunk accelera-tion signals. This Zephyr BioHarness™ has been widely used in scientific
studies proving to be a valid and reliable device to monitor heart rate, acceleration and posture during low and moderate physical activity levels [53,54].
Four iButtons® were positioned using medical tape on the right and left infraclavicular areas (proxy for proximal skin temperature [24]) and left and right of medial metatarsal area (proxy of distal skin temperature [24]). The body temperature was estimated as average of the values measured at the medial metatarsal area (aka, distal temperature) and at the infraclavicular areas (aka, proximal temperature) each 10 min. The Thermochron iButton® (DS1921 H) has been used extensively with human to measure temperature data and also used as a circadian marker [24,55,56]. It can measure temperatures from +15 to +46 ◦C with an accuracy of ±1 ◦C at a 0.125 ◦C resolution [24,55].
2.4. Salivary samples
The participants were asked to continually wear the sensors and to collect saliva for melatonin assessment. Melatonin is considered a benchmark for internal circadian phase in this study. Participants were asked to collect up to 10 samples per day according to the following protocol: one sample on waking; as soon as they woke up in the morning and were able to provide a sample; 3 h after giving the first sample; at 4 pm; at 6 pm; at 7 pm; at 8 pm; at 9 pm; and every hour before going to sleep. Participants were asked to gently chew a cotton swab of Salivettes for 60 s. Immediately after collection, all specimens were stored in a freezer.
Subjects were instructed to avoid foods with high sugar or acidity, or high caffeine beverages before collecting a salivary sample; they were also invited to not eat a major meal 30 min before the sample collection. Before each saliva collection, the subjects had to rinse their mouth with water to remove food residue and waiting at least 10 min after rinsing to avoid sample dilution. They were instructed not to brush their teeth before collecting sample; and to abstain from eating and drinking for 5 min prior to sample collection.
Saliva collection was performed with the Salivette ® (Sarstedt, Leicester, UK) collection kit. An amount of 1-mL of saliva sample was pipetted onto a Salivette® cotton swab and then into clear sterile plastic tubes [57,58].
A competitive immunoassay based on capture antibody technique was used to analyze the melatonin levels and were performed in duplicate employing commercially available kits (Bühlmann Labora-tories AG). Intra-assay precision (within-run) was 12.6 %. The intra- assay precision was calculated from the results of four different saliva samples within the standard range, measured 10 times in duplicate in a single run. Inter-assay precision (run-to-run) was 22.9 %. The inter- assay precision was calculated from the results of 17 independent runs with 5 samples within the standard range. The detection limit of the assay was 0.5 pg/m [59].
Fig. 1. Study protocol. Circadian monitoring was performed using a wearable device that records activity and ECG signals and 4 body wearable temperature sensors. Circadian assessment was performed using physiological monitoring (activity, posture, skin temperature, ECG) via wearable sensors and melatonin hormone levels via saliva collection.
Fig. 2. Experiment sensors’ setup. The BioHarnessTM was worn on the chest, below the sternal notch using 2 disposable gel electrodes. Four iButtons® were positioned using medical tape on the right and left infraclavicular areas (proxy for proximal skin temperature) and left and right of medial metatarsal area (proxy of distal skin temperature).
R. Castaldo et al.

Biomedical Signal Processing and Control 65 (2021) 102386
4
2.5. Diaries
During the study, subjects were instructed to complete the Consensus Sleep Diary [49] every morning immediately after leaving their bed.
They were also asked to complete a food and activity diary to record what they ate and any activity they undertook during the day. They had to report what kind of activity they performed, for how long and the estimated intensity. They were also asked to record any food, snack or drink they consumed during the day, recording the portion size in household measures (e.g., slices of bread, tablespoons of pasta, mugs of milk, cup of coffee) as well as the type of food and cooking method (e.g., grilled, fried, boiled).
Participants were invited to maintain their regular sleep schedule and habits as closely as possible (i.e., no intervention was applied) and not to limit their activities or to change their behavior in any way during the monitoring time.
2.6. Data processing
Data collected via the sleep diary, BioHarness™, iButtons® and saliva were processed as reported in the next sections in order to compute a set of measures (see Supplementary Table 1).
2.6.1. Sleep diary and PSQI measures Following [53], five sleep measures were obtained from the sleep
diary as reported in Supplementary Table 1. The Pittsburgh Sleep Quality Index (PSQI) is an efficient self-report
questionnaire measuring sleep quality and patterns. The PSQI gives an estimate of sleep quality (“poor” or “good” sleep) based on seven specific indicators, as reported in [48]. The participants self-rated the indicators using the Likert Scale [60]. A global sum, across all the measures, of “5” or greater indicates a “poor” sleeper and vice versa.
2.6.2. Heart rate variability measures Heart rate interbeat intervals (RR) were extracted from ECG re-
cordings using an automatic QRS detector, available in the Kubios toolkit [61], based on the Pan–Tompkins algorithm [62]. The automatic detection of QRS was supported by visual inspection and manual correction. A quality check was carried out using the NN/RR ratio as explained in [63]. The RR interval time series were segmented into 5-min consecutive windows with no overlapping. The HRV analysis was performed on 5-min excepts using Kubios software [64]. Spectral anal-ysis was performed by a non-parametric based on Welch’s periodogram, which has the advantage of low computational cost. A total of 23 HRV features were extracted and examined (see Supplementary Table 1).
2.6.3. Activity level Activity level signals are reported with a frequency of one sample per
second. They were decimated to one sample per 5 min by lowpass filter. The lowpass filter used was the Chebyshev Type I filter with a cutoff frequency of 0.8/decimation factor, and a passband ripple of 0.05 dB. Data processing was performed using in-house written scripts in Mat-lab2019a (The Mathworks, Inc., Natick, MA, USA).
2.6.4. Temperature measures Distal and proximal skin temperatures were measured every 10 min.
Distal skin temperature was estimated as the mean of all measurements collected from two ankle temperature sensors. Proximal skin tempera-ture was estimated as the mean of all measurements from the two clavicle temperature sensors. Distal and Proximal temperature were linear interpolated and then resampled every 5 min. The margin of the interpolation error was insignificant.
2.6.5. Salivary melatonin Melatonin values were linearly interpolated for each subject between
one hour before the first sample and one hour after the last sample of the
day. Melatonin profiles were then resampled every 5 min, i.e., one sample for every 5-min window.
In this study, melatonin onset (MO) was calculated and used as a proxy to determine internal circadian phase. MO was calculated using the “3k” threshold [18] in real-life light conditions.
Melatonin profiles were excluded if the profiles were of such irreg-ular pattern that MO could not be reliably determined; if two or more saliva samples were missing and if melatonin profiles did not have the six low daytime points required for the calculation of the 3k method.
Once the MO was identified, all extracted physiological and behav-ioral measures were classified into two classes: before and after MO.
2.7. Dataset preparation
HRV measures, activity level, distal and proximal temperature and melatonin levels were synchronized taking as reference the HRV segment windows. An example of raw data time-based plots for skin temperature, posture, activity, HR and melatonin levels is presented in Supplementary Fig. 1.
For each participant, measures were extracted every 5-min for Day 1 and Day2, using data from one hour before the first saliva sample was taken and continuing until one hour after the last saliva sample was collected. The dataset had fewer than 20 % segments with missing data, due to sensor removals or motion artifacts. Excerpts with missing data were excluded. Moreover, melatonin profiles that showed irregular patterns or missing values, suggesting that the samples were contami-nated or alternated [18,22], were excluded.
The complete dataset comprises HRV measures, activity level, distal and proximal temperature measures, and melatonin levels acquired from 10 participants that wore the wearable sensors and collected saliva for two consecutive days.
Accordingly (eq. 1), the dataset contained entries taken every 5 min:
dataset ={
HRVi, PhysicalActivityi,BodyTemperaturei, Ci
}(1)
Where HRVi is the vector of the 23 HRV measures computed over 5-min excerpts of ECG data; PhysicalActivityi is the averages of the physical activity over the same 5 min interval; and BodyTemperaturei is the body temperature in the same 5 min interval, obtained as linear interpolation of the skin body temperature measured every 10 min; Ci is the binary variable accounting for the “class” of the entry in terms of melatonin value in the 5 min segment (i.e., C = 0 before MO; C = 1 after the MO). In fact, all 5-min segments from one hour before the first saliva sample was taken until the identified MO, were classified as ‘before’ MO; whereas all the 5-min segments after the identified MO were classified as ‘after’ MO. The 5-min segments identified as MO were not classified and were excluded from the following analysis. Therefore, each 5 min segment “i” (i.e., dataset entry) was labelled with a binary value of 0 or 1 (“class”) according to its timestamp (i.e., before or after the identified MO). In total, 2068 segments, of which 318 segments included in the class 1 (i.e., after the identified MO), were investigated from a total of 10 subjects over 2 days.
2.8. Statistical analysis
For all the participants, the median (MD), standard deviation (SD), 25th and 75th percentiles (i.e., Q1 and Q3 respectively) of each feature were calculated to describe their distribution before and after MO.
Shapiro–Wilk test was used to determine the normality of features [65]. In order to identify measures significantly changing at MO, non-parametric test such as Wilcoxon signed-rank test was used since most of the features (>90 %) were non-normally distributed. A p-value less than 0.05 was considered significant. Holm’s correction was used due to repeated measures.
Any increase or decrease in the median of one of the extracted measures before and after MO was reported, using the following
R. Castaldo et al.
Biomedical Signal Processing and Control 65 (2021) 102386
5
convention [63,66]:
• Two arrows, ↓↓ (or ↑↑) were used to report a significant (p-value<0.05) decrease (or increase) of measure after MO;
• One arrow, ↓ (or ↑) was used to report a non-significant (p-value >0.05) decrease (or increase) of measure after MO.
Variations in sleep measures between Day 1 and Day 2 were inves-tigated in order to understand whether the participants experienced sleep-wake disruption during the study.
Variation in HRV, activity and temperature measures before and after MO were investigated via Wilcoxon signed-rank test over two days.
2.9. Deep learning
Recurrent neural networks (RNN) was chosen as deep learning method in this study. RNNs are often used for time-series classification [67]. RNNs have a great advantage compared to other methods, they greatly reduce the total number of parameters that need to be learnt as they allocate the same model parameters across all time steps. Specif-ically, we adopted a Long Short-Term Memory (LSTM) [68]. The aim of this work is to investigate whether LSTM-based networks can detect the MO.
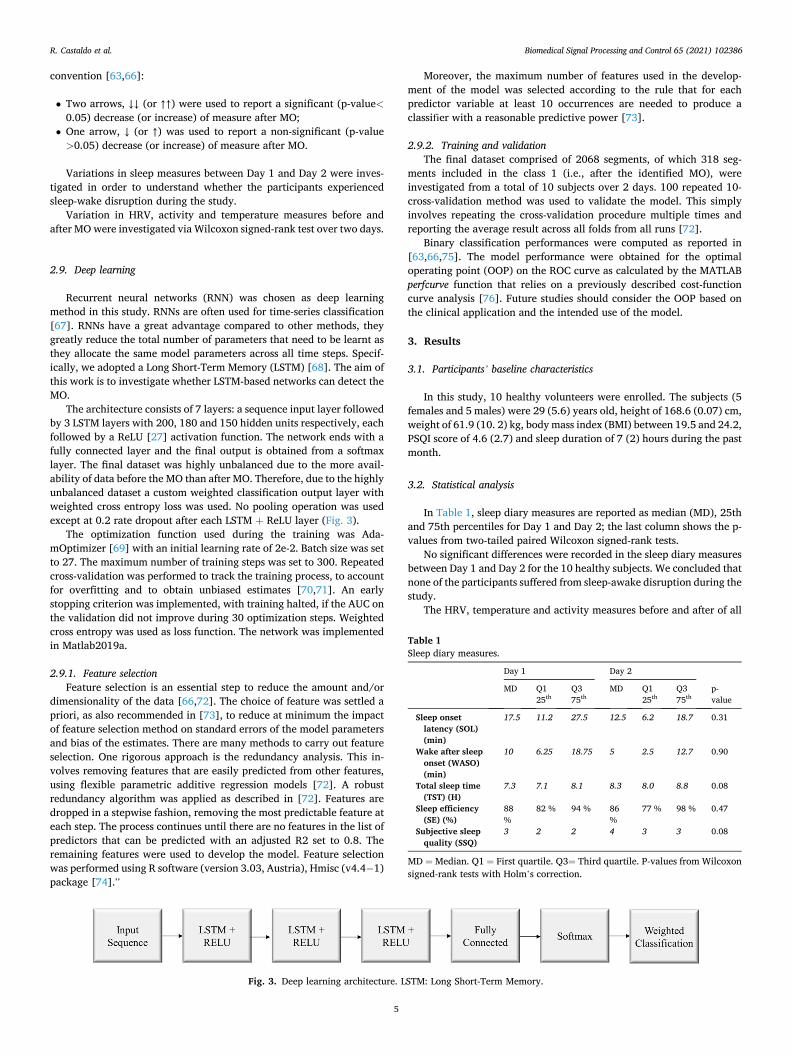
The architecture consists of 7 layers: a sequence input layer followed by 3 LSTM layers with 200, 180 and 150 hidden units respectively, each followed by a ReLU [27] activation function. The network ends with a fully connected layer and the final output is obtained from a softmax layer. The final dataset was highly unbalanced due to the more avail-ability of data before the MO than after MO. Therefore, due to the highly unbalanced dataset a custom weighted classification output layer with weighted cross entropy loss was used. No pooling operation was used except at 0.2 rate dropout after each LSTM + ReLU layer (Fig. 3).
The optimization function used during the training was Ada-mOptimizer [69] with an initial learning rate of 2e-2. Batch size was set to 27. The maximum number of training steps was set to 300. Repeated cross-validation was performed to track the training process, to account for overfitting and to obtain unbiased estimates [70,71]. An early stopping criterion was implemented, with training halted, if the AUC on the validation did not improve during 30 optimization steps. Weighted cross entropy was used as loss function. The network was implemented in Matlab2019a.
2.9.1. Feature selection Feature selection is an essential step to reduce the amount and/or
dimensionality of the data [66,72]. The choice of feature was settled a priori, as also recommended in [73], to reduce at minimum the impact of feature selection method on standard errors of the model parameters and bias of the estimates. There are many methods to carry out feature selection. One rigorous approach is the redundancy analysis. This in-volves removing features that are easily predicted from other features, using flexible parametric additive regression models [72]. A robust redundancy algorithm was applied as described in [72]. Features are dropped in a stepwise fashion, removing the most predictable feature at each step. The process continues until there are no features in the list of predictors that can be predicted with an adjusted R2 set to 0.8. The remaining features were used to develop the model. Feature selection was performed using R software (version 3.03, Austria), Hmisc (v4.4− 1) package [74].”
Moreover, the maximum number of features used in the develop-ment of the model was selected according to the rule that for each predictor variable at least 10 occurrences are needed to produce a classifier with a reasonable predictive power [73].
2.9.2. Training and validation The final dataset comprised of 2068 segments, of which 318 seg-
ments included in the class 1 (i.e., after the identified MO), were investigated from a total of 10 subjects over 2 days. 100 repeated 10- cross-validation method was used to validate the model. This simply involves repeating the cross-validation procedure multiple times and reporting the average result across all folds from all runs [72].
Binary classification performances were computed as reported in [63,66,75]. The model performance were obtained for the optimal operating point (OOP) on the ROC curve as calculated by the MATLAB perfcurve function that relies on a previously described cost-function curve analysis [76]. Future studies should consider the OOP based on the clinical application and the intended use of the model.
3. Results
3.1. Participants’ baseline characteristics
In this study, 10 healthy volunteers were enrolled. The subjects (5 females and 5 males) were 29 (5.6) years old, height of 168.6 (0.07) cm, weight of 61.9 (10. 2) kg, body mass index (BMI) between 19.5 and 24.2, PSQI score of 4.6 (2.7) and sleep duration of 7 (2) hours during the past month.
3.2. Statistical analysis
In Table 1, sleep diary measures are reported as median (MD), 25th and 75th percentiles for Day 1 and Day 2; the last column shows the p- values from two-tailed paired Wilcoxon signed-rank tests.
No significant differences were recorded in the sleep diary measures between Day 1 and Day 2 for the 10 healthy subjects. We concluded that none of the participants suffered from sleep-awake disruption during the study.
The HRV, temperature and activity measures before and after of all
Fig. 3. Deep learning architecture. LSTM: Long Short-Term Memory.
Table 1 Sleep diary measures.
Day 1 Day 2
MD Q1 25th
Q3 75th
MD Q1 25th
Q3 75th
p- value
Sleep onset latency (SOL) (min)
17.5 11.2 27.5 12.5 6.2 18.7 0.31
Wake after sleep onset (WASO) (min)
10 6.25 18.75 5 2.5 12.7 0.90
Total sleep time (TST) (H)
7.3 7.1 8.1 8.3 8.0 8.8 0.08
Sleep efficiency (SE) (%)
88 %
82 % 94 % 86 %
77 % 98 % 0.47
Subjective sleep quality (SSQ)
3 2 2 4 3 3 0.08
MD = Median. Q1 = First quartile. Q3= Third quartile. P-values from Wilcoxon signed-rank tests with Holm’s correction.
R. Castaldo et al.
Biomedical Signal Processing and Control 65 (2021) 102386
6
the participants were analyzed over 2 days. Measures median (MD), standard deviation (SD), 25th and 75th percentiles and p-values are reported in Table 2.
Three of 20 melatonin profiles were excluded because they were of such irregular pattern that these internal circadian phase markers could not be reliably determined, suggesting that the samples were contami-nated or alternated [18,22]. One, out of the three melatonin profiles, was excluded as two saliva samples were missing. Two, out of three melatonin profiles, were excluded as they did not have the six low daytime points required for the calculation of the 3k method on the two-hours melatonin profiles.
As reported in Table 2, 23 out of 26 measures changed significantly ‘before and ‘after’ MO. Regarding HRV measures in time domain, Mean HR (Mean Heart Rate), Std HR (Standard deviation Heart Rate), Max HR and Min HR showed lower values ‘after MO’, whereas NN50, pNN50 and RMSSD (square root of the mean squared differences) increased.
Regarding HRV measures in frequency domain, LF (low frequency) and LF/HF (low/high frequency) ratio showed lower values after MO than high frequency and total power (as shown in Table 2), demon-strating an increase of the parasympathetic branch and a withdraw of the sympathetic branch ‘after MO’, reflecting a parasympathetic domi-nance [77].
Regarding non-linear HRV measures, in Table 2 Poincare standard deviations, SD1 and SD2, and Sample entropy showed increased values after MO. Whereas the ratio of SD2 and SD1 and approximate entropy showed a decreased value after MO, supporting parasympathetic dominance. Temperature and activity measures reported a decrease after MO.
3.3. Deep learning
3.3.1. Feature selection and performance in training and validation Features were selected on a priori by applying redundancy analysis,
as described in [72]. The final combination of features used to develop the model was Min HR, Max HR, LF peak, HF peak, LF power, HF power, SD2/SD1, Approximate Entropy, Proximal Temperature and activity.
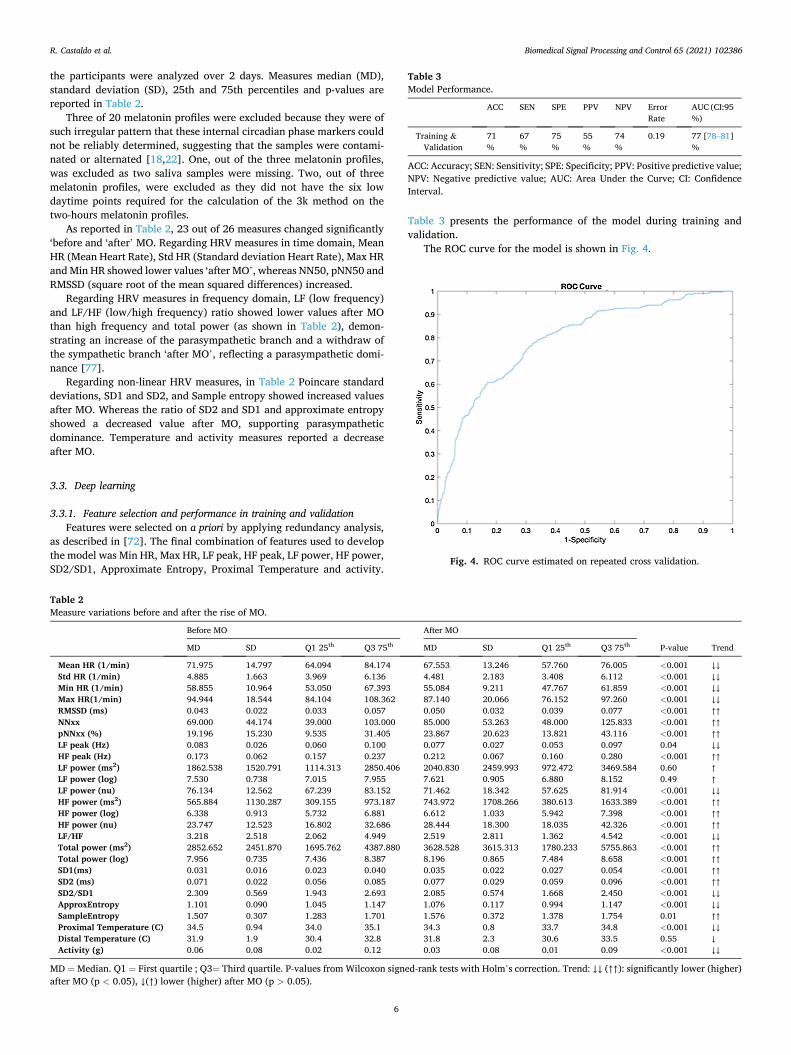
Table 3 presents the performance of the model during training and validation.
The ROC curve for the model is shown in Fig. 4.
Table 2 Measure variations before and after the rise of MO.
Before MO After MO
MD SD Q1 25th Q3 75th MD SD Q1 25th Q3 75th P-value Trend
Mean HR (1/min) 71.975 14.797 64.094 84.174 67.553 13.246 57.760 76.005 <0.001 ↓↓ Std HR (1/min) 4.885 1.663 3.969 6.136 4.481 2.183 3.408 6.112 <0.001 ↓↓ Min HR (1/min) 58.855 10.964 53.050 67.393 55.084 9.211 47.767 61.859 <0.001 ↓↓ Max HR(1/min) 94.944 18.544 84.104 108.362 87.140 20.066 76.152 97.260 <0.001 ↓↓ RMSSD (ms) 0.043 0.022 0.033 0.057 0.050 0.032 0.039 0.077 <0.001 ↑↑ NNxx 69.000 44.174 39.000 103.000 85.000 53.263 48.000 125.833 <0.001 ↑↑ pNNxx (%) 19.196 15.230 9.535 31.405 23.867 20.623 13.821 43.116 <0.001 ↑↑ LF peak (Hz) 0.083 0.026 0.060 0.100 0.077 0.027 0.053 0.097 0.04 ↓↓ HF peak (Hz) 0.173 0.062 0.157 0.237 0.212 0.067 0.160 0.280 <0.001 ↑↑ LF power (ms2) 1862.538 1520.791 1114.313 2850.406 2040.830 2459.993 972.472 3469.584 0.60 ↑ LF power (log) 7.530 0.738 7.015 7.955 7.621 0.905 6.880 8.152 0.49 ↑ LF power (nu) 76.134 12.562 67.239 83.152 71.462 18.342 57.625 81.914 <0.001 ↓↓ HF power (ms2) 565.884 1130.287 309.155 973.187 743.972 1708.266 380.613 1633.389 <0.001 ↑↑ HF power (log) 6.338 0.913 5.732 6.881 6.612 1.033 5.942 7.398 <0.001 ↑↑ HF power (nu) 23.747 12.523 16.802 32.686 28.444 18.300 18.035 42.326 <0.001 ↑↑ LF/HF 3.218 2.518 2.062 4.949 2.519 2.811 1.362 4.542 <0.001 ↓↓ Total power (ms2) 2852.652 2451.870 1695.762 4387.880 3628.528 3615.313 1780.233 5755.863 <0.001 ↑↑ Total power (log) 7.956 0.735 7.436 8.387 8.196 0.865 7.484 8.658 <0.001 ↑↑ SD1(ms) 0.031 0.016 0.023 0.040 0.035 0.022 0.027 0.054 <0.001 ↑↑ SD2 (ms) 0.071 0.022 0.056 0.085 0.077 0.029 0.059 0.096 <0.001 ↑↑ SD2/SD1 2.309 0.569 1.943 2.693 2.085 0.574 1.668 2.450 <0.001 ↓↓ ApproxEntropy 1.101 0.090 1.045 1.147 1.076 0.117 0.994 1.147 <0.001 ↓↓ SampleEntropy 1.507 0.307 1.283 1.701 1.576 0.372 1.378 1.754 0.01 ↑↑ Proximal Temperature (C) 34.5 0.94 34.0 35.1 34.3 0.8 33.7 34.8 <0.001 ↓↓ Distal Temperature (C) 31.9 1.9 30.4 32.8 31.8 2.3 30.6 33.5 0.55 ↓ Activity (g) 0.06 0.08 0.02 0.12 0.03 0.08 0.01 0.09 <0.001 ↓↓
MD = Median. Q1 = First quartile ; Q3= Third quartile. P-values from Wilcoxon signed-rank tests with Holm’s correction. Trend: ↓↓ (↑↑): significantly lower (higher) after MO (p < 0.05), ↓(↑) lower (higher) after MO (p > 0.05).
Table 3 Model Performance.
ACC SEN SPE PPV NPV Error Rate
AUC (CI:95 %)
Training & Validation
71 %
67 %
75 %
55 %
74 %
0.19 77 [78–81] %
ACC: Accuracy; SEN: Sensitivity; SPE: Specificity; PPV: Positive predictive value; NPV: Negative predictive value; AUC: Area Under the Curve; CI: Confidence Interval.
Fig. 4. ROC curve estimated on repeated cross validation.
R. Castaldo et al.

Biomedical Signal Processing and Control 65 (2021) 102386
7
4. Discussion
This study investigated the temporal associations between multiple physiological circadian rhythms which can be easily monitored using non-invasive wearable sensors, in order to accurately identify the time of melatonin onset (obtained from saliva) in real-life settings using deep learning algorithm. Our primary aim was met, as our results demon-strated that the patterns of HRV, physical activity and skin temperature allowed us to precisely and reliably determine the MO in free-living conditions (accuracy >70 %).
Thus, the statistical analysis showed that physiological and behav-ioral measures presented a generally depressed trend soon after the MO. Although direct comparison with existing literature is not straightfor-ward, as we could not find other studies with a similar protocol sys-tematically investigating HRV, body temperature and activity benchmarked with melatonin onset in real-life over two consecutive days, our results are consistent with previous findings using a single rhythm.
Regarding body temperature, it was found that proximal and distal skin temperatures showed a significant decrease after the rise of mela-tonin, hence, confirming that circadian rhythms in melatonin levels are strictly associated with body temperature. Several studies [24–26,78] have already demonstrated that body temperature declines as melatonin rises, as also confirmed in this study.
Regarding behavioral measures, our results demonstrated that a systematic decrease in activity levels is common after a rise in melatonin levels. These results confirmed that activity level shows a robust circa-dian pattern [30], reinforcing the idea that motor activity is generally high during the day and decreases during the evening [28–30], when a rise of melatonin levels is expected.
As far as HRV measures are concerned, only three studies [31–33] investigated how HRV behaves as marker of circadian cycles, using as benchmark either salivary or urinary melatonin. According to the existing literature, the present data demonstrated the existence of robust endogenous circadian variations in HR and HRV. In particular, a sig-nificant increase in High Frequency (HF) and a significant decrease of Low Frequency (LF), which are strongly associated with para-sympathetic and sympathetic activity respectively, was recorded after a rise of melatonin levels. According to other studies [31–33], an increase of parasympathetic modulation of the heart is concurrent with the peak of melatonin excretion. The results reported in this paper confirmed and expanded these results, as we demonstrated that other HRV measures in time and frequency domain show also similar trends. To the best of the authors knowledge, none of the studies investigated the behavior of non-linear HRV measures to describe circadian cycles. Regarding non-linear HRV measures, all five non-linear HRV measures calculated in this study changed significantly following a rise of melatonin levels. In particular, the ratio of SD2 and SD1 and approximate entropy showed a decreased value after the rise in melatonin, supporting the findings of parasympathetic dominance in this phase. Indeed, this study has shown that HRV follows a circadian cycle [32,33,79,80]. In fact, the synergy between the sympathetic and parasympathetic nervous systems changes throughout the day, and this is reflected in HRV data as a modulation in the length of RR intervals and in the spectral power.
Thus, our findings are consistent with previous reports on each in-dividual rhythm assessed with signals from wearable biosensors, but, for the first time, we integrated the physiological insight from each of them into a coherent prediction of melatonin onset, an indicator of the endogenous circadian clock phase [81], with clinical pertinence. Indeed, the identification of the endogenous phase in a seamless (passive remote monitoring from wearable multisensors) and dynamic (i.e., from one day to the next) way will allow an improved surveillance of a relevant biological functions, bearing prognostic and therapeutic potential in multiple conditions [82]. Thus, recurrent discrepancies between the internal body clock and the external environment, as occurring in jet-lag and shift-work, are connected with a negative impact on cardiovascular,
metabolic and mental health, as well as on cancer [83–86]. In particular for cancer, healthier behavioral changes with regards to the sleep-wake schedule and the exposure to synchronizing cues, which would derive from an accurate estimation of the internal phase, could provide novel empowering intervention opportunities to tackle frequent and clustering general complaints such as fatigue, anorexia, insomnia or mood disor-ders, which have been shown to be associated with circadian alterations [87–90]. In this pilot study, we preferred as the main endpoint MO, rather than the DLMO, which is more commonly used in physiological studies. The main reason for this pragmatic choice was due to the fact that we aimed to detect the melatonin onset in real-life setting from physiological signals collected in a free-living environment. Any limi-tation in light exposure, physical activity or sleep patterns would have impacted on the relevance of our approach for clinical implementation, as well as on the generalizability of our findings. The DLMO remains the accepted physiological gold-standard for determining the endogenous phase in controlled conditions. However, our results suggest that MO is sufficiently accurate and temporally coherent with other circadian physiological rhythms for clinical use in longitudinal monitoring of patients.
In fact, the statistical analysis demonstrated that most measures investigated in this study are coherently depressed (i.e., lower mean value and standard deviation) after the onset of melatonin. In order to estimate the extent of which these changes could be used to automati-cally detect the MO, we trained and tested an automatic binary classifier, which achieved promising results: 71 % accuracy rate, 67 % sensitivity rate, 75 % specificity rate and 77 % AUC. The classified employed 10 measures, combining proximal skin temperature, activity levels with HRV features in the time (Min HR, Max HR), frequency (LF peak, HF peak, LF power, HF power,) and non-linear (SD2/SD1, Approximate Entropy) domains. The novelty factor lies in the use of deep learning methods to combine physiological signals for the detection of the melatonin-onset. LSTM-based networks method was chosen because is often used for time-series classification [67], and greatly reduce the total number of parameters that need to be learnt. Moreover, its performance was higher when compared with more classical machine learning techniques. In fact, four most common used ML methods such as Naïve Bayesian, KNN, Decision trees and Linear Discriminant analysis, were trained and validated (with 100 repeated cross validation) on the same dataset. As reported in the Supplementary Table 2, the AUC of ML methods are lower than the DL method employed in the manuscript. Due to the early stage of our research, and considering our population, we decided to compare these models by investigating the AUC values. Readers should consider that depending on the intended clinical use of future models, high sensitivity for screening and high specificity for diagnosis may be preferred [91,92]. However, this will depend on the future applications of these models, or similar ones, in clinical settings.
Previous studies [31,39,40] developed a model to detect salivary melatonin phase, but none of these employed a binary classification to detect the rise of the melatonin, therefore, our results are not directly comparable with the existing literature. The choice of investigate the problem as binary classification is mainly due to the fact that this is a novel approach. Further models will be investigated to precisely detect salivatory melatonin phase.
The results achieved in this study are promising, although the cur-rent study is affected by some limitations that the reader should consider. First, our sample size was rather limited, although multidi-mensional longitudinal data for each subject was obtained; hence, further studies enrolling more subjects are required in order to confirm the general validity of our findings regarding the automatic detection of melatonin onset. Moreover, further investigation will be scaled on a week monitoring as individual’s typical circadian cycle could not be fully captured by two days monitoring. Additionally, ROC analysis will be also used to select the optimal threshold under a variety of clinical circumstances, balancing the inherent trade-offs that exist between sensitivity and sensitivity [93]. Second, melatonin is usually measured
R. Castaldo et al.

Biomedical Signal Processing and Control 65 (2021) 102386
8
under strict light control [94]; however, in this study light intensity was not controlled for melatonin to simulate real-life environment. There-fore, we cannot claim whether there were critical effects of light on melatonin secretion. Nevertheless, if the timing of the melatonin rise was affected by light in the evening then there should have been sig-nificant delays in the melatonin onsets compared to HRV pattern, which has shown in different studies to follow the circadian cycle [31–33]. This clearly was not the case. Participants were exposed to natural levels of light during their normal daily activities and the individual melatonin profiles remained moderately consistent each evening. An environ-mental time signal (light) would enable to compare our model more precisely with existing literature. Wearable light sensors could be used [95]. Third, although this approach would be useful for prognosis and therapeutic applications for circadian misalignment., it has not been validated in cases of circadian misalignment, or in clinical populations. Further clinical trial will be conducted to understand the value of this approach in patients suffering from circadian misalignment or in in-stances when acute complications (e.g., infections, hospital admissions) or iatrogenic interventions (e.g., surgery, systemic anticancer treat-ments) could induce alterations in circadian function or in its phase angle over prolonged time.
5. Conclusions
The current study suggests that artificial intelligence can be used to track endogenous clock phase alongside circadian rhythms patterns using physiological and behavioral measures monitored via wearable and easy-to-use sensors. This passive continuous monitoring approach could drastically reduce or eliminate altogether the need for repeated biological sampling in longitudinal studies yet maintaining the provi-sion of actionable insight into the endogenous circadian phase in free- living real-life conditions, as occurring in patients with acute and chronic illnesses whose course is impacted by circadian physiopathology.
Large-scale trials in combination with high-level signal processing and machine learning methods are now needed to generalize our results and confirm their clinical pertinence in surgical and oncological sciences.
Our current findings indicate that HRV, body temperature, physical activity and MO changed consistently over a day. The results confirmed the presence of robust endogenous circadian variations in HRV, skin body temperature and activity. Most of the measures investigated changed significantly after the identification of melatonin onset in real- life scenario, which can be considered a reliable marker to detect in-ternal circadian phase and longitudinally screen for circadian alterations.
An automatic classifier to detect the rise of salivary melatonin was trained and tested. The classifier achieved 71 % accuracy rate, 67 % sensitivity rate, 75 % specificity rate and 77 % AUC. These results are very promising, although further studies are needed to confirm their generalizability across a wider population.
CRediT authorship contribution statement
R. Castaldo: Data curation, Formal analysis, Investigation, Valida-tion, Writing - original draft, Writing - review & editing. M.J. Chappell: Data curation, Formal analysis, Funding acquisition, Investigation, Su-pervision, Writing - original draft, Writing - review & editing. H. Byrne: Data curation, Formal analysis, Funding acquisition, Investigation, Su-pervision, Writing - original draft, Writing - review & editing. P.F. Innominato: Conceptualization, Data curation, Formal analysis, Fund-ing acquisition, Supervision, Writing - review & editing. S. Hughes: Data curation, Formal analysis, Investigation, Writing - original draft, Writing - review & editing. A. Pescape: Investigation, Validation, Writing - original draft, Writing - review & editing. L. Pecchia: Conceptualization, Funding acquisition, Supervision, Writing - original
draft, Writing - review & editing.
Declaration of Competing Interest
The authors report no declarations of interest.
Acknowledgements
We acknowledge the Cyclops Healthcare Network, as well as a pathway to portfolio (P2P) development funding from the Betsi Cad-waladr University Health Board Research and Development department. This study was funded by the EP/N026985/1 Health Technology Network Plus (grant title “Closed loop control systems for optimization of treatment”) although the work presented in this paper reflects solely the authors’ view.
Appendix A. Supplementary data
Supplementary material related to this article can be found, in the online version, at doi:https://doi.org/10.1016/j.bspc.2020.102386.
References
[1] L.W. Van Laake, T.F. Lüscher, M.E. Young, The circadian clock in cardiovascular regulation and disease: lessons from the Nobel Prize in Physiology or Medicine 2017, Eur. Heart J. 39 (24) (2018) 2326–2329.
[2] T. Burki, Nobel Prize awarded for discoveries in circadian rhythm, Lancet 390 (10104) (2017) e25.
[3] T. Eckle, Health impact and management of a disrupted circadian rhythm and sleep in critical illnesses, Curr. Pharm. Des. 21 (24) (2015) 3428.
[4] A. Pan, E. Devore, E.S. Schernhammer, How shift work and a destabilized circadian system may increase risk for development of cancer and type 2 diabetes, Circadian medicine (2015) 183–209.
[5] R.G. Stevens, et al., Meeting report: the role of environmental lighting and circadian disruption in cancer and other diseases, Environ. Health Perspect. 115 (9) (2007) 1357–1362.
[6] D.J. Taylor, A.D. Bramoweth, Patterns and consequences of inadequate sleep in college students: substance use and motor vehicle accidents, J. Adolesc. Health 46 (6) (2010) 610–612.
[7] M. Wittmann, J. Dinich, M. Merrow, T. Roenneberg, Social jetlag: misalignment of biological and social time, Chronobiol. Int. 23 (1–2) (2006) 497–509.
[8] M.A. Carskadon, C. Acebo, O.G. Jenni, Regulation of adolescent sleep: implications for behavior, Ann. N. Y. Acad. Sci. 1021 (1) (2004) 276–291.
[9] P.F. Innominato, V.P. Roche, O.G. Palesh, A. Ulusakarya, D. Spiegel, F.A. Levi, The circadian timing system in clinical oncology, Ann. Med. 46 (4) (2014) 191–207.
[10] F. Levi, A. Okyar, S. Dulong, P.F. Innominato, J. Clairambault, Circadian timing in cancer treatments, Annu. Rev. Pharmacol. Toxicol. 50 (2010) 377–421.
[11] A. Ballesta, P.F. Innominato, R. Dallmann, D.A. Rand, F.A. Levi, Systems chronotherapeutics, Pharmacol. Rev. 69 (2) (2017) 161–199.
[12] E.B. Klerman, Clinical aspects of human circadian rhythms, J. Biol. Rhythms 20 (4) (2005) 375–386.
[13] M. Debono, et al., Modified-release hydrocortisone to provide circadian cortisol profiles, J. Clin. Endocrinol. Metab. 94 (5) (2009) 1548–1554.
[14] G.M. Brown, Light, melatonin and the sleep-wake cycle, J. Psychiatry Neurosci. 19 (5) (1994) 345.
[15] R.G. Abeysuriya, S.W. Lockley, P.A. Robinson, S. Postnova, A unified model of melatonin, 6-sulfatoxymelatonin, and sleep dynamics, J. Pineal Res. 64 (4) (2018) e12474.
[16] A.J. Lewy, R.L. Sack, The dim light melatonin onset as a marker for Orcadian phase position, Chronobiol. Int. 6 (1) (1989) 93–102.
[17] A.J. Lewy, Circadian rhythms and mood disorders: a guide for the perplexed, J. Clin. Psychiatry 76 (5) (2015) 662–664.
[18] T.A. Molina, H.J. Burgess, Calculating the dim light melatonin onset: the impact of threshold and sampling rate, Chronobiol. Int. 28 (8) (2011) 714–718.
[19] A.J. Lewy, N.L. Cutler, R.L. Sack, The endogenous melatonin profile as a marker for circadian phase position, J. Biol. Rhythms 14 (3) (1999) 227–236.
[20] D.J. Kennaway, A critical review of melatonin assays: past and present, J. Pineal Res. (2019) e12572.
[21] S. Abdullah, E.L. Murnane, M. Matthews, T. Choudhury, Circadian computing: sensing, modeling, and maintaining biological rhythms. Mobile Health, Springer, 2017, pp. 35–58.
[22] H.J. Burgess, L.F. Fogg, Individual differences in the amount and timing of salivary melatonin secretion, PLoS One 3 (8) (2008) e3055.
[23] J.E. Byrne, B. Bullock, G. Murray, Development of a measure of sleep, circadian rhythms, and mood: the SCRAM questionnaire, Front. Psychol. 8 (2017) 2105.
[24] M.J. Hasselberg, J. McMahon, K. Parker, The validity, reliability, and utility of the iButton® for measurement of body temperature circadian rhythms in sleep/wake research, Sleep Med. 14 (1) (2013) 5–11.
R. Castaldo et al.

Biomedical Signal Processing and Control 65 (2021) 102386
9
[25] C.G. Scully, et al., Skin surface temperature rhythms as potential circadian biomarkers for personalized chronotherapeutics in cancer patients, Interface Focus 1 (1) (2010) 48–60.
[26] J. Słomko, P. Zalewski, The circadian rhythm of core body temperature (Part I): the use of modern telemetry systems to monitor core body temperature variability, Polish Hyperb. Res. 55 (2) (2016) 79–83.
[27] S.Y. Sim, et al., Estimation of circadian body temperature rhythm based on heart rate in healthy, ambulatory subjects, IEEE J. Biomed. Health Inform. 21 (2) (2016) 407–415.
[28] S. Ancoli-Israel, R. Cole, C. Alessi, M. Chambers, W. Moorcroft, C.P. Pollak, The role of actigraphy in the study of sleep and circadian rhythms, Sleep 26 (3) (2003) 342–392.
[29] M.T. Smith, et al., Use of actigraphy for the evaluation of sleep disorders and circadian rhythm sleep-wake disorders: an American Academy of Sleep Medicine clinical practice guideline, J. Clin. Sleep Med. 14 (07) (2018) 1231–1237.
[30] M. Bonmati-Carrion, B. Middleton, V. Revell, D. Skene, M. Rol, J. Madrid, Circadian phase assessment by ambulatory monitoring in humans: correlation with dim light melatonin onset, Chronobiol. Int. 31 (1) (2014) 37–51.
[31] E.A. Gil, X.L. Aubert, E.I. Møst, D.G. Beersma, Human circadian phase estimation from signals collected in ambulatory conditions using an autoregressive model, J. Biol. Rhythms 28 (2) (2013) 152–163.
[32] G. Vandewalle, et al., Robust circadian rhythm in heart rate and its variability: influence of exogenous melatonin and photoperiod, J. Sleep Res. 16 (2) (2007) 148–155.
[33] P. Boudreau, G. Dumont, N.K.N.Y. Kin, C.-D. Walker, D.B. Boivin, Correlation of heart rate variability and circadian markers in humans, in: 2011 Annual International Conference of the IEEE Engineering in Medicine and Biology Society, IEEE, 2011, pp. 681–682.
[34] C.A. Czeisler, et al., Stability, precision, and near-24-hour period of the human circadian pacemaker, Science 284 (5423) (1999) 2177–2181.
[35] D.S. Minors, J.M. Waterhouse, Masking in humans: the problem and some attempts to solve it, Chronobiol. Int. 6 (1) (1989) 29–53.
[36] A.E. Draghici, J.A. Taylor, The physiological basis and measurement of heart rate variability in humans, J. Physiol. Anthropol. 35 (1) (2016) 22.
[37] B.L. Smarr, D.C. Burnett, S.M. Mesri, K.S. Pister, L.J. Kriegsfeld, A wearable sensor system with circadian rhythm stability estimation for prototyping biomedical studies, IEEE Trans. Affect. Comput. 7 (3) (2015) 220–230.
[38] E. Ortiz-Tudela, A. Martinez-Nicolas, M. Campos, M.A. Rol, J.A. Madrid, A new integrated variable based on thermometry, actimetry and body position (TAP) to evaluate circadian system status in humans, PLoS Comput. Biol. 6 (11) (2010) e1000996.
[39] V. Kolodyazhniy, et al., An improved method for estimating human circadian phase derived from multichannel ambulatory monitoring and artificial neural networks, Chronobiol. Int. 29 (8) (2012) 1078–1097.
[40] J.E. Stone, et al., Generalizability of a neural network model for circadian phase prediction in real-world conditions, Sci. Rep. 9 (1) (2019) 11001, https://doi.org/ 10.1038/s41598-019-47311-4, 2019/07/29.
[41] S. Komarzynski, M. Bolborea, Q. Huang, B. Finkenstadt, F. Levi, Predictability of individual circadian phase during daily routine for medical applications of circadian clocks, JCI Insight 4 (18) (2019).
[42] J. Merilahti, P. Viramo, I. Korhonen, Wearable monitoring of physical functioning and disability changes, circadian rhythms and sleep patterns in nursing home residents, IEEE J. Biomed. Health Inform. 20 (3) (2015) 856–864.
[43] R. Castaldo, et al., Investigating the use of wearables for monitoring circadian rhythms: a feasibility study, in: International Conference on Biomedical and Health Informatics, Springer, 2019, pp. 275–280.
[44] S.A. Ferguson, D.J. Kennaway, A. Baker, N. Lamond, D. Dawson, Sleep and circadian rhythms in mining operators: limited evidence of adaptation to night shifts, Appl. Ergon. 43 (4) (2012) 695–701.
[45] M.A. Jensen, A.H. Garde, J. Kristiansen, K. Nabe-Nielsen, Å.M. Hansen, The effect of the number of consecutive night shifts on diurnal rhythms in cortisol, melatonin and heart rate variability (HRV): a systematic review of field studies, Int. Arch. Occup. Environ. Health 89 (4) (2016) 531–545.
[46] J.B. Burch, et al., Shift work and heart rate variability coherence: pilot study among nurses, Appl. Psychophysiol. Biofeedback 44 (1) (2019) 21–30.
[47] H. Lindholm, et al., Attenuation of vagal recovery during sleep and reduction of cortisol/melatonin ratio in late afternoon associate with prolonged daytime sleepiness among media workers with irregular shift work, Am. J. Ind. Med. 55 (7) (2012) 643–649.
[48] D.J. Buysse, C.F. Reynolds III, T.H. Monk, C.C. Hoch, A.L. Yeager, D.J. Kupfer, Quantification of subjective sleep quality in healthy elderly men and women using the Pittsburgh Sleep Quality Index (PSQI), Sleep 14 (4) (1991) 331–338.
[49] C.E. Carney, et al., The consensus sleep diary: standardizing prospective sleep self- monitoring, Sleep 35 (2) (2012) 287–302.
[50] J.J.N. Bass, Circadian topology of metabolism, Nature 491 (7424) (2012) 348. [51] J.D. Johnston, J.M. Ordovas, F.A. Scheer, F.W. Turek, Circadian rhythms,
metabolism, and chrononutrition in rodents and humans–, Adv. Nutr. 7 (2) (2016) 399–406.
[52] S. Aoyama, S.J. Shibata, The role of circadian rhythms in muscular and osseous physiology and their regulation by nutrition and exercise, Front. Neurosci. 11 (2017) 63.
[53] L. Montesinos, R. Castaldo, F.P. Cappuccio, L. Pecchia, Day-to-day variations in sleep quality affect standing balance in healthy adults, Sci. Rep. 8 (1) (2018) 17504.
[54] J.A. Johnstone, P.A. Ford, G. Hughes, T. Watson, A.T. Garrett, BioHarnessTM multivariable monitoring device: part. I: validity, J. Sports Sci. Med. 11 (3) (2012) 400.
[55] W.D. van Marken Lichtenbelt, et al., Evaluation of wireless determination of skin temperature using iButtons, Physiol. Behav. 88 (4–5) (2006) 489–497.
[56] B. Martinez-Tellez, et al., Differences between the most used equations in BAT- human studies to estimate parameters of skin temperature in young lean men, Sci. Rep. 7 (1) (2017) 10530.
[57] A. Voultsios, D.J. Kennaway, D. Dawson, Salivary melatonin as a circadian phase marker: validation and comparison to plasma melatonin, J. Biol. Rhythms 12 (5) (1997) 457–466.
[58] D. Corbalan-Tutau, J.A. Madrid, F. Nicolas, M.J.P. Garaulet, Daily profile in two circadian markers “melatonin and cortisol” and associations with metabolic syndrome components, Physiol. Behav. 123 (2014) 231–235.
[59] M. Adamsson, T. Laike, T. Morita, Annual variation in daily light exposure and circadian change of melatonin and cortisol concentrations at a northern latitude with large seasonal differences in photoperiod length, J. Physiol. Anthropol. 36 (1) (2017) 6.
[60] G. Albaum, B.D. Murphy, Extreme response on a Likert scale, Psychol. Rep. 63 (2) (1988) 501–502.
[61] M.P. Tarvainen, J.-P. Niskanen, J.A. Lipponen, P.O. Ranta-Aho, P.A. Karjalainen, Kubios HRV–heart rate variability analysis software, Comput. Methods Programs Biomed. 113 (1) (2014) 210–220.
[62] J. Pan, W.J. Tompkins, A real-time QRS detection algorithm, IEEE Trans. Biomed. Eng. 32 (3) (1985) 230–236.
[63] R. Castaldo, L. Montesinos, P. Melillo, C. James, L. Pecchia, Ultra-short term HRV features as surrogates of short term HRV: a case study on mental stress detection in real life, BMC Med. Inform. Decis. Mak. 19 (1) (2019) 12.
[64] M.P. Tarvainen, J.-P. Niskanen, Kubios HRV user’s Guide. Biosignal Analysis and Medical Imaging Group (BSAMIG), Department of Physics University of Kuopio, 2013.
[65] S.S. Shapiro, M.B. Wilk, An analysis of variance test for normality (complete samples), Biometrika 52 (3/4) (1965) 591–611.
[66] R. Castaldo, P. Melillo, R. Izzo, N. De Luca, L. Pecchia, Fall prediction in hypertensive patients via short-term HRV Analysis, IEEE J. Biomed. Health Inform. 21 (2) (2016) 399–406.
[67] A. Sherstinsky, Fundamentals of recurrent neural network (rnn) and long short- term memory (lstm) network, Physica D 404 (2020) 132306.
[68] S. Hochreiter, J. Schmidhuber, Long short-term memory, Neural Comput. 9 (8) (1997) 1735–1780.
[69] I.K.M. Jais, A.R. Ismail, S.Q. Nisa, Adam optimization algorithm for wide and deep neural network, Knowl. Eng. Data Sci. 2 (1) (2019) 41–46.
[70] E.W. Steyerberg, F.E. Harrell Jr., G.J. Borsboom, M. Eijkemans, Y. Vergouwe, J.D. F. Habbema, Internal validation of predictive models: efficiency of some procedures for logistic regression analysis, J. Clin. Epidemiol. 54 (8) (2001) 774–781.
[71] F.E. Harrell, Describing, resampling, validating, and simplifying the model. Regression Modeling Strategies: With Applications to Linear Models, Logistic and Ordinal Regression, and Survival Analysis, Springer International Publishing, Cham, 2015, pp. 103–126.
[72] F.E. Harrell, Regression modeling strategies, BIOS 330 (2017) 2018. [73] K.R. Foster, R. Koprowski, J.D. Skufca, Machine learning, medical diagnosis, and
biomedical engineering research-commentary, Biomed. Eng. Online 13 (1) (2014) 94.
[74] F.E. Harrell Jr, M.F.E. Harrell Jr, Package ‘Hmisc’, CRAN2018 2019 (2019) 235–236.
[75] M. Kohl, Performance measures in binary classification, Int. J. Stat. Med. Res. 1 (1) (2012) 79–81.
[76] M.H. Zweig, G. Campbell, Receiver-operating characteristic (ROC) plots: a fundamental evaluation tool in clinical medicine, Clin. Chem. 39 (4) (1993) 561–577.
[77] F. Shaffer, J.P. Ginsberg, An overview of heart rate variability metrics and norms, Front. Public Health 5 (2017) 258.
[78] A. Cagnacci, K. Krauchi, A. Wirz-Justice, A. Volpe, Homeostatic versus circadian effects of melatonin on core body temperature in humans, J. Biol. Rhythms 12 (6) (1997) 509–517.
[79] F.A. Scheer, L.J. van Doornen, R.M. Buijs, Light and diurnal cycle affect human heart rate: possible role for the circadian pacemaker, J. Biol. Rhythms 14 (3) (1999) 202–212.
[80] A.P. Van Eekelen, J.H. Houtveen, G.A. Kerkhof, Circadian variation in base rate measures of cardiac autonomic activity, Eur. J. Appl. Physiol. 93 (1–2) (2004) 39–46.
[81] E.E. Flynn-Evans, et al., Circadian phase and phase angle disorders in primary insomnia, Sleep 40 (12) (2017) zsx163.
[82] C.R. Cederroth, et al., Medicine in the fourth dimension (in eng), Cell Metab. 30 (August (2)) (2019) 238–250, https://doi.org/10.1016/j.cmet.2019.06.019.
[83] S.M. James, K.A. Honn, S. Gaddameedhi, H.P. Van Dongen, Shift work: disrupted circadian rhythms and sleep—implications for health and well-being, Curr. Sleep Med. Rep. 3 (2) (2017) 104–112.
[84] K.J. Reid, S.M. Abbott, Jet lag and shift work disorder, Sleep Med. Clin. 10 (4) (2015) 523–535.
[85] E.M. Ward, et al., Carcinogenicity of night shift work (in eng), Lancet Oncol. 20 (August (8)) (2019) 1058–1059, https://doi.org/10.1016/s1470-2045(19)30455- 3.
[86] S. Ganesan, et al., The impact of shift work on sleep, alertness and performance in healthcare workers, Sci. Rep. 9 (1) (2019) 4635.
R. Castaldo et al.

Biomedical Signal Processing and Control 65 (2021) 102386
10
[87] R.G. Foster, K. Wulff, The rhythm of rest and excess, Nat. Rev. Neurosci. 6 (5) (2005) 407.
[88] P.F. Innominato, M.-C. Mormont, T.A. Rich, J. Waterhouse, F.A. Levi, G. A. Bjarnason, Circadian disruption, fatigue, and anorexia clustering in advanced cancer patients: implications for innovative therapeutic approaches, Integr. Cancer Ther. 8 (4) (2009) 361–370.
[89] P.F. Innominato, et al., Circadian rest-activity rhythm as an objective biomarker of patient-reported outcomes in patients with advanced cancer, Cancer Med. 7 (9) (2018) 4396–4405.
[90] B.-J. Hahm, et al., Bedtime misalignment and progression of breast cancer, Chronobiol. Int. 31 (2) (2014) 214–221.
[91] M.S. Pepe, The Statistical Evaluation of Medical Tests for Classification and Prediction, Medicine, 2003.
[92] P.-H.C. Chen, Y. Liu, L. Peng, How to develop machine learning models for healthcare, Nat. Mater. 18 (5) (2019) 410.
[93] K.H. Zou, A.J. O’Malley, L. Mauri, Receiver-operating characteristic analysis for evaluating diagnostic tests and predictive models, Circulation 115 (5) (2007) 654–657.
[94] J.S. Emens, H.J. Burgess, Effect of light and melatonin and other melatonin receptor agonists on human circadian physiology, Sleep Med. Clin. 10 (4) (2015) 435–453.
[95] L. Tahkamo, T. Partonen, A.-K. Pesonen, Systematic review of light exposure impact on human circadian rhythm, Chronobiol. Int. 36 (2) (2019) 151–170.
R. Castaldo et al.