detection of palladium diimide: reaction based near-ir ... · with ps-pdi and pd0 indicated that...
TRANSCRIPT

1
Self-assembled vesicle and rod-like aggregates of functionalized perylene
diimide: Reaction based near-IR intracellular fluorescent probe for selective
detection of palladium
Prabhpreet Singh,*[a] Lalit Singh Mittal,[a] Vanita Vanita,[b] Kapil Kumar,[a] Amandeep Walia,[b] Gaurav
Bhargava,[c] Subodh Kumar[a]
[a] Dr. P. Singh, L.S. Mittal, K. Kumar, Prof. Dr. S. Kumar
Department of Chemistry, UGC Centre for Advanced Studies, Guru Nanak Dev University, Amritsar 143
005, India
[b] Prof. Dr. V. Vanita, A. Walia
Department of Human Genetics, Guru Nanak Dev University, Amritsar 143 005, India
[c] Dr. G. Bhargava
Department of Applied Sciences, Punjab Technical University, Kapurthala 144601, Punjab, India
1. Table for comparison of present work with literature report S2-S3
2. Experimental Section S3 – S9
3. Photophysical properties of PS-PDI, DPS-PDI and PDI 5 in different solvents S10-S17
4. pH titration of PS-PDI S18
5. Self-assembly of PS-PDI in different solvents S19-S22
6. Photophysical properties of PS-PDI in DMSO:H2O (1:9) S22-S23
7. Photophysical properties of DPS-PDI S23
8. MTT assay S24
9. Time and Concentration dependent kinetic profile S24-S28
10. Photophysical properties of PS-PDI with Pd2+ S29
11. Analysis in the environmental samples S29-S30
12. pH titration of PDI-OH S31
13. Competition Experiments S31
Electronic Supplementary Material (ESI) for Journal of Materials Chemistry B.This journal is © The Royal Society of Chemistry 2016

2
Table: Comparison of solvent, detection limits and applications in live cell imaging and environmental samples of present work with literature report.
Published Solvent Metal Detection limit Cell study Practical Application
Present Work THF:H2O (1:1)
DMSO:H2O (1:9)
Pd0, Pd2+ THF:H2O (1:9) 120 nM
DMSO:H2O (1:9) 6.6 nM
HeLa Cell Pd0 analysis in pharmaceutical, environmental and urine samples.
Analyst 2016, DOI: 10.1039/C6AN00204H
PBS solution Pd0 2.1 nM HeLa Cells No
Tetrahedron letter, 2016, 57, 1451-1455
DMSO:H2O (1:1) Pd0 0.34 nM No No
Chem. Asian Journal 2016, 11, 43-48
EtOH:H2O
(1:1)
Pd0, Pd2+ 191 nM Zebra fish, Dapnia magna
No
Tetrahedron Letter, 2015, 56, 6491-6494
DMSO:H2O(9:1) Pd0 52 nM No No
Tetrahedron 2015, 71, 7874-7878
DMSO:H2O(1:1) Pd0 17.4 nM No No
Tetrahedron Letter, 2014, 55, 2537-2540
DMSO:H2O (8:2) Pd0, Pd2+ 12 nM Pd+2 No Water and fetal bovine serum.
Inorganic Chem. 2014, 53, 12590-12594
PBS solution (1% organic solvent)
Pd0, Pd2+ 25 nM Pd+2 Yes No
Anal. Chim. Acta, 2013, 786, 139-145.
CTAB micellar solution
Pd0 1 μM No Pd in chemical reactions and catalytic converters.
Analyst 2013, 138, 1564
CH3CN : H2O (1:1) Pd0, Pd2+ - No No
Chem. Commun., 2012, 48, 2867-2869
CH3CN : H2O (1:4) Pd0, Pd2+, Pd4+
87 nM No Biological and environmental
Sensor Actuat B., 2012, 171-172, 1277-1282
CH3OH : PBS (8:2) Pd0, Pd2+, Pd4+
0.05 μM Pd+2 No Environmental

3
Chem. Commun., 2011, 47, 8656-8658
PBS Pd0, Pd2+, Pd4+
0.07 μM Yes No
Organic Letter
2011, 13, 4922-4925
CH3CN : H2O (4:1) Pd0, Pd2+, Pd4+
6.1 nM Pd+2 No Environmental samples
Chem. Commun., 2010, 46, 3964-3966
CH3CN: H2O (1:9) Pd0, Pd2+, Pd4+
191 nM Zebra Fish imaging
No
Chem. Commun., 2009, 86-88
DMSO:H2O (1:1) Pd0 10 nM No Soil.
JACS 2007, 129, 12354-12355
Borate Buffer Pd0, Pd2+ 3 nM No Pharmaceutical, mining industry
2. Experimental Section
Cell Imaging and MTT assay studies
Cell imaging studies were performed using HeLa cell line. HeLa cells were grown in Dulbecco’s
modified Eagle’s medium (DMEM) that was supplemented with 10% fetal bovine serum (FBS), 100
IU/ml penicillin, 100 µg/ml streptomycin and 100 µg/ml gentamycin. HeLa cells were grown and
maintained in a humidified environment in an incubator at 37 oC with 5% CO2. A day before treatment, a
total of 2x10⁵ cells were seeded on glass coverslips (11 mm size) into the wells of a 24-well plate, and
HeLa cells were grown for 24 hours (until 65-70% confluence). Treatment was carried out in triplicates in
FBS and antibiotics free DMEM (90%) with DMSO (10%). HeLa cells were incubated with PS-PDI (10
µM) at 37 oC with 5% CO2 for 30 min. followed by 2 times wash with 1X phosphate buffered saline
(PBS) (pH = 7.4) supplemented with 10% DMSO and the addition of Pd0 (20 and 40 µM) for four hours
by incubating the cells at identical conditions. The HeLa cells were then washed thrice with 1X PBS
supplemented with 10% DMSO, fixed in 4% paraformaldehyde (ice cold), again washed three times with
1X PBS supplemented with 10% DMSO and mounted on to the glass slides. To test the cytotoxicity of
PS-PDI, MTT [3-(4,5-dimethylthiazol- 2-yl)-2,5-diphenyltetrazolium bromide] assay was performed with
HeLa cells so as to determine the effect of PS-PDI on proliferation of cells. The fluorescent signals were
visible in the cytoplasmic region of the HeLa cells sparing the nuclei. Brightfield imaging after treatment
with PS-PDI and Pd0 indicated that cells were viable throughout the experiment. HeLa cells were
observed to be permeable to both the PS-PDI and Pd0.
Preparation of samples and photophysical studies

4
Method for Detection of Pd2+: PS-PDI was added in various 10 mL volumetric flask and subsequently
different concentrations of PdCl2 as a source of Pd2+ were added followed by addition of 350 µL of 10
mM solution of NaBH4 and 350 µL of 10 mM solution of PPh3. The solutions were diluted with HEPES
buffer-THF (1:1 v/v, pH 7.3) up to the 10 mL mark. Then solutions were kept for 1h for equilibration
before taking the readings. Preparation of drug samples: For performing the UV-Vis titration of PS-PDI
in drug samples, the following procedure was followed. To the 10 µM solution of PS-PDI in HEPES
buffered THF (1:1 v/v, pH 7.3), we dissolved 1 or 5 mg drug (Disprin tablet, which contain 0.64 or 3.5
mg of Aspirin, respectively) followed by addition of various concentration of Pd0 in different volumetric
flasks. The volume of the solution in each flask was finally adjusted to 10 mL and prepared solutions
were kept for 1h before taking the final reading. Similarly, the same protocol was followed to prepare
different solution containing Pd2+ + NaBH4-PPh3 as a reducing agent in Disprin drug. Furthermore, a
similar new set of solutions of PS-PDI were also prepared with Pd0 and Pd2+ with NaBH4-PPh3 without
the addition of Disprin tablet and flasks were equilibrated for 1h before taking the final reading.
Preparation of environmental samples: The measurements of optical properties of PS-PDI towards Pd0
were also performed in the environmental samples such as tap water, pond water and industrial waste
water. For preparing the solution of PS-PDI (10 µM) in these environmental samples, the de-ionized
water in THF:water (1:1 v/v, pH 7.3) was replaced by tap water, or pond water or industrial waste water
as per design of the experiment followed by addition of various concentration of Pd0. The samples were
equilibrated for 1h and then UV-Vis and fluorescence spectra were recorded. UV-Visible and
Fluorescence titrations: The stock solutions for various measurements of PS-PDI, DPS-PDI, PDI 5 and
PDI-OH were prepared and dilutions of these stock solutions were used for the photophysical
measurements. We have used Pd(PPh3)4 as a source of Pd0 whereas PdCl2 was used as source of Pd2+
ions. Other metal ions were used as their perchlorate or nitrate salts. All absorption and fluorescence
scans were saved as ACSII files and further processed in Excel™ to produce all graphs shown in the
manuscript. DLS measurements: The solutions were filtered with a Millipore membrane filter (Acrodisc
syringe filter, 0.45 μm Supor membrane) before measurements. The samples were thermally equilibrated
for 10 min before each measurement, and an average of 10 measurement runs were considered to be data.
SEM/TEM images: Samples of PDI 1 were dissolved in DMSO:H2O (1:9 v/v). 5 µL aliquot of fresh
solution of PDI 1 was deposited on glass surface using drop cast method. After drying the glass surface
was imaged.

5
Fig S1a: 1H NMR spectrum of DPS-PDI.
Fig S1b: 13C NMR spectrum of DPS-PDI.

6
Fig S1c: Mass spectrum of DPS-PDI.
Fig S2a: 1H NMR spectrum of PS-PDI

7
Fig S2b: 13C NMR spectrum of PS-PDI.
Fig S2c: Mass spectrum of PS-PDI.
8
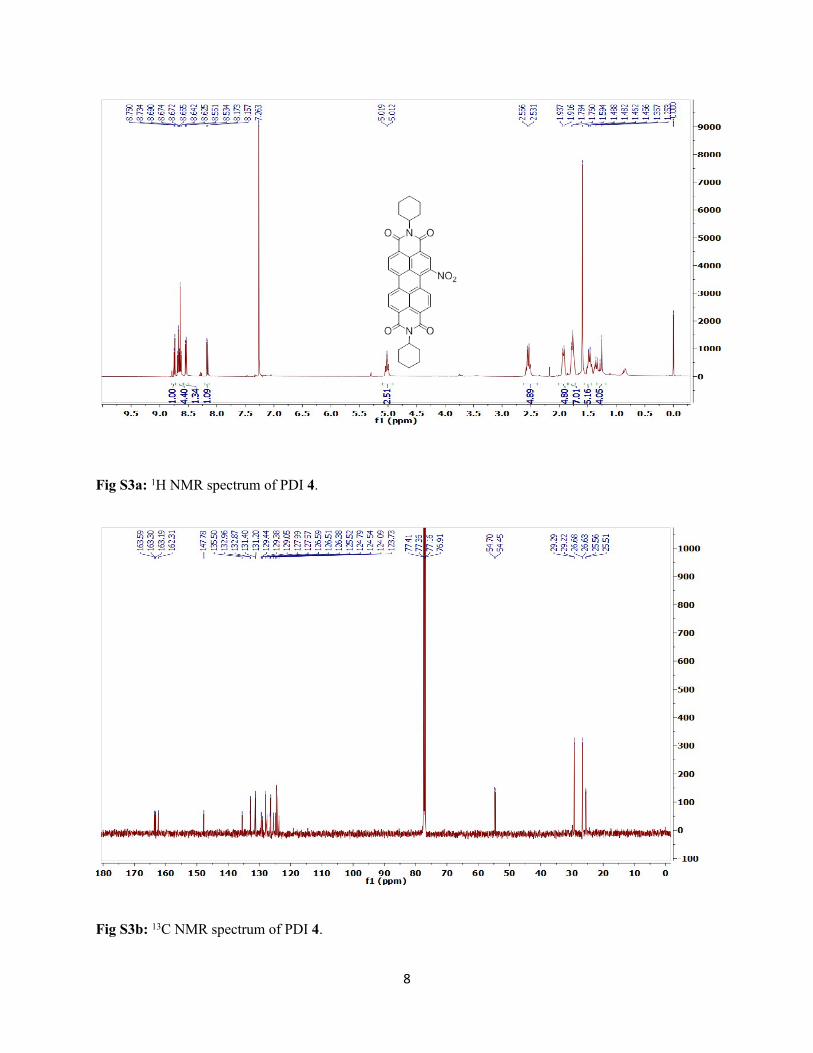
Fig S3a: 1H NMR spectrum of PDI 4.
Fig S3b: 13C NMR spectrum of PDI 4.

9
Fig S4a: 1H NMR spectrum of PDI 5.
Fig S4b: 13C NMR spectrum of PDI 5.
N
NO O
O O
O

10
3. Photophysical properties of PS-PDI in different Solvents
Fig. S5a. Solvent dependent absorption spectrum of PS-PDI (10 µM) recorded in different polarity
solvents. A:H = Acetonitrile:H2O; D:H = DMSO:H2O; T:H = THF:H2O.
Fig. S5b. Solvent dependent fluorescence spectrum of PS-PDI (10 µM) recorded in different polarity
solvents; λex490 nm; slit width (Ex/Em = 10/10 nm).

11
Table S1: Spectroscopic and photophysical characteristics of PS-PDI in various solvents.
Solvents λabs (nm) (ԑ) λem (nm) (FI) νabsax104
(cm-1)νflu
bx104
(cm-1)A0-0/A0-1
ratioc(νA-νF)d (cm-1)
Quantum Yielde Φ
CHCl3 545 (59000) 564 (387568) 1.834 1.773 1.42 610 0.840
Toluene 545 (39700) 564 (355936) 1.834 1.773 1.47 610 0.900
THF 540 (48300) 562 (373969) 1.851 1.779 1.40 720 0.743
Dioxane 541 (54700) 564 (419172) 1.848 1.773 1.43 750 0.744
CH3CN 538 (55900) 564 (392211) 1.858 1.754 1.41 850 0.627
Ethanol 540 (47000) 570 (295260) 1.851 1.754 1.38 970 0.640
IPA 541 (51800) 570 (329939) 1.848 1.754 1.33 940 0.645
DMSO 545 (50200) 574 (240822) 1.834 1.742 1.39 920 0.630
DCM 543 (58000) 564 (435251) 1.841 1.773 1.42 680 0.720
H2O 513 (14900) Weak Fluorescence
1.94 ----- 0.61 ----- -----
TH 1:1 544 (55100) 572 (297060) 1.838 1.748 1.40 900 -----
AH 1:1 529 (15000) 574 (13187) 1.890 1.742 0.76 1480 -----
DH 1:1 522 (18000) Weak Fluorescence
1.915 ----- 0.75 ----- -----
aMaximum absorption wavenumbers, bMaximum fluorescent wavenumbers, cLippert-Mataga polarity parameter(∆f) [1], dStoke’s shift, eFluorescence quantum yield. The fluorescence quantum yields (φf) were determined using rhodamine B [2] as a reference with the known φf = 0.5 in ethanol; slit width (excitation = 1 nm, emission = 1 nm).

12
Fig. S6a. (Upper panel) Fluorescence spectra of PS-PDI (10 μM) after incremental addition of water in
THF (Left, with λex 470 nm, slit width Ex/Em = 15/2.5) and (Right, with λex 490 nm, slit width Ex/Em =
20/20); (Lower panel) Fluorescence and Sunlight photographs of PS-PDI (10 µM) after incremental
addition of water in THF.

13
Fig. S6b. (Upper panel) Fluorescence spectra of PS-PDI (10 μM) after incremental addition of water in
DMSO (Left, with λex 470 nm, slit width Ex/Em = 15/3.5) and (Right, expansion); (Lower panel)
Fluorescence and Sunlight photographs of PS-PDI (10 µM) after incremental addition of water in DMSO.

14
Fig. S7a. (Upper panel) (a) UV-Vis absorption spectra of DPS-PDI (10 μM) and (b) Fluorescence spectra
of DPS-PDI (10 μM) after incremental addition of water in THF (λex 470 nm, slit width Ex/Em = 15/3.5);
(c) Fluorescence spectra of DPS-PDI (10 μM) after incremental addition of water in THF (λex 490 nm,
slit width Ex/Em = 20/20); (Lower panel) Fluorescence and Sunlight photographs of DPS-PDI (10 µM)
after incremental addition of water in THF.

15
Fig. S7b. (Upper panel) (a) UV-Vis absorption spectra of DPS-PDI (10 μM) and (b) Fluorescence spectra
of DPS-PDI (10 μM) after incremental addition of water in DMSO (λex 470 nm, slit width Ex/Em =
15/3.5); (Lower panel) Fluorescence and Sunlight photographs of DPS-PDI (10 µM) after incremental
addition of water in DMSO.

16
Fig. S8a. (Upper panel) (a) UV-Vis absorption spectra of PDI 5 (10 μM) and (b) Fluorescence spectra of
PDI 5 (10 μM) after incremental addition of water in THF (λex 470 nm, slit width Ex/Em = 14/2.8);
(Lower panel) Fluorescence and Sunlight photographs of PDI 5 (10 µM) after incremental addition of
water in THF.

17
Fig. S8b. (Upper panel) (a) UV-Vis absorption spectra of PDI 5 (10 μM) and (b) Fluorescence spectra of
PDI 5 (10 μM) after incremental addition of water in DMSO (λex 470 nm, slit width Ex/Em = 14/3.5);
(Lower panel) Fluorescence and Sunlight photographs of PDI 5 (10 µM) after incremental addition of
water in DMSO.
18
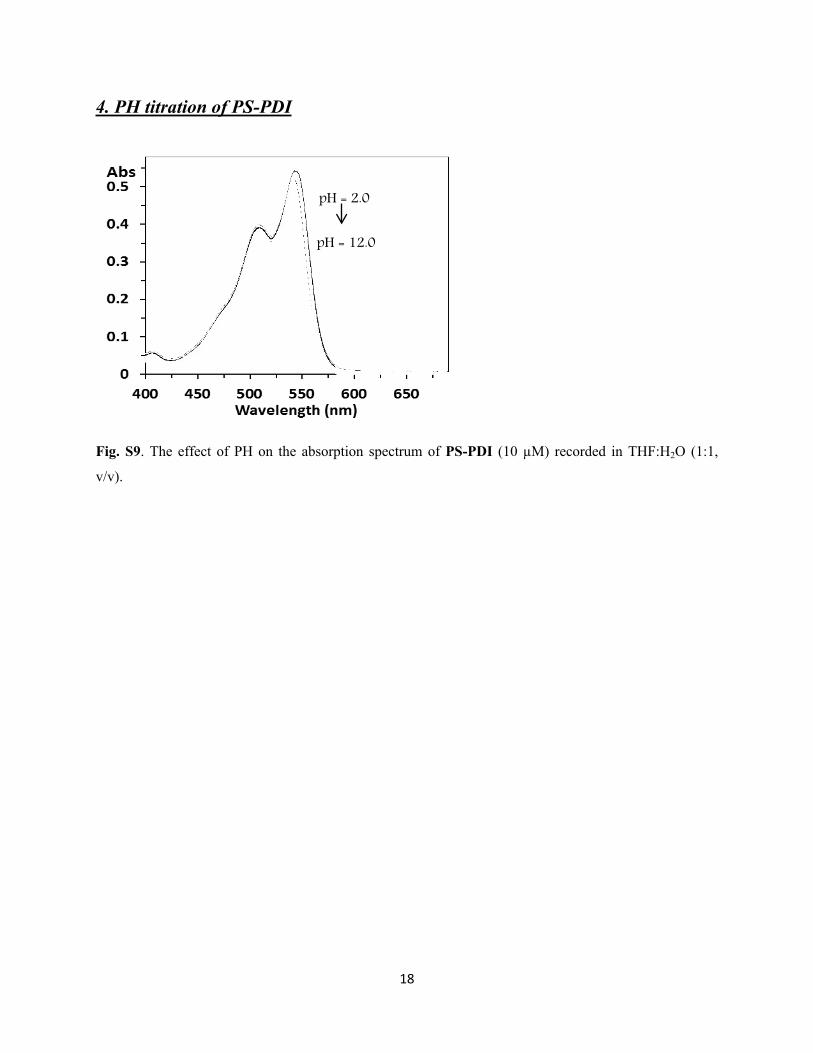
4. PH titration of PS-PDI
pH = 2.0
pH = 12.0
Fig. S9. The effect of PH on the absorption spectrum of PS-PDI (10 µM) recorded in THF:H2O (1:1,
v/v).
19
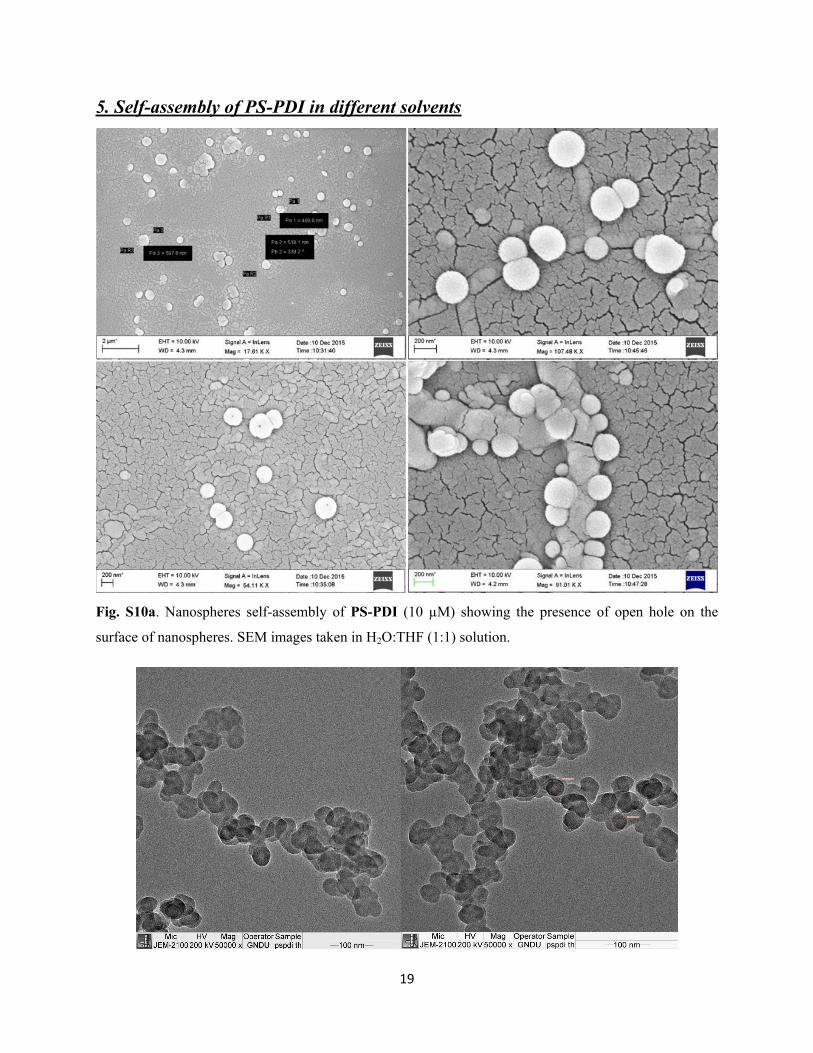
5. Self-assembly of PS-PDI in different solvents
Fig. S10a. Nanospheres self-assembly of PS-PDI (10 µM) showing the presence of open hole on the
surface of nanospheres. SEM images taken in H2O:THF (1:1) solution.

20
Fig. S10b. Nanospheres self-assembly of PS-PDI (10 µM). TEM images taken in H2O:THF (1:1)
solution.
Fig. S11a. Nanorods and nano spheres self-assembly of PS-PDI (10 µM). SEM images taken in
DMSO:H2O (1:9) solution.

21
Fig. S11b. Nanorods and nano spheres self-assembly of PS-PDI (10 µM). TEM images taken in
DMSO:H2O (1:9) solution.

22
Fig. S12a. Nanospheres self-assembly of PS-PDI (10 µM) on addition of Pd0 (100 µM). SEM images
taken in THF:H2O (1:1) solution.

23
Fig. S12b. Nanospheres self-assembly of PS-PDI (10 µM) on addition of Pd0 (100 µM). TEM images
taken in THF:H2O (1:1) solution.
Fig. S13. Nanospheres self-assembly of PS-PDI (10 µM) on addition of Pd0 (100 µM). SEM and TEM
images taken in DMSO:H2O (1:9) solution.
6. Photophysical properties of PS-PDI in DMSO:H2O (1:9)

24
Fig. S14. (a) UV-Vis absorption spectra of PS-PDI (10 μM) after incremental addition of Pd0 recorded in
HEPES buffer-DMSO (9:1, v/v, pH 7.3); (b) Plot of absorbance intensity vs conc. of Pd0 at 690 nm; Inset
(b): naked eye colour change of PS-PDI (10 µM) on addition of Pd0.
Fig. S15. (a) Fluorescence spectra of PS-PDI (10 μM) after incremental addition of Pd0 recorded in
HEPES buffer-DMSO (9:1, v/v, pH 7.3); (b) Plot of fluorescence intensity vs conc. of Pd0 at 660 nm;
Inset (b): fluorescent images of PS-PDI (10 µM) before and after addition of Pd0 under illumination of
UV light (365 nm).
6. Photophysical properties of DPS-PDI

25
Fig S16. (a) UV-Vis absorption and (b) Fluorescence spectra of DPS-PDI (10 μM) after incremental
addition of Pd0 recorded in HEPES buffer-THF (1:1, v/v, pH 7.3); All spectra were recorded after time
interval of 1 hour.
8. MTT Assay
Fig. S17. Cell viability (%) tested by MTT assay using HeLa cells at 37 °C.
26
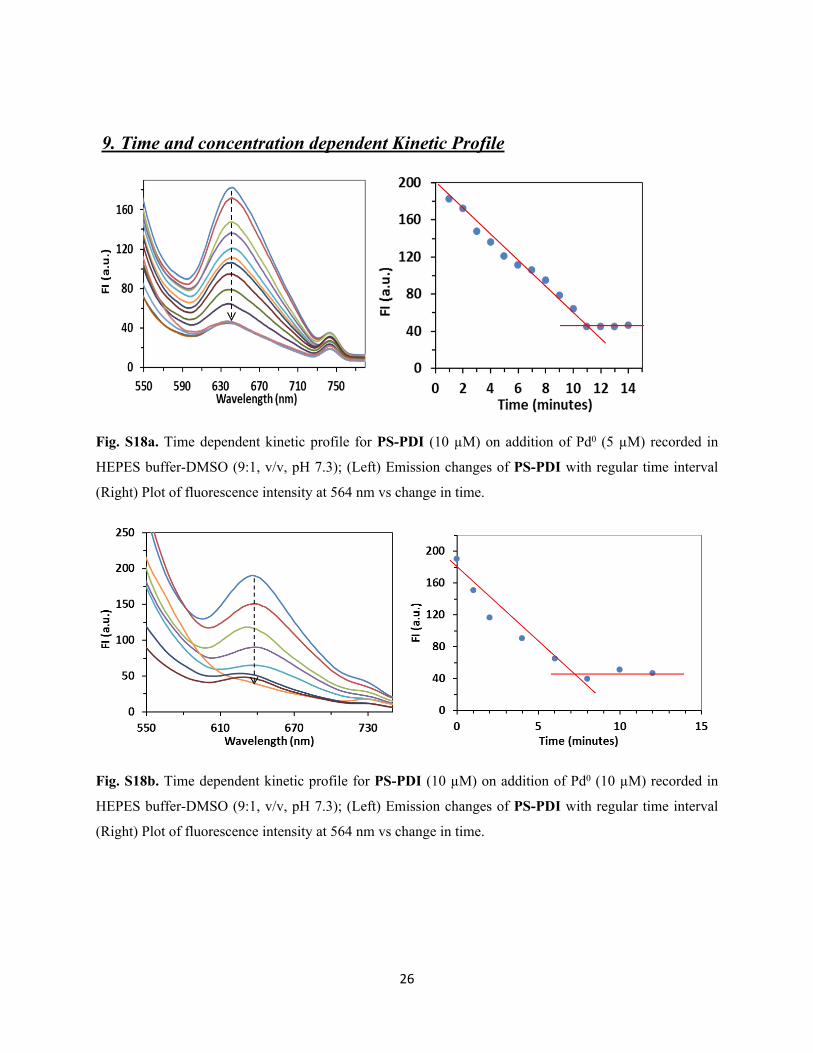
9. Time and concentration dependent Kinetic Profile
Fig. S18a. Time dependent kinetic profile for PS-PDI (10 µM) on addition of Pd0 (5 µM) recorded in
HEPES buffer-DMSO (9:1, v/v, pH 7.3); (Left) Emission changes of PS-PDI with regular time interval
(Right) Plot of fluorescence intensity at 564 nm vs change in time.
Fig. S18b. Time dependent kinetic profile for PS-PDI (10 µM) on addition of Pd0 (10 µM) recorded in
HEPES buffer-DMSO (9:1, v/v, pH 7.3); (Left) Emission changes of PS-PDI with regular time interval
(Right) Plot of fluorescence intensity at 564 nm vs change in time.

27
Fig. S18c. Time dependent kinetic profile for PS-PDI (10 µM) on addition of Pd0 (20 µM) recorded in
HEPES buffer-DMSO (9:1, v/v, pH 7.3); (Left) Emission changes of PS-PDI with regular time interval
(Right) Plot of fluorescence intensity at 564 nm vs change in time.
Fig. S19. Time dependent kinetic profile for PS-PDI (10 µM) on addition of Pd0 (a) 5 µM (b) 10 µM and
(c) 20 µM in HEPES buffer-DMSO (9:1, v/v, pH 7.3) by recording the absorption at 710 nm.

28
Fig. S20a: Time dependent kinetic profile for PS-PDI (10 µM) on addition of Pd0 (60 µM) recorded in
HEPES buffer-THF (1:1, v/v, pH 7.3); (Left) Absorbance changes of PS-PDI with regular time interval
(Right) Plot of absorbance at 543 nm and 710 nm vs change in time.
Fig. S20b. Time dependent kinetic profile for PS-PDI (10 µM) on addition of Pd0 (40 µM) recorded in
HEPES buffer-THF (1:1, v/v, pH 7.3); (Left) Absorbance changes of PS-PDI with regular time interval
(Right) Plot of absorbance at 543 nm and 710 nm vs change in time.

29
Fig. S21a: Time dependent kinetic profile for PS-PDI (10 µM) on addition of Pd0 (60 µM) recorded in
HEPES buffer-THF (1:1, v/v, pH 7.3); (Left) Emission changes of PS-PDI with regular time interval
(Right) Plot of fluorescence intensity at 564 nm vs change in time.
Fig. S21b. Time dependent kinetic profile for PS-PDI (10 µM) on addition of Pd0 (40 µM) recorded in
HEPES buffer-THF (1:1, v/v, pH 7.3); (Left) Emission changes of PS-PDI with regular time interval
(Right) Plot of fluorescence intensity at 564 nm vs change in time.

30
10. Photophysical properties of PS-PDI with Pd2+
Fig S22 (a) UV-Vis absorption and (b) Fluorescence spectra of PS-PDI (10 μM) after incremental addition of Pd2+ recorded in HEPES buffer-THF (1:1, v/v, pH 7.3) in the presence of NaBH4-PPh3.
11. Analysis in the Environmental Samples
Table S2. Application of PS-PDI for determination of Pd0 in the various environmental samples (tap
water, pond water and industrial waste water).
(a) Tap water
UV-Vis Data (@710 nm) Fluorescence data@ 564 nm
Conc.
(µM) SD % RSD% Relative
error
Conc.
(µM) SD % RSD% Relative error
5 0.076033 0.76033 1.075269 5 0.222726 2.227261 3.149823
10 0.186081 1.860807 1.315789 10 0.044297 0.442965 0.313224
15 0.58385 5.838496 2.752294 15 0.054855 0.548546 0.258587
20 0.563432 5.634317 1.992032 20 0.194435 1.944345 0.68743
25 0.550706 5.507062 1.557632 25 0.82536 8.253601 2.334471
PRSD = 3.90; PRE = 1.90 PRSD = 2.70; PRE = 1.35

31
(b) Pond water
UV-Vis Data (@ 710 nm) Fluorescence data @ 564 nm
Conc.
(µM) SD % RSD% Relative
error
Conc.
(µM) SD % RSD% Relative error
5 0.188266 1.882664 2.898551 5 0.013502 0.135018 0.186414
10 0.237267 2.372672 1.826484 10 0.503988 5.039877 3.739656
15 0.119048 1.190476 0.529101 15 0.270343 2.703426 1.378303
20 0.150286 1.502864 0.578453 20 1.342097 13.42097 5.159861
25 0.234763 2.347631 0.68306 25 0.33181 3.318105 1.021711
30 0.304569 3.045685 0.676819 30 0.898544 8.985443 2.178649
PRSD = 2.05; PRE = 1.2 PRSD = 2.60; PRE = 2.30
(c) Industrial Waste Water
UV-Vis Data (@ 710 nm) Fluorescence data @ 710 nm
Conc.
(µM) SD % RSD% Relative
error
Conc.
(µM) SD % RSD% Relative error
5 0.115919 1.159191 1.639344 5 0.046828 0.468283 0.662252
10 0.109629 1.09629 0.775194 10 0.811212 8.112124 3.824092
15 0.471405 4.714045 2.222222 15 0.107002 1.070023 0.37831
20 0.813936 8.139359 2.877698 20 0.058246 0.58246 0.164745
25 0.768594 7.685943 2.173913 25 0.084013 0.840127 0.19802
30 0.335829 3.358291 0.791557 30 0 0 0
PRSD = 4.35; PRE = 1.74 PRSD = 1.84; PRE = 0.91

32
12. pH titration of PDI-OH
Fig S23. (Left) Effect of pH changes on the UV-Vis absorption spectrum of PDI-OH (10 μM) in water
(50% THF); (Right) Plot of absorbance at 543 nm and 710 nm vs. change in pH of the solution.
13. Competition Experiments
Fig. S24. (a) UV-Vis absorption (c) emission spectrum of PS-PDI showing the effect of various metal
ions (100 µM); Bar diagram showing the effect of other metal ions (100 µM) on the PS-PDI+Pd0 mixture
in the (b) absorption and (d) emission spectrum; 1 = L+Pd0+Zn2+; 2 = L+Pd0+Ni2+; 3 = L+Pd0+Hg2+; 4 =
L + Pd0 + Li+; 5 = L + Pd0 + K+; 6 = L +Pd0 + Cs+; 7 = L + Pd0 + Ba2+; 8 = L + Pd0 + Co2+; 9 = L + Pd0 +
Ca2+; 10 = L + Pd0 + Mg2+; 11 = L + Pd0 + Pb2+; 12 = L + Pd0 + Sr2+; 13 = L + Pd0 + Fe2+; 14 = L + Pd0 +
Cu2+.