detection of peanut allergens by means of new pcr based...
TRANSCRIPT

Università degli Studi di Parma
Facoltà di Agraria
PhD in Food Science and Technology
XX Cycle
Detection of peanut allergens
by means of new PCR based methods and ELISA
PhD Student: Elena Scaravelli
Tutors: Prof.ssa Rosangela Marchelli Dr. Arjon Van Hengel
Coordinator: Prof. Giuliano Ezio Sansebastiano


"The future belongs to those
who believe in the beauty of their dreams"
Eleanor Roosvelt
Questa tesi é dedicata alla mia famiglia
che ogni giorno ha creduto e supportato ogni mio sogno.
Elena

The investigations described in this thesis were carried out at the Department of Organic and
Industrial Chemistry, University of Parma (Italy) and at European Commission, Joint Research
Centre, Institute for Reference Materials and Measurements (Belgium).
The defence of the PhD thesis will be held in Parma on the 28th March 2008.

5
Contents
Scope 7
Chapter 1 Introduction 1.1 What is food allergy? 10
1.1.1 Prevalence of food allergies and the influence of exposure and individual susceptibility factors
1.2 What are food allergens? 14 1.2.1 Peanut allergens and peanut allergy 1.3 Product safety 17
1.3.1 Legislation concerning food allergens 1.3.2 Food industry and the management of food allergy risk 1.4 Detection methods 21
1.4.1 DNA and protein based detection methods 1.4.2 Innovative methods based on Peptide Nucleic Acids
1.5 References 30
Chapter 2 Development of three real-time PCR assays to detect peanut 37
allergen residue in processed food products
Chapter 3 The effect of heat treatment on the detection of peanut allergens 59 as determined by ELISA and real-time PCR
Chapter 4 Peanut allergen detection in chocolate and in products from the market 79
by means of ELISA and real-time PCR Chapter 5 A PNA-Array platform for the detection of hidden allergens 101
in foodstuffs
Chapter 6 Unconventional method based on circular dichroism to detect 113 peanut DNA in food by means of a PNA probe and a cyanine dye
Chapter 7 Light up probes in real-time PCR for peanut detection 127
Concluding remarks 141
Annex I 143
Acknowledgments 151
Curriculum Vitae 152


7
Scope
Peanut allergy is an increasingly important public health problem since the ingestion of even low
amounts of peanut can trigger severe allergic reactions. Thus it has a strong impact on the quality of
life of allergic consumers and their families who have to pay particular attention to avoid products
containing peanut traces. To be able to follow such an avoidance strategy they rely on the
information provided on the label of foodstuffs and therefore on the efforts of the food industry and
food control agencies in assuring the reliability of the labels. The availability of suitable food
allergen detection methods is one of the key points in the protection of the allergic consumer since
it allows identification of food products that can contain allergenic ingredients. The goal of this
thesis is therefore the design and development of new DNA based methods for the detection of
peanut allergen residues in real foodstuffs. This design of new methods embraces known techniques
like real-time PCR and innovative techniques based on Peptide Nucleic Acid (PNA) probes.
In Chapter 1 a general overview on the problems concerning food allergy as a public health
issue is given. Specific legislation regarding the declaration of food allergens on the label of food
products is presented and the effort of the food industry in the management of food allergy risks is
discussed in this section. The available techniques for the detection of food allergen residues are
presented, including new innovative approaches based on PNA.
In Chapter 2 experimental results are presented on the development of three real-time PCR
assays for the detection of peanut allergens in foodstuffs. The performances of the three assays are
described with regard to their specificity and sensitivity. The application of the techniques for the
detection of peanut DNA sequences in a model food matrix is presented.
In Chapter 3 evidence of the effect of heat treatments on the detection of peanut with either
the newly developed real-time PCR methods or commercially available ELISA kits is reported.
Results on the detection of peanut as impacted by heating of peanut kernels as well as heating of a
peanut-containing food matrix are described.
In Chapter 4 experiments are described that demonstrate the extended applicability of the
previously developed real-time PCR method to chocolate matrices. Since this real-time PCR
method is suitable for the analysis of different matrices that represent two important branches of the
confectionary industry (cookies and chocolate) a comparative study between the real-time PCR
method and two protein based commercial kits (ELISA and lateral flow device) used for the
analysis of two hundred market samples is described. The good agreement between the two
different methodologies is described by comparing the analytical results obtained and taking into
account the possible effects of the matrix (e.g. cocoa content).

8
In Chapter 5 the application of PNA combined with PCR is described. Two PNA probes
targeting peanut and hazelnut DNA sequences have been combined with microarray technology and
the results reported show the feasibility of applying this method to detect traces of these potentially
allergenic ingredients in food products.
In Chapter 6 an innovative method for the identification of peanut DNA in food which is
based on circular dichroism is reported. The PNAs for post PCR detection of peanut specific DNA
is described in combination an achiral 3,3’-diethylthiadicarbocyanine dye (DiSC2(5)). Experimental
evidence of the possible application of the optimized method to identify and quantify extracted and
PCR amplified peanut DNA from peanut and peanut-containing foods is reported.
In Chapter 7 preliminary results on the possible application of a PNA based probe, a so
called Light Up probe, in the real-time PCR detection of peanut are reported. Experimental data are
given to show that sensitivity and efficiency are comparable to that of current real-time PCR
detection systems but deeper studies are needed to assess and improve the specificity of the new
method.

Chapter 1
Introduction

Chapter 1
10
1.1 WHAT IS FOOD ALLERGY?
Food allergies are included within the broad spectrum of food-related illnesses that might be
defined as adverse reactions to food. In general adverse reactions to food can affect any individual
who consumes food but according to the mechanism provoking the symptoms they can be
distinguished in different categories (Figure 1). As a first distinction, they can affect people who do
not suffer from any disease related to food, or particular susceptible individuals. The ingestion of a
sufficient amount of toxins, microbiological contaminants, or pharmacologically active ingredients
can indeed lead to symptoms in everybody. In contrast to this the adverse reactions to foods which
only occur in sensitized individuals are defined as food hypersensitivity and only affect a fraction of
the population. Food hypersensitivity reactions may either result from psychological factors, that
lead to aversion, avoidance and psychological intolerance of a certain food, or from true physical
hypersensitivity to food components. When a true hypersensitivity occurs, it can be caused by
metabolic abnormality involving an enzyme deficiency (e.g. lactose intolerance) or by a hyper-
reactivity to specific substances that are present in food. The last group of food hypersensitivity
reactions includes food allergies. Food allergy is defined as “a hypersensitivity reaction initiated by
immunologic mechanisms” by the task force of the European Academy of Allergology and Clinical
Immunology (EAACI) (Johansson et al., 2001).
Food allergies can be divided into two subcategories according to the mechanism provoking the
allergic reaction (Taylor et al., 2001):
Adverse reaction to food
May occur in all individuals who eat a sufficient quantity
of the food
Occurs only in some susceptible individuals
Toxic Microbiological Pharmacological
Aversion, avoidance and psychological
intolerance
Food hypersensitivity
Food allergy
Non-allergic food hypersensitivity
IgE-mediated
food allergy
Non-IgE mediated
Food allergy
Unknown
mechanism
Metabolic
abnormality
Figure 1: A classification of adverse reactions to food (adapted from Jackson et al., 2003).

Introduction
11
▪ Non-IgE mediated allergies (delayed hypersensitivity reactions) are cell mediated, typically T
cell-mediated, allergies in which interactions between cells and chemical mediators, rather than
antibodies, are the key factors (Taylor et al., 2001). Symptoms develop hours or even days after
exposure to the allergenic food. The delayed reactions can lead to symptoms in different parts of
the body such as the skin, the gut and other organs, and probably play an important role when
food allergy is a factor in chronic conditions.
▪ IgE mediated allergies (immediate hypersensitivity) involve the production of antibodies known
as immunoglobulin E (IgE) and the establishment of a series of interactions between various cell
types and chemical mediators (Taylor and Hefle, 2002). The IgE reaction is immediate and can
affect the mouth, the gut, the skin and the respiratory tract. Food allergies involve abnormal
immunological responses to specific components of certain foods.
Antibodies (or immunoglobulins) are proteins produced by B type lymphocytes in response to the
components that are foreign to the body (known as antigens or allergens). Their normal function is
to protect us from parasitic infections. But, in the case of food allergies this mechanism leads to an
abnormal immunological response to certain foods in susceptible individuals. Allergens eliciting
such an inappropriate IgE formation can be found in food but also in pollen, mold spores, venoms,
dust mites and animal danders (Esch et al., 2003).
Human antibodies fall into five structural immunoglobulin classes (IgA, IgD, IgE, IgG and IgM),
only IgEs are an integral part of the immediate allergic response. IgEs, produced by B lymphocites,
have affinity for a specific part of the antigen molecule known as an epitope; the other end of IgE
molecules can be bound by immune cells including mast cells. When IgE molecules bind to the
mast cell surface, this cell becomes sensitised to the specific allergens that induced the production
Immediate allergic Immediate allergic
reaction with reaction with
inflammationinflammation
EosinophilsEosinophils
Toxic basic proteinsToxic basic proteins
Histamine, Histamine, leukotrienesleukotrienes,,
Prostaglandins,bradikininProstaglandins,bradikinin, ,
Platelet activating factorPlatelet activating factor
Mast cellMast cell
T lymphocytesT lymphocytes
B lymphocytesB lymphocytesILIL--4,4,
ILIL--1313
ILIL--3, IL3, IL--55
GMGM--CSFCSF
AllergenAllergen
IgEIgE
Figure 2: mechanism of an IgE-mediated allergic reaction (adapted from Jackson et al., 2003)

Chapter 1
12
of IgE. Once sensitized, exposure to the same food allergens on a subsequent occasion can trigger
an allergic reaction (Taylor et al., 2001). The allergen forms a bridge between two IgE molecules on
the mast cell surface causing the immediate release of chemical mediators, including histamine, and
the release of pro-inflammatory substances, including various leukotrienes and prostaglandins
(Figure 2). Other cell types that play a role in the allergic mechanisms are T lymphocites, that can
be activated by the presence of the allergen and release mediators. This in turn stimulates B
lymphocites to produce more IgE. Other mediators (IL-3, IL-5, GM-CSF, IL-4 and IL-13) activate
the local inflammatory process carried out by the eosinophils. The result of the whole process is an
immediate allergic reaction accompanied by an inflammation process that can result in localized
symptoms at the site of contact (e.g. oral allergy syndrome), localized gastrointestinal allergy with
nausea, vomiting or diarrhoea, skin symptoms like urticaria and eczema, respiratory symptoms like
rhinitis, systemic anaphylaxis with cardiovascular and gastrointestinal symptoms that sometimes
lead to shock (Jackson et al., 2003).
1.1.1 Prevalence of food allergies and the influence of exposure and individual susceptibility
factors
The prevalence of food allergy in the general population has been estimated to be around 1-2% in
adults and nearly 8 % in children (Sicherer et al., 2003, 2004; Helm et al., 2000; Ortolani et al.,
2001). Unfortunately food allergy appears to be an increasing phenomenon with peanut allergy
being of particular concern. A recent study highlighted a clear increase of the prevalence of peanut
allergy in young children (Hourihane et al., 2007).
Moreover, the prevalence of people who claim to suffer from some kind of food allergy reaches 30
% in Europe (Mills, van Ree IFR), while in another study 25 % of all adults claim to believe that
their children are afflicted with a food allergy (Sampson, 2005).
The frequency with which food allergies affects people within the total population remains an
estimate because of a lack of precise data. Diagnostic criteria, like a correct distinction between
immunological and non-immunological hypersensitivity are few examples of difficulties which
prevent a proper evaluation of prevalence level. Regarding the diagnosis of real food allergy, the
double-blind placebo controlled food challenge (DBPCFC) is currently the gold standard.
Nevertheless other diagnostic criteria, ranging from medical history, diet diaries, positive skin prick
test or IgE test are also applied (Sampson, 1999b). In recent years an enormous improvement has
been made on the characterization of many food allergens and on the general understanding on
adverse reaction to food (Sampson, 2004).

Introduction
13
Although further studies are still necessary to define rules governing the prevalence of allergy,
particular factors that appear to be important are health conditions, genetic predisposition and
exposure.
Exposure factors that can influence the prevalence of food allergies are the amount of allergens
consumed, the decreased or increased allergenicity due to the food processing, the possible presence
of cross reacting allergens. Exposure is considered an important determinant for the development of
food allergy as demonstrated by a different prevalence of sensitivity to certain foods according to
the age. In the US cows’ milk and eggs represent common allergenic foods for infants and young
children who often consume those foods, (Sampson and McCaskill, 1985) while crustacean
shellfish and fish are among the most common allergenic foods for adults (Sicherer et al., 1999,
2004). Another example of different exposure to the allergens is based on the eating habits. It has
been noticed that in an area where a certain food is commonly consumed, the risk of developing an
allergy to that food will be larger than in areas where the consumption of the particular food is more
rare. Fish is considered one of the most common food allergens in Nordic countries (Dannaeus A
and Inganãs M, 1981) while peanut allergy is high in the USA because of the high consumption
(Beyer et al., 2001).
Food processing and preparation may also affect the allergenicity. For example boiling peanut
results in a decrease of its allergenicity while roasting increases the allergenic potential (Maleki et
al., 2004). This is proposed to explain the lower prevalence of peanut allergy in China where
peanuts are mainly boiled or fried compared to the United States where they are consumed roasted
(Beyer et al., 2001).
Finally cross reacting allergens represent another important factor for food allergy. Exposure to
pollen can induce respiratory allergy to pollen, but because of cross reacting allergens food allergy
can also be induced as a result of pollen sensitisation. This is the case of ragweed pollen and melons
(watermelon, cantaloupe, honeydew), mugwort pollen and celery, and birch pollen and various
foods such as carrots, apples, hazelnuts, and potatoes (Van Ree and Aalberse, 1993; Ballmer-Weber
et al., 2000; Enberg et al., 1987; Eriksson, 1986). Although the true incidence and prevalence of
food-allergic diseases is not always precisely defined, it is clear that food allergy can affect the lives
of a considerable number of people and knowing the factors regulating this phenomenon could
contribute to protection of allergic people.

Chapter 1
14
1.2 WHAT ARE FOOD ALLERGENS?
Among the enormous variety of foods that form the human diet only a few are responsible for the
occurrence of allergic reactions. Food allergenicity is due to the presence of certain components of
the food that constitute the allergen repertoire. Although the vast majority of food allergens are
proteins, only a few of the numerous proteins present in foods are known to be allergens (Taylor,
2002).
Sensitization to food allergens can occur in the gastrointestinal tract (class 1 food allergy) or via
inhalant allergens (class 2 food allergy). The majority of food allergens provoking a class 1 food
allergy are proteins or gliyco-proteins with molecular weights ranging from 10 to 70 kDa. They are
usually quite stable to heat, acid and protease treatment (Sampson, 1999a). Allergenic proteins can
have very different biological properties: some are storage proteins, some are transport proteins or
regulatory proteins and enzymatically active proteins.
Most of the plant allergens are found in the cupin and prolamin superfamilies, or function in the
plant defense system. The cupin superfamily consists of the 7S (vicilins, such as Ara h 1, Jug r 2,
Ses i 3) and 11S (legumins, such as Ara h 3, Cor a 9, and Ber e 2) seed storage proteins. The
prolamin superfamily consists of cysteine-rich 2S albumin storage proteins (eg, Ara h 2, Jug r 1,
Ber e 1, and Ses i 2), nonspecific lipid transfer proteins (eg, Cor a 8, Mal d 3, and Pru av 3), and
cereal a-amylase and protease inhibitors. Many proteins generated by the plant defense system have
been found to be major allergens.
The allergenicity of each single protein is due to its IgE-binding epitopes. Depending on their
structure, two kinds of epitopes are described (Figure 3).
Conformational
Epitope
Conformational Epitope
SequentialEpitope
Sequential Epitope
Conformational
Epitope
Conformational Epitope
SequentialEpitope
Sequential Epitope
Figure 3: sequential and conformational epitopes. Conformational epitopes are destroyed when the native structure of a protein is modified by e.g processing, whereas sequential epitopes are not affected (adapted from Sampson, 2004)

Introduction
15
i) Sequential epitopes that are composed of short peptide fragments (12-18 amino acids) are
associated with the linear sequence of amino acid residues. They are believed to be responsible for
food allergies, that persist after processing because of their heat-stable epitopes. ii) Conformational
epitopes are associated with the 3-dimensional structure of the protein and are usually displayed on
the surface area of the molecule. In general, the stability of these epitopes to any type of food
processing or digestion is strongly associated with the native protein structure.
Previous studies have shown that individuals who possess IgE antibodies to sequential epitopes
react to the food in any form (eg, extensively cooked or partially hydrolyzed), whereas those with
IgE antibodies primarily to conformational epitopes appear to tolerate (small amounts) of the food
after extensive heating or partial hydrolysis because the tertiary structure of the protein is altered
and the conformational epitopes are destroyed (Urisu et al., 1997; Yamada et al., 2000).
The sensitivity of food allergy sufferers to specific food allergens varies widely between
individuals. In some cases very small amounts of the allergenic component can trigger an allergic
reaction, whereas in other cases less severe reactions occur after exposure to much higher doses.
This variability makes it difficult to estimate the lowest dose of a food allergen that is likely to
provoke an adverse reaction.
The notion of determining threshold levels for allergenic foods below which sensitised consumers
are not at risk of developing allergic reactions has attracted much attention from regulatory bodies,
consumer associations and industry throughout Europe. The best estimates of the no observed
adverse effect level (NOAEL) for allergic reactions are based on the results of experimental double-
blind food challenge studies but also for this experimental approach many variables can affect the
results. Such variables include the severity of the allergic condition, the symptoms used as the
clinical read-out system (subjective vs objective symptoms and their associated severity), the
different administration protocols, the challenge conditions and food preparations, the allergen
content and matrix of challenge foods, the total amount of administered dose and time frame,
reproducibility (false positives and negatives), the effects of co-factors (for example exercise,
alcohol, medication), the patient population (different geographical distribution of underlying
sensitisation rates for cross-reacting allergens) and on individual’s ethnicity.
The setting of minimal eliciting doses for various allergenic foods is further complicated by the fact
that for individual food allergic patients the minimal eliciting doses vary by several orders of
magnitude (Taylor et al., 2002c; Hourihane et al., 1997) and symptoms and eliciting doses can
change over time for each individual. Thus, any value for NOAEL obtained will not necessarily
represent all people in the population that are allergic to the same food. For example, the minimal
Chapter 1
16
eliciting doses for peanut that can provoke mild adverse reactions in a group of peanut allergic
individuals range from 2 to over 50 mg (Hourihane et al., 1997).
1.2.1 Peanut allergens and peanut allergy
Peanuts are among the most allergenic foods known. The International Union of Immunological
Societies Nomenclature Subcommittee recognizes 8 allergenic proteins in peanuts, from Ara h 1 to
Ara h 8. Among these 8 proteins, Ara h 3 and Ara h 4 are nearly identical isoforms and Ara h 6 is
highly homologous to Ara h 2 (Koppelman et al., 2003; de Leon et al., 2007). The 3 major
allergens, Ara h 1-3, are comprised of vicilin, conglutin, and glycinin seed storage proteins,
respectively (de Leon et al., 2007). Two of the 8 identified peanut allergens, Ara h 5 and Ara h 8,
are not storage proteins but are implicated with pollen-associated food allergy and are a profilin and
a Bet v 1–like protein respectively (Mittag et al., 2004). The allergenic proteins have a high
abundance in peanut. Peanut contains around 29% protein and the major allergen Ara h 1 accounts
for approximately 20% of this total protein content, while Ara h 2 accounts for around 10% (van
Hengel et al., 2007a). Moreover, Ara h 1 and 2 show resistance to heat and enzymatic digestion
(Burks et al., 1998).
Because of the high allergenic potential of peanut, peanut allergy has become a real public health
problem, attracting the attention of food control agencies, food industry and the scientific
community. Peanut allergy is typically life long and sensitive individuals can occur in symptoms
ranging from a mild urticaria to life threatening anaphylaxis (Yunginger et al., 1988; Bock and
Atkins, 1990). Food anaphylaxis fatalities registries reported peanut as the cause for most of the
reported deaths attributed to food allergies over the last 5-7 years (Bock et al., 2007; Pumphrey and
Gowland, 2007). Moreover in the USA and in Europe recent studies showed that peanut allergy is
an increasing phenomenon especially among children. The latest estimates of the prevalence levels
of peanut allergy for children are in the region of 1% (Sicherer et al., 2003; Grundy et al., 2002;
Hourihane et al., 2007). It has been estimated that for only 20% of young children by school age
food allergy resolves (Hourihane et al., 1998; Skolnick et al., 2001).
Prevalence and epidemiologic characteristic of peanut allergy might be explained by general genetic
and environmental factors that are already known to influence food allergy.
The prevalence of peanut allergy varies between countries and seems to be related to consumption
measured on a per capita basis. In China for example, peanut allergy prevalence is significantly
lower than in the United States (Beyer et al., 2001). The protein composition of various peanut
species from around the world has been studied and found to be rather constant (Koppelman et al.,

Introduction
17
2001). But, a number of factors related to harvesting and processing of peanuts may have a
significant effect on the allergenic properties of various peanut products. Studies on the processing
of peanut have shown a major effect on the amount of extractable protein and, in particular after
roasting, peanuts have shown increase in allergenicity compared to boiling or frying (Beyer et al.,
2001; Hinds et al., 1997).
Since peanut is a widely used in food preparation and pre-packed foodstuffs, allergic patients are
often exposed to peanut allergens and unfortunately, the annual incidence rate of accidental
ingestion of peanut was found to be 14.3% among schoolchildren in Montreal, Quebec, Canada (Yu
et al., 2006). Trace amounts of undeclared peanut present in food products can be hazardous to
peanut allergic individuals. Most studies have shown that low amounts of peanut protein (1-3 mg)
are sufficient to trigger the objective allergic symptoms (Taylor et al., 2002c; Morisset et al., 2003)
while only 200 µg can be sufficient to elicit a mild, subjective allergic reaction (Tariq et al., 1996;
Wensing et al., 2002). Given the high allergenicity, the incurable nature of food allergy and its
potential life-threatening consequences, the management of food allergy relies heavily on a strict
avoidance diet that has to be implemented by food allergic individuals and their families. These
food and social restrictions have consequently a strong impact in the quality of life of allergic
consumers and their care givers.
1.3 PRODUCT SAFETY
1.3.1 Legislation concerning food allergens
World-wide legislative initiatives have been aimed at regulating food products labelling with
particular concern for food allergens.
Within the European Union, a fundamental document on the protection of food consumers is the
White Paper on Food Safety, presented by the Commission in 2000 (European Commision, 2000).
It assures the European citizen that having the highest standards of food safety is a key policy
priority for the Commission. An important issue dealt with in this document is the concept of
traceability throughout the feed and food chain: at every level of the production flow, from raw
material down to the supermarket shelf. Furthermore adequate records should be kept to trace the
origin of a certain product at any time and in particular to withdraw any feed and food from the
market whenever a risk to the health of consumers can be envisaged. In accordance to this strategy
food labelling legislation has been implemented in order to provide consumers with clear and
detailed information on the composition of the foods they eat.

Chapter 1
18
Directive 2000/13/EC describes which type of information is required on the label of food products
(European Parliament and Council, 2000). With regard to food allergens, this Directive contains a
list (Annex IIIa) naming twelve major allergenic foods whose presence in foodstuffs has to be
declared on the label of such food products (cereals containing gluten, crustaceans, eggs, fish,
peanuts, soybeans, milk, tree nuts, celery, mustard, sesame and sulphites). A new Directive,
2003/89/EC, was introduced as an amendment of Directive 2000/ 13/EC and abolishes “25 % rule”
for compound ingredients, ensuring that the components of ingredients forming less than 25 % of
the final product are indicated on the label in order to guarantee that all ingredients should be
declared on the labels, regardless of the quantity contained in the finished food (European
Parliament and Council, 2003). Food labelling requirements concerning food allergens were also
modified in order to ensure that derogations to the obligatory declaration of food ingredients were
not applicable to those ingredients (listed in Annex IIIa) that may trigger food allergic reactions.
More recently, Commission Directive 2006/142/EC announced the inclusion of lupin and molluscs
(European Parliament and Council, 2006) into the list in Annex IIIa of Directive2003/89/EC. The
above mentioned directives only refer to allergenic ingredients that are known to be used in the
production (and present in a finished food product) and do not provide threshold levels below which
food products are exempt from the labelling requirements (except for sulphur dioxide and sulphites,
where such a threshold level is set at 10 mg/l). Therefore and the accidental presence of allergenic
ingredients in food products is not covered. In 2005, Directive 2005/26/EC (European Parliament
and Council, 2005) established a list of food compounds that were provisionally excluded from the
labelling requirement because it was considered that they were not likely, to trigger adverse
reactions (e.g. wheat base glucose syrup including dextrose, whey or nuts used in distillates for
spirits, mustard seeds and oil). The provisional exceptions that were granted expired on 25
November 2007. Therefore, after analysis of requests for permanent exemptions from the labelling
according to Annex IIIa, a new directive (2007/68/EC) was introduce to update and finalize this
annex (European Parliament and Council, 2007). For specific products a permanent exemption was
accepted (e.g. whey or nuts used in distillates for spirits are permanently exempted but not mustard
seeds and oil).
In order to cover with the legislation also the possible inclusion of allergens in food products
resulting from adventitious contamination Directive 2001/95/ EC on product safety (European
Parliament and Council, 2001) plus Regulation 2002/178/EC on food safety (European Parliament
and Council, 2002) have to be considered. Foodstuffs containing allergenic ingredients not
indicated on the label are therefore considered unsafe for a specific category of consumers
(consumers with a food allergy) and, consequently, should not be placed on the market.

Introduction
19
Food allergy is considered a worldwide health problem and as Figure 4 shows, many countries have
legislative tools in place that require mandatory labelling of certain allergenic foods. For example in
the USA, a new labelling law, the Food Allergen Labelling & Consumer Protection Act (FALCPA),
was introduced at the start of 2006 giving a clear definition of “major allergen” and listing the “Big
8 allergens” that are required to be labelled (Food Allergen Labelling and Consumer Protection Act,
2004).
1.3.2 Food industry and the management of food allergy risk
New legislations in many countries concerning food labelling, now require the mandatory
declaration of specific allergenic ingredients in the manufactured products. However, risks of the
presence of food allergens are not only associated to the use of that specific food as ingredient;
allergenic residues can be present through cross-contact during manufacturing or because of their
presence in raw materials.
Food allergen risk management aimed at the protection of sensitized consumers. This can lead to
the use of precautionary labelling or the implementation of specific management risks for food
allergens. From a manufactures point of view this means taking actions in order to reduce the
chance that allergens unintentionally end up in food products.
Guaranteeing the total absence of such constituents from a product for which they are not used as
ingredients is often practically impossible or quite expensive for the food industry. Manufactures
and retailers, therefore resort to the use of precautionary warnings (eg. “may contain peanut” or
“this product is made in a factory that also produces peanut-containing products”). Allergic
individuals are often unsure about the risk posed by food products carrying precautionary labels.
Furthermore their frequent use considerably reduces the food choices while it does not clearly
Buckwheat
EggMilkPeanutCereals containing gluten
Tree nuts
Crustaceans*
Fish
Soybean
Sesame seedSulphites
MustardCelery
Mollusks*
Lupin
CanadaAustralia
New Zealand
USA
Japan & South Korea
European
Union
Buckwheat
EggMilkPeanutCereals containing gluten
EggMilkPeanutCereals containing gluten
Tree nuts
Crustaceans*
Fish
Soybean
Crustaceans*
Fish
Soybean
Sesame seedSulphitesSesame seedSulphites
MustardCeleryMustardCelery
Mollusks*
Lupin
Mollusks*
Lupin
CanadaAustralia
New Zealand
USAUSA
Japan & South Korea
European
Union
Figure 4: Food allergens that currently need to be declared on the label of packaged foods, *In the USA and Canada crustaceans are grouped with shellfish and therefore include several types of molluscs. In Australia, New Zealand and the EU crustaceans do not include molluscs (adapted from van Hengel, 2007).

Chapter 1
20
assure presence of absence of the offending food. On the other side, by heeding the advice of
precautionary labels allergic consumers put themselves at risks (Hefle et al., 2007; van Hengel,
2007b).
A better approach would be the analysis of the risk arising from residual allergens and subsequently
a quantitative risk assessment. The process of risk assessment is conventionally divided into four
separate stages: hazard identification, hazard characterization, exposure assessment and risk
characterization (Codex Alimentarius Commission, 2003).
In the case of food allergy the hazard under consideration is any adverse reaction to food mediated
by the immune system, namely food allergic reactions.
The second step is the hazard characterization which consists of establishing the relationship
between the triggering dose and the response it produces. Food allergens differ from materials for
which a conventional toxicological risk assessment can be made because they do not provoke
reactions in the general population. Food allergens trigger the reaction to a subset of the population
but not at a similar dose ingested. Not accurate data is available with regard to the highest dose that
does not elicit an allergic reaction (NOAEL), since sufferers react differently to a defined dose and
the relationship between dose and severity varies between individuals. Once the hazard has been
characterised and a NOAEL can be defined, exposure assessment would be required. The usual
measure used for purposes of risk assessment is the amount of allergen that can be present in a
portion of food, although other issues should also be considered like the period of intake of allergen
or the possibility of cross-reactions.
Practical measures that have to be taken in risk management need an integrated approach along all
stages of production. Such measures can include the selection of non-allergenic ingredients in
innovative products, the control of allergens in the supply chain, an inclusion of allergens in the
HACCP plans (Hazard Analysis of Critical Control Points), the implementation of correct labelling
that ensures that appropriate allergen information is made available to the consumer.
Along the phases of the production chain, a number of points might be identified where detection of
allergenic residues could provide valuable information required to assess the risk arising from the
inadvertent presence of the allergenic ingredient. If defined requirements are not met, particular
procedure like special cleaning should be applied (Crevel et al., 2007, Hefle and Koppelman, 2006).

Introduction
21
1.4 DETECTION METHODS
Methods for the detection of allergenic residues are required for a variety of purposes. In food
industry, detection methods can be included in the HACCP plan in order to assess the extent of
cross contact at different points of the food production chain or for investigation in case of
accidental presence of the allergenic residues in foodstuffs. Public authorities represent another
user. They need to check for compliance with legislation with regard to the presence of allergen
traces in products that are not supposed to contain them. Different users might require different
methods with different characteristics, with respect to detection limits, quantitation, robustness and
ease-of-use.
Various food allergens detection methodologies already exist and are based on diverse technologies
and can be designed for different purposes. The target molecule represents the first main distinction
being either protein or DNA. Detecting proteins is the most common approach since this directly
detects the molecules responsible for triggering allergic reactions. However, detection of allergenic
proteins or marker proteins is not necessarily the only way to demonstrate the presence of the
allergic compound, and the detection of another type of marker molecule like DNA can be an
alternative. The most common methods that are currently employed for the detection of food
allergens are listed in section 1.4.1. Section 1.4.2 deals with innovative DNA based methods that
can be employed to detect food allergens by utilizing Peptide Nucleic Acids (PNAs).
1.4.1 DNA and protein based detection methods
Protein based detection methods:
▪ RAST/EAST inhibition : RAST (radio-allergosorbent) or EAST (enzyme-allergosorbent) assays
are in vitro assays, designed for the detection of allergen-specific human IgE antibody. They
are both based on the use of human sera from allergic patients and are mainly applied in the
diagnosis of food allergy (Holgate et al., 2001). In addition to their clinical application,
protocols of RAST and EAST inhibition tests have been adapted to detect and quantify the
residual food allergens in acqueous extract of a wide range of foodstuffs (Nordlee et al., 1981
Oldaeus et al., 1991). RAST and EAST inhibition analyses are based on a competitive binding
of human IgE. The principle of the methods is based on an allergen which is bound to a solid
phase. This allergen functions as an antigen for specific human IgE that can bind to it. This
binding is inhibited by free antigen/allergen present in the sample solution. Subsequent detection
of bound IgE is based on anti-IgE antibodies labelled with an isotope (RAST) e.g. 125I, or an

Chapter 1
22
enzyme (EAST). The quantitative nature of this inhibition permits an assessment of the amount
of allergen in the extract. Although the limit of detection of RAST was shown to be around 1
mg per kg (Fremontet al., 1996; Koppelman et al., 1999), standardization and commercialization
of this assays is prevented by the limited availability of human serum and its high variability
(Nordlee et al., 1995).
▪ Immunoblotting: One-dimensional sodium dodecyl sulphate (SDS) polyacrylamide gel
electrophoresis (PAGE) followed by immunoblotting represents the standard procedure to
separate proteins and identify allergens. After separation according to their molecular mass the
proteins are transferred from the gel onto a membrane and detected with radio- or enzyme-
labelled antibodies. This method has allowed the detection, identification and characterization of
a large number of individual allergens (Pastorello and Trambaioli, 2001). Detection of allergenic
molecules in food products is another area where this SDS PAGE followed by immunoblotting
can be applied. Detection limits (LOD) that can be achieved with this application are in the
region of 5 mg/kg (Scheibe et al., 2001). The major disadvantages of SDS-PAGE and
immunoblotting is the reliance on IgE from human sera which can be quite variable and might
cross-react with other non specific-food ingredients. However, after an allergen has been
characterized, human IgE can be replaced by antibodies raised in animals.
▪ Dot immunoblotting: This represents a simpler and less expensive way to screen food samples
for the presence of food allergens. The detection procedure is identical to the one described
above but the sample is directly spotted onto a membrane without any pre-separation of the
proteins. The intensity of the dot is proportional to the amount of antigen/allergen, which allows
a semi quantitative detection of the target protein or mixture of proteins (e.g. peanut) in food.
Reported LODs are in the region of 2.5 mg/kg (Blais and Philippe, 2001). A disadvantage of
this method is the possibility of false positive results because of cross-reactivity of the
antibodies with matrix components.
▪ Rocket immuno-electrophoresis: This is an analytical method based on a gel containing
antibodies. Sample proteins migrate according to their electrophoretic mobility and when
antigen-antibody complexes form in the gel, this leads to the formation of precipitates in the
shape of a rocket. Since the formation of such complexes will only take place at a constant
antigen/antibody ratio, . the height of the rocket is proportional to the amount of antigen in the
sample.

Introduction
23
Applications of rocket immuno-electrophoresis in the detection of allergens in various food
products have been reported (Malmheden Yman et al., 1994; Holzhauser et al., 1998) with
LODs ranging from 2.5 to 30 mg/kg. Rocket immuno-electrophoresis is not used widely
because of the laborious gel preparation and immuno-staining procedures.
▪ ELISA: Enzyme-linked immunosorbent assay (ELISA) is probably the method that is used most
commonly by the food industry and official food control agencies. In the food industry, ELISA
tests are usually used to detect antigens such as allergens, pesticides, mycotoxins or pathogens
in a sample. This test is based on the use of an enzyme linked to an antibody to detect the
formation of the complex between antigen and antibody. The enzyme produces a colorimetric
reaction and a standard curve generated with the use of allergen standards allergen with known
concentrations allows (semi)quantification of allergens in food products.
Two types of ELISA systems are employed for the detection of food allergens, competitive
ELISA and sandwich ELISA (Figure 5). Almost all commercial allergen ELISA test kits use
the sandwich technique.
Sandwich ELISA: A capture antibody is
immobilized on a solid phase, which is usually
a microtiter plate or a multiple well strip, and it
specifically binds (allergenic) proteins. A
second protein-specific antibody labelled with
an enzyme responsible for a colorimetric
reaction, detects the first antigen-antibody
complex. The concentration of the
antigen/allergen is proportional to the colour
intensity, which can be measured with a
spectrophotometer. Sandwich ELISA methods
have been developed for the detection of
several different food allergens (Koppelman et
al., 1999; Mäkinen-Kiljunen and Palosuo,
1992; Hefle et al., 1994; Holzhauser et al.,
1999) and numerous commercial test kits have become available during the last decade.
Competitive ELISA: This type of ELISA competitive operate on the basis of competition
between the horseradish peroxidase (HRP) enzyme conjugate and the antigen in the sample for a
limited number of specific binding sites fixed on the precoated microplate. The bound enzyme
Sandwich ELISA Competitive ELISA
E
A
Legend:
Capture antibody
Antigen or allergen
Enzyme-linked
detector antibody
Substrate
A
A
E
A
E
A A
A A
A A
Conjugate
Sandwich ELISA Competitive ELISA
E
A
Legend:
Capture antibody
Antigen or allergen
Enzyme-linked
detector antibody
Substrate
A
A
E
A
E
A
A
E
A
E
A
E
A
E
A A
A AA A
A AA A
Conjugate
Figure 5: on the left mechanism in a typical sandwich ELISA; on the right, steps of a competitive ELISA.

Chapter 1
24
conjugate is detected by the addition of a substrate which generates a colorimetric reaction.
Therefore the absorbance is inversely proportional to the concentration of antigen in the sample.
This technique is often preferred for the detection of relatively small proteins. Competitive
ELISA systems have been described for the detection of several food allergens (Koppelman et
al., 1999; Hlywka et al., 2000; Mariager et al., 1994; Plebani et al., 1997; Yeung and Collins,
1996).
Recent validation studies (Whitaker et al., 2005; Park et al., 2005; Poms et al., 2005) have
shown that all ELISA test kits studied were capable of correctly identifying test samples
containing 5 mg peanut per kg food matrix.
However, variables like the type of test kit, the food matrix, the spiking method, the material
used for spiking, as well as food processing methods can affect the detection of allergenic
ingredients in food products (Whitaker et al., 2005; Park et al., 2005; Poms et al., 2005; Koch et
al., 2003).
▪ Dipsticks: Lateral flow immunochromatographic assays, commonly known as dipsticks are fast
and easy to use devices that can also be used to detect the presence of allergens in food in non-
research settings. This methodology is also based on an immunological detection of proteins that
are captured by specific antibodies, conjugated to coloured particles. The success of this
methodology is based on the fast flow of the antibody-antigen complex along a test strip
(nitrocellulose or nylon). The complex is captured by a zone of antibodies specific for the
antigen along the strip, which results in the development of a visible line. Dipsticks are used as
qualitative methods, although the intensity of the band which is correlated to the concentration
of antigen in the sample, suggesting a limited potential for (semi) quantification.
A validation of 2 study of types of commercially available dipsticks in which 18 laboratories
participated has shown that the LOD of those products lies between 5-20 mg/kg (van Hengel et
al., 2006). Therefore, the sensitivity of dipsticks is higher than the one that can be achieved with
ELISA test kits.
DNA based detection methods:
▪ PCR: Polymerase Chain Reaction (PCR) -based methods are characterized by three consecutive
steps. Firstly the DNA is extracted and purified, then specific DNA sequences are amplified and
finally the amplified products (amplicons) are detected. This approach is currently used for the
detection of microbial pathogens (Malorny et al., 2003), genetically modified crops in food
products (Anklam et al., 2002, Holst-Jensen et al., 2003) and food allergens in food products

Introduction
25
(Poms et al., 2004). In food allergens detection, the target DNA is species-specific and functions
as a marker for the presence of a particular food ingredient.
The invention of the PCR in 1983 is attributed to Dr. Kary Mullis. It involves an enzymatic
amplification of nucleic acid sequences via repeated cycles of DNA denaturation,
oligonucleotides annealing and DNA polymerase extension. The oligonucleotides or primers can
anneal to complementary single stranded DNA obtained by heat denaturation of double-stranded
DNA. The DNA polymerase enzyme can add extra nucleotides to the primer by using the
genomic DNA as a template. Subsequent heat denaturation and annealing of the second primer
to the newly synthesised single-strand DNA allows synthesis of a complementary DNA strand.
After several cycles the amplified product can be visualised in the following manners:
By gel electrophoresis: This only provides information on the size of the amplified product
but does not reveal the identity of the PCR product.
By Southern blotting: There the amplified product is detected after hybridization to a
labelled version of the target DNA which provides a means for identification of the amplified
product.
In general PCR results are qualitative and only DNA sequencing allows a complete
identification of a PCR product. A (semi-)quantitative approach can be achieved by two more
recent PCR methodologies: PCR-ELISA or real-time PCR.
� PCR-ELISA: after PCR amplification, the products are detected with an ELISA protocol. The
amplified DNA is labelled either by the use of a modified primer that will allow binding of the
DNA to coated microtiter plates, or by the incorporation of labelled nucleotides (e.g. DIG
labelled UTP). In the first case, binding of the DNA is followed by denaturation and subsequent
hybridization with a labelled DNA probe. Enzyme-linked antibodies are then used to detect the
target DNA (which is present as a complex of amplified target DNA – labelled probe – enzyme-
linked antibody). When labelled nucleotides are incorporated during PCR, the DNA can be
bound to a solid phase and enzyme-linked antibodies capable of binding the labelled nucleotides
are then used for detection. The colour development that is driven by the enzymatic reaction
can be measured and provides a way for semi-quantification of the target DNA. This method
combines the advantages of PCR and ELISA, but the combination of the two techniques makes
it also more laborious and time-consuming.
� Real-time PCR: This is based on the measurement of a fluorescent signal that increases during
the amplification of PCR products. Most of the commonly used real-time PCR assays are based

Chapter 1
26
on Taqman chemistry (Figure 6). The tube in which the PCR reaction takes place contains a
target-specific oligonucleotide probe with a fluorescent reporter dye and a quencher attached to
it. The proximity of the quencher to the dye prevents the detection of fluorescence. But, when
the probe hybridizes to the amplified target DNA, the 5’ exonuclease activity of the polymerase
cleaves the probe and thereby separates the quencher from the dye which is displaced by the
newly synthesised DNA strand. The fluorescence of the free reporter dye can then be measured
and it is proportional to the amount of amplified products. The sigmoid curve obtained when the
fluorescence level is plotted against the number of amplification cycles is used to quantify the
target DNA present in the sample before the reaction. Quantification is based on the so-called
threshold cycle (Ct), the PCR cycle at which the fluorescent signal can be distinguished from
the background noise. Real-time PCR methods allow the detection of allergenic ingredients in
food products at a level of 10 mgkg-1 or lower (Stephan and Vieths, 2004; Hird et al., 2003;
Scaravelli et al., in press). However, the robustness and sensitivity of the method remains to be
proven in proper method validation trials.
Biosensors: Biosensors are analytical devices that consist of a biological recognition element (e.g.
cells, proteins, oligonucleotides) that are in direct contact with a sensor chip. Upon contact with
target molecules a signal is generated which is further processed to give an output that is
proportional to the concentration of a specific analyte. The advantages of this technology are the
short analysis time and the high degree of automation. The sensitivity of this method largely
depends on the characteristics of the sensor chip. LODs in the range of 0.45 to 2.0 have been
described for the detection of milk proteins in food products (Muller et al., 2004; Indyk et al.,
2004). In addition to this, biosensors can be used to discriminate between intact and degraded
protein/allergen (Muller et al., 2004; Dupont et al., 2004).
Proteomic approach: the proteome is the collection of all protein components present in a complex
system. Most food allergens are components of a proteome and since they are usually glycoproteins,
R Q
5’
5’5’
3’
3’
5’
R
Q
5’
5’5’
3’
3’
5’5’
5’
3’
R Q
5’3’
5’
R Q
5’
5’5’
3’
3’
5’
R
Q
5’
5’5’
3’
3’
5’5’
5’
3’
R Q
5’3’
5’
Figure 6: steps in real-time PCR based on TaqMan probes. 1: annealing of primers and probe but reporter signal is quenched by the quencher (Q) when the probe is intact; 2: displacement of the probe by DNA polymerase activity; 3: cleveage of the probe and generation of the reporter (R) signal (adapted from Applied Biosystem)

Introduction
27
post translational processing like glycosylation does affect the allergen proteome. Proteomic
research is usually based on separation of proteins and the identification of individual proteins.
Many improvements in separation and identification of proteins, such as two-dimensional
electrophoresis, nano-liquid chromatography and mass spectrometry, have rapidly been achieved
(Hirano et al., 2004). These techniques have enabled a high throughput analysis of complex protein
mixtures. At present proteomic research is mainly focused on the identification of allergens (Natale
et al., 2004), but it is expected to be used to study allergen modifications and allergen detection in
food products. No clear data on the limit of detection of allergens are currently available.
1.4.2 Innovative methods based on Peptide Nuclei Acids ( PNAs)
Peptide Nucleic Acids (PNAs), are synthetic achiral oligonucleotide analogues in which the sugar
phosphate backbone is replaced by a polyamide chain covalently linked to the nucleobases (Nielsen
et al., 1991). More in details, the negatively charged sugar phosphate backbone is replaced in the
PNA structure by a neutral pseudo-peptide N-(2-aminoethyl)glycine units linked by amide bonds
and the four nucleobases (i.e. adenine, cytosine, guanine and thymine) are linked to the backbone
via methylene carbonyl linkages at equal distance as in DNA bases. Thus, PNA contains the same
number of backbone bonds between bases (i.e. six) and the same number of bonds between the
backbone and the bases (i.e. three), as in DNA. The synthesis of PNA oligomers follows the
established synthetic procedure commonly employed for the peptide synthesis.
Thanks to its unique structure PNAs offer higher affinity and specificity in recognizing and
hybridizing DNA sequences as compared to DNA-DNA duplexes:
- PNA-DNA duplexes show a higher thermal stability than DNA-DNAes duplex: the
hybridization in this case obeys the Watson-Crick rules through formation of hydrogen bonds
(Egholm et al., 1993) and it is not affected by the electrostatic repulsion which normally occurs
during hybridization between the negatively charged molecules of DNA. This higher thermal
NH
N
O
B
O
n
O OP
O
B
O
O n
** *
*
D N A P N A
Figure 7: Chemical structure of DNA and PNA

Chapter 1
28
stability leads to an average increase of the melting temperatures of 1°C per base pair, compared
to the corresponding DNA/DNA duplex;
- PNA-DNA hybridization is independent from the salt concentration of the hybridization
solution (Orum et al., 1995), thanks to the neutral backbone of PNA;
- thermal stability of the PNA/DNA duplexes is strongly affected by the presence of mismatches.
The presence of one single mismatch destabilizes the PNA/DNA duplexes much more than the
corresponding DNA/DNA duplexes making the PNA more sequence selective for specifically
recognising its complementary sequence (Hyrup et al., 1996);
- PNA-DNA orientation (Figure 8): parallel and
antiparallel orientations of binding may occur,
but antiparallel binding is preferred on
account of its higher thermal stability. PNA
can bind a target double stranded DNA in
other different ways: triplex formation, duplex
invasion and triplex invasion. In particular
triplex structures produce a great increase in
the melting temperature of the PNA/DNA/PNA complexes (a T10 PNA can bind an A10 DNA
forming a triplex with Tm=72°C);
- high biological stability: PNA does not undergo degradation by nucleases and proteases
Due to its hybridization properties, PNA has been used in many biomedical and diagnostic
applications.
As for the biomedical applications, the ability of PNA in selectively hybridizing with high stability
not only DNA but also RNA complementary sequences has been successfully employed in
antisense strategies to block the translation of specific mRNA into proteins. A large number of
diagnostic applications have been developed so far employing PNAs in combination with other
analytical methods, in combination with PCR methods, in PCR clamping and in real-time PCR
experiments (Kyger et al., 1998). The so-called light-up probes, consisting of a PNA
oligonucleotide linked to an asymmetric cyanine dye, has recently been developed for sequence
specific detection of DNA from Salmonella via post PCR analysis and from Yersinia enterocolitica
via real-time PCR (Wolffs et al., 2001; Isacsson et al., 2000). Moreover, in clinical diagnostics
some commercial kits for qualitative and quantitative detection of viral DNA (cytomegalovirus and
SARS coronavirus) based on the combination of LightUp probe Technology and PCR are already
Figure 8: Parallel and antiparallel orientation of the PNA/DNA duplexes
C-TermN-Term
ANTIPARALLEL
PNA
DNA3’ 5’
N-Term C-Term
PARALLEL
PNA
DNA5’ 3’
C-TermN-Term
ANTIPARALLEL
PNA
DNA3’ 5’
N-Term C-Term
PARALLEL
PNA
DNA5’ 3’

Introduction
29
available (ReSSQ® Assays, LightUp probe Technologies, Huddinge, Sweden,
http://www.lightup.se/). PNA has been also successfully incorporated in molecular beacons for the
detection of specific DNA target sequences (Kuhn et al., 2001, 2002) and in GMO detection
combined with HPLC technology (Totsingan et al., in press). A molecular beacon consists of a
hairpin loop structure, where the loop portion is a probe sequence that is complementary to a target
sequence in a nucleic acid. A reporter fluorophore is attached to one end and a quencher to the
other: in the hairpin loop structure the molecular beacon is not fluorescent whereas, upon
hybridization to a complementary structure, the fluorophore and the quencher are separated, giving
rise to a fluorescent signal.
The incorporation of PNA in light up or molecular beacons probes results in higher hybridization
efficiency and specificity and they can be applied in real-time PCR or for post-PCR analysis thanks
to a lower influence of the salt concentration and to their stability to nuclease and protease.
Sequence identification with PNA probes are also employed in MALDI-TOF mass spectrometry
(Griffin et al., 1997) and capillary electrophoresis (Igloi, 1999). Several PNA based biosensors have
been also developed and employed for different applications (Wang, 1998): among these
electrochemical biosensors, quartz crystal microbalance (QCM) transducers and surface plasmon
resonance (SPR) spectroscopy were the most successful.
Methods for genotyping single nucleotide polymorphisms (SNPs) are important in many biomedical
applications and especially for prediction of hereditary diseases; PNAs in this case have been
employed in combination with single-stranded DNA specific nucleases (i.e. nuclease S1). The
DNA/PNA duplexes with a mismatch are hydrolyzed by this nuclease, whereas fully-matching
sequences are kept intact. This difference is visualized by adding 3,3’-diethylthiadicarbocyanine,
which changes its colour from blue to purple upon binding to DNA/PNA duplexes (Komiyama et
al., 2003; Wilhelmsson et al., 2002).
Food diagnosis is also one of the field in which PNA probes have been employed.
The detection of a single molecule of DNA coming from transgenic maize was achieved with a new
laser based fluorescence technique utilizing PNA probes (Castro et al., 1997). Rapid detection,
identification and enumeration of microbial contamination in bottled water have been achieved with
the use of PNAs to develop a new chemiluminescent in situ hybridization (CISH) method (Stender
et al., 2000). Moreover PNAs have been applied to the detection of specific sequences related to
GMO and food allergens analysis by its combined use with HPLC (Lesignoli et al., 2001; Germini
et al., 2005a).
Another approach in food analysis which has been recently developed with the combined use of
PNAs is the microarray technology. The microarray system consists of immobilized probes

Chapter 1
30
spatially located on planar surfaces, microchannels, microwells or arrays of beads which are then
hybridized with the target molecule (fluorescently or radioactively labelled).
Array based systems have been employed so far for studying the biochemical properties and
activities of target proteins printed on the array, the interactions with other proteins, nucleic acids,
lipids, small molecules and other biomolecules. In addition, DNA microarrays have been produced
with synthetic oligonucleotides, PCR products or cDNAs in order to implement expression studies
or mini-sequencing reactions. In order to improve the sensitivity and reduce time consuming, PNAs
have been substituted to common oligonucleotides in GMO detection or food authenticity by post-
PCR analysis (Germini et al., 2004, 2005b). Furthermore, recent studies highlighted the possibility
to reveal DNA hybrid formation by label-free detection using both MALDI-TOF (van den Boom et
al., 2004; Edwards et al., 2005) and Surface Plasmon Resonance techniques (Su et al., 2005;
Spadavecchia et al., 2005).
References
Anklam E, Gadani F, Heinze P, Pijnenburg H and Van Den Eede G (2002) Analytical methods for detection and determination of genetically modified organisms in agricultural crops and plant-derived food products. Eur Food Res Technol, 214:3.
Ballmer-Weber B K, Vieths S, Luttkopf D, Heuschmann P and Wuthrich B (2000) Celery allergy confirmed by double-blind, placebo-controlled food challenge: a clinical study in 32 subjects with a history of adverse reactions to celery root. J Allergy Clin Immunol, 106:373–378.
Beyer K, Morrow E, Li X M, Bardina L, Bannon G A, Burks A W, et al. (2001) Effects of cooking methods on peanut allergenicity. J Allergy Clin Immunol, 107:1077-81.
Blais B W and Phillippe L (2001) Detection of hazelnut proteins in foods by enzyme immunoassay using egg yolk antibodies. J Food Prot, 64:895.
Bock S A and Atkins F M (1990) Patterns of food hypersensitivity during sixteen years of double-blind, placebo-controlled food challenges. J Pediatrics, 117:561–567.
Bock S A, Munoz-Furlong A, Sampson H A (2007) Further fatalities caused by anaphylactic reactions to food 2001-2006. J Allergy Clin Immunol, 119:1016-8.
Burks A W, Sampson H A and Bannon G A (1998) Peanut allergens. Allergy, 53:725–730.
Castro A, Williams J G K (1997) Single-molecule detection of specific nucleic acid sequences in unamplified genomic DNA. Anal Chem, 69:3915-3920.
Clare Mills, Ronald van Ree, Heimo Breiteneder “Food Allergy and Intolerance in Europe – Future Directions within the ERA” IFR, Institute of Food Research.
Codex Alimentarius Commission, 2003. Draft Principles for the Risk Analysis of Foods Derived from Modern Biotechnology, at Step 8 of the Elaboration Procedure. ALINORM 03/34, Appendix II. Codex Alimentarius Commission, Joint FAO/WHO Food Standards Programme, Food and Agriculture Organisation, Rome. Available from ftp://ftp.fao.org/codex/alinorm01/al0134ae.pdf.
Crevel R W R, Briggs D, Hefle S L, Knulst A C, Taylor S L (2007) Hazard characterisation in food allergen risk assessment: The application of statistical approaches and the use of clinical data. Food and Chemical Toxicology, 45 (5):691-701.
Dannaeus A and Inganãs M (1981) A follow-up study of children with food allergy: clinical course in relation to serum IgE- and IgG-antibody to milk, egg and fish. Clin Allergy, 11:533- 539.

Introduction
31
de Leon M P, Rolland J M, O’Hehir R E (2007) The peanut allergy epidemic: allergen molecular characterisation and prospects for specific therapy. Expert Rev Mol Med, 9:1-18.
Dupont D, Rolet-Repecaud O and Muller-Renaud S (2004) Determination of the heat treatment undergone by milk by following the denaturation of alpha-lactalbumin with a biosensor. J Agric Food Chem, 52:677.
Edwards J R, Ruparel H, Ju J (2005) Mass-spectrometry DNA sequencing. Mutation Research, 573:3-12.
Egholm M, Buchardt O, Christensen L, Behrens C, Freler S, Driver D, Berg R, Kim S, Nordern B, Nielsen P E (1993) PNA hybridizes to complementary oligonucleotides obeying the Watson-Crick hydrogen bonding rules. Nature, 365:566-568.
Enberg R N, Leickly F E, McCullough J, Bailey J and Ownby D R (1987) Watermelon and ragweed share allergens. J Allergy Clin Immunol, 79:867–875.
Eriksson N. (1986) Birch pollen associated with food hypersensitivity. In: Siwert N, Bhoj R, editors. Nordic aerobiology. Stockholm: Almquist and Wiksell; pp 66-9.
Esch R E and Bush R K (2003) ‘Aerobiology of outdoor allergens’, in Adkinson, N F, Yunginger, J W, Busse, W W, Bochner, B S, Holgate, S T and Simons, F E R, Middleton’s Allergy Principles and Practice, Vol. 1, 6th edn, St Louis, MO, Mosby, 529–572.
European Commission (2000). “White Paper on Food Safety” COM (1999) 719, 12 January 2000.
European Parliament and Council (2000). Directive 2000/13/EC of 20 March 2000 on the approximation of the laws of the Member States relating to the labelling, presentation and advertising of foodstuffs. Official J Europ Commun, L109, 29e42.
European Parliament and Council (2001). Directive 2001/95/EC of 3 December 2001 on general product safety. Official J Europ Commun, L011:4–17.
European Parliament and Council (2002). Regulation 178/2002/ EC of 28 January 2002 laying down the general principles and requirements of food law, establishing the European Food Safety Authority and laying down procedures in matters of food safety. Official J Europ Commun, L31:1–24.
European Parliament and Council (2003). Directive 2003/89/EC of 10 November 2003 amending Directive 2000/13/EC as regards indication of the ingredients present in foodstuffs. Official J Europ Commun, L308, 15e18.
European Parliament and Council (2005). Directive 2005/26/EC of 21 March 2005 establishing a list of food ingredients or substances provisionally excluded from Annex IIIa of Directive 2000/13/EC of the European Parliament and of the Council. Official J Europ Commun, L75:33-34.
European Parliament and Council (2006). Directive 2006/142/EC of 22 December 2006 amending Annex IIIa of Directive 2000/13/EC of the European Parliament and of the Council listing the ingredients which must under all circumstances appear on the labelling of foodstuffs. Official J Europ Union, L368:110–111.
European Parliament and Council (2007). Directive 2007/68/EC of 27 November 2007 amending Annex IIIa to directive 2000/13/EC as regards certain food ingredients. Official J Europ Commun L310:11-14.
Food Allergen Labelling and Consumer Protection Act of 2004, Public Law 108–282 August 2, 2004.
Fremont S, Kanny G, Bieber S, Nicolas J P and Moneret-Vautrin D A (1996) Identification of a masked allergen, alpha-lactalbumin, in baby-food cereal flour guaranteed free of cow's milk protein. Allergy, 51:749.
Germini A, Mezzelani A, Lesignoli F, Corradini R, Marchelli R, Bordoni R, Consolandi C, De Bellis G (2004) Detection of genetically modified soybean using peptide nucleic acids (PNAs) and microarray technology. J Agric Food Chem, 52:4535-4540.
Germini A, Rossi S, Zanetti A, Corradini R, Fogher C, Marchelli R (2005b) Development of a Peptide Nucleic Acid Array Platform for the Detection of Genetically Modified Organisms in Food. J Agr Food Chem, 53(10):3958-3962.
Germini A, Scaravelli E, Lesignoli F, Sforza S, Corradini R, Marchelli R (2005a) Polymerase chain reaction coupled with peptide nucleic acid high-performance liquid chromatography for the sensitive detection of traces of potentially allergenic hazelnut in foodstuffs. Eur Food Res Technol, 220(5-6):619-624
Griffin T J, Tang W, Smith L M (1997) Genetic analysis by PNA affinity MALDI-TOF mass spectrometry. Nature Biotechnology, 15:1368-1372.
Grundy J, Matthews S, Bateman B, Dean T, Arshad S H (2002) Rising prevalence of allergy to peanut in children: data from 2 sequential cohorts. J Allergy Clin Immunol, 110:784-9.

Chapter 1
32
Hefle S L, Bush R K, Yunginger J W and Chu S F (1994) A sandwich enzyme-linked immunosorbent assay (ELISA) for the quantification of selected peanut proteins in foods. J Food Protection, 57:419.
Hefle S L, Furlong T J, Niemann L, Lemon-Mule H, Sicherer S H, Taylor S L (2007) Consumer attitudes and risks associated with packaged foods having advisory labelling regarding the presence of peanuts. J Allergy Clin Immunol, 120:171-6.
Hefle S, Koppelman S (2006) In Koppelman S J, Hefle S L (eds) Detecting allergens in food, Woodhead Publishing Limited, Cambridge, UK, pp 313-329.
Helm R M, Burks A W (2000) Mechanisms of food allergy. Curr Opin Immunol, 12:647-653.
Hinds M J, Beuchat L R, Chinnan M S (1997) Effects of homogenization pressure and stabilizers on some physical characteristics of a beverage prepared from partially defatted, roasted peanuts. Plant Foods Hum Nutr, 50:269-77.
Hirano H, Islam N and Kawasaki H (2004) Technical aspects of functional proteomics in plants. Phytochemistry, 65:1487.
Hird H, Lloyd J, Goodier R, Brown J, Reece P (2003) Detection of peanut using real-time polymerase chain reaction. Eur Food Res Technol, 217:265–268.
Hlywka J J, Hefle S L and Taylor S L (2000) A sandwich enzyme-linked immunosorbent assay for the detection of almonds in foods. J Food Prot, 63:252.
Holgate S T, Church M K and Lichtenstein L M (2001) Allergy 2nd edn St Louis Mosby.
Holst-Jensen A, Ronning S B, Lovseth A and Berdal K G (2003) PCR technology for screening and quantification of genetically modified organisms (GMOs). Anal Bioanal Chem, 375:985.
Holzhauser T and Vieths S (1999) Quantitative sandwich ELISA for determination of traces of hazelnut (Corylus avellana) protein in complex food matrixes. J Agric Food Chem, 47:4209.
Holzhauser T, Dehne L I, Hofmann A, Haustein D and Vieths S (1998) Rocket Immunoelectrophoresis (RIE) for determination of potentially allergenic peanut proteins in processed foods as a simple means for quality assurance and food safety. Zeitschrift fuer Lebensmittel-Untersuchung und –Forschung, 206:1.
Hourihane J O, Roberts S A, Warner J O (1998) Resolution of peanut allergy: case-control study. BMJ, 316:1271-5.
Hourihane J O’ B, Kilburn S A, Nordlee J A, Hefle S L, Taylor S L and Warner J O (1997) An evaluation of the sensitivity of subjects with peanut allergy to very low doses of peanut protein: a randomized, double-blind, placebo-controlled food challenge study. J Allergy Clin Immunol, 100:596–600.
Hourihane J O, Aiken R, Briggs R, Gudgeon L A, Grimshaw K E C, DunnGalvin A, Roberts S R (2007) The impact of government advice to pregnant mothers regarding peanut avoidance on the prevalence of peanut allergy in United Kingdom children at school entry. J Allergy Clin Immunol, 119 (5):1197-1202.
Hyrup B, Nielsen P E (1996) Peptide nucleic acids (PNAs): synthesis, properties and potential applications. Bioorganic and Medicinal Chemistry, 4:5-23.
Igloi G L (1999) Automated Detection of Point Mutations by Electrophoresis in Peptide-Nucleic Acid-Containing Gels. Biotechniques, 27:798-808.
Indyk H E and Filonzi E L (2004) Direct optical biosensor analysis of folate-binding protein in milk. J Agric Food Chem, 52:3253.
Isacsson J, Cao H, Ohlsson L, Nordgren S, Svanvik N, Westman G, Kubista M, Sjo¨back R, Sehlstedt U (2000) Rapid and specific detection of PCR products using light-up probes. Molecular and Cellular Probes, 14:321–328.
Jackson W F (2003) Food Allergy. Concise monograph series. International Life Sciences Institute Europe, Belgium.
Johansson S G O, Hourihane J O’ B, Bousquet J, et al. (the EAACI Nomenclature Task Force) (2001) A revised nomenclature for allergy (position paper). Allergy, 56:813–824.
Koch P, Schäppi G F, Poms R E, Wüthrich B, Anklam E and Battaglia R (2003) Comparison of commercially available ELISA kits with human sera-based detection methods for peanut allergens in foods. Food Addit Contam, 20:797.
Komiyama M, Ye S, Liang X, Yamamoto Y, Tomita T, Zhou J M, Aburatani H (2003) Pna for one-base differentiating protection of DNA from nuclease and its use for SNPs detection. J Am Chem Soc, 125:3758-3762.
Koppelman S J, Knol E F, Vlooswijk R A, Wensing M, Knulst A C, Hefle S L, et al. (2003) Peanut allergen Ara h 3: isolation from peanuts and biochemical characterization. Allergy, 58:1144-51.

Introduction
33
Koppelman S J, Knulst A C, Koers W J, Penninks A H, Peppelman H, Vlooswijk R, Pigmans I, van Duijn G and Hessing M (1999) Comparison of different immunochemical methods for the detection and quantification of hazelnut proteins in food products. J Immunol Methods, 229:107.
Koppelman S J, Vlooswijk R A, Knippels L M, Hessing M, Knol E F, Van Reijsen F C, et al. (2001) Quantification of major peanut allergens Ara h 1 and Ara h 2 in the peanut varieties Runner, Spanish, Virginia, and Valencia, bred in different parts of the world. Allergy, 56:132-7.
Kryger E M, Krevolin M D, Powell M J (1998) Detection of the hereditary hemochromatosis gene mutation by real-time fluorescence PCR and PNA clamping. J. Anal. Biochem, 260:142-148.
Kuhn H, Demidov V V, Coul J M, Fiandaca M J, Gildea B D, Frank-Kamenetskii M D (2002) Hybridization of DNA and PNA Molecular Beacons to Single-Stranded and Double-Stranded DNA Targets. J Am Chem Soc, vol 124, n.6.
Kuhn H, Demidov V V, Gildea B D, Fiandaca M J, Coul J M, Frank-Kamenetskii M D (2001) PNA Beacons for Duplex DNA. Antisense and Nucleic acid drug Development, 11:265-270.
Lesignoli F, Germini A, Corradini R, Sforza S, Galaverna G, Dossena A, Marchelli R (2001) Recognition and strand displacement of DNA oligonucleotides by peptide nucleic acids (PNAs): High-performance ion-exchange chromatographic analysis. J Chromatogr A, 922:177-185.
Mäkinen-Kiljunen S and Palosuo T (1992) A sensitive enzyme-linked immunosorbent assay for determination of bovine beta-lactoglobulin in infant feeding formulas and in human milk. Allergy, 47:347.
Maleki S J, Hurlburt B K (2004) Structural and functional alterations in major peanut allergens caused by thermal processing. Journal of AOAC International, 87 (6):1475-1479.
Malmheden Yman I, Eriksson A, Everitt G, Yman L and Karlsson T (1994) Analysis of food proteins for verification of contamination or mislabelling. Food and Agricultural Immunology, 6:167.
Malorny B, Tassios P T, Radstrom P, Cook N, Wagner M and Hoorfar J (2003) Standardization of diagnostic PCR for the detection of foodborne pathogens. Int J Food Microbiol, 83:39.
Mariager B, Solve M, Eriksen H and Brogen C H (1994) Bovine β-lactoglobulin in hypoallergenic and ordinary infant formulas measured by an indirect competititive ELISA using monoclonal and polyclonal antibodies. Food and Agric Immunol, 6:73.
Mittag D, Akkerdaas J, Ballmer-Weber B K, Vogel L, Wensing M, Becker W M, et al. (2004) Ara h 8, a Bet v 1-homologous allergen from peanut, is a major allergen in patients with combined birch pollen and peanut allergy. J Allergy Clin Immunol, 114:1410-7.
Morisset M, Moneret-Vautrin D A, Kanny G, Guenard L, Beaudouin E, Flabbee J and Hatahet R (2003) Thresholds of clinical reactivity to milk, peanut, and sesame in immunoglobulin E-dependent allergies: evaluation by double-blind or single-blind placebo-controlled oral challenges. Clin Exp Allergy, 33:1046–1051.
Muller-Renaud S, Dupont D and Dulieu P (2004) Quantification of beta casein in milk and cheese using an optical immunosensor. J Agric Food Chem, 52:659.
Natale M, Bisson C, Monti G, Peltran A, Garoffo L P, Valentini S, Fabris C, Bertino E, Coscia A and Conti A (2004) Cow's milk allergens identification by two-dimensional immunoblotting and mass spectrometry. Mol Nutr Food Res, 48:363.
Nielsen P E, Engholm M, Berg R, Buchardt O (1991) Sequence selective recognition of DNA by strand displacement with a thymine substituted polyamide. Science, 254:1497-1500.
Nordlee J A, Taylor S L, Jones R T and Yunginger J W (1981) Allergenicity of various peanut products as determined by RAST inhibition. J Allergy Clin Immunol, 68: 376.
Oldaeus G, Bjorksten B, Einarsson R and Kjellman N I M (1991) Antigenicity and allergenicity of cow milk hydrolysates intended for infant feeding. Pediatric Allergy and Immunology, 2:156.
Ortolani C, Ipsano M, Scibilia J and Pastorello E A (2001) Introducing chemists to food allergy. Allergy, 56:5.
Ørum H, Nielsen P E, Jorgensen M, Larsson C, Stanley C, Koch T (1995) Sequence specific purification of nucleic acids by PNA controlled hybrid selection. BioTechniques, 19:472-480.
Park D L, Coates S, Brewer V A, Garber E A, Abouzied M, Johnson K, Ritter B and McKenzie D (2005) Performance Tested Method multiple laboratory validation study of ELISA-based assays for the detection of peanuts in food. J AOAC Int, 88:156.

Chapter 1
34
Pastorello E A and Trambaioli C (2001) Isolation of food allergens. J Chromatogr B, 756:71.
Plebani A, Restani P, Naselli A, Galli C L, Meini A, Cavagni G, Ugazio A G and Poiesi C (1997) Monoclonal and polyclonal antibodies against casein components of cow milk for evaluation of residual antigenic activity in 'hypoallergenic' infant formulas. Clin Exp Allergy, 27:949.
Poms R E and Anklam E (2004) Polymerase chain reaction techniques for food allergen detection. J AOAC Int, 87:1391.
Poms R E, Agazzi M E, Bau A, Brohée M, Capelletti C, Nørgaard J V and Anklam E (2005) Inter-laboratory validation study of five commercial ELISA test kits for the determination of peanut proteins in biscuits and dark chocolate. Food Addit Contam, 22:104-112.
Pumphrey R S, Gowland M H (2007) Further fatal allergic reactions to food in the United Kingdom, 1999-2006. J Allergy Clin Immunol, 119:1018-9.
Sampson H A (1999a) Food Allergy. Part 1: immunopathogenesis and clinical disorders. J Allergy Clin Immunol, 103:717-28.
Sampson H A (1999b) Food Allergy. Part 2: diagnosis and management. J Allergy Clin Immunol, 103:981-999.
Sampson H A (2004) Update on food allergy. J Allergy Clin Immunol, 113:805-819.
Sampson H A (2005) Food allergy: accurately identifying clinical reactivity. Allergy, 60:19–24.
Sampson H A and McCaskill C C (1985) Food hypersensitivity and atopic dermatitis: evaluation of 113 patients. J Pediatr, 107:669–675.
Scaravelli E, Brohée M, Marchelli R, Van Hengel A J, Development of three real-time PCR assays to detect peanut allergen residue in processed food products. Eur Food Res Technol, (in press).
Scheibe B, Weiss W, Rueff F, Przybilla B and Gorg A (2001) Detection of trace amounts of hidden allergens: hazelnut and almond proteins in chocolate. J Chromatogr B, 756:229.
Sicherer S H, Munoz-Furlong A and Sampson H A (2004) Prevalence of seafood allergy in the United States determined by a random telephone survey. J Allergy Clin Immunol, 114:159–165.
Sicherer S H, Munoz-Furlong A, Burks A W and Sampson H A (1999) Prevalence of peanut and tree nut allergy in the US determined by a random digit dial telephone survey. J Allergy Clin Immunol, 103:559–562.
Sicherer S H, Muñoz-Furlong A, Murphy R, Wood R A and Sampson H A (2003) Symposium: Pediatric Food Allergy. Pediatrics, 111:1591.
Sicherer S H, Muñoz-Furlong A, Sampson H A (2004) Prevalence of seafood allergy in the United States determined by a random telephone survey. J Allergy Clin Immunol, 114:159-165.
Sicherer S H, Sampson H A (2007) Peanut allergy: Emerging concepts and approaches for an apparent epidemic. J Allergy Clin Immunol, 120:491-503.
Skolnick H S, Conover-Walker M K, Koerner C B, Sampson H A, Burks W, Wood R A (2001) The natural history of peanut allergy. J Allergy Clin Immunol, 107:367-74.
Spadavecchia J, Manera M G, Quaranta F, Siciliano P, Rella R (2005) Surface plamon resonance imaging of DNA based biosensors for potential applications in food analysis. Biosensors and Bioelectronics, 21:894-900.
Stender H, Broomer A, Oliveira K, Perry-O’Keefe H, Hyldig-Nielsen J J, Sage A, Young B, Coull J (2000) Rapid detection, identification and enumeration of Pseudomonas aeruginosa in bottled water using peptide nucleic acid probes. J Microb Met, 42:245-253.
Stephan O, Vieths S (2004) Development of a real-time PCR and a sandwich ELISA for detection of potentially allergenic trace amounts of peanut (Arachis hypogaea) in processed foods. J Agric Food Chem, 52:3754-3760.
Su X, Wu Y-J, Knoll W (2005) Comparison of surface plasmon resonance spectroscopy and quartz crystal microbalance techniques for studying DNA assembly and hybridization. Biosensors and Bioelectronics, 21:719-726.
Tariq S M, Stevens M, Matthews S, Ridout S, Twiselton R and Hide D W (1996) Cohort study of peanut and nut sensitisation by age of 4 years. B.M.J., 313:514.
Taylor S L (2002) Protein allergenicity assessment of foods produced through agricultural biotechnology. Ann. Rev. Pharmacol. Toxicol, 42:99.
Taylor S L and Hefle S L (2001) Food allergies and other food sensitivities. Food Technol, 55(9):68–83.

Introduction
35
Taylor S L and Hefle S L (2002) Allergic reactions and food intolerances, In: Nutritional Toxicology, 2nd ed., ed. F. N. Kotsonis and M. Mackey, Taylor & Francis, London, 93.
Taylor S L, Hefle S L, Bindslev-Jensen C, Bock S A, Burks A W, Christie L, Hill D J, Host A, Hourihane J O’B, Lack G, Metcalfe D D, Moneret-Vautrin D A, Vadas P A, Rance F, Skrypec D J, Trautman T A, Malmeheden Yman I and Zeiger R S (2002) Factors affecting the determination of threshold doses for allergenic foods: how much is too much?. J Allergy Clin Immunol, 109:24–30.
Totsingan F, Rossi S, Corradini R, Tedeschi T, Sforza S, Juris A, Scaravelli E, Marchelli R Label-Free Selective DNA Detection with High Mismatch Recogniton by PNA Beacons and Ion Exchange HPLC. Org Biomol Chem, (in press).
Urisu A, Ando H, Morita Y, Wada E, Yasaki T, Yamada K, et al. (1997) Allergenic activity of heated and ovomucoid-depleted egg white. J Allergy Clin Immunol, 100:171-6.
van den Boom D, Beaulieu M, Oeth P, Roth R, Honisch C, Nelson M R, Jurinke C, Cantor C (2004) MALDITOF MS: a platform technology for genetic discovery. International Journal of Mass Spectrometry, 238:173-188.
van Hengel A J, Anklam, E, Taylor S L and Hefle S L (2007a) Analysis of food allergens. Practical applications. In Y. Pico (Ed.), Food toxicants analysis (pp. 189–229). Amsterdam: Elsevier.
van Hengel A J, Capelletti C, Brohée M and Anklam E (2006) Validation of two commercial lateral flow devices for the detection of peanut proteins in cookies: Interlaboratory study. J AOAC Int, 89:462.
van Hengel A J (2007b) Food allergen detection methods and the challenge to protect food-allergic consumers. Anal Bioanal Chem, 389:111–118.
van Ree R and Aalberse R C (1993) Pollen-vegetable food crossreactivity: serological and clinical relevance of crossreactive IgE. J Clin Immunoassay, 16:124–130.
Wang J (1998) DNA biosensors based on PNA recognition layers. A review. Biosensors and Bioelectronics, 13:757-762.
Wensing M, Penninks A H, Hefle S L, Koppelman S J, Bruijnzeel-Koomen A and Knulst A C (2002) The distribution of individual threshold doses eliciting allergic reactions in a population with peanut allergy. J Allergy Clin Immunol, 110:915.
Whitaker T B, Williams K M, Trucksess M W and Slate A B (2005) Immunochemical analytical methods for the determination of peanut proteins in foods. J AOAC Int, 88:161.
Wilhelmsson L M, Norden B, Mukherjee K, Dulay M T, Zare R N (2002) Genetic screening using the colour change of a PNA-DNA hybrid –binding cyanine dye. Nucleic Acids Res, 30:e3.
Wolffs P, Knutsson R, Sjöback R, Rådström P (2001) PNA-Based Light-Up Probes for Real-Time Detection of Sequence- Specific PCR Products. BioTechniques, 31:766-771.
Yamada K, Urisu A, Kakami M, Koyama H, Tokuda R, Wada E, et al. (2000) IgE-binding activity to enzyme-digested ovomucoid distinguishes between patients with contact urticaria to egg with and without overt symptoms on ingestion. Allergy, 55:565-9.
Yeung J M and Collins P J (1996) Enzyme immunoassay for determination of peanut proteins in food products. J AOAC Int, 79:1411.
Yu J W, Kagan R, Verreault N, Nicolas N, Joseph L, St Pierre Y et al. (2006) Accidental ingestions in children with peanut allergy. J Allergy Clin Immunol, 118:466-72.
Yunginger J W, Sweeney K G, Sturner W Q, Giannandrea L A, Teigland J D, Bray M, Benson P A, York J A, Biedrzycki L, Squillace D L and Helm R M (1988) Fatal food-induced anaphylaxis. JAMA, 260:1450–1452.


Chapter 2
Development of three real-time PCR assays to detect
peanut allergen residue in processed food products
Hypersensitivity to peanut is a public health problem, since the ingestion of even low amounts of
peanut can trigger severe allergic reactions. Allergic consumers rely on the information provided on
the label of foodstuffs to identify products that might endanger their health. In order to protect the
allergic consumer methods are required for the detection of allergenic ingredients. For this purpose
we have developed three real-time polymerase chain reaction (PCR) assays, based on TaqMan
chemistry, that are capable of detecting peanut specific DNA sequences in food products. The
peanut specific sequence targeted for detection is located within the gene family of the allergen Ara
h 3. The occurrence of multiple Ara h 3 sequences in the peanut genome increases the chance to
achieve a good sensitivity. DNA extraction is also known to affect detection by PCR, therefore the
efficiency of several different DNA extraction methods was compared.
The methods reported here are capable of detecting 2.5 pg peanut DNA (less than one copy of
peanut genome equivalent) and all three assays were successfully applied to detect peanut traces in
a model food product where they could detect 10 mg kg-1 peanut.
Elena Scaravelli, Marcel Brohée, Rosangela Marchelli and Arjon J. van Hengel "Development of three real-time PCR assays to detect peanut allergen residue
in processed food products". European Food Research and Technology, in press.

Chapter 2
38
Introduction
Food allergies might be defined as adverse, immune-mediated (IgE mediated) reactions to foods
that can occur in sensitized individuals. The prevalence of IgE-mediated food allergies is not
precisely known, but is estimated to be around 4 % of the general population (Sicherer et al., 2004).
Amongst infants and children food allergy occurs even more frequently with prevalence levels
reaching 8 % (Helm and Burks, 2000). The severity of the reactions varies from mild urticaria to
potentially lethal anaphylactic shocks. Common allergenic foods include cow’s milk, crustaceans,
hen’s egg, fish, tree nuts, peanuts, soy and wheat (FAO, 1995).
Peanut allergy is one of the most severe food allergies due to its persistency throughout the lifetime
of individuals and its life threatening character, even after the ingestion of minimal doses (100 µg of
peanut protein) (Hourihane et al., 1997a, 1997b). It is estimated that peanut and tree nut allergies
affect 1.1 % of the US population (Sicherer et al., 1999) and according to a recent study, the
prevalence of peanut allergy in children has doubled between 1999 and 2003 (Sicherer et al., 2003).
People suffering from a food allergy usually try to avoid consuming the food that can endanger their
health. Despite this, the ingestion of peanuts often happens accidentally because of mislabelling of
products, rework processes which include peanut-containing foods or cross-contamination during
processing (Sampson et al., 1992; Yunginger et al., 1988). For a better protection of allergic
consumers and to ensure compliance with new European legislation resulting from Directives
2000/13/EC and 2003/89/EC on food labelling (European Parliament and Council, 2000,2003),
detection methods are required to specifically detect the presence of hidden allergens in a wide
variety of food items.
Usually food allergens, the components capable of triggering allergic reactions, are proteins or
glycoproteins, but only a small fraction of all food proteins are allergenic. Several studies have
found that the major peanut allergens are resistant to digestion and food processing techniques
(Burks et al., 1998), while roasting has been shown to increase the allergenicity of this food (Maleki
et al., 2000).
Enzyme linked immunosorbent assays (ELISA) (Besler, 2001) are most commonly used to
determine the presence of allergenic ingredients like peanut in food products. Immuno-detection
based methods employ antibodies raised in animals against peanut proteins. Some of these kits are
designed to specifically recognize one allergenic protein (Krska et al., 2004), while others detect a
pool of proteins contained in the protein extract of the allergenic food. According to a recent study
the sensitivity of commercial ELISA test kits varies with some test kits being capable of detecting
concentrations below 5 mg per kg of food matrix (Poms et al., 2005). Other ELISA methods have

Development of three real-time PCR assays…
39
been reported to detect 0.2-1.2 mg peanut per kg food matrix (Kiening et al., 2005). The efficiency,
specificity and sensitivity of ELISA are directly related to the potential of the antibodies to
recognize peanut proteins. However, the detection of peanut proteins is compromised by the fact
that the food industry utilizes a vast number of different ingredients and furthermore it employs a
variety of food processing methodologies like heat treatment or roasting which can modify,
denature and degrade food proteins (Immer, 2006). Modifications of protein structure and matrix
effects might interfere with protein extraction or antibody binding (Crevel, 2006) which can give
rise to false positive or false negative results. It is therefore important to have a variety of methods
at hand to improve the specificity and to limit false negative and false positive results. An
alternative to the direct detection of proteins is the determination of species-specific DNA
originating from the allergenic food by means of polymerase chain reaction (PCR). PCR is already
routinely applied for the detection and quantification of genetically modified organisms (GMOs)
(Anklam et al., 2002). In real-time PCR, DNA amplification measurements are based on the
detection of a fluorescent signal that proportionally increases during the generation of PCR
products. A threshold line is set at the level of detection at which a reaction reaches a fluorescent
intensity above background. The threshold line is set in the exponential phase of the amplification
for the most accurate reading. The cycle at which the sample reaches this level is called the Cycle
Threshold, Ct. The target sequence can be either designed on the gene coding for the allergenic
protein or simply, on a species-specific region in the genome of the allergenic food. Despite their
different targets, ELISA and real-time PCR are often designed for quantitative purposes. A
comparison of a real-time PCR method and an ELISA, for the detection of peanut has recently been
reported, whereby the relative Ct values obtained by the real-time PCR correlated well with the
amount of peanut measured by the sandwich ELISA (Stephan and Vieths, 2004). This result
highlights the potential of PCR for a semi-quantitative detection of peanut traces in foods. Two real-
time PCR assays have been published and the reported limits of detection were in the range of those
that can be obtained by means of ELISA, around 1 or 2 mg kg-1 (Stephan and Vieths, 2004; Hird et
al., 2003). Commercial PCR based kits for the detection of peanuts are currently also available,
either in the format of a real- time PCR kit, a PCR combined with ELISA detection, or conventional
PCR followed by gel electrophoresis analysis. Such products usually claim to be able to detect 10
mg kg-1 peanut in food products. However, food processing often negatively impacts the detection,
and therefore an effort should be made to develop methodology that is capable to detect allergenic
ingredients in the low mg per kg range (Poms et al., 2004), even in processed foods.
Here we report the development and optimization of three real-time PCR assays based on Taqman
chemistry. All three methods were designed to target sequences coding for the peanut allergen Ara

Chapter 2
40
h 3, which belongs to the glycinin family (Koppelman et al., 2003). The peanut genome contains
multiple Ara h 3 sequences and since the detection of a multicopy gene allows an improvement of
the sensitivity (Dahinden et al., 2001) we have chosen this gene family to design PCR amplicons. A
simultaneous development of three different methods, based on different primer pairs, was aimed at
identifying the most sensitive method amongst the three. Since the performance of the methods also
depends on the quality of the DNA extracted from the samples, we compared 15 different extraction
methods in order to optimise DNA extraction and to achieve low detection limits.
Materials and Methods
DNA extraction methods
Fifteen extraction methods were investigated for the isolation of peanut DNA. Raw (Chinese Red
skin) and roasted peanuts (obtained from Migros, Zurich, Switzerland) without shell were ground
under liquid nitrogen using a mortar and pestle. A "blank of extraction", sample which undergoes
the complete extraction procedure without any DNA containing material (peanut), was included in
all analyses.
DNA was extracted using five different commercial kits according to the manufacturers'
instructions: i) DNA extraction kit (GMO & Allergen; Tepnel Biosystems, UK); ii) DNAMITE
Plant Kit extraction (Microzone Limited, UK); Wizard® Magnetic DNA Purification System for
Food (Promega, Madison, USA) iii) using 100 mg or iv) 1 g of starting material; v) GenElute TM
Plant Genomic DNA Kit (Sigma, USA); vi) Easy-DNATM Kit for genomic DNA isolation
(Invitrogen Ltd, UK). Furthermore, two commercial kits were used with slight modifications to the
manufacturers' protocol in order to increase the DNA yield: vii) SureFood® PREP Allergen Kit for
preparation of DNA from food products (R-Biopharm / Congen, Germany): 250 mg of samples
were weighted out and incubated at 65 ºC for 3 hours or overnight instead of 1 hour to lyse the
cells; viii) Nucleon PhytoPure plant and fungal DNA extraction kit (Amersham Biosciences
Corp.,USA): where the incubation for the DNA extraction after addition of Reagent 2 was
prolonged from 10 minutes to 30 minutes or 1 hour. Centrifugation steps were carried out at 9 000 g
for 5 minutes instead of 5 000 g for 5 minutes.
Traditional extraction methods were also employed. ix) CTAB (Cetyl Trimethyl Ammonium
Bromide) extraction: sample aliquots of 100 mg were incubated for 1 hour at 65 °C with 10 ml
extraction buffer (2% CTAB, 1.4 M NaCl,; 0.1 M Tris/HCl; 20 mM EDTA; pH 8). After

Development of three real-time PCR assays…
41
incubation, the samples were centrifuged for 13 minutes at 9383 g, the supernatant was transferred
to a new 50 ml capped centrifuge tube, mixed with an equal volume of chloroform, vortexed and
centrifuged again for 13 minutes at 9383 g. The aqueous phase was mixed with two volumes of
precipitation buffer (0.5% CTAB; 0.04M NaCl, pH 8) and incubated overnight at room temperature
in the dark. The samples were centrifuged for 13 minutes at 9383 g, the supernatant was discarded
and the pellets were redissolved in 1 ml 1.2 M NaCl, vortexed and transferred to a 2 ml reaction
tube and mixed with 400 µl Cl3CH. After centrifugation (10 minutes at 12 000 g) the upper aqueous
phase was transferred to a new 2 ml reaction tube and 0.6 volumes isopropanol was added plus 0.1
volumes 3 M sodium acetate. The samples were incubated for 10 minutes at -20 ºC, after which
they were centrifuged at 10 000 g for 10 minutes, the supernatant was discarded and the pellet
redissolved in 500 µl 70% ethanol. The samples were centrifuged once more for 10 minutes at 12
000 g, the supernatant was carefully pipetted off and the pellets were dried at room temperature for
1 hour. The pellets were resuspended with 100 µl TE buffer (10 mM Tris; 1 mM EDTA, pH 8).
x) The extraction method based on a protocol described by Aljanabi (Salah and Aljanabi, 1997). It
was applied to 1 g of ground sample (this required scaling up all volumes of reagents required in the
protocol by a factor 10). xi) In order to improve the yield of extraction RNase digestion and lipid
removal with chlorophorm was included: 1 g of ground sample was mixed with 4 ml extraction
buffer (0.4 M NaCl, 10 mM Tris-HCl, 2mM EDTA; pH 8), 400 µl of SDS 20% and 15 µl of
Proteinase K (20 mg/ml). The samples were incubated at 60 °C overnight, after which 3 ml of 6 M
NaCl was added to each sample. Samples were vortexed for 30 seconds at maximum speed and
tubes spun down for 30 minutes at 9 500 rpm. To the supernatant 10 µl RNAse (100 mg/ml) was
added and the digestion was carried out at 40 °C for 30 minutes. An equal volume of cold CHCl3
was then added to each sample; each sample was vortexed at maximum speed and centrifuged 5
minutes at 9 500 rpm, at 4 °C. The supernatant was then transferred to new 2 ml tubes and 1 ml of
isopropanol was added to each tube; the samples were incubated 2 hours at –20 °C. All the samples
were centrifuged at 12 000 rpm, at 4 °C for 20 minutes. The pellets were washed twice with 70%
ethanol, dried and finally resuspended in 500 µl of water.
Traditional extraction methods were in some cases combined with commercial kits for DNA
purification: xii) CTAB extraction buffer was combined with the SureFood® PREP Allergen Kit for
the purification of the DNA from the slurry.
DNA extraction was also performed combining a guanidine hydrochloride based extraction buffer
(Germini et al., 2005) and different commercial kits for DNA purification from the resultant slurry.
The DNA was purified from 0.5 – 1 ml of slurry using the xiii) DNeasy Plant Mini Kit (Qiagen

Chapter 2
42
Belgium/Luxembourg), xiv) SureFood® PREP Allergen kit or xv) Wizard® DNA Clean up system
(Promega, Madison, USA) according to the manufacturers' instructions.
After the investigation of the most suitable extraction method, only method xv) was used for all the
samples analyzed. Samples of 2 g (± 0.1 g) were extracted in duplicate and eluted in 100 µl.
DNA quantification
Quant-iT™ PicoGreen® dsDNA regent (Invitrogen Ltd, UK) was utilized for DNA quantification.
Quantification was carried out using a Perkin Elmer Reader Victor 1420-040 (Perkin Elmer, USA),
according to the instructions of the Quant-iT™ PicoGreen® dsDNA regent kit protocol for a high
range standard curve (from 10-3 to 1 ng/µl) in a final volume of 200 µl.
PCR methods
Commercial PCR kits
Aliquots of 5 µl DNA extracts from raw and roasted peanut as well as from cookies containing
peanuts obtained with the extraction methods described above, were analyzed with the following
two different commercial kits designed to detect peanut traces in food products. The BioKits
Allergen DNA Selection Module PCR (Tepnel, UK) is a PCR kit combined with gel electrophoresis
as post-PCR. The experiments were carried out according to the protocol of the product utilizing
AmpliTaq® Gold DNA polymerase (Applied Biosystems, UK) as suggested by the manufacturer
and using an iCycler® Thermal Cycler instrument (Bio-Rad, USA).
The SureFood® Allergen Peanut real-time PCR Kit (Congen / R-Biopharm, Germany) was also
used according to the protocol of the product and the experiments were carried out on an ABI
Prism® 7900HT Sequence Detection System (Applied Biosystems, UK).
Conventional control PCR
Amplification of different non-coding regions of chloroplast DNA (Taberlet et al., 1991) was
performed in order to avoid false negative results by confirming the presence of vegetable
amplifiable DNA. DNA extracted by means of the xv) procedure was analysed using PCR Reagent
System (Invitrogen Ltd, UK). The concentrations of the reagents in the final volume of 25 µl were:
1 x reaction buffer, 3 mM MgCl2, 0.2 mM dNTPs, 0.4 µM of each primer, 0.1 u/µl of Invitrogen
Taq, and 100 ng of DNA or 5 µl DNA extracts. The reaction was run on an iCycler® Thermal

Development of three real-time PCR assays…
43
Cycler (Bio-Rad, USA) and the temperatures applied were as follow: 95 °C for 3 minutes; 40 cycles
of 94 °C for 45 seconds, 60 °C for 30 seconds and 72 °C for 1 minute; followed by one step at 72
°C for 10 minutes. The PCR products were analysed on a 2 % agarose gel in 0.5 x TBE.
Real-time PCR
Primer and probe design
Three sets of primer pairs and probes were designed on the target sequences of Ara h 3 genes. DNA
sequences (AF093541, AF510854, AY848698, AF125192, AY722685, AY722686, AY722687,
AY618460, AY722688, AF086821, AY439332 and AF487543) were obtained from on line
available databases (http://www.ncbi.nlm.nih.gov/) and specific tools for DNA alignment and
software were employed to identify conserved and specific regions (http://www.ebi.ac.uk/clustalw/,
http://www.ncbi.nlm.nih.gov/BLAST/). The probes were 5’ labelled with 6-carboxyfluorescein
(FAM) and 3’ labelled with the fluorescent quencher dye 6-carboxytetramethylrhodamine
(TAMRA). For the design of primers and probes the following software was tested: Primer Express
(Applied Biosystems, UK), Primer 3 (http://www-genome.wi.mit.edu/cgi-
bin/primer/primer3_www.cgi), Integrated DNA Technology
(http://www.idtdna.com/analyzer/Applications/OligoAnalyzer/Default.aspx), mfold (version 3.2,
Zuker and Turner (http://www.bioinfo.rpi.edu/applications/mfold/dna/form1.cgi)). Finally all
primers and probes were designed by hand and purchased from Applied Biosystems, Warrington,
UK.
For PCR A (amplicon of 78 bp) the following primers and probe were designed: forward primer "A
forward" 5'- CGC AAA GTC AGC CTA GAC AA -3', reverse primer "AB reverse" 5'- CTT GTC
CTG CTC GTT CTC T -3' and probe "AB probe" 5'- FAM-TGC TGT CCT CGA GGG CTA AAT
TCA CGC TCT TC-TAMRA -3'. For PCR B (amplicon of 105 bp) the following primers and
probe were designed: forward primer "B forward" 5'-GAA GCT TAC CAT ATA GCC CAT ACA-
3' "AB reverse" (see above) and probe "AB probe" (see above). For PCR C (amplicon of 114 bp)
the following primers and probe were designed: forward primer "C forward" 5'- TGT TTG TCC
CTC ACT ACA ACA -3', reverse primer "C reverse" 5'- GAA GCT CCT CGT CGT ACA -3' and
probe "C probe" 5'- FAM-ACT TGC ACG TGA GCC CGT CCC CTC AAT -TAMRA -3'.
Real-time PCR conditions
To optimise the performance of the PCR reactions the following parameters were tested: primer
concentrations (0.05, 0.3 and 0.9 µM), annealing temperatures (53, 55, 56, 60 °C), elongation

Chapter 2
44
temperatures (60, 72 °C), PCR mastermixes (TaqMan® Universal PCR Master Mix, Applied
Biosystems, UK; JumpStartTM Taq ReadyMixTM with dUTP, Sigma, USA; HotStartTaq Master Mix
Kit, Qiagen GmbH, Germany; Platinum® PCR SuperMix High Fidelity, Invitrogen Ltd, UK). The
optimum assay was set as follows: primer concentration of 0.9 µM, probe concentration 0.25 µM,
final volume of 25 µl, PCR mastermix Taqman Universal Master Mix (Applied Biosystems, UK).
The thermal cycling was set as follows: a UNG digestion step of 2 minutes at 50 °C, DNA
denaturation and Taq Polymerase activation at 95 °C for 10 min followed by 40 cycles of DNA
denaturation at 95 °C for 15 seconds, annealing at 60 °C for 30 seconds and elongation at 72 °C for
30 seconds. Acquisition of the signal took place during annealing and elongation of each cycle.
All reactions were run on the ABI Prism® 7900HT Sequence Detection System (Applied
Biosystems, UK).
For sample analysis two separate DNA extractions were performed and amplified in two separate
reactions. All results were analyzed by setting the automatic baseline of the instrument and 0.15 as
threshold. The Ct values obtained and the relative standard deviations in this paper refer to the mean
value of the four replicates of amplification. On each 96-well plate three non template controls
(NTCs) and two positive samples were used as controls.
Specificity Analyses
The specificity of the three assays was determined by testing the amplification of non-peanut DNA
extracts from a wide variety of raw foods (Table 1). The extraction was carried out according to
method xv). In order to avoid false negative results, the amplificability of DNA extracts from
vegetable matrices was tested with the conventional control PCR. The three real-time PCR assays
(PCR A, B and C) were then applied to all the DNA extracts according to the developed protocols.
Each amplification was carried out in duplicate, adding 5 µl of DNA extract (20 ng / µl). In case of
non vegetable matrix one more replicate of amplification was added to the real-time PCR plate
which was spiked with 1 µl of pure peanut extract (in order to check the presence of possible
inhibitors of the PCR reaction).
Preparation of a model processed food matrix
Cookies were prepared in collaboration with the Federal Research Centre for Nutrition and Food,
the Institute for Cereal Potato and Starch Technology in Detmold, Germany.

Development of three real-time PCR assays…
45
A finely ground peanut powder consisting of equal aliquots of the 5 peanut components included in
the IRMM-481 peanut test material (IRMM, Belgium) was prepared by mixing and grounding in
liquid nitrogen with an Ultraturrax to obtain a particle size < 250µm. The peanut powder was used
to prepare a series of spiked butter mixtures.
100 g of peanut powder was mixed with a blender in 2000 g butter (Süßrahmbutter Lipischer 82%
fat) at 35 °C for 2 minutes. Then 200 g of the peanut/butter mix was used to prepare the next lower
concentration (1/10) by mixing it with 1800 g blank butter. This dilution step with blank butter was
repeated 3 more times.
Aliquots of 1800 g peanut-butter mix were subsequently used to prepare the cookie dough by
mixing it with 5000 g wheat flour, 200 g blank butter, 1875 g dust sugar, 600 g skimmed milk
powder, 30 g sodium chloride, 12.5 g sodium hydrogen carbonate, 15 g ammonium bisulphate, and
675 g water.
In addition to this, blank cookie dough was prepared in which the peanut-spiked butter was replaced
by blank butter. The blank (peanut free) and the five spiked doughs prepared as described above
were aliquotted in cookie moulds and baked for 16 minutes at 180 °C (Miwe Condo oven).
The final peanut content in the cookies was approximately 10 000, 1000, 100, 10, and 1 mg kg-1
All the spiked and blank cookies were ground separately, sieved on 0.7 µm sieves and the resulting
powder was vacuum packed in aluminium foil bags in aliquots of 15 or 30 g, and stored at -20 °C
until use.
Results and discussion
Primer and probe design
Ara h 3 is a peanut allergen that undergoes extensive proteolytic processing resulting in a protein
pattern composed of multiple bands as visualized by SDS PAGE analysis. In addition to this, it has
been shown that Ara h 3 has several isoforms that are encoded by at least 5 genes (Piersma et al.,
2005). Since the similarity with Ara h 4 reaches 88 %, Ara h 3 and Ara h 4 are considered to be
isoallergens (Viquez et al., 2004; Yan et al., 2005). From the NCBI DNA data base
(http://www.ncbi.nlm.nih.gov/), we retrieved 12 (full or partial) peanut sequences with high
homology to Ara h 3 as encoded by AF093541, being AF510854 (Ara h 3/4), AY848698,
AF125192, AY722685, AY722686, AY722687, AY618460, AY722688, AF086821 (Ara h 4),
AY439332 and AF487543. Since targeting sequences in conserved regions of the multicopy gene

Chapter 2
46
Ara h 3 is likely to improve the sensitivity of detection methods, primers and probes were designed
to be specific to conserved areas within the Ara h 3 gene family. Figure 1 displays an alignment of 8
sequences focussing on regions in which the sequences showed a high homology. In order to design
assays that specifically detect peanut DNA, primers and probes were designed in DNA regions that
were unique to peanut and lacked similarity, with all non-peanut sequences present in the data base.
Specific software like Integrated DNA Technology, Primer Express and Primer 3, were employed
to check if the parameters for primer and probe design could be met. Unfortunately due to the
strictly defined settings this software was found to be not particularly suited for our primer and
probe design since targeting the selected conserved regions of Ara h 3 limited the freedom of design
and thereby impacted the requirements for real-time PCR conditions and specificity.
AY439332.1 ---GAAGAAGCTTACCATATAGCCCATACAGCCCGCAAACTCAGCCTAAGCAAGAAGACC 710
AF510854.1 ---GAAGAAGCTTACCATATAGCCCATACAGCCCGCAAACTCAGCCTAAACAAGAAGACC 1786
AY722685.1 ---GAAGAAGCTTACCATATAGCCCATACAGCCCGCAAACTCAGCCTAAACAAGAAGACC 758
AY722686.1 ---GAAGAAGCTTACCATATAGCCCATACAGCCCGCAAAGTCAGCCTAGACAAGAAGAGC 732
AF125192.2 ---GAAGAAGCTTACCATATAGCCCATACAGCCCGCAAAGTCAGCCTAGACAAGAAGAGC 706
AF093541.1 GACGAAGAAGCTTACCATATAGCCCATACAGCCCGCAAAGTCAGCCTAGACAAGAAGAGC 640
AY848698.1 GACGAAGAAGCTTACCATATAGCCCATACAGCCCGCAAAGTCAGCCTAGACAAGAAGAGC 752
AF086821.1 GACGAAGAAGCTTACCATATAGCCCATACAGCCCGCATAGTCGGCCTAGACGAGAAGAGC 709
********************************** * ** ***** * ****** *
AY439332.1 GTGAATTTAGCCCTCGAGGACAGCACGGCCGCAGAGAACGAGCAGGACAAGAACAAGAAA 770
AF510854.1 GTGAATTTAGCCCTCGAGGACAGCACGGCCGCAGAGAACGAGCAGGACAAGAACAAGAAA 1846
AY722685.1 GTGAATTTAGCCCTCGAGGACAGCACGGCCGCAGAGAACGAGCAGGACAAGAACAAGAAA 818
AY722686.1 GTGAATTTAGCCCTCGAGGACAGCACAGCCGCAGAGAACGAGCAGGACAAGAACAAGAAA 792
AF125192.2 GTGAATTTAGCCCTCGAGGACAGCACAGCCGCAGAGAACGAGCAGGACAAGAAGAAGAAA 766
AF093541.1 GTGAATTTAGCCCTCGAGGACAGCACAGCCGCAGAGAACGAGCAGGACAAGAAGAAGAAA 700
AY848698.1 GTGAATTTAGTCCTCGAGGACAGCACAGCCGCAGAGAACGAGCAGGACAAGAAGAAGAAA 812
AF086821.1 GTGAATTTCGCCCTCGAGGACAGCACAGCCGCAGAGAACGAGCAGGACAAGAAGAAGAAG 769
******** * *************** ************************** *****
B Forward A Forward
AB Reverse
AY439332.1 ------------------------------------AATGCATTGTTTGTCCCTCACTAC 1255
AF510854.1 TTAGACATTTATTTACATATTGAAATGTGATTGCAGAATGCATTGTTTGTCCCTCACTAC 2505
AY722685.1 ------------------------------------AATGCATTGTTTGTCCCTCACTAC 1303
AY722686.1 ------------------------------------AATGCATTGTTTGTCCCTCACTAC 1277
AF125192.2 ------------------------------------AATGCATTGTTTGTCCCTCACTAC 1224
AF093541.1 ------------------------------------AATGCATTGTTTGTCGCTCACTAC 1158
AY848698.1 ------------------------------------AATGCATTGTTTGTCCCTCACTAC 1270
AF086821.1 ------------------------------------AATGCATTGTTTGTCCCTCACTAC 1227
*************** ********
AY439332.1 AACACGAACGCACACAGCATCATATATGCATTGAGGGGACGGGCTCACGTGCAAGTGGTG 1315
AF510854.1 AACACGAACGCACACAGCATCATATATGCATTGAGGGGACGGGCTCACGTGCAAGTGGTG 2565
AY722685.1 AACACGAACGCACACAGCATCATATATGCATTGAGGGGACGGGCTCACGTGCAAGTGGTG 1363
AY722686.1 AACACCAACGCACACAGCATCATATATGCATTGAGGGGACGGGCTCACGTGCAAGTCGTG 1337
AF125192.2 AACACCAACGCACACAGCATCATATATGCATTGAGGGGACGGGCTCACGTGCAAGTCGTG 1284
AF093541.1 AACACCAACGCACACAGCATCATATATCGATTGAGGGGACGGGCTCACGTGCAAGTCGTG 1218
AY848698.1 AACACCAACGCACACAGCATCATATATGCATTGAGGGGACGGGCTCACGTGCAAGTCGTG 1330
AF086821.1 AACACCAACGCACACAGCATCATATATGCATTGAGGGGACGGGCTCACGTGCAAGTGGTG 1287
***** ********************* *************************** ***
AY439332.1 GACAGCAACGGCGACAGAGTGTTCGACGAGGAGCTTCAAGAAGGTCACGTGCTTGTGGTG 1375
AF510854.1 GACAGCAACGGCGACAGAGTGTTCGACGAGGAGCTTCAAGAAGGTCACGTGCTTGTGGTG 2625
AY722685.1 GACAGCAACGGCGACAGAGTGTTCGACGAGGAGCTTCAAGAAGGTCACGTGCTTGTGGTG 1423
AY722686.1 GACAGCAACGGCAACAGAGTGTACGACGAGGAGCTTCAAGAGGGTCACGTGCTTGTGGTG 1397
AF125192.2 GACAGCAACGGCAACAGAGTGTACGACGAGGAGCTTCAAGAGGGTCACGTGCTTGTGGTG 1344
AF093541.1 GACAGCAACGGCAACAGAGTGTACGACGAGGAGCTTCAAGAGGGTCACGTGCTTGTGGTG 1278
AY848698.1 GACAGCAACGGCAACAGAGTGTACGACGAGGAGCTTCAAGAGGGTCACGTGCTTGTGGTG 1390
AF086821.1 GACAGCAACGGCAACAGAGTGTACGACGAGGAGCTTCAAGAGGGTCACGTTCTTGTGGTG 1347
************ ********* ****************** ******** *********
C Forward
C Reverse
Figure 1: Alignment (ClustalW, http://www.ebi.ac.uk/clustalw/) of the most conserved region of 8 Ara h 3 gene sequences (asterisks indicate nucleotides identical in all sequences). In bold letters the amplicon of the primary Ara h 3 sequence (AF 093541). Primers (boxed) and probes (underlined) are indicated for PCR A, B, and C.

Development of three real-time PCR assays…
47
Three primer sets were therefore manually designed: PCR A (78 bp amplicon, nucleotides 614 - 691
of AF093541), PCR B (105 bp amplicon, nucleotides 587 - 691 of AF093541), PCR C (114 bp
amplicon, nucleotides 1142 – 1255 of AF093541). The alignment shown in Figure 1 depicts the
homology of the primer and probe sequences with 8 sequences of the Ara h 3 gene family. "B
forward" and "AB reverse" primers are fully homologous with all 8 sequences, while "A forward"
shows a perfect homology with 4 of the 8 sequences and contains 2 or 3 mismatches with the
others. The "AB probe" is completely homologous with 3 sequences but is likely to be able to
hybridize to the other 5 since it contains only a single mismatch. "C forward" has been synthesized
with a single mismatch compared to the original Ara h 3 sequence (AF093541) to achieve a perfect
homology with the other 7 sequences, while "C reverse" is homologous with 5 of them. "C probe"
can perfectly hybridize all the gene family members considered.
Specificity test
As described above the specificity of the primer and probe sets was checked by homology searches
to DNA sequences present in the NCBI data base. In addition to this we analysed the specificity
experimentally by using DNA extracts from a variety of different foods. All the food materials
listed in Table 1 were used for DNA extraction, the DNA was quantified and its potential for PCR
amplification was assessed. The amplification of non-coding regions of chloroplast DNA served as
positive control for all plant-derived foods. For non-plant derived matrices, the presence of PCR
inhibitors was investigated by spiking the samples with a positive control. In all DNA extracts of
the foods listed in Table 1 amplification of either the control (chloroplast) DNA or the spiked DNA
was observed. Employing the Ara h 3 primer and probe sets (PCR A, B, C) resulted in a failure to
amplify DNA in any of the foods listed in Table 1, except for peanut. We can therefore conclude
that all three assays are specific for peanut detection.
Moreover, the target sequences can be amplified from all five different peanut varieties that are
included in the IRMM-481 Peanut Test Material Kit (mean Ct values 22.3 ± 1 for the five varieties
and considering all three assays).
All samples were analysed by means of gel electrophoresis and amplified DNA was only detected
in peanut samples. The lengths of the amplification products, as determined by gel electrophoresis
were in agreement with the size of the amplicons.

Chapter 2
48
Table 1: list of food matrices tested in order to verify the specificity of PCR A, B and C. The positive or negative amplification of the DNA extracts was identical for all three assays. Positive (Pos) refers to results with Ct values and Negative (Neg) refers to results where the Ct values were undetermined
Food matrix: PCR test Food matrix: PCR test
Barley (Hordeum vulgare) Neg Chicken (Gallus gallus) Neg
Millet (Panicum miliaceum) Neg Cattle meat (Bos taurus) Neg
Buckwheat (Fagopyrum esculentum) Neg Potato (Solanum tuberosum) Neg
Oat (Avena sativa) Neg Sunflower seeds (Helianthus annuus) Neg
Rye (Secale cereale) Neg Rape seeds (Brassica napus) Neg
Spelt (Triticum dicoccum) Neg Olives (Olea europaea) Neg
Rice (Oryza sativa) Neg Cocoa beans (Theobroma cacao) Neg
Maize (Zea mays) Neg White Lupin (Lupinus albus) Neg
Wheat (Triticum aestivum) Neg Sesame seeds (Sesamum indicum) Neg
Green Pea (Pisum sativum) Neg
Lentils (Lens esculenta) Neg
Mung beans (Phaseolus aureus) Neg Peanut (Arachis hypogaea):
Chick peas (Cicer arietinum) Neg Jumbo Runner from USA Pos
Soya (Glycine max) Neg Virginia from USA Pos
White beans (Phaseolus vulgaris) Neg Runner from Argentina Pos
Almond(Prunus dulcis) Neg Virginia from China Pos
Brazil nut (Bertholletia excelsa) Neg Common Natal from South Africa Pos
Cashew nut (Anacardium occidentale) Neg
Hazelnut (Corylus avellana) Neg
Pecan nut (Carya illinoensis) Neg
Pistachio (Pistacia vera) Neg
Macadamia nut (Macadamia spp) Neg
Walnut (Juglans regia) Neg
PCR and DNA extraction optimization
For the optimization of the real-time PCR methods different parameters were analysed. This
included the primer concentrations and the annealing and elongation temperatures. In addition to
this, different PCR mastermixes were compared.
High specificity in primer annealing and low Ct values for the amplification were aimed at in the
optimization study. The lowest Ct values were obtained by using a low annealing temperature (55
°C) but the specificity of primer annealing improves by increasing temperature, therefore we chose
60 °C for annealing temperature. Further optimization of the method showed that utilizing the Taq
Polymerase from Applied Biosystems and an elongation temperature of 72 °C (instead of 60 °C, as
suggested by the manufacturer), yielded the lowest Ct values.
Next, we aimed to optimize the DNA extraction. A high yield of extraction, a high purity and a
good amplificability of the DNA are important requirements to facilitate the detection of the target

Development of three real-time PCR assays…
49
sequences and to obtain low Ct values. Therefore, an investigation was carried out to determine the
optimum extraction method for the purification of DNA from peanuts.
DNA from raw and roasted peanut was extracted in duplicate with 15 different methods based on
different extraction principles. Some were commercial kits that were utilized according to the
manufacturers' instructions; others were traditional extraction methods, while the last group
employed a traditional extraction buffer combined with a commercial DNA purification system.
The yield of extraction was measured by quantifying each sample in a fluorimetric assay. Since
peanut is known to contain a high level of fats and oils which can potentially be co-extracted with
genomic DNA and inhibit the PCR, we verified the amplificability of the DNA by employing PCR
amplification of non-coding regions of chloroplast DNA. Subsequently each DNA extract was
amplified by all three PCR methods (A, B, and C) in replicates, and the mean of the Ct values was
used to evaluate the performance of the extraction methods.
From the data shown in Table 2, it is clear that with most methods the yield of extracted DNA from
raw peanut is higher than that from roasted peanut.
Regarding the amplification of peanut DNA with the three different methods many differences
could be observed. In general there is no clear correlation between the amount of DNA extracted
and the Ct value obtained as exemplified by the comparison of results obtained with commercial kit
i and the traditional method ix. With the latter the amount of DNA extracted is 10 times higher
(376.49 ng/µl) then that obtained with the commercial kit (30.34 ng/µl). But, since similar Ct values
were obtained the DNA extract of method ix is most likely not pure which affects the PCR
efficiency and results in a high standard deviation (± 2).
Clear differences in the amplification of raw and roasted peanut were observed. For the commercial
kits iii, iv and v, the higher extraction yield of raw peanut is reflected in lower Ct values compared
to roasted peanuts. In contrast to this, utilizing commercial kit i yields three to four times more
DNA from raw compared to roasted peanuts but the amplification rate is quite similar (Ct values of
21-22). Kit vi extracts DNA with similar yields from raw and roasted peanut (5-9 ng/µl) but the
efficiency of amplification is strongly decreased for the roasted peanut extract (from Ct around 28
to Ct around 36). Unfortunately after employing methods i, ii, iii and especially vii amplification of
the extraction blank was observed and therefore those method are considered not to be reliable for
our purpose.
The results obtained with the traditional extraction methods (ix, x, xi), indicate that raw and roasted
peanuts are complex matrices that require special purification to remove PCR inhibitors. A
traditional extraction buffer, such as the CTAB buffer, was therefore combined with purification on

Chapter 2
50
columns, resulting in a lower Ct value (Ct around 20) and lower standard deviation (±0.2) than the
traditional method without further purification (Ct from 20 to 22, ±2).
Method xiii and xiv are also based on a combination of a traditional buffer (containing guanidine
hydrochloride) and a commercial purification system. Unfortunately the yield of extraction is very
low (method xiv, 7 ng/µl) which leads to high Ct values (Ct around 23) or the standard deviation is
too high (method xiii, ±2-3).
Among all the different extraction methods, the best combination of a traditional buffer and a
further purification was found to be method xv: which yields a high DNA concentration, one of the
lowest Ct values for both raw and roasted peanut (Ct value 18-20) while also a very low variability
between the replicates was observed for all three PCRs.
These results led us to use the guanidine hydrochloride extraction buffer combined with the
Wizard® DNA Clean up system (method xv) for all the DNA extractions from raw and roasted
peanut and also from processed foods like cookies.
Table 2: DNA concentration (ng/µl) of the extracts from raw and roasted peanut as obtained with 15 different extraction methods. For each extraction method, the amount of starting material is mentioned in brackets. Replicates of extraction were analysed in duplo with all three PCR methods (A, B, C) utilizing a fixed volume of 5 µl of DNA extract. The Ct values reported refer to the mean value of the four replicates of amplification. The respective standard deviation is given. Ct values of the two blanks of extraction are listed for each PCR assay.
DNA conc. (ng/uL) Ct values and standard deviation
RAW ROASTED RAW peanut ROASTED peanut BLANK OF EXTRACTION
peanut peanut A B C A B C A B C
I DNA extraction kit (2g) 30.34 9.84 22.02 21.76 21.56 21.94 22.19 22.01 38.33 - -
(GMO & Allergen; Tepnel) ±0.24 ±0.69 ±0.43 ±0.12 ±0.12 ±0.1 - - -
II DNAMITE Plant Kit extraction (500mg) 2.58 2.55 36.48 39.23 38.79 - - - - - 37.39
(Microzone Limited) ±0.97 - - - - - - - 0.61
III Wizard® Magnetic DNA Purification 69.06 3.73 19.84 19.68 19.63 25.32 25.61 25.04 38.37 38.12 -
System for Food (200mg), (Promega Co.) ±0.45 ±0.37 ±0.31 ±0.09 ±0.05 ±0.03 ±0.17 - -
IV Wizard® Magnetic DNA Purification 25.57 5.40 21.78 22.32 21.93 25.50 26.29 25.24 - - -
System for Food (1 g), (Promega Co.) ±0.86 ±0.79 ±1.39 ±0.92 ±1.28 ±1.24 - - -
V GenElute TM Plant Genomic DNA Kit (100mg) 17.00 2.53 23.07 22.97 22.29 29.12 29.48 29.18 - - -
(Sigma) ±0.23 ±0.24 ±0.04 ±0.09 ±0.15 ±0.17 - - -
VI Easy-DNATM Kit for genomic ) 9.29 5.35 26.89 28.06 28.80 34.12 36.67 36.62 - - -
DNA isolation (100mg), (Invitrogen Ltd) ±1.60 ±2.44 ±2.85 ±0.53 ±1.57 - - - -
VII SureFood® PREP Allergen Kit (250mg) 49.47 40.27 - - - 24.72 23.03 25.59 36.32 35.40 36.31
(R-Biopharm/Congen) - - - ±3.58 ±0.33 ±3.14 ±0.61 ±0.73 ±1.43
VIII Nucleon PhytoPure plant and fungal DNA 113.20 x - - - x x x - - -
extraction kit (Amersham Biosciences Corp.) (1g) - - - x x x - - -
IX CTAB 376.49 x 21.18 22.37 20.24 x x x - - -
(100mg) ±2.01 ±2.8 ±1.82 x x x - - -
X S.M. Aljanabi et al. protocol 83.82 254.52 28.23 - 24.60 - - - - - -
(1g) ±0.67 - ±0.32 - - - - - -
XI S.M. Aljanabi et al. protocol modified 93.35 29.71 - - - 29.02 - 33.04 - - -
(1g) - - - - - - - - -
XII CTAB+SureFood® PREP Allergen kit (1g) 155.62 x 20.57 20.37 20.30 x x x - - -
(R-Biopharm / Congen) ±0.13 ±0.22 ±0.30 x x x - - -
XIII Guan. Hydr.+DNeasy Plant Mini Kit (1g) 124.78 x 20.55 26.44 21.37 x x x - - -
(Qiagen) ±1.75 ±3.73 ±1.88 x x x - - -
XIV Guan.Hydr.+SureFood® PREP Allergen kit (1g) 7.64 x 23.51 23.17 22.22 x x x - - -
(R-Biopharm / Congen) ±0.12 ±0.03 ±0.14 x x x - - -
XV Guan.Hydr. Wizard® DNA Clean up system (2g) 199.52 41.63 18.92 18.67 17.98 20.15 20.29 19.98 - - - (Promega Co.) ±0.10 ±0.42 ±0.17 ±0.12 ±0.17 ±0.03 - - -

Development of three real-time PCR assays…
51
Sensitivity
In order to protect the health of allergic consumers, methods need to be sensitive and capable of
detecting trace amounts of peanut. Therefore the performance of all three PCR assays was analysed
to determine how many copies of peanut genome equivalents they are able to detect. For this
purpose we used a DNA mixture of equal aliquots of the 5 different peanut varieties included in the
standard material IRMM-481. The extracted DNA mixture was diluted in water to establish two
different standard curves: from 1 pg to 100 ng and from 1.25 pg to 40 pg. The amplification was
carried out over 40 cycles, which is our defined cut-off, that avoids false positive signals that might
appear due to artefacts of amplification when the thermal cycle is too long (Kolmodin et al., 2000).
Figure 2 shows that PCR A, B and C are all capable of detecting 2.5 pg peanut DNA, while also
aliquots of 1.25 pg peanut DNA can still be detected within 40 cycles of amplification, but the
amplification curves show an increased variability of results around 1.25 pg, which renders the
results not reliable enough for this sensitivity test. The peanut genome size is estimated to be around
2.8 Mb (Guo et al., 2004; Dhillon et al., 1980), and by applying the appropriate calculations
(http://www.appliedbiosystems.com/support/tutorials/pdf/quant_pcr.pdf), it turns out that the
weight of the entire peanut genome is around 3 pg. All three real-time PCR assays can detect less
than 3 pg, which implies that they can all detect less than 1 genome equivalent. This can be
explained by the fact that the target sequences are located in the conserved area of the Ara h 3 gene
family and therefore are repeated in the peanut genome. These results confirm our choice for Ara h
3 as target sequence. Previously Stephan and Vieths (Stephan and Vieths, 2004) have described an
assay that can detect 10 copies of peanut genome, while the real-time PCR method developed by
Hird et al. (Hird et al., 2003) was show to have a detection limit of 34 genome copies (Brežná et al.,
2005). The conventional PCR designed by Watanabe et al. (Watanabe et al., 2006) which is also
based on the principle of targeting a multicopy gene is capable of detecting less than one genome
equivalent but only in qualitative format, as detected by gel electrophoresis.
Another parameter that can be derived from these standard curves is the PCR efficiency. The slope
of the log-linear phase of the amplification curves is a reflection of the reaction efficiency. The
efficiency can therefore be calculated by the following equation: Efficiency = (10(-1/slope))–1. In
order to obtain accurate and reproducible results, reactions should have an efficiency as close to 100
% as possible and an ideal slope of -3.3. The PCR efficiency for all three PCR assays in the case of
the high range dilutions (1 pg to 100 ng) was in the range of 91-93% with a slope ranging from -
3.49 to -3.53. Moreover, as shown in Figure 2, the PCR efficiency remained high (in a range of 77
to 100%) when only the smaller amounts of DNA template (1.25 pg to 40 pg) were used for

Chapter 2
52
amplification. This means that all three assays are sensitive and efficient enough to be applied for
the detection of trace amounts of peanut.
Peanut detection in a model food
As described above for the determination of the specificity, the efficiency and the sensitivity of all
three PCR assays, pure peanut DNA extracts were analysed. However, the real application of the
methods lies in the detection of peanut traces in food products. Therefore real food samples, spiked
with peanut were developed. Since the health of allergic consumers is most likely to be endangered
by the accidental ingestion of peanut traces in complex food matrices that can contain a variety of
different ingredients and might have undergone a heat treatment, we developed a processed food
matrix for bakery products to which peanut was added before food processing. The peanut mix
IRMM-481 was used for spiking. Cookies with different peanut contents (0, 1, 10, 100, 1000,
10000 mg kg-1) were prepared in a pilot bakery plant according to a standard recipe. The resulting
material was used to study the performance of the real-time PCR methods developed in this study.
All different cookies were extracted in duplicate, the DNA content of the extracts was quantified
and replicates of amplification were performed. Since the yield of extraction was comparable for all
the samples (ranging from 65 to 100 ng/µl), a fixed volume of DNA extract (5 µl) was utilized in
the PCR analyses. Figure 3 shows an example of an amplification plot obtained with PCR B. The
cut-off for amplification was set at 40 cycles, which is very low compared to other published
32
34
36
38
40
1 10 100DNA (pg)
Ct V
alu
e
32
34
36
38
40
1 10 100DNA (pg)
Ct V
alu
e
32
34
36
38
40
1 10 100DNA (pg)
Ct
Valu
e
PCR A
PCR B
PCR C
2.5
2.5
2.5
32
34
36
38
40
1 10 100DNA (pg)
Ct V
alu
e
32
34
36
38
40
1 10 100DNA (pg)
Ct V
alu
e
32
34
36
38
40
1 10 100DNA (pg)
Ct
Valu
e
PCR A
PCR B
PCR C
2.5
2.5
2.5
PCR A PCR B PCR C
Slope -4.03 -3.12 -3.60
Y-intercept 39.14 38.58 38.56
R2
0.93 0.91 0.92
Efficiency 0.77 1.09 0.89
Figure 2: Standard curves of PCR methods A, B and C obtained by amplifying 1.25, 2.5, 5, 10, 20 and 40 pg peanut DNA diluted in water. The table below lists the slope, the y-intercept and the R2 of each curve and the calculated PCR efficiency of each assay (calculated by using SDS 2.2, Applied Biosystems, UK).

Development of three real-time PCR assays…
53
methods (Stephan and Vieths, 2004). Despite this restrictive setting, 10 mg kg-1 peanut can clearly
be detected in the cookies by all three PCR methods and this level was considered to be the limit of
detection for the PCR assays (Table 3). After PCR the samples were also analysed by means of gel
electrophoresis and a single band of amplified DNA was detected which was in agreement with the
size of the amplicons. This level of 10 mg kg-1 is within the range of detection limits that are
relevant for the detection of potentially hazardous residues of undeclared allergens in foods (Hefle
and Koppelman, 2006) but it is higher than the sensitivity that can be reached by some ELISA
assays (Poms et al., 2005; Yeung and Collins, 2005), although these data are not directly
comparable to our results due to differences in the preparation of the spiked food products. The
sensitivity of ELISA assays is often assessed by using food matrices like chocolate or cookies
spiked with pure peanut protein extract where the peanut does not undergo the heat treatment
typical for industrial production. The material we used for our experiments aimed to better represent
products from the market. The linear response of the PCR amplification ranges from 10 mg kg-1 to
10000 mg kg-1 indicating that all three PCR methods are capable of a quantitative analysis of the
peanut content in this complex, processed food matrix.
PCR A PCR B PCR C
Peanut (mg kg-1
) Ct value ± std dev Ct value ± std dev Ct value ± std dev
Blank - - -
1 - - 39.26a ± -
10 37.40 ± 0.79 37.76 ± 0.36 b 37.78 ± 1.25
b
100 34.33 ± 0.28 34.74 ± 0.23 34.24 ± 0.28
1000 31.30 ± 0.11 31.39 ± 0.13 30.99 ± 0.11
10 000 27.60 ± 0.06 27.92 ± 0.09 27.18 ± 0.06
Pos control10 000
1 000
100
10
1
PCR B
Pos control10 000
1 000
100
10
1
PCR B
Figure 3: Amplification plot of PCR B (105 bp), obtained by analysing the DNA extracted from cookies containing 10000, 1000, 100, 10 and 1 mg kg-1 of peanut, and a positive control (pure peanut DNA).
Table 3: Mean Ct values of 4 replicates and their standard deviations as obtained from the analysis of DNA extracted from cookies containing 10 000, 1000, 100, 10, 1 mg kg-1 peanut and amplified with PCR methods A, B and C.
a In 3 out of 4 reactions the Ct values were undetermined b In 1 out of 4 reactions the Ct value was undetermined

Chapter 2
54
Limit of Detection (LOD) and Limit of Quantification (LOQ) are parameters indicative of the
method performance for quantitative analyses. In quantitative PCR, LOD and LOQ need to be
experimentally determined because the blank values normally used for the calculation (LOD is
generally defined as the signal strength of a blank increased by three times the standard deviation
while LOQ is the signal strength of a blank increased by six-ten times the standard deviation of the
blank) is defined as undetermined (truncated at zero).
In practice, the two sensitivity values obtained by our methods describe the linear range within
which peanut DNA in a water solution (until less than 1 copy of genome equivalent) or in a
processed food matrix (from 10 to 10000 mg kg-1) can be quantified with suitable accuracy as
determined in a method validation (Range of Quantification, ROQ) (Lipp et al., 2005).
The ROQ established by employing a food matrix might differ from that employing pure peanut
DNA, since food matrices can contain polysaccharides, proteins, phenolic compounds, and proteins
that might be cross-linked to DNA through carbohydrates. All such compounds that can be present
in complex food matrices and might be co-extracted with the target DNA could affect the efficiency
of the PCR reaction. Such "PCR inhibitors" may vary in their extent to which they affect individual
PCR analyses. This effect of the model matrix was determined by comparing the amplification plot
obtained by analysing subsequent dilutions of peanut DNA (IRMM-481) in water or in blank
cookie extract. The calibration curves obtained were found to be very similar. Table 4 shows the
comparison of the slopes, y intercepts and R squares values. The data indicate that the PCR reaction
is not affected by any extracted cookie matrix components. Studies on the matrix effect on PCR
detection of peanut are generally not reported despite the fact that such assays have been applied to
several different food products (Stephan and Vieths, 2004; Hird et al., 2003; Watanabe et al., 2006).
In order to assess the performance of the real-time PCR methods developed in this study we
employed two commercial test kits for the detection of peanut, one based on real-time PCR and the
other one on conventional PCR. Unfortunately the use of the real-time PCR kit combined with the
extraction kit produced by the same supplier yielded false positive results after analysis of the blank
of extraction. Moreover, despite the declared limits of detection in food products of 10 mg kg-1 for
the real-time PCR kit and "low level" for the conventional PCR based kit, we were unable to
reliably detect less than 50 mg kg-1 peanut in cookies. This emphasises the good reliability and
sensitivity of the methods developed in this study.

Development of three real-time PCR assays…
55
PCR A PCR B PCR C
Blank cookies Water Blank cookies Water Blank cookies Water
Slope -2.91 -2.85 -3.00 -2.95 -2.87 -2.92
Y-Intercept 27.05 26.63 27.26 26.91 26.67 26.39
R2 0.99 0.98 0.99 0.98 0.99 0.97
Conclusions
The development of specific and sensitive analytical methods for the quantification of hidden
allergens in food products is a great challenge. Over recent years several DNA based assays for
allergenic foods like peanut (Stephan and Vieths, 2004; Hird et al., 2003; Watanabe et al., 2006;
Sforza et al., 2005; Rossi et al., 2006), wheat (Köppel et al., 1998) , olive (Aché et al., 2002), apple
(Son et al., 1999), hazelnut (Holzhaueser et al., 2000, 2002; Herman et al., 2003; Arlorio et al.,
2007), cashew nut (Brzezinski, 2006), pea (Brežná et al., 2006a), and walnut (Brežná et al., 2006b)
have been developed and serve as good alternatives to protein-based detection methods.
In this study we developed three different real-time PCR assays targeting conserved DNA
sequences in the Ara h 3 gene family. All three PCR assays are specific for peanut, have a detection
limit of less than 1 copy of genome equivalent, while in a complex processed food matrix 10 mg kg-
1 peanut can clearly be detected, furthermore no influences of the cookie matrix were observed. The
cookie material used represents a DNA-rich food matrix which is likely to negatively impact the
sensitivity that can be achieved. Despite this, the developed methodology is capable of detecting 10
mg kg-1 peanut in cookies which is low enough to be comparable to the range of threshold doses
eliciting allergic reactions in sensitized people (Krska et al., 2004). The linear range within which
peanut DNA can be quantified with an appropriate accuracy is between 10 and 10 000 mg kg-1 in
cookies. This represents a major advantage compared to the very limited working range of ELISA
test kits. The fact that the real-time PCR methods described here, in contrast to ELISA analyses, do
not require several dilutions of samples to quantify a high levels of peanut implies that the method
is efficient in terms of labour and costs.
Hird et al. (Hird et al., 2003) reported a real-time PCR assay and presented data related to dilutions
of pure peanut DNA extract and several real food samples, while Stephan and Vieths (Stephan and
Vieths, 2004) have shown a comparison between samples analysed by ELISA and a real-time PCR
method. Watanabe et al. (Watanabe et al., 2006) have reported a conventional PCR method
combined with gel electrophoresis. In all those cases PCR was only used as a qualitative method for
peanut detection in food (for real-time PCR results Ct values are given, but peanut content was not
Table 4: The slope, y-intercept, and R square derived from the three curves (PCR A, B, C) obtained by amplifying peanut DNA (IRMM-481) diluted in water or in blank cookie extract.

Chapter 2
56
determined). For the two-real-time PCR methods, no strict settings on the number of PCR cycles or
on the standard deviation between the replicates were defined. Nevertheless, Stephan and Vieths
(2004) reported that Ct values higher than 45 with standard deviation of ± 2 are likely to identify
positive samples, but for such samples a correlation with the ELISA rates could no longer be
observed. In the present study the use of a model food matrix with a precise peanut content, enables
us to apply the real-time PCR technique for a quantitative determination of the peanut content. We
conclude that the three methods developed in this study can be applied in the near future to detect
peanut traces in commercial food products.
References
Aché J D, Castro A J, Rodriguez-Garcia M I (2002) Micron, 33:33-37
Anklam E, Gadani F, Heinze P, Pijnenburg H, Van den Eede G (2002) Analytical methods for detection and determination of genetically modified organisms in agricultural crops and plant-derived food products. Eur Food Res Technol, 214:3-26.
Arlorio M, Cereti E, Coïsson J D, Travaglia F, Martelli A (2007) Detection of hazelnut (Corylus spp.) in processed foods using real-time PCR. Food Control, 18:140–148.
Besler M (2001) Determination of allergens in foods. Trends in Analytical Chemistry 20:662-672
Brežná B, Hudecová L, Kuchta T (2005) Detection of peanuts in food products by real-time polymerase chain reaction. Archiv fur Lebensmittelhygiene, 56:112-113.
Brežná B, Hudecová L, Kuchta T (2006) A novel real-time polymerase chain reaction (PCR) method for the detection of walnuts in food. Eur Food Res Technol, 223:373-377.
Brežná B, Hudecová L, Kuchta T (2006) Detection of pean in food by real-time polymerase chain reaction (PCR). Eur Food Res Technol, 222:600-603.
Brzezinski (2006) Detection of cashew nut DNA in spiked baked goods using a real-time polymerase chain reaction. J AOAC Int, 89:1035-1038.
Burks A W, Sampson H A and Bannon, G A (1998) Peanut allergen. Allergy, 53:725–730.
Crevel R (2006) In Koppelman SJ, Hefle SL (eds) Detecting allergens in food, Woodhead Publishing Limited, Cambridge, UK, pp 315-328.
Dahinden I, von Büren M, Lüthy J (2001) A quantitative competitive PCR system to detect contamination of wheat, barley or rye in gluten-free food for coeliac patients. Eur Food Res Technol, 212: 228-233.
Dhillon S, Rake A, Miksche J (1980) Reassociation kinetics and cytophotometric characterisation of peanut (Arachis hypogaea L.) DNA. Plant Physiol, 65:1121-1127.
European Parliament and Council (2000) Directive 2000/13/EC of 20 March 2000 on the approximation of the laws of the Member States relating to the labelling, presentation and advertising of foodstuffs. Official J Europ Commun, L109, 29-42. European Parliament and Council (2003)
European Parliament and Council (2003) Directive 2003/89/EC of 10 November 2003 amending Directive 2000/13/EC as regards indication of the ingredients present in foodstuffs. Official J Europ Commun, L308, 15-18
Food and Agricultural Organization of the United Nations (1995) Report of the FAO Technical Consultation on Food Allergies, Rome, Italy.

Development of three real-time PCR assays…
57
Germini A, Scaravelli E, Lesignoli F, Sforza S, Corradini R, Marchelli R (2005) Polymerase chain reaction coupled with peptide nucleic acid high-performance liquid chromatography for the sensitive detection of traces of potentially allergenic hazelnut in foodstuffs. Eur Food Res Technol, 220:619-624.
Guo B, Liang X Q, Luo M, Wang M L, Holbrook Jr C C (2004). Progress in peanut functional genomics, a strategy to mitigate aflatoxin contamination and improve other important traits. In: Proceedings of the 17th Aflatoxin Elimination Workshop, October 25-28, 2004, Sacramento, California
Hefle S, Koppelman S (2006) In Koppelman SJ, Hefle SL (eds) Detecting allergens in food, Woodhead Publishing Limited, Cambridge, UK, pp 405-412.
Helm R M, Burks A W (2000) Mechanisms of food allergy. Curr Opin Immunol, 12:647-653.
Herman L, De Block J, Viane R (2003) Detection of hazelnut DNA traces in chocolate by PCR International. Int J Food Sci Technol, 38:633-640.
Hird H, Lloyd J, Goodier R, Brown J, Reece P (2003) Detection of peanut using real-time polymerase chain reaction. Eur Food Res Technol, 217:265–268.
Holzhauser T, Stephan O, Vieths S (2002) Detection of Potentially Allergenic Hazelnut (Corylus avellana) Residues in Food: A Comparative Study with DNA PCR-ELISA and Protein Sandwich-ELISA. J Agric Food Chem, 50:808-5815.
Holzhauser T, Wangorsch A, Vieths S (2000) Polymerase chain reaction (PCR) for detection of potentially allergenic hazelnut residues in complex food matrixes. Eur Food Res Technol, 211:360-365.
Hourihane J O’ B, Kilburn S A, Nordlee J A, Hefle S L, Taylor S L and Warner J O (1997) An evaluation of the sensitivity of subjects with peanut allergy to very low doses of peanut protein: a randomized, double-blind, placebo-controlled food challenge study. J Allergy Clin Immunol, 100:596–600.
Hourihane J O' B, Kilburn S A, Dean P, Warner J O (1997) Clinical characteristics of peanut allergy. J Clin. Exp Allergy, 27:634-639.
Immer U (2006) In Koppelman SJ, Hefle SL (eds) Detecting allergens in food, Woodhead Publishing Limited, Cambridge, UK, pp 330-347.
Kiening M, Niessner R, Drs E, Baumgartner S, Krska R, Bremer M, Tomkies V, Reece P, Danks C, Immer U, Weller MG (2005) Sandwich immunoassays for the determination of peanut and hazelnut traces in foods. J Agric Food Chem, 53:3321-3327.
Kolmodin L A (2000) The Nucleic Acid Protocols Handbook, Humana Press Inc., Totowa, NJ-USA pp 569-580.
Köppel E, Stadler M, Lüthy J, Hübner P (1998) Detection of wheat contamination in oats by Polymerase Chain Reaction (PCR) and Enzyme-Linked Immunosorbent Assay (ELISA). Eur Food Res Technol, 206:399-403.
Koppelman S J, Knol E F, Vlooswijk R A, Wensing M, Knulst A C, Hefle S L, et al. (2003) Peanut allergen Ara h 3: isolation from peanuts and biochemical characterization. Allergy, 58:1144-51.
Krska R, Welzig E, Baumgartner S (2004) Immunoanalytical detection of allergenic proteins in food. Anal Bioanal Chem, 378:63-65.
Lipp M, Shillito R, Giroux R, Spiegelhalter F, Charlton S, Pinero D, Song P (2005) Polymerase chain reaction technology as analytical tool in agricultural biotechnology. J AOAC Int, 88:136-55.
Maleki S J, Chung S Y, Champagne E R, Raufman J P (2000) The effects of roasting on the allergenic properties of peanut proteins. J Allergy Clin Immunol, 106:763–768.
Piersma S R, Gaspari M, Hefle S L, Koppelman S J (2005) Proteolytic processing of the peanut allergen Ara h 3. Mol Nutr Food Res, 49:744-55.
Poms R E, Agazzi M E, Bau A, Brohée M, Capelletti C, Nørgaard J V and Anklam E (2005) Inter-laboratory validation study of five commercial ELISA test kits for the determination of peanut proteins in biscuits and dark chocolate. Food Addit Contam, 22:104.
Poms R E, Klein Ch, Anklam E (2004) Methods for allergen analysis in food: A review. Food Addit Contam, 21:1-31.
Rossi S, Scaravelli E, Germini A, Corradini R, Marchelli R (2006) A PNA-array platform for the detection of hidden allergens in foodstuffs. Eur Food Res Technol, 223:1-6.
Salah M, Aljanabi, Iciar Martinez (1997) Universal and rapid salt-extraction of high quality genomic DNA for PCR-based techniques. Nucl Acids Res, 25:4692–4693.

Chapter 2
58
Sampson H, Mendelson L, Rosen J (1992) Fatal and near-fatal anaphylactic reactions to food in children and adolescents. N Engl J Med, 327:380-384
Sforza S, Scaravelli E, Corradini R, Marchelli R (2005) Unconventional method based on circular dichroism to detect peanut DNA in food by means of a PNA probe and a cyanine dye. Chirality, 17:515-521.
Sicherer S H, Munoz-Furlong A and Sampson H A (2004) Prevalence of seafood allergy in the United States determined by a random telephone survey. J Allergy Clin Immunol, 114:159–165.
Sicherer S H, Munoz-Furlong A, Burks A W and Sampson H A (1999) Prevalence of peanut and tree nut allergy in the US determined by a random digit dial telephone survey. J Allergy Clin Immunol, 103:559–562.
Sicherer S H, Munoz-Furlong A, Sampson H A (2003) Prevalence of peanut and tree nut allergy in the United States determined by means of a random digit dial telephone survey: A 5-year follow-up study. J Allergy Clin Immunol, 112:1203–1207.
Son D Y, Scheurer S, Hoffmann A, Haustein D, Vieths S (1999) Pollen-related food allergy: Cloning and immunological analysis of isoforms and mutants of Mal d 1, the major apple allergen, and Bet v 1, the major birch pollen allergen. Eur J Nutr, 38:201-215.
Stephan O, Vieths S (2004) Development of a real-time PCR and a sandwich ELISA for detection of potentially allergenic trace amounts of peanut (Arachis hypogaea) in processed foods. J Agric Food Chem, 52:3754-3760.
Taberlet P, Gielly L, Pautou G, Buovet J (1991) Universal primers for amplification of three non-coding regions of chloroplast DNA. Plant Molecular Biology, 17:1105-1109.
Viquez O M, Konan K N, Dodo H W (2004) Genomic organization of peanut allergen gene, Ara h 3. Mol Immunol, 41:1235-40.
Watanabe T, Akiyama H, Maleki S, Yamakawa H, Iijima K, Yamazaki F, Matsumoto T, Futo S, Arakawa F, Watai M, Maitani T (2006) A specific qualitative detection method for peanut (Arachis Hypogaea) in foods using polymerase chain reaction. J Food Biochemistry, 30:215-233.
Yan Y S, Lin X D, Zhang Y S, Wang L, Wu K, Huang S Z (2005) Isolation of peanut cDNAs encoding arachins and conglutins by expressed sequence tags. Plant Science, 169:439-445.
Yeung J M, Collins P G (1996) Enzyme immunoassay for determination of peanut proteins in food products. J AOAC Int, 79:1411-1416.
Yunginger J W, Sweeney K G, Sturner W Q, Giannandrea L A, Teigland J D, Bray M, Benson P A, York J A, Biedrzycki L, Squillace D L and Helm R M (1988) Fatal food-induced anaphylaxis. JAMA, 260:1450–1452.
http://www.appliedbiosystems.com/support/tutorials/pdf/quant_pcr.pdf.
http://www.ars.usda.gov/research/publications/publications.htm?SEQ_NO_115=169941.
http://www.bioinfo.rpi.edu/applications/mfold/dna/form1.cgi.
http://www.ebi.ac.uk/clustalw/.
http://www.idtdna.com/analyzer/Applications/OligoAnalyzer/Default.aspx.
http://www.ncbi.nlm.nih.gov/.
http://www.ncbi.nlm.nih.gov/BLAST/.
http://www-genome.wi.mit.edu/cgi-bin/primer/primer3_www.cgi.

Chapter 3
The effect of heat treatment on the detection of peanut allergens
as determined by ELISA and real-time PCR
Peanut allergic reactions that can result from the ingestion of even very small quantities of peanut
represent a severe threat to the health of sensitised individuals. The detection of peanut traces in
food products is therefore of prime importance. Peanut traces which can be (unintentionally) present
in a multitude of food products have usually undergone one or more food processing steps like
roasting and baking. Therefore, the methods designed to detect such traces have to be capable of
detecting heat treated peanut. Commonly used methodologies designed to detect peanut traces in
food products are enzyme-linked immunosorbent assays (ELISAs) that detect peanut specific
proteins, and polymerase chain reaction (PCR) based methods targeting peanut specific DNA. A
comparative analysis of such methods was performed and the impact of heat treatment on peanut
kernels as well as the impact on a peanut-containing food matrix was investigated. Our results show
that heat treatments have a detrimental effect on the detection of peanut with either type of method
and that both types of methods are affected in a similar manner.
Elena Scaravelli, Marcel Brohée, Rosangela Marchelli and Arjon J. van Hengel
Chapter 3
60
Introduction
Food allergy is a serious public health problem. Around 1–2 % of the population suffer from some
type of food allergy and even higher prevalence levels (up to 8 %) are estimated for children
(Sicherer et al., 2003, 2004; Helm et al., 2000; Ortolani et al., 2001). The severity of the reactions
triggered by food allergens vary from mild urticaria to potentially lethal anaphylactic shocks, even
after the ingestion of minimal doses of the allergenic food. It is estimated that in the United States
about 30,000 anaphylactic reactions to food are treated in emergency departments and that food
allergy results in 150-200 deaths each year (Sampson, 2003). Peanuts and tree nuts are responsible
for the majority of deaths attributed to food allergies (Bock et al., 2001; Pumphrey, 2001).
Unfortunately, avoidance is the only means allergic consumers have to protect their health.
Therefore, EU legislation has been issued aimed at informing the consumer about the content of
food products by means of a manditory labelling of allergenic food ingredients. The new EU
Directive 2007/68/EC, which is an amendment to Directive 2000/13/EC (European Parliament and
Council, 2000, 2007), provides a list of 14 groups of allergenic foods that manufacturers are
required to declare on the labels if any of them are used as ingredients in pre-packed foods,
regardless of their quantity. Reliable analytical methods for the detection of hidden allergens in
foodstuff are therefore required by the food industry and food control authorities to guarantee food
safety for allergic consumers.
Food allergens, the components capable of triggering allergic reactions, are usually proteins. The
structure and chemical properties of proteins are known to be influenced by food processing
techniques such as boiling, baking, roasting, curing, and other types of food processing.
It has been reported that the allergenic activity of the peanut allergens Ara h 1, Ara h 2, and Ara h 3
increases with roasting while it decreases with frying or boiling (Maleki et al., 2000; Beyer et al.,
2001). This decreased allergenicity was suggested to be a contributing factor in the lower
prevalence of peanut allergy in China where peanuts are mainly boiled or fried compared with the
United States where they are consumed roasted (Beyer et al., 2001).
Thermal processing of foods is known to result in a degradation of food constituents, or in their
modification. Such modifications can result from Maillard reactions, which are important in the
development of flavour and colour in peanuts (Maleki et al., 2000; Chung and Champagne, 2001).
In addition, interactions with other constituents of the food matrix may occur as a result of thermal
processing.
All these modifications often result in a decreased protein solubility which affects protein extraction
from food matrices. In peanut it has been shown that protein solubility decreases due to industrially

The effect of heat treatment on the detection…
61
applied processing techniques like roasting (Chaissagne et al., 2007; Mondoulet et al., 2005; Poms
et al., 2004). Furthermore, the integrity of the target proteins could be changed during food
processing leading to a further reduction in their detectability, since any analytical method based on
the detection of markers for allergenic ingredients depends on an efficient extraction of such
markers and their structural integrity.
Currently, Enzyme-Linked Immunosorbent Assay (ELISA) is probably the method that is most
commonly used by the food industry and official food control agencies to assess the presence of
allergens in food products. ELISAs are immunochemical based tests, which can be either designed
to specifically recognize one allergenic protein, or to detect a pool of proteins contained in the
protein extract of the allergenic food (Krska et al., 2004). They usually employ IgG antibodies
raised in animals, which bind allergen specific epitopes. But, in case of modifications of the protein
structure or matrix effects this antibody binding could be affected.
An alternative to ELISA is provided by DNA based methods. Several of such methods have
recently been developed for the detection of peanut traces in food products (Hird et al., 2003;
Stephan and Vieths, 2004; Sforza et al., 2005; Rossi et al., 2006; Watanabe et al., 2006; Scaravelli
et al., in press). The target molecules of these detection methods are not proteins but specific DNA
sequences which are amplified by the Polymerase Chain Reaction (PCR). This technique is
commonly used in the detection of genetically modified organisms (GMO) and, when applied to
allergen detection, it represents an indirect investigation of the allergenic ingredients. The target
sequences can be designed on the gene coding for the allergenic protein or simply, on a species-
specific region in the genome of the allergenic food. For peanut allergen detection, several real-time
PCR assays have been developed (Hird et al., 2003; Stephan and Vieths, 2004; Scaravelli et al., in
press) that, like ELISA, have the potential to be applied for quantitative purposes. Although DNA
based methods target a different analyte compared to immunological methods like ELISA, food
processing also affects the integrity and extractability of this target.
Consumers are almost solely exposed to heat treated peanuts since, for direct consumption, peanuts
are usually roasted. Moreover, peanuts are widely used in different preparations like snacks and
biscuits, and in the confectionary industry. This implies that they undergo additional (thermal) food
processes. It is therefore of utmost importance to investigate the negative effects that food processes
like thermal treatments exert on the detection of peanut specific markers being either proteins or
DNA.
Previously several studies have reported a qualitative comparison of ELISA kits and DNA methods
for the analysis of processed food products (Stephan and Vieths, 2004; Watanabe et al., 2006;
Piknova et al., 2007), but such studies have not addressed the influence of food processing on either

Chapter 3
62
type of detection methodology. In this study three real-time PCR assays all targeting DNA
sequences coding for Ara h 3 (Scaravelli et al., in press) are used in parallel with two different
ELISA kits for the analysis of raw and roasted peanut as well as on a heat treated model food matrix
containing peanut. The main focus of this study lies on the effect that heat treatments on peanut
kernels and on cookies containing peanut have on the detection of peanut protein and DNA targets.
The reactivity of the different detection methods towards processed allergenic foods, to which
sensitized consumers are exposed to, was investigated. This allows an assessment of the possibility
to confirm analytical results for the detection of peanut traces in processed food products obtained
by ELISA with real-time PCR assays or vice versa.
Materials and Methods
Food samples
Five varieties of peanut, identical to the 5 peanut components included in the IRMM-481 peanut
test material (IRMM, Belgium), were analysed. Each component corresponds to a single peanut
variety that underwent a specific heat treatment, being blanching or roasting as listed in Table 1.
The peanuts were obtained from IMKO (The Netherlands) and Duyvis (The Netherlands). In
addition to this, raw peanuts were obtained from the same suppliers. Except for peanut component
d, for which only blanched peanut was available (blanching conditions: 20 minutes at 90ºC), while
the raw peanut component c was provided by Golden Peanuts (USA). In addition to the single
varieties the mixture of the 5 processed materials (component f of IRMM-481) was analysed.
A fine peanut powder of the mixture of the 5 peanut materials (component f of IRMM-481) had
been used to spike cookies as described previously (Scaravelli et al., in press). The peanut content
in the cookies was approximately 10 000, 1000, 100 and 10 mg kg-1. All cookies were baked at 180
°C with a standard baking time of 16 minutes, or for different periods of time being 11, 21 or 26
minutes. All spiked cookies were ground, sieved on 0.7 µm sieves and aliquots of 15 or 30 g of the
resulting powder were packed under vacuum in aluminium foil bags and stored at -20 °C until use.

The effect of heat treatment on the detection…
63
DNA extraction and quantification
DNA extraction was performed combining a guanidine hydrochloride based extraction and the
Wizard® DNA Clean up system (Promega, Madison, USA) as described previously (Scaravelli et
al., in press). Samples of 2 g (± 0.1 g) pure peanut and 5 g (± 0.1 g) cookies were used for DNA
extraction Each sample was extracted in duplicate and the purified DNA from peanut and cookies
was eluted in 100 µl and 130 µl TE buffer (10 mM Tris-HCl, 1 mM disodium EDTA, pH 8.0)
respectively.
DNA quantification was carried out as described previously (Scaravelli et al., in press).
Real-time PCR
PCR A, PCR B and PCR C all targeting Ara h 3 (Scaravelli et al., in press) have been applied.
For sample analysis two separate DNA extractions were performed while two aliquots of 5 µl DNA
extract were amplified in two separate reactions. In the case of the analysis of pure peanut extracts,
DNA was diluted 1:10 and 5 µl of solution was added to each reaction. The dilution was taken into
account for the expression of results.
For all analyses the ABI Prism 7900HT Sequence Detection System (Applied Biosystems, UK) was
used with an automatic baseline setting and a threshold value of 0.15.
Each 96-well plate included three non-template controls (NTCs) and two positive control samples.
For each sample the final Ct values used for the calculation of quantitative results refer to the mean
value of four replicates (two replicates of extraction and two replicates of amplification). For
quantification purposes a cut-off Ct value of 40 was set, but higher Ct values up till 45 were
considered acceptable for qualitative results.
ELISA methods
Two commercially available test kits targeting a specific peanut allergen were used: Biokits Peanut
Assay kit (Tepnel BioSystems, UK), targeting Ara h 1; Peanut Residue ELISA kit (ELISA Systems,
Australia), targeting Ara h 2. The ELISA test kits were used according to the manufacturer's
instructions, by following the enclosed protocols. For sample analysis two separate protein
extractions were performed and analysed in two separate reactions.

Chapter 3
64
Methods of analysis
Homogeneity test
The homogeneity of the cookie material was tested by employing the BioSystems peanut allergen
test kit as well as the three PCR methods. Cookies of the two lowest spiking levels, containing
either 10 or 100 mg peanut per kg cookie, that were baked for 16 minutes (standard baking time)
were analysed for this purpose. Two samples from ten different bags of each concentration level
were randomly taken and analysed in triplicate. The averages of the optical density (OD) or Ct
values were subjected to a statistical analysis of variance (ANOVA), in order to assess the
homogeneity of the cookie material.
Calibration model
A statistical approach was followed to analyse all data obtained with the real-time PCR for
quantitative purposes. To identify the best calibration model Microsoft Excel was used and the
guidelines of Miller and Miller were followed (Miller and Miller, 2005). The equations obtained
were confirmed by Statgraphics Plus (version5.1; StatPoint.Inc, Virginia).
Calibration model with DNA dilutions (real-time PCR A, B, C)
DNA extracted from IRMM-481 component f (a mixture of 5 peanut materials) was used to prepare
subsequent DNA dilutions in water to establish a standard curve from 1 pg to 100 ng (1 pg, 10 pg,
100 pg, 1 ng, 10 ng, 100 ng) for each PCR method. Three separate reactions were performed for
each concentration level on two different days, using different stocks of PCR reagents. The equation
of the calibration curve was generated by applying a weighted linear regression and plotting the Ct
values against the logarithm of the corresponding DNA quantity (calibration points). The weighting
factors were calculated according to the following equation (Miller and Miller, 2005):
wi = si-2 / ∑i ( si
-2 /n)
where wi : individual weights of each calibration points
si : standard deviation of the replicates per each calibration point
n : number of calibration points
The curves obtained for each of the three PCR assays were used to interpolate unknown samples
and to determine the amount of peanut DNA in the respective PCR reactions.
For the analysis of unknown samples, two DNA extracts were obtained from each material and two
aliquots of both DNA extracts were taken for the analysis with each of the PCR assays. The average

The effect of heat treatment on the detection…
65
of those 4 values was interpolated in the respective PCR standard curve to define the peanut DNA
content of the unknown samples.
Calibration model with cookies containing peanut (real-time PCR C)
A weighted linear regression was also applied to the Ct values obtained by amplifying DNA
extracted from peanut containing cookies that were baked for 16 minutes (standard baking time),
using PCR C. For each of the four calibration points (peanut spiking levels of 10, 100, 1000, 10000
mg kg-1), four PCR reactions were performed (two replicates per each of the two DNA extracts).
The PCR reaction was then repeated twice on different days using different stocks of PCR reagents.
The final set of analysis was composed of twelve PCR reactions for each calibration point. The
curve was generated by plotting the Ct values against the logarithm of the corresponding peanut
content. The weighting factors were calculated according to Miller and Miller (Miller and Miller,
2005) and the equation was confirmed by Statgraphics Plus.
For the lowest and highest calibration points (10 and 10000 mg kg-1), the confidence interval was
calculated. Each 96-well plate analysed included a control of the calibration curve by the inclusion
of two independent PCR reactions per DNA extract of the 10 and 10000 mg kg-1 calibration points.
When the averages of the Ct values of both calibration points were within the confidence intervals
previously defined by the calibration curve, the analysis results of the plate were considered
reliable. The calibration curves were updated every time the DNA of the calibration points ran out
or when new extraction buffer stocks were used.
When the calibration curve was used to interpolated the Ct values obtained by the analysis of peanut
containing cookies baked for different periods of time, the variability of the method in predicting a
concentration value from a certain measured Ct value (mean of four replicates) was calculated as
the “prediction limits” with 95 % confidence level, using Statgraphics Plus.
Calibration model with ELISA kits
The manual of the Biokits Peanut Assay kit suggests using a linear regression for quantitative
purposes but, since the R-squares obtained were always around 0.91, polynomial regression was
applied in order to obtain a better fit (R-square 0.99). The peanut content (mg kg-1) of the six
calibration points (0, 1, 2, 5, 10, 20 mg kg-1) was plotted against the mean (three replicates) of their
respective ODs.
The manual of the Peanut Residue ELISA kit does not specify the use of any regression for
quantification but only suggests comparing the ODs obtained from the unknown samples with the
standards provided. In order to predict the peanut content of unknown samples, also in this case,

Chapter 3
66
polynomial regression was applied. The curve was based on six calibration points (0, 0.125, 0.25,
0.5, 1 and 2.5 mg kg-1). The standards provided in the kit were 0, 1, 2.5 and 5 mg kg-1 but since the
5 mg kg-1 standard always returned saturated OD values, three lower concentrations were
introduced by means of dilution to increase the data points for a calibration curve. The lower
concentrations all returned OD values that were above the OD of the blank + 3 times the standard
deviation.
Regarding the analysis of unknown samples, two protein extracts were obtained from each sample
material tested, and both protein extracts were analysed in duplicate. The concentration of peanut
material in the sample was determined by interpolating the corresponding average of the four ODs
with the calibration curve obtained with the standards provided in the kit.
Repeatability test
Ten samples from each concentration level of the cookie material (16 minutes baking time) were
randomly selected. Three independent measurements per sample were performed with the
BioSystems peanut allergen test kit and with PCR C. The average of each set of three measurements
was considered representative of the sample analysed. The relative standard deviations (or
coefficients of variation) were calculated on the averages of the OD values for the ELISA method
and on the Ct values for the real-time PCR method according to this formula:
CV (%)= ((si) / xi)*100
Where:
si= standard deviation between the averages of the sets of three measurements
xi= average of all the measurements
Results and discussion
Peanut detection by real-time PCR and ELISA
Prior to its consumption, peanut usually undergoes heat treatments like blanching or roasting. The
IRMM-481 peanut test material, which was used in this study, includes five peanut varieties from
different geographical origins exposed to five different industrial heat treatments (Table1).
Therefore it represents a material that might be comparable to the peanuts the consumer is exposed
to. Each variety (component a, b, c, d, e) and the mixture of the five peanuts (component f) were
analysed separately using the two ELISA kits targeting Ara h 1 and Ara h 2 and the three real-time

The effect of heat treatment on the detection…
67
PCR assays as quantitative methods. Component f of IRMM-481 that contains a mixture of
different peanut varieties exposed to different heating processes was chosen as the best material for
the establishment of calibration curves for the PCR assays. Therefore, dilutions of the DNA
extracted from this material were employed to generate calibration curves for the three real-time
PCR assays as described in the Material and Methods section. For the data analysis and the
generation of calibration curves we followed the guidelines of Burns et al (Burns et al., 2004). Due
to the heteroscedastic distribution of the data points, linear weighted regression was applied to
describe the calibration models, moreover as suggested by Burns et al., individual Ct values
collected for each calibration point, instead of their respective averages, were used to calculate the
equation of the curves. The calibration curves obtained by the three PCR assays were characterized
by R2 values close to 1 (PCR A 0.998, PCR B 0.997, PCR C 0.997), and as determined from their
individual slopes the efficiency of the PCR reactions ranged from 95 to 97%. The curves were
generated by plotting Ct values against the logarithm of the amount of peanut DNA, aimed at the
interpolation of unknown samples.
The ELISA test kits that were used were supplied with their own standards that were utilised to
establish calibration curves for the interpolation of unknown samples.
To perform a comparative analysis with real-time PCR and ELISA, both sampling and the number
of measurements performed were equal for both methodologies. However, different calibrants were
utilized for either ELISA or PCR, and the final quantification of each peanut sample was differently
expressed (in mg peanut per kg for ELISA, or ng peanut DNA for PCR). In order to evaluate and
compare the data obtained from both detection methods, all results were normalized to the mixture
component f of IRMM-481.
Effect of heating on peanut detection
In order to study the effect of the industrial processing as applied to the different components of
IRMM-481 we compared the analysis of its components with their raw counterparts by means of
ELISA and real-time PCR. In addition, the analysis of the five different raw peanut varieties
Variety Origin Heat treatment
(a) Runner Argentina dry hot air roasting, 140ºC, 20min
(b) Comon Natal/Spanish South Africa dry hot air roasting, 140ºC, 13 min
(c) Virginia USA oil roasting, 145 ºC, 25 min
(d) Virginia China oil roasting, 140°C, 9 min
(e) Jumbo Runner USA Blanching, 100ºC, 50 min
Table 1: List of the five peanut materials as included in the IRMM-481 test material.
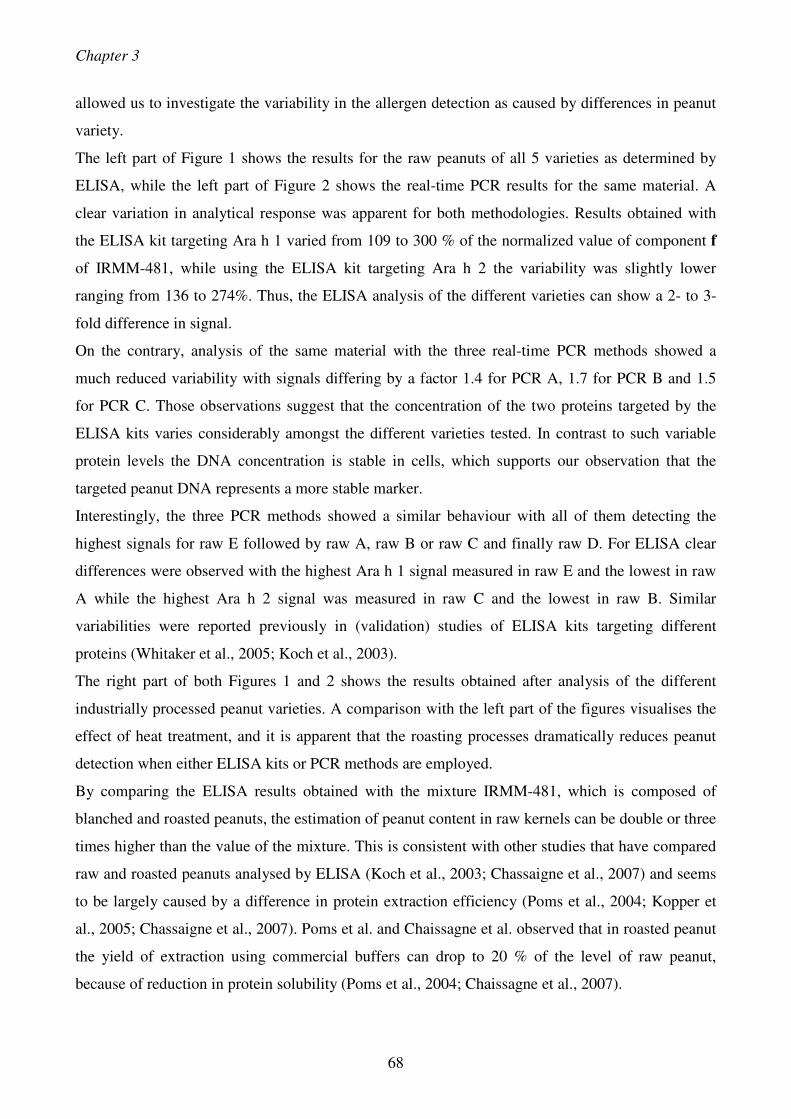
Chapter 3
68
allowed us to investigate the variability in the allergen detection as caused by differences in peanut
variety.
The left part of Figure 1 shows the results for the raw peanuts of all 5 varieties as determined by
ELISA, while the left part of Figure 2 shows the real-time PCR results for the same material. A
clear variation in analytical response was apparent for both methodologies. Results obtained with
the ELISA kit targeting Ara h 1 varied from 109 to 300 % of the normalized value of component f
of IRMM-481, while using the ELISA kit targeting Ara h 2 the variability was slightly lower
ranging from 136 to 274%. Thus, the ELISA analysis of the different varieties can show a 2- to 3-
fold difference in signal.
On the contrary, analysis of the same material with the three real-time PCR methods showed a
much reduced variability with signals differing by a factor 1.4 for PCR A, 1.7 for PCR B and 1.5
for PCR C. Those observations suggest that the concentration of the two proteins targeted by the
ELISA kits varies considerably amongst the different varieties tested. In contrast to such variable
protein levels the DNA concentration is stable in cells, which supports our observation that the
targeted peanut DNA represents a more stable marker.
Interestingly, the three PCR methods showed a similar behaviour with all of them detecting the
highest signals for raw E followed by raw A, raw B or raw C and finally raw D. For ELISA clear
differences were observed with the highest Ara h 1 signal measured in raw E and the lowest in raw
A while the highest Ara h 2 signal was measured in raw C and the lowest in raw B. Similar
variabilities were reported previously in (validation) studies of ELISA kits targeting different
proteins (Whitaker et al., 2005; Koch et al., 2003).
The right part of both Figures 1 and 2 shows the results obtained after analysis of the different
industrially processed peanut varieties. A comparison with the left part of the figures visualises the
effect of heat treatment, and it is apparent that the roasting processes dramatically reduces peanut
detection when either ELISA kits or PCR methods are employed.
By comparing the ELISA results obtained with the mixture IRMM-481, which is composed of
blanched and roasted peanuts, the estimation of peanut content in raw kernels can be double or three
times higher than the value of the mixture. This is consistent with other studies that have compared
raw and roasted peanuts analysed by ELISA (Koch et al., 2003; Chassaigne et al., 2007) and seems
to be largely caused by a difference in protein extraction efficiency (Poms et al., 2004; Kopper et
al., 2005; Chassaigne et al., 2007). Poms et al. and Chaissagne et al. observed that in roasted peanut
the yield of extraction using commercial buffers can drop to 20 % of the level of raw peanut,
because of reduction in protein solubility (Poms et al., 2004; Chaissagne et al., 2007).

The effect of heat treatment on the detection…
69
Looking at individual peanut varieties, Ara h 1 is more sensitive to heat treatment than Ara h 2. The
signal of three out of five processed varieties falls below 50 % of the value of the mixture for Ara h
1 (samples A, B and C); while in the case of Ara h 2 this happens only once (sample B). In addition
to this, component e, that only underwent blanching, did not show a decrease, but a modest increase
of Ara h 2 compared to its raw counterpart. A light heat treatment like blanching can probably
induce cell breakage which facilitates protein extraction.
Figure 2 shows that the roasting process also resulted in a decrease of detection when DNA was the
target. Even though DNA, as a macromolecule, exhibits a relatively high chemical stability, there is
a broad spectrum of chemical and enzymatic reactions that cause DNA modification and/or
degradation. Thermal treatments, are known to, contribute to such reactions (Bauer et al., 2003,
2004; Moreano et al., 2005; Engel et al., 2006). Generally the drop in peanut DNA detection caused
by processing is more evident than with protein detection by ELISA (Figure 1). The PCR signals
obtained after analysis of raw peanuts were 2 to 5 fold above those of the processed (standard) mix,
while for ELISA detection this difference ranged only from 1.1 to 3 fold.
When the results of the individual processed varieties were compared, a lower variability was
observed after PCR analysis compared to analysis with ELISA. This is apparent from the
observation that after real-time PCR analysis only one processed variety (B) showed a more than 50
% deviation from the standard, while after Ara h 2 detection 2 processed varieties (B and E) and
after Ara h 1 detection even 4 (A, B, C and E) out of the 5 varieties showed a more than 50 %
deviation from the standard.
Having assessed that the signal obtained after analysis of raw peanuts is clearly higher than that of
the respective roasted peanuts when real-time PCR is employed, we investigated the integrity of the
DNA molecules as extracted from raw and processed peanuts. Raw, blanched (100 °C, 30 minutes),
mild roasted (140 °C, 12 minutes) and strong roasted (140 °C, 20 minutes) peanuts from a single
variety were analysed. Quantification of the DNA extracts from raw (177 ± 4 ng/µl), blanched (194
± 3 ng/µl), mild roasted (76 ± 8 ng/µl) and strong roasted (48 ± 11 ng/µl) peanut indicated that the
DNA extraction yield considerably decreases with increasing heat treatment. Therefore lower
amounts of template (extracted peanut DNA) are added to the PCR reactions of roasted samples
since normally a fixed volume of DNA extract is used.
In addition to the yield we investigated the quality or integrity of the extracted DNA by studying its
amplificability. For this purpose the DNA content was standardized before amplification by PCR.
The amplification of 1 ng template DNA in each PCR reaction resulted in similar Ct values (28.4 ±
0.4) for all samples regardless of the heat treatment (Figure 3). Therefore we conclude that a major
limiting factor in DNA detection as well as in protein detection is the extractability of peanut DNA

Chapter 3
70
or protein. This study also showed that DNA obtained from strong roasted peanuts was perfectly
amplifiable by all three PCR assays with a comparable efficiency even at low concentrations, which
shows that the extracted DNA is of good quality.
ELISA and real-time PCR analysis of a model food matrix
Accidental ingestion of peanut by an allergic consumer most likely occurs when peanut is hidden in
a food matrix. Such peanut-containing foods can contain a variety of different ingredients and might
have undergone a heat treatment. Therefore we studied the detection of peanut in real food samples
and compared DNA and protein based detection methods. For this purpose, we employed a
0
50
100
150
200
250
300
350
400
450
500
raw A raw B raw C raw D* raw E A B C D E
pe
an
ut co
nte
nt %
ELISA Ara h 1
ELISA Ara h 2
0
50
100
150
200
250
300
350
400
450
500
raw A raw B raw C raw D* raw E A B C D E
pe
an
ut co
nte
nt %
PCR A
PCR B
PCR C
26
27
28
29
30
31
Ct va
lue
s
PCR A
PCR B
PCR C
raw blanched 140°C
12'
140°C
20'
Figure 1: Estimation of the peanut content in different raw and roasted peanut varieties (listed in Table 2) as determined with an ELISA kit targeting Ara h 1 or with an ELISA kit targeting Ara h 2. All values are normalized to the peanut content determined in the mixture (IRMM-481 component f). * This peanut material was blanched under mild conditions.
Figure 2: Estimation of the peanut content in different raw and roasted peanut varieties (listed in Table 2) as determined with the real-time PCR A, B or C methods. All values are normalized to the peanut content determined in the mixture (IRMM-481 component f). * This peanut material was blanched under mild conditions.
Figure 3: Comparison of the amplification of DNA of raw, blanched (100 °C, 30 minutes), mild (140 °C, 12 minutes) and strong (140 °C, 20 minutes) roasted peanut (Runner) with the three real-time PCR assays (A, B, C). In each PCR reaction an aliquot of 1 ng of DNA was used for amplification.

The effect of heat treatment on the detection…
71
processed food matrix (cookies), representative for bakery products, to which peanut was added
before food processing (baking), as described previously (Scaravelli et al., in press).
All different cookies were analysed in duplicate with all three PCR assays and the two ELISA kits.
The peanut content in the cookie material was quantified with the ELISA kits as described in the
Material and Methods section, whereby quantification was based on the protein standards provided
in the kits. However, such standards were not available for quantification by means of the real-time
PCR methods. For the proper comparison of ELISA and real-time PCR detection all results were
normalized to the mixture component f of IRMM-481. Previously we have shown that analysis of
this cookie material with the three PCR assays gave a linear response within a concentration range
of 10 mg kg-1 to 10000 mg kg-1 for cookies baked 16 minutes (Scaravelli et al., in press), therefore
this material was used to establish calibration curves.
Due to its method of preparation the ground cookie material was likely to be homogeneous. This
presumed homogeneity was tested by utilizing the ELISA kit targeting Ara h 1 as well as the three
PCR methods. For this purpose cookies containing peanut at the two lowest levels (10 and 100 mg
kg-1) were analysed. Statistical analysis of variance (ANOVA) was applied to the values obtained
with three PCR assays and the ELISA kit. This revealed that the F-value for both concentration
levels was below the critical value of 3.02 (p = 0.05) as determined with either method, which
implies that, with a 95 % probability, the cookie material can be considered homogeneous
regardless whether DNA or protein was detected. PCR and ELISA methods gave similar results,
which supports the applicability of the three real-time PCR assays for homogeneity testing.
Having assessed that the material was homogeneous, it was used for the establishment of a
calibration curve for the real-time PCR C. The curve obtained, plotting Ct values against the
logarithm of the concentration (y = -3.275 log(x) + 41.067; PCR efficiency: 102 %) was used to
interpolate samples with an unknown peanut content and to estimate the peanut content in cookie
material that underwent different periods of baking.
In contrast to PCR analysis, ELISA calibration curves are characterised by a very limited working
range. This implies several dilutions of sample extracts from material with a high peanut content
which likely affects the precision of the method. We therefore tested the repeatability of the
different methods. For this purpose PCR C and the ELISA kit targeting Ara h 1 were utilized.
The repeatability of analytical methods like real-time PCR is an important parameter to consider as
stated by the European Network of GMO laboratories (ENGL, 2005). It is defined as the standard
deviation of test results obtained under repeatability conditions. In this study, the coefficient of
variation (CV) was determined for both the real-time PCR and ELISA methods. Figure 4 shows a
comparison of the calculated CVs and shows that a decrease in peanut content leads to an increase

Chapter 3
72
in measurement variability for the real-time PCR method. This confirms our observation that the
real-time PCR calibration curves were characterised by a heteroscedastic distribution of data points,
whereby the largest standard deviation corresponded to the lowest peanut level. The calculated CVs
for the ELISA method show a similar trend although here the cookie material containing 10 mg kg-1
of peanut returned a CV value that was lower than expected.
Despite the fact that the CV values generally follow the same trend for both methods (an increase at
lower concentrations), for ELISA the CV values ranged from 3 to 5 % while real-time PCR showed
a higher repeatability with CV values ranging from 1 to 2 %. The latter CV values fall within the
range of CV values reported by Piknova et al. (Piknova et al., 2007) (1 % < CV < 3 %) who
analysed subsequent dilutions of DNA by real-time PCR to detect hazelnut allergens.
The effect of heat treatment in a model food matrix
Food products that contain peanut as an ingredient, or in which peanut is unintentionally present
(e.g. as a result of contamination during the production process) constitute a clear threat to the
health of allergic consumers. Such food products often contain peanuts that have undergone two
subsequent heat treatments, as exemplified by roasted peanuts used as ingredients for baked
cookies. This is most dangerous for sensitized consumer since it can trigger allergic reactions while
such a product might not be identified as peanut-containing (not listed on the label) and analytical
detection of peanut fails due to the manufacturing processes applied.
Up till now, only limited data are available about DNA or protein stability during processing in
complex food matrices. In the case of DNA, most of the available studies are focussed on the
detection of DNA sequences of genetically modified organisms in food and mainly focus on the
degradation of the genomic DNA up to a certain amplifiable length (Moreano et al., 2005; Chen et
0
1
2
3
4
5
6
7
8
10 100 1000 10000conc (ppm)
CV
(%
)
ELISA RTPCRFigure 4: Coefficient of variation (CV %) calculated from the Ct values obtained with real-time PCR C or from the ODs obtained with the ELISA kit targeting Ara h 1. Results are based on the analysis of 10 cookie extracts per concentration level (standard baking time of 16 minutes).

The effect of heat treatment on the detection…
73
al., 2005; Murray et al., 2007). Other studies highlight the effect of different parameters like pH,
time and temperature on the extent of DNA degradation. Bauer et al identified the heat treatment
and acidic condition as the main parameters responsible for DNA degradation (Bauer et al., 2003,
2004).
In this study we investigated the effect exerted by heat treatment of a complex food matrix on the
detection of peanut. Cookies with different peanut contents that were baked for either 11, 16, 21 or
26 minutes were analysed by using PCR C and the two ELISA kits.
Figure 5 shows a comparison of the relative peanut contents measured over the range of baking
times that were investigated. For the determination of the peanut content, the calibration curve
based on the same cookie material baked for 16 minutes was applied. As expected, the detection of
both the protein and DNA targets decreases with increased baking time. The standard material
(baked at 180°C for 16 minutes) showed a comparable quantification with all three methods, close
to the true value of 100 mg kg-1. Prolonging the baking time for ten minutes resulted in a decrease
of the estimated peanut content by a factor 10. Detection of the PCR target did not differ from
detection of the Ara h 1 protein target, although the PCR detection was characterised by smaller
prediction intervals. The ELISA kit targeting Ara h 2 generally followed the same trend, but
returned higher estimations of peanut content after prolonged baking. This is in accordance with
studies reporting a high heat stability of Ara h 2, and a better extraction efficiency of Ara h 2 from
heat roasted peanuts compared to Ara h 1 (Chassaigne et al., 2007; Maleki and Hurlburt, 2004).
The Ct values of the analysis of the cookies that underwent different times of heat exposure were
10ppm
PCR A PCR B PCR C
11' 4 / 4 4 / 4 4 / 4
16' 4 / 4 4 / 4 4 / 4
21' 3 / 4 * 2 / 4 Ф 4/ 4 Ф
26' 3/ 4* 2 / 4 1 / 4
* 1 Ct value above 40
Ф 2 Ct values above 40
Table 2: The effect of baking time on the detection of peanut by means of the three PCR assays (A, B, C). The cookie material analysed contained peanut at a level of 10 mg kg-1 and was baked for 11, 16, 21 or 26 minutes. The results are presented as an index based on the number of positive results obtained after analysis of four samples.
-20
0
20
40
60
80
100
120
140
160
180
11' 16' 21' 26'baking time (min)
pean
ut
co
nte
nt
(pp
m)
RT PCR
ELISA Ara h 1
ELISA Ara h 2
Figure 5: Estimation of the peanut content (ppm = mg kg-1) in cookies containing peanut at a level of 100 mg kg-1 and baked for 11, 16, 21 or 26 minutes. The measurements were performed with real-time PCR C and two ELISA kits (targeting Ara h 1 and Ara h 2). The error bars refer to the prediction intervals of each predicted value derived from the calibration curves

Chapter 3
74
investigated to study the sensitivity of the three PCR methods with regard to the heat treatment and
to establish a Limit of Detection (LOD). Traditionally the LOD is often derived from the mean of
blanks and the standard deviation of the blank, which can not be applied to quantitative PCR
techniques as recently stated (Burns and Valdivia, in press), since negative controls do not return a
zero measurand result or a specific value, instead they are just defined as “undetermined”. An
important parameter that needs to be fixed to define the LOD is the Ct cut off value. It is important
that the Ct cut off value is not set too low in order not to omit true positive results but also not too
high to include false positive results (Burns and Valdivia, in press). In this study two Ct cut off
values were set, all Ct values below 40 were considered reliable for quantification purposes, and Ct
values up till 45 were considered for positive qualitative results. The range between Ct values of 40
to 45 was used to define an experimental LOD relying on the ability of the real-time PCR method to
discriminate a fluorescent signal from a sample in terms of the number of PCR reactions that
returned results within this range of Ct values. Although the Ct values and therefore the estimated
peanut content decreased with higher baking time all cookie material containing peanut at a level of
100 mg kg-1 or higher tested positive (data not shown). However, prolonging the baking time
caused a drop in detection and resulted in several negative tests when the cookies containing peanut
at a level of 10 mg kg-1 were analysed. Table 2 illustrates the results for this cookie material as
analysed by the three PCR assays. Four separate reactions were carried out per method per baking
time. The results show that at this low peanut content the prolonged heat treatment can prevent the
detection of peanut traces in the cookies.
This represents a danger to erroneous interpretations. In the model matrix analysed here all analyses
of the blank matrix samples returned without exception "undetermined" Ct values. Therefore, any
positive test result cannot be assigned to the amplification of non-target DNA. Instead the
occurrence of positive as well as negative test results for the same sample points at the fact that low
levels of target analyte are giving rise to stochastic effects of sample heterogeneity resulting in
erroneous interpretation. The fact that material with prolonged baking times returned Ct values
above and below 40 (but less than 45), and is characterised by a lack of repeatability may indicate
that the DNA was degraded by heat treatment, or that the extraction of peanut (target) DNA is
reduced after prolonged baking. Both explanations implicate that only a few template sequences
were available for the amplification. Degradation of DNA after thermal processing is reported by
Hiramoto et al (Hiramoto et al., 1994) who have shown that DNA breakage takes place during food
processing which is caused by the Maillard reaction of glucose and amino acids in an aqueous
system. However, our results on the effects of heat treatments on the quality and quantity of the
DNA extracted from whole peanut (as reported above) suggest that the decreased detection in the
The effect of heat treatment on the detection…
75
material that had undergone prolonged baking most likely results from a decreased efficiency of
extraction of the target DNA.
A different approach to define the limit of detection was applied to ELISAs. The ELISA kit
targeting Ara h 1 sets its LOD at two times the value of the blank. Applying this LOD, all cookie
samples containing peanut at a level of 10 mg kg-1 returned positive results, even at the higher
baking times. The ELISA kit targeting Ara h 2 sets its LOD at a value equal to that of the chosen
positive control sample. Since the positive control sample with the lowest peanut content is that of 1
mg kg-1, this value was used as the LOD in our experiments. Applying this LOD, all cookie samples
containing peanut at a level of 10 mg kg-1 returned positive results when the baking time was 11
minutes. However, after 16 minutes of baking only one out of four samples returned a positive
result. On first instance this might be unexpected since Ara h 2 shows higher heat stability than Ara
h 1 but, within peanut Ara h 1 is more abundant compared to Ara h 2 (Koppelman et al., 2001)
which might explain our observations. Furthermore, our results are in line with those of an inter-
laboratory validation study that included the same two ELISA kits as used in our current study. In
the ELISA validation study a higher number of false positive results were obtained with the Ara h 2
ELISA, compared to the Ara h 1 ELISA kit after analysis of cookies containing peanut at a level of
2 mg kg-1 (Poms et al., 2005).
Conclusions
A major concern in the protection of allergic consumers is the availability of detection methods able
to recognize the presence of trace amounts of allergenic ingredients in food products. Since
information on clinical thresholds is very limited, there is a general agreement, that such detection
methods should have a detection limit between 1 and 100 mg kg-1(Poms and Aklam, 2004; Poms et
al., 2003). A review (Poms and Anklam, 2004) on this topic lists the currently available methods,
some of which are designed for a qualitative response only, while others are (semi-)quantitative
methods reported to be capable of achieving a good sensitivity with LOD values within the
mentioned range. Since rather diverse methodologies are employed for food allergen detection it is
of importance to compare their performance. Recently several studies have embarked upon this
issue and compared PCR and ELISA technologies designed to detect peanut traces in food products
(Stephan and Vieths, 2004; Watanabe et al., 2006; Piknova et al., in press). Those studies have
reported qualitative comparisons, and have largely focussed on the analysis of market samples. The
lack of reference materials for allergen detection has brought individual research groups to develop

Chapter 3
76
their own test material and their own experimental design, compromising a direct comparison of
such studies.
In this study we compared two different ELISA kits, one targeting the allergenic protein Ara h 1
and the other Ara h 2, with three real-time PCR methods. The peanut test material IRMM-481 was
utilised for calibration as well as for spiking. This study shows that, despite the completely different
nature of the target molecules, protein or DNA, the performance of the different detection methods
was very similar. A comparison of 5 different peanut varieties confirmed that the level of DNA is
more stable than that of the proteins Ara h 1 or Ara h 2. As expected, roasting was found to strongly
affect the detection of both target molecules, and our study shows that this decrease in detection
follows a similar trend for both technologies. Despite this, we observed some variability which was
higher between the two ELISA kits, compared to the variability between the PCR methods. The
observed variability amongst ELISA kits is consistent with other studies (Whitaker et al., 2005) and
is based on the fact that the ELISAs target different proteins and therefore resulted in different
estimations of peanut content, which is not the case for the three PCR methods.
In addition a model food matrix representative of bakery products has been utilized and both ELISA
as well as real-time PCR methods could be employed to confirm the homogeneity of this test
material. This material was used to estimate the peanut content in cookies baked for different
periods of time, to determine to which extent peanut DNA or protein detection is affected to the
heat treatment in a complex food matrix. The two ELISA kits as well as the real-time PCR methods
showed a similar trend, since prolongation of the baking time (26 minutes compared to the standard
16 minutes) resulted in a 5 to 10 times decreases in detection.
Overall, we can conclude from this study that the use of the three real-time PCR methods returns
analytical results that are comparable to those obtained with the commercial ELISA kits that were
tested. With regard to the effects of roasting of peanuts, or baking in a cookie matrix it was
interesting to note that one of the ELISA kits showed a behaviour that was more similar to the real-
time PCR method than to that of the other ELISA kit.
Both ELISA as well as PCR based methods have disadvantages. The first might return false
positive results due to cross-reactivities of the antibodies, while the latter detects DNA and
therefore does not investigate the presence of allergenic proteins. Therefore it is very important to
be able to confirm a positive result obtained with one method with a different method. This study
shows that ELISA kits and real-time PCR complement each other and that the one can indeed be
used to confirm results obtained by the other.

The effect of heat treatment on the detection…
77
References
Bauer T, Weller P, Hammes W P, Haase N U, Hertel C (2004) Effect of food components and processing parameters on dna degradation in food. Environ Biosafety Res, 3:215-223.
Bauer T, Weller P, Hammes W P, Hertel C (2003) The effect of processing parameters on DNA degradation in food. Eur Food Res Technol, 217:338–343.
Beyer K, Morrow E, Li X M, Bardina L, Bannon G A, Burks A W, et al. (2001) Effects of cooking methods on peanut allergenicity. J Allergy Clin Immunol, 107:1077-81.
Bock S A, Munoz-Furlong A and Sampson H A (2001) Fatalities due to anaphylactic reactions to foods. J Allergy Clin Immunol, 107:191.
Burns J M, Valdivia H Modelling the limit of detection in real-time quantitative PCR. Eur Food Res Technol, in press.
Burns J M, Valdivia H, Harris N (2004) Analysis and interpretation of data from real-time PCR trace detection methods using quantitation of GM soya as a model system. Anal Bioanal Chem, 378:1616–1623.
Chassaigne H, Brohée M, Nørgaard J V, van Hengel A J (2007) Investigation on sequential extraction of peanut allergens for subsequent analysis by ELISA and 2D gel electrophoresis. Food Chem, 105:1671-1681.
Chen Y, Wang Y, Ge Y, Xu B (2005) Degradation of endogenous and exogenous genes of Roundup-Ready Soybean during food processing. J Agric Food Chem, 53:10239-10243.
Chung S Y, Champagne E (2001) Association of end-product adducts with increased IgE binding of roasted peanuts. J Agric Food Chem, 49:3911–3916.
Engel K H, Moreano F, Ehlert A, Busch U (2006) Quantification of DNA from genetically modified organisms in composite and processed foods. Trends Food Sci Tech, 17:490-497.
European Network of GMO Laboartories (2005) Definition of minimum performance requirements for analytical methods of GMO testing, http://gmo-crl.jrc.it/guidancesdocs.htm.
European Parliament and Council (2000). Directive 2000/13/EC of 20 March 2000 on the approximation of the laws of the Member States relating to the labelling, presentation and advertising of foodstuffs. Official J Europ Commun, L109, 29-42.
European Parliament and Council (2007). Directive 2007/68/EC of 27 November 2007 amending Annex IIIa to Directive 2000/13/EC as regards certain food ingredients. Official J Europ Commun, L310, 11-14.
Helm R M, Burks A W (2000) Mechanisms of food allergy. Curr Opin Immunol, 12:647-653.
Hiramoto K, Kido K, Kikugawa K (1994) DNA breaking by Maillard products of glucose-amino acid mixtures formed in an aqueous system. J Agric Food Chem, 42:689-694.
Hird H, Lloyd J, Goodier R, Brown J, Reece P(2003) Detection of peanut using real-time polymerase chain reaction. Eur Food Res Technol, 217:265–268.
Koch P, Schäppi G F, Poms R E, Wüthrich B, Anklam E and Battaglia R (2003) Comparison of commercially available ELISA kits with human sera-based detection methods for peanut allergens in foods. Food Addit Contam, 20:797.
Koppelman S J, Vlooswijk R A A, Knippels L M J, Hessing M, Knol E F, Van Reijsen F C, Bruijnzeel-Koomen C A F M (2001) Quantification of major peanut allergens Ara h 1 and Ara h 2 in the peanut varieties Runner, Spanish, Virginia, and Valencia, bred in different parts of the world. Allergy, 56 (2):132-137.
Kopper R A, Odum N J, Sen M, Helm R M, Stanley J S, Burks A W (2005) Peanut protein allergens: The effect of roasting on solubility and allergenicity. Int Arch Allergy Immunol, 136:16–22.
Krska R, Welzig E, Baumgartner S (2004) Immunoanalytical detection of allergenic proteins in food. Anal Bioanal Chem, 378:63-65.
Maleki S J, Hurlburt B K (2004) Structural and Functional Alterations in Major Peanut Allergens Caused by Thermal Processing. J AOAC International, 87 (6):1475-1479.
Maleki S J, Chung S Y, Champagne E T, Raufman J P (2000) The effects of roasting on the allergenic properties of peanut proteins. J Allergy Clin Immunol, 106 (4), pp. 763-768.

Chapter 3
78
Miller J N, Miller J C (2005) Statistics and Chemometrics for Analytical Chemistry (Pearson Education Limited, England , Fifth Edition) pp:107-149.
Mondoulet L, Paty E, Drumare M F, Ah-Leung S, Scheinmann P, Willemot R M, Wal JM, Bernard H (2005) Influence of thermal processing on the allergenicity of peanut proteins. J Agric Food Chem, 53 (11):4547-4553.
Moreano F, Busch U, Engel K H (2005) Distortion of Genetically Modified Organism quantification in processed foods: influence of particle size compositions and heat-induced DNA degradation. J Agric Food Chem, 53:9971–9979.
Murray S R, Butler R C, Hardacre A K, Timmerman-Vaughan G M (2007) Use of quantitative real-time PCR to estimate maize endogenous DNA degradation after cooking and extrusion or food products. J Agric Food Chem, 55:2231-2239.
Ortolani C, Ipsano M, Scibilia J and Pastorello E A (2001) Introducing chemists to food allergy. Allergy, 56:5.
Piknova L, Pangallo D, Kuchta T (2007) A novel real-time polymerase chain reaction (PCR) method for the detection of hazelnuts in food. Eur Food Res Technol, in press.
Poms R E, Agazzi M E, Bau A, Brohée M, Capelletti C, Nørgaard J V and Anklam E (2005) Inter-laboratory validation study of five commercial ELISA test kits for the determination of peanut proteins in biscuits and dark chocolate. Food Addit Contam, 22:104-112.
Poms R E, Anklam E (2004b) Polymerase Chain Reaction techniques for Food allergen detection. J AOAC 87 (6):1391-1397.
Poms R E, Capelletti C, Anklam E (2004a) Effect of roasting history and buffer composition on peanut protein extraction efficiency. Mol Nutr Food Res, 48:459–464.
Poms R E, Ulberth F, Klein C L, Anklam E (2003d) Peanut allergens in food products. GIT Lab J Eur, 3:132–135.
Product information IRMM – 481 Peanut Test Material Kit.
Pumphrey R (2001) Fatal allergic reactions to food. Food Allergy Intolerance, 2:91.
Rossi S, Scaravelli E, Germini A, Corradini R, Marchelli R (2006) A PNA-array platform for the detection of hidden allergens in foodstuffs. Eur Food Res Technol, 223:1-6.
Sampson H A (2003) Anaphylaxis and emergency treatment. Pediatrics, 111:1601.
Scaravelli E, Brohée M, Marchelli R, van Hengel A J, Development of three real-time PCR assays to detect peanut allergen residue in processed food products. Eur Food Res Technol, in press.
Sforza S, Scaravelli E, Corradini R, Marchelli R (2005) Unconventional method based on circular dichroism to detect peanut DNA in food by means of a PNA probe and a cyanine dye. Chirality, 17:515-521.
Sicherer S H, Muñoz-Furlong A and Sampson H A (2004) Prevalence of seafood allergy in the United States determined by a random telephone survey. J Allergy Clin Immunol, 114:159–165.
Sicherer S H, Muñoz-Furlong A, Murphy R, Wood R A and Sampson H A (2003) Symposium: Pediatric Food Allergy. Pediatrics, 111:1591.
Stephan O, Vieths S (2004) Development of a real-time PCR and a sandwich ELISA for detection of potentially allergenic trace amounts of peanut (Arachis hypogaea) in processed foods. J Agric Food Chem, 52:3754-3760.
Watanabe T, Akiyama H, Maleki S, Yamakawa H, Iijima K, Yamazaki F, Matsumoto T, Futo S, Arakawa F, Watai M, Maitani T (2006) A specific qualitative detection method for peanut (Arachis Hypogaea) in foods using polymerase chain reaction. J Food Biochemistry, 30:215-233.
Whitaker T B, Williams K M, Trucksess M W, Slate A B (2005) Immunochemical analytical methods for the determination of peanut proteins in foods. J AOAC, 88 (1):161-174.

Chapter 4
Peanut allergen detection in chocolate and in products from the market
by means of ELISA and real-time PCR
Peanut allergy is an increasingly important public health problem that has a strong impact on the
quality of life of allergic consumers and their families. Since consumption of peanut can provoke
allergic symptoms even at minimal doses, while higher doses can be life threatening, sensitized
individuals need to avoid peanut containing food products. Such an avoidance strategy which is the
only practical means to prevent allergic reaction from occurring is complicated by the fact that
peanut is widely used in the confectionary industry and can accidentally end up in pre-packed food
products. Different methods have been developed for peanut detection in foodstuffs either based on
the detection of specific DNA sequences or proteins as target molecules. The broad range of food
matrices in which peanut is utilized, stresses the need for methods capable of analysing a wide
variety of matrices. For this reason, a previously developed real-time PCR method was optimized
and extended to include next to cookies also chocolate matrices, thereby covering an important
branch of the confectionary industry. A comparative study between the real-time PCR method and
ELISA was performed on hundreds of market samples. Our results show that, although different
target molecules are detected, real-time PCR and ELISA show a good agreement for the qualitative
detection of peanut in real food samples. Quantitative analysis showed that factors like matrix
composition, and especially cocoa content, influence the analytical results and might differently
affect the performances of the two methods.
Elena Scaravelli, Marcel Brohée, Rosangela Marchelli and Arjon J. van Hengel

Chapter 4
80
Introduction
Peanuts contain high levels of protein and oil and are widely used as ingredients in food and
confectionery products or in the production of oils and butter. Despite their popularity, the
widespread use of peanuts by the food industry represents a threat to the health of peanut allergic
individuals and is a limiting factor in their quality of life and that of their families (Sicherer et al.,
2001; Avery et al., 2003). Peanut is known to contain a variety of proteins which includes eight
allergenic proteins (Ara h 1 to Ara h 8) (Burks et al., 1998; Koppelman et al., 2001; Bannon et al.,
2000; Koppelman et al., 2003; Scurlock and Burks, 2004; Mittag et al., 2004). The consumption of
peanut by sensitised individuals is potentially life threatening (Sampson, 2003) and even at minimal
doses it can trigger allergic reactions (Flinterman et al., 2006). Moreover, in the USA and in Europe
recent studies on the prevalence of food allergy amongst children confirmed that peanut allergy is
increasing in recent years with the latest estimates of the prevalence rates for children in the region
of 1 % (Sicherer et al., 2003; Grundy et al., 2002; Hourihane et al., 2007). Furthermore, peanut is
responsible for most of the reported deaths attributed to food allergies over the last 5-7 years (Bock
et al., 2007; Pumphrey and Gowland, 2007). Since there is no cure or treatment for this disease,
avoidance of the offending foods is at present the only practical means at hand to prevent allergic
reactions to occur. The need to carefully adhere to such an avoidance strategy explains why food
allergy inevitably results in social restrictions and has an impact on the quality of life.
Unfortunately it is well known that food allergic consumers occasionally experience allergic
reactions from accidental ingestion of the offending food. Modes of accidental ingestion of peanut
include eating at home, at school (for children), in a restaurant or by consuming food products
containing hidden or undeclared peanut residues (Sicherer et al., 1998; Yu et al., 2006). In case of
packaged foods, comprehensive labelling of allergenic ingredients is a useful tool for sensitive
individuals and allows for the selection of appropriate foodstuffs based on the information on the
label.
New legislation specifically addressed to the protection of allergic consumers has recently been
introduced both in the USA and the European Union (EU). A new labelling law, the Food Allergen
Labelling & Consumer Protection Act (FALCPA), came into effect in the USA at the start of 2006
(FALCPA, 2004) and requires the identification on the food label of ingredients derived from eight
commonly allergenic sources. Whereas within the EU Directive 2000/13/EC, as amended by
Directives 2003/89/EC and 2007/68/EC (European Parliament and Council, 2000, 2003, 2007),
requires a mandatory declaration of 14 allergenic foods. Peanut being a major allergenic food is in
both cases included within the legislation.

Peanut allergen detection in chocolate…
81
In addition to the declaration of ingredients, manufacturers and retailers sometimes voluntarily add
information on the possible unintentional presence of allergenic ingredients found in pre-packed
food (eg. “may contain peanut” or “this product is made in a factory that also produces peanut-
containing products”). The use of such warnings is based on the fact that during the production
process allergenic ingredients can easily and accidentally end up in finished foodstuffs. Such hidden
allergens can occur in packaged foods for a variety of reasons, including ingredients-statements
omission or errors, cross contamination by the use of shared equipment or facilities, errors by
ingredient suppliers or manufacturing firm employees, undeclared use of rework or leftovers, the
presence of ingredients derived from the allergenic source (Vierk et al., 2002; Hefle et al., 2007).
According to recent analytical surveys, the majority of packaged food products with precautionary
labelling statements contain no detectable peanut residues. Nevertheless, a substantial part of them
do contain peanut (Pele et al., 2007) and levels of up to 4000 ppm have been found in food products
bearing a precautionary warning (Hefle et al., 2007). The frequent use of precautionary warnings
and the fact that (allergic) individuals are often not heeding the advice of precautionary warnings
are dangerous developments that pose clear health risks (Hefle et al., 2007; van Hengel, 2007).
In order to change the attitude of sensitive individuals towards food labels, offering them consistent
information about the content of foodstuffs is of prime importance. To support this, the
development of reliable analytical methods capable of detecting the presence of trace amounts of
food allergens are required as they are useful tools for the food industry and official food control
agencies.
Nuts and peanuts are important ingredients in the chocolate and confectionary industry because of
their technological characteristics; particularly thanks to their flavour, especially if they are roasted,
they combine well with chocolate (Minifie, 1989). In a recent study 569 cookies and chocolate
samples collected on the European market were analysed in order to detect hazelnut and peanut
traces by utilizing ELISA test kits and to compare the analytical results with the information
provided on the label (Pele et al., 2007). The robustness of several ELISA test kits designed to
detect peanut traces in food products has been investigated in recent validation studies (Whitaker et
al., 2005; Park et al., 2005; Poms et al., 2005). But, method development as well validation studies
are performed with a limited number of model matrices that are often spiked in a manner that does
not mimic incurred samples where the allergen has been incorporated into the sample during
processing. When ELISA test kits are used for the analysis of a large number of market samples the
complexity and variability of food matrices is enormous. This increases the chance that matrix
components affect the detection of allergen traces. Theoretically, false positive results can be
obtained when methods designed to target markers of allergenic ingredients also respond positively

Chapter 4
82
to other components of food matrices (van Hengel, 2007). It is therefore prudent to utilize more
than one method to confirm positive analytical results. The detection of peanut protein traces by
ELISA might be confirmed with the use of a method based on the detection of peanut DNA.
Recently several PCR-based methods have been developed (Stephan and Vieths, 2004; Hird et al.,
2003; Watanabe et al., 2006), while the performance of three real-time PCR methods was shown to
be comparable to ELISA (Chapter 3). Moreover, the effect of a heat treatment like baking was
shown to have a comparable impact on detection by ELISA and the three real-time PCR methods
(Chapter 3). In order to confirm analytical results obtained by ELISA after investigating food
samples in a market survey (Pele et al., 2007) the real-time PCR method had to be extended for the
detection of peanut traces in chocolate.
In this study we present an optimised DNA extraction method and an extension of the real-time
PCR methods which was established with the use of a model chocolate matrix. This matrix is
clearly of interest because it has been reported that consumption of chocolate confectionary
increased between 1991 and 1996 in the majority of the countries analysed (in Europe and the USA)
(Wells, 1999). Because of this increased consumption, chocolate confectionary might represent one
of the most hazardous food categories for peanut allergic consumers, since chocolate and chocolate
based products often include nuts or peanuts. The availability of the real-time PCR methods capable
of detecting peanut traces in both cookie and chocolate samples allowed us to confirm the analysis
of the market samples that had previously tested positive by means of ELISA.
Materials and Methods
Food samples
Chocolate preparation
Seven types of nut-free chocolate were kindly provided by Barry-Callebaut (Belgium). Information
on their composition is listed in Table 1. All chocolates were ground with an Ultra-turrax (IKA,
dispersing tool 25N), in liquid nitrogen.
A finely ground peanut powder consisting of a mixture of the 5 peanut components included in the
IRMM-481 peanut test material (IRMM-481 component f; IRMM, Geel, Belgium) were used for
spiking. Aliquots of 0.05 g peanut powder were added to 4.95 g of each different chocolate powder
and then analyzed in order to test the effect of the cocoa content on peanut DNA detection.

Peanut allergen detection in chocolate…
83
A model milk chocolate matrix based on chocolate G (Table 1; 28 % cocoa content) was prepared
containing peanut at 4 different levels (10, 100, 1000, 10000 mg kg-1). For this purpose 970 g fine
powder of milk chocolate G was mixed with 20.0 g cocoa butter (Barry-Callebaut, Belgium)
containing 10 g peanut powder (test material IRMM-481; component f). First, the fine chocolate
powder was pre-warmed in a warm water bath at 80 °C until the chocolate melted, while mixing
with a spoon. The cocoa butter was also pre-warmed in a water bath at the same temperature and
peanut powder was added. By gently mixing with a spatula, the cocoa butter / peanut mixture was
mixed with the molten chocolate. After 15 minutes mixing in the water bath at 80°C, the chocolate
mixture was transferred to a form and cooled to room temperature (no tempering was applied). The
solid chocolate with a 10000 mg kg-1 peanut content that was obtained in this way was finely
ground with an Ultra-turrax (IKA, dispersing tool 25N), in liquid nitrogen and dried at room
temperature. Subsequent dilutions were prepared with the nuts-free chocolate powder (“blank”) to
obtain chocolates with lower peanut levels. An aliquot of 450 g blank chocolate was added to 50 g
chocolate with a 10000 mg kg-1 peanut content and mixed with the Ultra-turrax (IKA, dispersing
tool 25N) under liquid nitrogen for 5 minutes. The 1000 mg kg-1 chocolate obtained was then used
to prepare the 10 fold lower concentration level by addition of blank chocolate powder. The same
was done up to a final concentration of 10 mg kg-1 of peanut in milk chocolate. All spiked
chocolates were packed under vacuum in aluminium foil bags, and stored at -20 °C until use.
Cookie and chocolate samples
A total of 103 different types of cookies and 105 different types of chocolates purchased for a
previously reported market survey (Pele et al., 2007) were selected for analysis. Those food
products had been obtained from shops and supermarkets in 10 European countries (Austria,
Belgium, Bulgaria, Czech Republic, Germany, Hungary, Poland, Romania, Slovakia and The
Netherlands) and analysed with ELISA kit and dipstick. The food samples selected for real-time
PCR analysis included all samples that had tested positive for peanut by ELISA analysis, and or by
dipstick analysis. In addition to this all samples in which peanut was declared in the list of
ingredients. Furthermore, 15 cookie and 12 chocolate samples that had tested negative with both
ELISA and dipstick were selected.
DNA analysis
DNA extraction for cookie samples
DNA from cookies was extracted as described previously in Chapter 3.

Chapter 4
84
DNA extraction for chocolate samples
The DNA extraction method for cookie samples was optimized to be applicable to chocolate
samples. Two extraction additives, non-fat skimmed milk powder (cat. No. 54650, Biomol,
Hamburg, Germany) and fish gelatine (cat. No. G7765, Sigma-Aldrich, St Louis, MO, USA), were
used in combination with the guanidine hydrochloride based extraction buffer and the Wizard®
DNA Clean up system (Promega, Madison, USA) for DNA purification (Scaravelli et al., in press).
Different aliquots (0.5, 1.0, 1.5, 2.5 g) of milk powder were added to 25 ml falcon tubes containing
5 g (± 0.1 g) chocolate powder containing 10000 mg kg-1 peanut. Aliquots of 10 ml extraction
buffer (10 mM TRIS, 150 mM NaCl, 2 mM EDTA, 1% SDS, pH 8) and 2.5 ml guanidine-HCl 5M
were then added to the tubes. Alternatively gelatine was used as additive, which was added directly
to the extraction buffer. Samples of 5 g (± 0.1 g) chocolate powder containing 10000 mg kg-1 peanut
were weighted into a 25 ml falcon tube and 10 ml pre-warmed (50°C) gelatine-containing
extraction buffer (10 mM TRIS, 150 mM NaCl, 2 mM EDTA, 1% SDS, 1x Gelatine pH 8) and 2.5
ml guanidine-HCl 5M were added to the slurry.
From this step on, the protocol that was followed was largely based on the one described previously
(Chapter 3 ). After incubation of the samples at 50 °C overnight, lipids were removed by extraction
with 10 ml chloroform; the mixture was thoroughly mixed and followed by centrifugation at 9000
rpm for 15 minutes. The supernatant was collected in 2 ml eppendorf tubes and 16 µl Proteinase K
(10 mg/ml) was added to each tube. The samples were incubated at 55 °C for 30 minutes, after
which they were centrifuged at 14000 rpm for 15 minutes. The supernatant was transferred into a
new 2 ml eppendorf tube, and 5 µL RNAse (100 mg/ml) was added. RNA digestion was carried out
at 40 °C for 20 minutes. The solution was then transferred into a 14 ml falcon tube and of 2 ml
DNA-binding resin (Wizard® Plus Minipreps DNA purification system) was added which was
mixed thoroughly by inverting several times. The resin was loaded onto a minicolumn according to
the manufacturer’s instructions and subsequently washed with 3 ml 80 % isopropanol. Each sample
was eluted from the column with 130 µl pre-warmed (70 °C) TE buffer (10 mM Tris-HCl, 1 mM
disodium EDTA, pH 8.0).
The DNA extraction method for chocolate matrices that resulted in the better DNA yield and a
better amplification was then employed to extract the DNA from all the samples from the market.
This method used gelatine as extraction additive and all DNA extracts were diluted 10 or 20 fold.
Real-time PCR
PCR C designed on the target sequences of Ara h 3 genes as described previously (Scaravelli et al.,
in press) has been applied for the analysis of the milk chocolate model matrix. For this, two samples

Peanut allergen detection in chocolate…
85
were extracted per concentration level and two PCR reactions were performed per DNA extract. In
addition, one sample of each DNA extract was spiked with pure peanut DNA extract in order to
check for PCR inhibition.
For the analysis of the market samples, one DNA extraction was performed for each sample and
four aliquots of 5 µl DNA extract were amplified in four separate reactions. One of the PCR
reactions of each sample was spiked with pure peanut DNA extract in order to check for PCR
inhibition. In case PCR inhibition was observed the DNA extract from the cookie sample was
diluted 1:20 in water and the PCR analysis was repeated. For all chocolate samples, each DNA
extract was diluted 1:10 and 1:20 in water and analysed in four PCR reactions; one of which was
spiked with pure peanut DNA extract.
For all analyses the ABI Prism 7900HT Sequence Detection System (Applied Biosystems, UK) was
used with an automatic baseline setting and a threshold value of 0.15.
Each 96-well plate included three non template controls (NTCs) and two positive control samples.
For each sample the final Ct values used for calculation of quantitative results refer to the mean
value of the three replicates of amplification.
Protein analysis
ELISA methods
The commercially available Biokits peanut assay kit (Tepnel Biosystems, Deeside, UK), a
sandwich-type ELISA, targeting the allergenic protein Ara h 1, was used according to the
manufacturer's instructions
Methods of analysis
Homogeneity test
The homogeneity of the chocolate material was tested by employing the BioSystems peanut
allergen test kit and the PCR C real-time PCR method (Chapter 3). The two lowest concentrations
(10 and 100 mg kg-1) of the spiked milk chocolate were analysed with real-time PCR C and all
concentration levels were analysed with the ELISA kit. Two samples from ten different bags of
each concentration level were randomly taken and analysed in triplicate. The averages of the optical
density (OD) or Ct values were subjected to a statistical analysis of variance (ANOVA), in order to
assess the homogeneity of the chocolate material.

Chapter 4
86
Calibration model
In order to analyse all data obtained with real-time PCR for quantitative purposes a statistical
approach was needed as described previously (Chapter 3). Calibration models for cookie and
chocolate model matrices were generated by using Statgraphics Plus (version 5.1; StatPoint.Inc,
Virginia, USA). This was used to determine the curves characteristics like slope, intercept, R2
adjusted for the degree of freedom) and the respective PCR efficiency in the different matrices.
Calibration model for cookies matrix
A weighted linear regression was applied to the Ct values obtained by amplifying DNA from
cookies containing peanut (10, 100, 1000, 10000 mg kg-1) using PCR C as previously described
(Chapter 3).
Calibration model for chocolate matrix
Four concentration levels of peanut spiked milk chocolate (10, 100, 1000 and 10000 mg kg-1) were
used to generate a calibration model as described previously (Chapter 3). The PCR reaction was
repeated over a period of six days while using different stock solutions of PCR reagents. The final
set of analysis was composed of 24 PCR reactions per calibration point. Because of the different
level of PCR inhibition in milk chocolate compared to dark chocolate, DNA extracts were diluted
1:10 and 1:20 in water and two calibration models were generated. The calibration model based on
a 1:10 dilution was mainly used to interpolate milk chocolate samples, and the calibration model
based on a 1:20 dilution was employed to interpolate dark chocolate samples.
Repeatability test
The repeatability test was carried out as described previously for cookies (Chapter 3). Ten samples
from each concentration level of the model chocolate matrix were analyzed with the BioSystems
peanut allergen test kit (Tepnel) and with PCR C. For real-time PCR analysis DNA extracts were
diluted 1:10 in water. The signals collected (Optical Densities or Ct values) were used to calculate
the relative standard deviation.

Peanut allergen detection in chocolate…
87
Results and discussion
DNA extraction method optimization and cocoa content effect
Chocolate and chocolate based products represent a category of very difficult matrices for DNA
analysis because of their high polyhenol and polysaccharids content that can reduce yield and purity
of the extracted DNA (Gryson et al., 2004; Gryson et al., 2007). Polyphenols in their oxidized form
can prevent extraction of protein or DNA by a covalent binding of these molecules whereas
polysaccharides can form a viscous material which inhibits the activity of the Taq Polymerase
(Porebski et al., 1997; Aljanabi et al., 1999; Khanuja et al., 1999; Katterman and Shattuck, 1993). In
addition to this, several studies warn about the possible presence of other inhibitors of the PCR
reaction like carbonates, which can remain as residues of the industrial process of alkalization of the
cocoa nibs, which is usually employed to obtain a darker colour and milder taste of the chocolate
(Herman et al., 2003).
Because of all those reasons, it is of primary importance, to utilize a suitable DNA extraction
method. Therefore a peanut containing chocolate matrix was made to assess the applicability of the
previously reported real-time PCR method (Scaravelli et al., in press) for the detection of peanut
residues in chocolate. A milk chocolate matrix with a cocoa content of 28 % (Chocolate G, Table 1)
was chosen because milk chocolate is the most popular amongst all types of chocolates (Wells,
1999) and can be eaten in a bar form or utilized to coat other food preparation such as biscuits, ice
cream or sugar confectionery products.
Extraction additives, like skim milk powder or fish gelatine, are sometimes reported to improve
protein extraction from complex food matrices (e. g., dark chocolate). The ELISA kit used in this
study also includes this option in its protocol. Therefore the effect of such additives on the
extraction of DNA from the chocolate matrix was investigated. Different aliquots of milk powder
(0.5, 1.0, 1.5, 2.5 g) were added to the chocolate samples, before DNA extraction with the
guanidine based extraction buffer. The other additive tested was gelatine that was suggested as
extraction additive in the protocol of the peanut ELISA test kit. Gelatine was directly added to the
guanidine based DNA extraction buffer. Chocolate samples containing peanut at a level of 10000
mg kg-1 were extracted in duplo and 5 µl of the undiluted DNA extracts was amplified or the DNA
extracts were diluted 1:10 or 1:20 prior to PCR analysis. As reported by Gryson et al. (Gryson et al.,
2007), quantification and or analysis by gel electrophoresis of DNA extracted from chocolate is not
always consistent with the PCR results because of the possible presence of inhibitors or because of
DNA fragmentation. Therefore no DNA quantification was applied in this study and a fixed aliquot

Chapter 4
88
of pure or diluted DNA was added to the PCR reaction. Dilution of the DNA extract was applied in
order to reduce the concentration of the PCR inhibitors allowing the PCR reaction to proceed
(Germini et al., 2005) although this can reduce the method sensitivity. Alternatively, the influence
of inhibitors of the PCR reaction like carbonates can be reduced by using a modified DNA
extraction and a PCR buffer with an elevated Mg2+ content as proposed by Herman et al. (2003).
But, since this might affect the specificity of the method due to non specific primer annealing
(www.qiagen.com) this was not investigated here.
Figure 1 reports the effects of the use of additives during DNA extraction. When the results of the
PCR analyses on undiluted DNA extracts are compared it is apparent that addition of gelatine
prevents the detection of peanut, while the use of the two lower concentrations of milk powder do
not decrease Ct values compared to the sample without extraction additives. Addition of larger
amounts of milk powder had a clear detrimental effect as apparent from the increase in Ct values
and the large standard deviations. In all cases the Ct values obtained for the spiked chocolate were
higher than the Ct values around 27-28 that were reported for cookies with the same peanut content
(Scaravelli et al., in press; Chapter 3). This is most likely caused by the presence of inhibitors that
influence the enzymatic activity of the Taq polymerase. Dilution of the DNA extracts leads to a
decrease of the standard deviation when samples without additives are analysed. But, it also shows
a positive effect of both extraction additives. Moreover, using gelatine as additive resulted in Ct
values comparable to those obtained after analysis of cookies with the same peanut content. This
implies that the DNA extraction yield was not affected by the presence of chocolate matrix
components. The use of gelatine during DNA extraction and dilution of the DNA extract was
therefore applied to the analysis of all chocolate samples.
1 1
2 2
33 3
4
4 45 5 5
66 6
1
24
26
28
30
32
34
36
38
40
42
Ct
va
lue
dilution 1:20no dilution dilution 1:10
Figure 1: The effect of extraction additives on the amplification of peanut DNA. The data points are based on the mean of 4 cycle threshold values (two per each DNA extract) and the respective standard deviations are given. Chocolate containing peanut at a level of 10000 mg kg-1 was used for DNA extraction, while modifications of the extraction method were applied. (1: method without extraction additives; 2: addition of gelatine to the extraction buffer; 3, 4, 5, 6 : addition of respectively 0.5, 1, 1.5 or 2.5 g skim milk powder to each sample). Results were obtained by analysing pure DNA extracts or DNA extracts that were diluted 10 or 20 times.

Peanut allergen detection in chocolate…
89
As listed in the Codex Alimentarius (Codex Alimentarius, 2003), different types of chocolate can be
distinguished by their “total cocoa solids content”. For example, dark chocolate (≥ 35 %), sweet
chocolate (≥ 30 %), milk chocolate (≥ 25 %) or family milk chocolate (≥ 20 %) can be
distinguished. In order to evaluate the effect of the cocoa content on peanut DNA extraction and
amplification, six milk chocolates with total cocoa solids contents ranging from 28 to 45.5 % and
one dark chocolate with 55.3 % (Table 1) were spiked with peanut at a level of 10000 mg kg-1 and
subsequently analysed by real-time PCR. Two replicates of DNA extraction were carried out and
analysed after a 20 fold dilution of the DNA extract. This dilution was absolutely required to permit
the amplification reaction in dark chocolate. The data presented in Figure 2 show the differences in
Ct values obtained with the different chocolate materials. Although the peanut DNA amplification
occurred in all samples analysed, the Ct values ranged from 33 for the chocolate with 55.3 % “total
cocoa solids” to 28 for the chocolate with 28 % of “total cocoa solids”. From the figure it is clear
that in general a high content of “total cocoa solids” has a negative effect on peanut detection.
We conclude that the use of gelatine as extraction additive combined with a 20 fold dilution of the
DNA extracts allowed amplification of peanut DNA from all chocolate matrices tested. However, a
cocoa content of more than 35 % was shown to have a negative effect on amplification.
Chocolate cocoa solid (%) cocoa butter (%) milkfat (%) total fat (%)
A 55.30 36.1
B 45.50 36.00 7.5 43.5
C 35.00 28.50 4.3 32.8
D 32.70 26.10 5.9 31.5
E 32.40 24.50 4 28.5
F 29.60 24.00 6.3 30.3
G 28.00 25.00 6 31
Table 1: Specifications of the different types of chocolate used in this study.
B
CD E
F G
A
24
26
28
30
32
34
Chocolate type
Ct valu
e
Figure 2: Amplification of DNA extracted from 7 different types of chocolate. The mean of 4 cycle threshold values (two per each DNA extract) and their respective standard deviation are given. Ct values were obtained after analysis of peanut spiked milk and dark chocolates with different amounts of total cocoa solids (Table 1).
Chapter 4
90
Characterization of a model chocolate matrix
The applicability of the real-time PCR method for the detection and quantification of peanut traces
was further assessed by using the model milk chocolate matrix and a comparison with ELISA.
All different chocolates were analysed in duplicate with PCR C and the ELISA kit. In both cases
gelatine was used as additive for protein or DNA extraction.
The peanut content in the chocolate material was estimated with the ELISA kit as described in the
manual, by applying a calibration curve based on the protein standards provided in the kit. Peanut
was detected in all different concentration levels, ranging from 10 mg kg-1 to 10000 mg kg-1. For
analysis with the real-time PCR method DNA extracts were diluted ten fold. Additionally DNA
extracts that were diluted twenty fold were analysed. The PCR C assay gave a linear response
within a concentration range of 10 mg kg-1 to 10000 mg kg-1 after applying either of the DNA
dilutions. Therefore, this material was used to establish calibration curves.
However, prior to the establishment of calibration curves the homogeneity of the material was
tested. Previously we have shown that both this real-time PCR method and the ELISA kit used in
this study represent appropriate techniques for homogeneity testing (Chapter 3), therefore both
were used to analyse the model chocolate matrix material. The chocolates containing peanut at a
level of 10 or 100 mg kg-1 were analysed by both methods. Statistical analysis of variance
(ANOVA) confirmed that with a 95 % probability, the milk chocolate materials could be considered
homogeneous either after applying the DNA or the protein based detection method.
Having assessed that the material was homogeneous, it was used to generate two calibration curves
with the real-time PCR C method, with the aim to interpolate samples with an unknown peanut
content. For the interpretation of results obtained for milk chocolate samples, a calibration curved
based on a 1:10 dilution of DNA extracts was established, while a curve based on a 1:20 dilution
was established for the analysis of (dark) chocolate samples where a 1:10 dilution does not suffice.
The characteristics of the calibration curves are listed in Table 2 and compared to the previously
reported values for a calibration curve for cookies established with the same PCR method. Both
curves related to chocolate show a PCR efficiency close to 100 %. Thus the efficiency does not
seem to be affected by the chocolate matrix, despite the fact that chocolate is considered a
problematic matrix due to its high content in phenolic compounds that could interfere either with
DNA or protein extraction as well as their detection by PCR or ELISA (Gryson et al., 2004; Gryson
et al., 2007; Porebski et al., 1997; Aljanabi et al., 1999; Khanuja et al., 1999, Katterman and
Shattuck, 1993).

Peanut allergen detection in chocolate…
91
It is known from previous studies employing different ELISA kits (Poms et al., 2005; Whitaker et
al., 2005) and PCR assays (Lipp et al., 2005; Gryson et al., 2004), that for both types of method
repeatability was matrix-dependent. Therefore, an investigation into the effect that the chocolate
matrix has on the repeatability of these two analytical methods was carried out. For a proper
comparison of the data obtained with the two different methodologies, the relative standard
deviations calculated on the signals collected by both real-time PCR and ELISA are shown in Table
3, and compared to the previously reported values for cookies as established with the same
methods. For both food matrices analysed a decrease in peanut content caused an increase in
measurement variability for both the real-time PCR and ELISA. Those results are consistent with
the outcome of a validation study in which the same ELISA kit was tested (although there the CV %
was determined on the interpolated values and not on the raw signals) (Poms et al., 2005).
Compared to cookies, the analysis of chocolate samples is characterised by a higher source of
variability for both methods, especially when the peanut content is low. Despite the fact that the CV
values resulted in a similar trend for both matrices, the extent with which the matrices affected the
repeatability of the two methods was higher for ELISA, with CV values averaging 5.3 % for
cookies and 17 % for chocolate, compared to real-time PCR where those values were 1.2 % and 1.5
% respectively.
cookies choco 10 choco 20
Slope -3.27 -3.61 -3.39
Intercept 41.07 42.08 42.03
PCR efficiency % 102.02 89.35 97.30
R-Squared 98.66 98.67 98.89
Table 2: Characteristics of the calibration curves of PCR C. Choco 10 refers to DNA extracts from chocolate that were diluted 10 fold; Choco 20 refers to DNA extracts diluted 20 fold; cookies refers to the characteristics of the method as applied to a cookie matrix that were reported previously (Chapter 3).
mg kg-1
cookie chocolate cookie chocolate
10 5.1 40.4 2.1 2.5
100 6.9 18.5 1.0 1.7
1000 6.4 5.5 0.8 1.0
10000 3.0 3.7 1.0 0.9
CV % tot 5.3 17.0 1.2 1.5
ELISA REALTIME PCR
Table 3: Coefficient of variation (%) of the signals obtained by ELISA and real-time PCR after analysis of cookie and chocolate matrices with different peanut contents. Cookie data were reported previously (Chapter 3).

Chapter 4
92
Market survey
In a recent study a total of 315 different biscuits and 254 different chocolates were purchased in 10
European countries and analysed with a lateral flow device (dipstick) and a sandwich-type ELISA
( Pele at al., 2007). The aim of that study was to evaluate the analytical data obtained with the two
methods and compare it with the information provided on the labels of the food products. In the
present work we aimed to confirm the reported analytical data by analysing samples of this survey
with the real-time PCR assay developed to analyse such samples. All cookie and chocolate samples
that had tested positive with ELISA and or dipsticks were analysed with the real-time PCR method.
In addition to this a number of samples that had tested negative were included in our study. A total
of 105 chocolate and 103 cookies samples were analysed by real-time PCR.
In the current legislation (FALCPA, 2004; European Parliament and Council, 2000, 2003, 2007) no
threshold limits for peanut are mentioned below which a food product is considered either safe for
consumption by allergic consumers, or does not have to declare the allergenic ingredient on the
label. Therefore a qualitative analysis yielding a “yes” or “no” response with regard to the presence
of peanut traces in a food product is required.
Analysis of the food samples with a dipstick results directly in a qualitative response, since the
appearance of the “positive line” indicates the presence of the target protein, while absence of this
line means that the target can not be detected. ELISA analysis is characterised by a numerical
output, but any signal higher than the LOD identifies a positive sample. In case of the BioSystems
peanut allergen test kit, this threshold was set at 0.7 mg kg-1 (Pele et al., 2007).
In case of the real-time PCR method a qualitative analysis requires a Ct value to be set as LOD.
Therefore, both calibration curves for quantification and LOD values were defined in this study.
The three calibration curves listed in Table 2 were applied for the interpolation of Ct values of
unknown samples and to estimate the peanut content a range between 10 and 10000 mg kg-1.
Although quantification could only be applied within that range, we have previously shown that the
method can be used in a qualitative fashion when Ct values above 40, but below 45 are considered
LOD criteria
Ct score Ct ≤ 40 40<Ct≤45
3 / 3 Q POS
2 / 3 Q POS
1 / 3 POS NEG
LOD criteria
Ct score Ct ≤ 40 40<Ct≤45
3 / 3 Q POS
2 / 3 Q POS
1 / 3 POS NEG
Table 4: Criteria used to assign positive and negative analytical results to the samples analysed by real-time PCR C. The criteria are based on the number of analyses returning Cycle threshold values, after triplicate analysis (Ct score). Q: quantifiable sample, for which the respective calibration curve can be applied; POS: positive sample (qualitative result); NEG: negative sample (qualitative result).
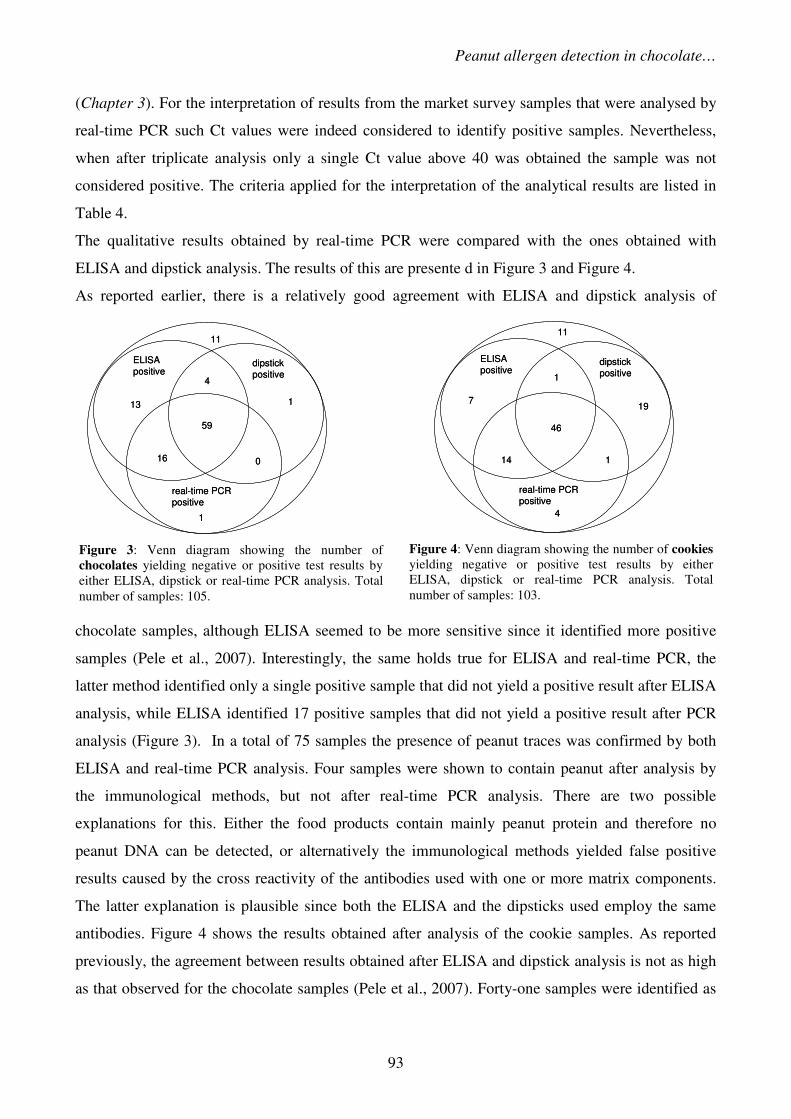
Peanut allergen detection in chocolate…
93
(Chapter 3). For the interpretation of results from the market survey samples that were analysed by
real-time PCR such Ct values were indeed considered to identify positive samples. Nevertheless,
when after triplicate analysis only a single Ct value above 40 was obtained the sample was not
considered positive. The criteria applied for the interpretation of the analytical results are listed in
Table 4.
The qualitative results obtained by real-time PCR were compared with the ones obtained with
ELISA and dipstick analysis. The results of this are presente d in Figure 3 and Figure 4.
As reported earlier, there is a relatively good agreement with ELISA and dipstick analysis of
chocolate samples, although ELISA seemed to be more sensitive since it identified more positive
samples (Pele et al., 2007). Interestingly, the same holds true for ELISA and real-time PCR, the
latter method identified only a single positive sample that did not yield a positive result after ELISA
analysis, while ELISA identified 17 positive samples that did not yield a positive result after PCR
analysis (Figure 3). In a total of 75 samples the presence of peanut traces was confirmed by both
ELISA and real-time PCR analysis. Four samples were shown to contain peanut after analysis by
the immunological methods, but not after real-time PCR analysis. There are two possible
explanations for this. Either the food products contain mainly peanut protein and therefore no
peanut DNA can be detected, or alternatively the immunological methods yielded false positive
results caused by the cross reactivity of the antibodies used with one or more matrix components.
The latter explanation is plausible since both the ELISA and the dipsticks used employ the same
antibodies. Figure 4 shows the results obtained after analysis of the cookie samples. As reported
previously, the agreement between results obtained after ELISA and dipstick analysis is not as high
as that observed for the chocolate samples (Pele et al., 2007). Forty-one samples were identified as
ELISApositive
dipstickpositive
real-time PCRpositive
11
4
59
1
113
16 0
ELISApositive
dipstickpositive
real-time PCRpositive
11
4
59
1
113
16 0
Figure 3: Venn diagram showing the number of chocolates yielding negative or positive test results by either ELISA, dipstick or real-time PCR analysis. Total number of samples: 105.
ELISApositive
dipstickpositive
real-time PCRpositive
11
1
46
19
1
4
14
7
ELISApositive
dipstickpositive
real-time PCRpositive
11
1
46
19
1
4
14
7
Figure 4: Venn diagram showing the number of cookies yielding negative or positive test results by either ELISA, dipstick or real-time PCR analysis. Total number of samples: 103.
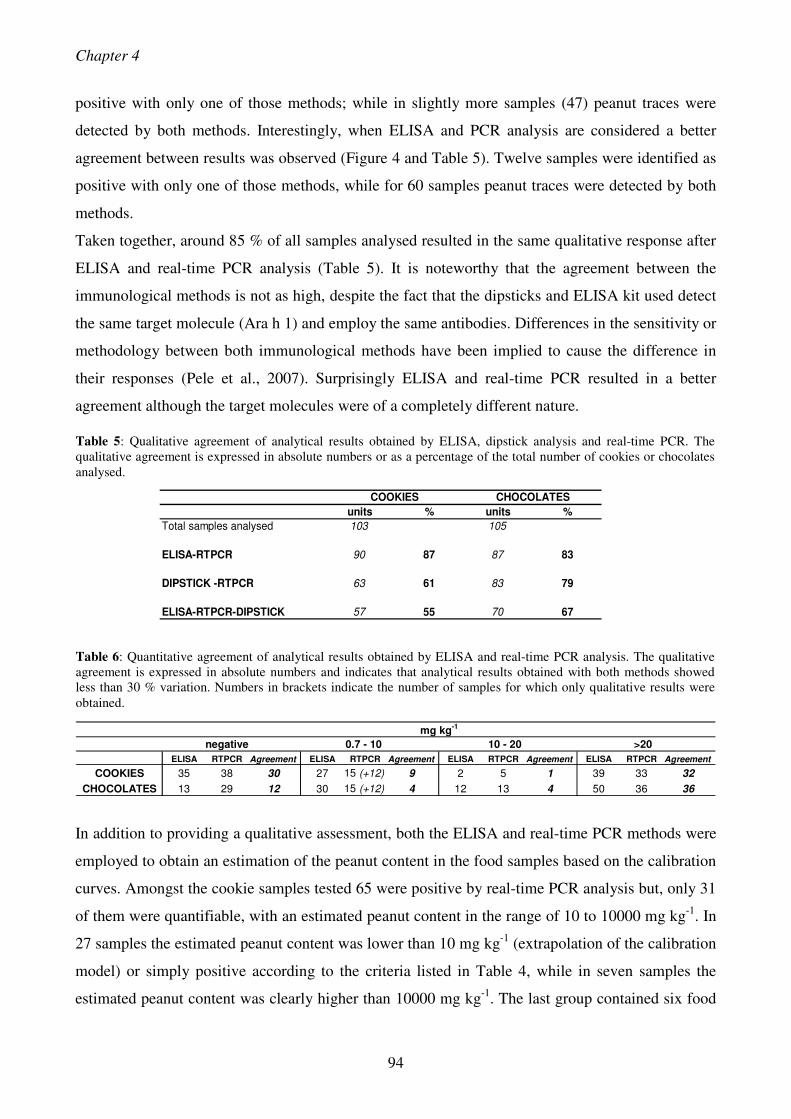
Chapter 4
94
positive with only one of those methods; while in slightly more samples (47) peanut traces were
detected by both methods. Interestingly, when ELISA and PCR analysis are considered a better
agreement between results was observed (Figure 4 and Table 5). Twelve samples were identified as
positive with only one of those methods, while for 60 samples peanut traces were detected by both
methods.
Taken together, around 85 % of all samples analysed resulted in the same qualitative response after
ELISA and real-time PCR analysis (Table 5). It is noteworthy that the agreement between the
immunological methods is not as high, despite the fact that the dipsticks and ELISA kit used detect
the same target molecule (Ara h 1) and employ the same antibodies. Differences in the sensitivity or
methodology between both immunological methods have been implied to cause the difference in
their responses (Pele et al., 2007). Surprisingly ELISA and real-time PCR resulted in a better
agreement although the target molecules were of a completely different nature.
In addition to providing a qualitative assessment, both the ELISA and real-time PCR methods were
employed to obtain an estimation of the peanut content in the food samples based on the calibration
curves. Amongst the cookie samples tested 65 were positive by real-time PCR analysis but, only 31
of them were quantifiable, with an estimated peanut content in the range of 10 to 10000 mg kg-1. In
27 samples the estimated peanut content was lower than 10 mg kg-1 (extrapolation of the calibration
model) or simply positive according to the criteria listed in Table 4, while in seven samples the
estimated peanut content was clearly higher than 10000 mg kg-1. The last group contained six food
units % units %
Total samples analysed 103 105
ELISA-RTPCR 90 87 87 83
DIPSTICK -RTPCR 63 61 83 79
ELISA-RTPCR-DIPSTICK 57 55 70 67
COOKIES CHOCOLATES
Table 5: Qualitative agreement of analytical results obtained by ELISA, dipstick analysis and real-time PCR. The qualitative agreement is expressed in absolute numbers or as a percentage of the total number of cookies or chocolates analysed.
negative 0.7 - 10 10 - 20 >20
ELISA RTPCR Agreement ELISA RTPCR Agreement ELISA RTPCR Agreement ELISA RTPCR Agreement
COOKIES 35 38 30 27 15 (+12) 9 2 5 1 39 33 32
CHOCOLATES 13 29 12 30 15 (+12) 4 12 13 4 50 36 36
mg kg-1
Table 6: Quantitative agreement of analytical results obtained by ELISA and real-time PCR analysis. The qualitative agreement is expressed in absolute numbers and indicates that analytical results obtained with both methods showed less than 30 % variation. Numbers in brackets indicate the number of samples for which only qualitative results were obtained.

Peanut allergen detection in chocolate…
95
products that declared peanut as an ingredient and one with no reference to peanut or nut on the
label. For chocolate, 76 samples tested positive by real-time PCR analysis while 44 of them were
quantifiable according to the criteria mentioned above. Four samples that declared peanut as an
ingredient had an estimated peanut content clearly exceeding 10000 mg kg-1. To assess the
quantitative agreement between real-time PCR results and ELISA results the samples had to be
grouped according to their estimated peanut content. The estimation of the peanut content as
determined by ELISA falls within the quite narrow working range of 0.7 to 20 mg kg-1. In contrast
to this, real-time PCR allowed for quantification up to 10000 mg kg-1. Therefore, all samples with a
peanut content estimation exceeding 20 mg kg-1 as determined by real-time PCR can considered to
be in agreement with ELISA if with the latter method more than 20 mg kg-1 was detected (although
with ELISA no numerical results were obtained). Except for a single cookie sample this was indeed
found to be the case. A direct comparison of quantitative results is allowed within the very small
range of 10 to 20 mg kg-1. Since only a few samples are within this range we also considered the
range of 0.7 to 10 mg kg-1 where the peanut content could be estimated by extrapolation of the real-
time PCR calibration curve. To take factors like uncertainty of measurements and the very different
nature of both methodologies into account we allowed a variation of 30 % between the estimated
peanut levels as determined by ELISA and real-time PCR. When the variation was below 30 % for
a given sample we considered the quantitative results to be in agreement. Table 6 shows that for
half of all cookie samples for which real-time PCR results were within the range of 0.7 to 20 mg kg-
1 the estimated peanut content was in agreement with the ELISA results. For chocolate this was the
case for around 30 % of the samples.
After analysis of chocolate 17 samples tested positive by ELISA while returning negative responses
after real-time PCR analysis. A possible explanation for this might lie in their high cocoa content,
since many of those samples contained “total cocoa solids” at levels exceeding 40 %. As we have
shown above such high levels of cocoa solids have a detrimental effect on the detection of peanut
residues by real-time PCR.
Analytical results and food labels
The study reported by Pele et al. focussed on the comparison of ELISA analysis and the information
on the labels of the food products. For this a distinction was made between products declaring
peanut as an ingredient, products with a precautionary warning and products that did not mention
peanut or nut on the label. Precautionary warnings were subdivided in ‘‘may contain’’ type of labels

Chapter 4
96
and ‘‘present in environment’’ type labels (e.g. ‘‘this product is made on a line that also handles
peanut’’ or ‘‘this product is made in a factory that also produces peanut-containing products’’) (Pele
et al., 2007). Such precautionary warnings either referred to peanut or to the more generic term nuts
(van Hengel, 2007). In the current study the results obtained by real-time PCR analysis were
compared with the information on the labels of the food products analysed and with the ELISA and
dipstick results. It has to be stressed that the PCR analysis was aimed at a confirmation of the
positive results obtained by ELISA and dipstick analysis, and therefore the data on the comparison
as presented in Table 7 are not representative of the complete set of samples that was purchased. Of
the cookies that declared peanut as an ingredient only 7 tested positive after ELISA analysis,
questioning the presence of peanut in those samples (Pele et al., 2007). After real-time PCR analysis
two more samples tested positive (Table 7), indicating that those two samples can indeed contain
peanut as an ingredient. For cookies of all types of labelling that were differentiated, the number of
samples that tested positive with the real-time PCR method was very similar to the ones that had
tested positive with ELISA. For chocolate almost the same number of positive samples were
detected with both methods after analysis of food products carrying a label without any reference to
nut or peanut, but ELISA identified more positive samples carrying a precautionary warning (Table
7).
COOKIES SAMPLES ELISA DIPSTICK RT PCR
units positive positive positive
peanut 15 7 7 8
INGREDIENT nut 1 0 1 1
peanut & nut 1 0 0 0
peanut 13 7 10 7
"MAY CONTAIN…" nut 7 3 6 2
peanut & nut 8 8 7 8
peanut 7 6 5 4
"PRESENT IN ENVIRONMENT" nut 0 0 0 0
peanut & nut 3 3 2 3
"NO REFERENCE" 48 35 29 33
total COOKIE samples: 103
CHOCOLATES SAMPLES ELISA DIPSTICK RT PCR
units positive positive positive
peanut 5 4 4 4
INGREDIENT nut 0 0 0 0
peanut & nut 0 0 0 0
peanut 38 33 24 29
"MAY CONTAIN…" nut 10 8 2 5
peanut & nut 35 31 23 26
peanut 0 0 0 0
"PRESENT IN ENVIRONMENT" nut 1 0 0 0
peanut & nut 1 0 0 0
"NO REFERENCE" 15 13 11 12
total CHOCOLATE samples: 105
Table 7: Relationship between the type of labelling and positive analytical results. Cookies and chocolates from the market survey, were analysed with ELISA, dipstick and real-time PCR.

Peanut allergen detection in chocolate…
97
For the allergic consumer the amount of peanut ingested determines whether an allergic reaction
occurs and how severe this reaction is. Therefore it is important to determine the peanut content in
the analysed samples. By utilizing real-time PCR the peanut content was estimated and compared to
the information on the label of the food products. In cookie samples of products carrying a
precautionary warning the highest peanut content detected was 7700 mg kg-1, while for chocolates
this was 1800 mg kg-1. Unfortunately, even higher levels were detected in food products with no
reference to peanuts or nuts on their labels with the detection of peanut at a level just exceeding
10000 mg kg-1 both for cookies and chocolate.
Conclusions
The detection of hidden allergens in food products represents an important challenge for the
scientific community. Many commercial test kits for allergen detection that are either based on
DNA or protein detection are currently on the market. Their reliability is normally assessed by
investigating their performance on the analysis of a very limited number of (model) matrices
developed for this need by each research group. This can not represent the complexity and variety
of matrices that are encountered by the analysis of market samples. The availability of multiple
methods for the detection of peanut residues allows conformation of analytical results. When DNA
based detection methods are used to confirm results obtained with protein based methods both
should yield comparable results. Recently three real-time PCR methods were compared with two
commercial ELISA kits by analysing 25 different peanut containing samples (Engler-Blum et al.,
2007), while also previous studies had focused their attention on the analysis of market samples
(Stephan and Vieths, 2004; Watanabe et al., 2006; Piknova et al., 2007). However, in those studies
a peanut content as determined by ELISA is usually compared with a raw signal (Ct value) obtained
by real-time PCR.
In this study we aimed to confirm analytical results obtained by ELISA in a large market survey, the
real-time PCR method developed for the detection of peanut traces in cookies was extended to
include chocolate matrices. For this extension a modification of the DNA extraction method was
required. The use of gelatine and dilution of the extracted DNA prior to PCR analysis was show to
be required to cope with PCR inhibition, which was shown to increase with increasing cocoa
content. This supports the notion that there is no “universal” DNA extraction method that can be
applied to any type of food matrix (Di Bernardo et al., 2007). Although chocolate was confirmed to
be a problematic matrix, two calibration curves were established to estimate the peanut content of

Chapter 4
98
unknown samples with the use of a model chocolate matrix that was spiked with the peanut test
material IRMM-481. Having developed calibration models applicable for two different types of
products from the confectionary industry (biscuits and chocolate), samples that had previously been
analysed with an ELISA assay and a lateral flow device were tested with the developed real-time
PCR method.
With regard to the current legislation (FALCPA, 2004; European Parliament and Council, 2000,
2003, 2007) a qualitative assessment of the presence or absence of peanut residues is of prime
interest. Therefore, the fact that 85 % of the ELISA results could be confirmed by real-time PCR
stresses the usefulness of both techniques that clearly complement each other. Although a
quantitative comparison of real-time PCR and ELISA was hampered by the fact a large number of
samples with a peanut content exceeding 20 mg kg-1 were not quantified with the latter method, 18
samples showed a qualitative agreement of the results obtained with both methods. This is
remarkable since a criterion of only 30 % variation was allowed for a quantitative agreement, while
both methods target markers of a completely different nature.
The availability of multiple methods for the detection of peanut traces in food products is of
paramount importance to protect the peanut allergic individual, and has identified a multitude of
chocolates and cookies for which peanut was not an ingredient that tested positive. The detection of
sometimes very high levels of peanut in market samples stresses the need for such methods and for
the analysis of food products that might endanger the health of allergic individuals.
Details on the market survey results can be found in the Annex I.
References
Aljanabi S M, Forget L, Dookun A (1999) An improved and rapid protocol for the isolation of polysaccharide- and polyphenol-free sugarcane DNA. Plant Mol Biol Rep, 17(3):281-281.
Avery N J, King R M, Knight S, Hourihane J O (2003) Assessment of quality of life in children with peanut allergy. Pediatr Allergy Immunol, 14:378–382.
Bannon G A, Besler M, Hefle S L, Hourihane J O’ B, Sicherer S H (2000) Allergen data collection: peanut (Arachis hypogea). Internet Symposium on Food Allergens 2:87.
Bock S A, Munõz-Furlong A, Sampson H A (2007) Further fatalities caused by anaphylactic reactions to food, 2001-2006. J Allergy Clin Immunol, 119:1016-8.
Burks A W, Sampson H A and Bannon G A (1998) Peanut allergens. Allergy, 53:725–730.
Codex Alimentarious: Codex Standard for chocolate and chocolate products. CODEX STAN 87-1981, Rev. 1-2003.
Di Bernardo G, Del Gaudio S, Galderisi U, Cipollaro M (2007) Comparative evaluation of different DNA extraction procedures from food samples. Biotechnol Prog, 23:297-301.

Peanut allergen detection in chocolate…
99
Engler-Blum G, Raiss Ch, Burgmaier-Thielert E (2007) Detection of allergens in food using real-time polymerase chain reaction and immunoassays: sensitive methods for detection of peanut and hazelnut - A comparative approach [Nachweis von Allergenen in Lebensmitteln Mittels Immunologischer und Molekularbiologischer Verfahren:
Gegenu berstellung von PCR- und ELISA-verfahren am Beispiel von Erdnuss und Haselnuss] Deutsche Lebensmittel-Rundschau, 103(3):101-108.
European Parliament and Council (2000). Directive 2000/13/EC of 20 March 2000 on the approximation of the laws of the Member States relating to the labelling, presentation and advertising of foodstuffs. Official J Europ Commun, L109, 29e42.
European Parliament and Council (2003). Directive 2003/89/EC of 10 November 2003 amending Directive 2000/13/EC as regards indication of the ingredients present in foodstuffs. Official J Europ Commun, L308, 15e18.
European Parliament and Council (2007). Directive 2007/68/EC of 27 November 2007 amending Annex IIIa to directive 2000/13/EC as regards certain food ingredients. Official J Europ Commun, L310, 11-14.
Flinterman A E, Pasmans S G, Hoekstra M O, Meijer Y, Van Hoffen E, Knol E F, et al. (2006) Determination of no-observed-adverse-effect levels and eliciting doses in a representative group of peanut-sensitized children. J Allergy Clin Immunol, 117:448-54.
Food Allergen Labelling and Consumer Protection Act of 2004, Public Law 108–282 August 2, 2004.
Germini A, Scaravelli E, Lesignoli F, Sforza S, Corradini R, Marchelli R (2005) Polymerase chain reaction coupled with peptide nucleic acid high-performance liquid chromatography for the sensitive detection of traces of potentially allergenic hazelnut in foodstuffs. Eur Food Res Technol, 220(5-6):619-624.
Grundy J, Matthews S, Bateman B, Dean T, Arshad S H (2002) Rising prevalence of allergy to peanut in children: data from 2 sequential cohorts. J Allergy Clin Immunol, 110:784-9.
Gryson N, Dewettinck K, Messens K (2007) Influence of cocoa components on the PCR detection of soy lecithin DNA. Eur Food Res Technol, 226:247-254.
Gryson N, Messens K, Dewettinck K (2004) Evaluation and optimisation of five different extraction methods for soya DNA in chocolate and biscuits. Extraction of DNA as a first step in GMO analysis. J Sci Food Agric, 84:1357-1363.
Hefle S L, Furlong T J, Niemann L, Lemon-Mule H, Sicherer S H, Taylor S L (2007) Consumer attitudes and risks associated with packaged foods having advisory labelling regarding the presence of peanuts. J Allergy Clin Immunol, 120:171-6.
Herman L, De Block1 J, Viane R (2003) Detection of hazelnut DNA traces in chocolate by PCR. Int J Food Sci Tech, 38:633–640.
Hird H, Lloyd J, Goodier R, Brown J, Reece P (2003) Detection of peanut using real-time polymerase chain reaction. Eur Food Res Technol, 217:265–268.
Hourihane J O, Aiken R, Briggs R, Gudgeon L A, Grimshaw K E C, DunnGalvin A, Roberts S R (2007) The impact of government advice to pregnant mothers regarding peanut avoidance on the prevalence of peanut allergy in United Kingdom children at school entry. J Allergy Clin Immunol, 119 (5):1197-1202.
Katterman F R H, Shattuck V L (1993) An effective method of DNA isolation from mature leaves of Gossypium species that contain large amounts of phenolics, terpenoids and tannins. Preparative Biochem, 13:347-359.
Khanuja S P S, Shasany A K, Darokar M P, Kumar S (1999) Rapid isolation of DNA from dry and fresh samples of plants producing large amounts of secondary metabolites and essential oils. Plant Mol Biol Rep, 17:1-7.
Koppelman S J, Knol E F, Vlooswijk R A, Wensing M, Knulst A C, Hefle S L, et al. (2003) Peanut allergen Ara h 3: isolation from peanuts and biochemical characterization. Allergy, 58:1144-51.
Koppelman S J, Vlooswijk R A A, Knippels L M J, Hessing M, Knol E F, van Reijsen and Bruijnzeel-Koomen C A F M (2001) Quantification of major peanut allergens Ara h 1 and Ara h 2 in the peanut varieties Runner, Spanish, Virginia, and Valencia, bred in different part of the world. Allergy, 56:132.
Lipp M, Shillito R, Giroux R, Spiegelhalter F, Charlton S, Pinero D, Song P (2005) Polymerase Chain Reaction Technology as Analytical Tool in Agricultural Biotechnology. J AOAC Int, 88:136-55.
Minifie B W (1989) Chocolate, cocoa, and confectionery_Science and Technology. (Third Edition. Chapman & Hall, New York ,USA) pp: 385-407.

Chapter 4
100
Mittag D, Akkerdaas J, Ballmer-Weber B K, Vogel L, Wensing M, Becker W M, et al. (2004) Ara h 8, a Bet v 1-homologous allergen from peanut, is a major allergen in patients with combined birch pollen and peanut allergy. J Allergy Clin Immunol, 114:1410-7.
Park D L, Coates S, Brewer V A, Garber E A, Abouzied M, Johnson K, Ritter B, McKenzie D (2005) Performance Tested Method multiple laboratory validation study of ELISA-based assays for the detection of peanuts in food. J AOAC Int, 88:156.
Pele M, Brohée M, Anklam E, Van Hengel A J (2007) Peanut and hazelnut traces in cookies and chocolates: Relationship between analytical results and declaration of food allergens on product labels. Food Addit Contam, 24(12):1334-1344.
Piknova L, Pangallo D, Kuchta T (2007) A novel real-time polymerase chain reaction (PCR) method for the detection of hazelnuts in food. Eur Food Res Technol, in press.
Poms R E, Agazzi M E, Bau A, Brohée M, Capelletti C, Nørgaard J V and Anklam E (2005) Inter-laboratory validation study of five commercial ELISA test kits for the determination of peanut proteins in biscuits and dark chocolate. Food Addit Contam, 22:104-112.
Porebski S, Bailey L G, Baum B R (1997) Modification of a CTAB DNA extraction protocol for plants containing high polysaccharide and polyphenol components. Plant Mol Biol Rep, 15(1):8-15.
Pumphrey R S, Gowland M H (2007) Further fatal allergic reactions to food in the United Kingdom, 1999-2006. J Allergy Clin Immunol, 119:1018-9.
Sampson H A (2003) Anaphylaxis and emergency treatment. Pediatrics, 111:1601.
Scurlock A M and Burks A W (2004) Peanut allergenicity. Ann. Allergy Asthma Immunol. 93:S12.
Sicherer S H, Burks A W, Sampson H A (1998) Clinical features of acute allergic reaction to peanut and tree nuts in children. Pediatrics, 102:1.
Sicherer S H, Munõz-Furlong A, Sampson H A (2003) Prevalence of peanut and tree nut allergy in the United States determined by means of a random digit dial telephone survey: a 5-year follow-up study. J Allergy Clin Immunol, 112:1203-7.
Sicherer S H, Noone S A, Munõz -Furlong A (2001) The impact of childhood food allergy on quality of life. Ann Allergy Asthma Immunol, 201; 87 (6):461–464.
Stephan O, Vieths S (2004) Development of a real-time PCR and a sandwich ELISA for detection of potentially allergenic trace amounts of peanut (Arachis hypogaea) in processed foods. J Agric Food Chem, 52:3754-3760.
van Hengel A J (2007) Food allergen detection methods and the challenge to protect food-allergic consumers. Anal Bioanal Chem, 389:111-118.
Vierk K, Falci K, Wolyniak C, Klontz K C (2002) Recalls of foods containing undeclared allergens reported to the US Food and Drug Administration, fiscal year 1999. J Allergy Clin Immunol, 106:1022-1026.
Watanabe T, Akiyama H, Maleki S, Yamakawa H, Iijima K, Yamazaki F, Matsumoto T, Futo S, Arakawa F, Watai M, Maitani T (2006) A specific qualitative detection method for peanut (Arachis Hypogaea) in foods using polymerase chain reaction. J Food Biochemistry, 30:215-233.
Wells M A (1999) Industrial chocolate manufacture and use (Third Edition, S T Beckett, Blackwell Science, York, UK). pp: 323-345
Whitaker T B, Williams K M, Trucksess M W, Slate A B (2005) Immunochemical analytical methods for the determination of peanut proteins in foods. J AOAC, 88 (1):161-174.
www.qiagen.com. Critical Factors for Successful PCR (www.qiagen.com/literature/brochures/pcr/pdf/pcrcha03.pdf)
Yu J W, Kagan R, Verreault N, Nicolas N, Joseph L, St Pierre Y, et al. (2006) Accidental ingestions in children with peanut allergy. J Allergy Clin Immunol, 118:466-72.

Chapter 5
A PNA-Array platform for the detection of hidden allergens in foodstuffs
A PNA array device has been designed and implemented to be used in combination with a duplex
PCR in order to simultaneously investigate the presence of traces of potentially allergenic hazelnut
and peanut in food products. A PNA probe for each target amplified by the duplex PCR was
designed, synthesised and characterised. The PNA probes were then deposited on commercial slides
in order to build a PNA array platform to be used for recognising PCR products.
Stefano Rossi, Elena Scaravelli, Andrea Germini, Roberto Corradini, Rosangela Marchelli
"A PNA-array platform for the detection of hidden allergens in food stuffs". European Food Research and Technology (2006) 223: 1–6

Chapter 5
102
Introduction
During the recent years food allergy prevalence has emerged as a serious public health issue
affecting around 1 % of world adult population and up to 2.5 % of children population respectively
(Jackson et al., 2003). Food allergens are proteins or glycoproteins with molecular weight ranging
from 10 to 70 kDa and although any protein is potentially allergenic, the most severe adverse
reactions to food are associated with the consumption of a small number of products classified in
eight main food groups responsible for about 90 % of all IgE mediated food allergies: cow’s milk,
eggs, fish, crustaceans, peanuts, soybeans, tree nuts and wheat. Since anaphylactic reactions are
reported to take place even after consumption of very low amounts of allergenic proteins
(Yunginger et al., 1988), the presence of hidden allergens in food products, not listed on the label, is
a great problem causing concern in sensitive people. To face the problem, avoidance of the
allergenic food or component is at present the only practical way for allergic patients; nevertheless
hidden allergens cause serious concern even after this precaution. In this context it is of great
importance the new directive of the European parliament (European Parliament and Council, 2003)
regarding the comprehensive labelling of allergenic food ingredients, in which the declaration of all
the major allergenic ingredients (Annex IIIbis: cow’s milk, eggs, fish, crustaceans, peanuts,
soybeans, tree nuts, wheat, celery, mustard, sesame seeds and sulphites), regardless of the total
amount in the final product, is made compulsory. Open is still the problem of threshold levels of the
allergens, i.e. the minimum quantity of a protein which elicits an allergic reaction.
Among the categories of allergenic foods, peanuts and tree nuts are probably the ones most likely to
be responsible for contamination of other materials during food manufacturing on account of their
widespread use as ingredients in many food products, and for this reason they should be considered
as potential source of hidden food allergens. Moreover, peanuts and tree nuts are not only
responsible for 1.1 % of all the allergic reactions in the USA (Sicherer et al., 1999), but are
becoming an emerging problem also in Europe (Ewan, 1996) probably on account of the increased
consumption.
Although the determinations of allergens in food (Besler, 2001; Poms et al., 2004) is mainly based
on immunological methods via the use of either specific IgE from human serum or mono and
polyclonal antibodies of animal origin, a sensitive indirect determination of the possible presence
of food allergenic proteins can be performed targeting their specific cDNA via PCR methods. This
approach has already been used for the indirect detection of specific food allergens in various
matrices such as wheat (Köppel et al., 1998), olive (Aché et al., 2002), apple (Son et al., 1999) and
hazelnut (Holzhauser et al., 2000; Herman et al., 2003) and seems to be suitable in particular when

A PNA-Array platform for the detection…
103
applied to matrices in which protein concentration is low (e.g. hidden allergens) or proteins are
partially degraded by processing. However, PCR systems can sometimes lead to ambiguous
interpretations on account of the low specificity of the priming sequences or of “carry-over”
contaminations producing false positives (Quist and Chapela, 2001). Although the latter can be
avoided by applying good laboratory practices, in all cases of ambiguous interpretations it is
advisable to confirm the identity of the PCR amplicons. This may be done in different ways
including sequencing of the amplicons, using nested PCR or using probes specifically hybridizing
target DNA sequences. Among these, particularly useful turned out to be peptide nucleic acids
(PNAs), oligonucleotide analogues in which the sugar-phosphate backbone has been replaced by a
pseudopeptide chain of N-aminoethylglycine monomers, endowed of a higher sequence specificity
(Egholm et al., 1993; Jensen et al., 1997; Dueholm and Nielsen, 1997).
In two recent works we successfully applied PNA probes to the post PCR detection of a specific
DNA sequence identifying the presence of hazelnut in foodstuffs via HPLC (Germini et al., 2005),
and of GM soybean via an array device (Germini et al., 2004).
In the present work we describe the implementation of a PNA array for the detection of hazelnut
and peanut in various foodstuffs after the simultaneous amplification of their DNA by a duplex
PCR designed and developed for the purpose. The method here proposed allows to detect the
presence of DNA coming from two potential sources of hidden allergens (i.e. hazelnut and peanut)
and to confirm simultaneously their identity via hybridization with PNA probes.
Materials and methods
Commercial samples
A set of ten commercial foodstuffs, including breakfast cereals, snacks, biscuits and chocolate, were
purchased in randomly chosen food stores.
DNA extraction.
DNA extraction was performed using the commercial kit Wizard®
Plus Minipreps DNA purification
system (Promega), opportunely modified as described in a previous work (Germini et al., 2005).
The modifications can be summarized as follows: once the DNA was extracted and purified
following the instructions provided in the commercial kit, it underwent a further purification step by

Chapter 5
104
addition of 0.1 volumes of 3 M NaOAc (pH 5.2) and two volumes of cold 95 % ethanol, followed
by incubation at –70°C for 30 minutes. After precipitation the DNA was then pelleted by
centrifugation at 12000 rpm for 15 minutes at 4 °C. The DNA pellet was washed with 80 % ethanol
and incubated at room temperature for 10 minutes, then centrifuged for 5 minutes at 12000 rpm; the
DNA pellet was finally dried and then dissolved in 100 µl of water. The DNA concentration was
evaluated by UV absorption at 260 nm; 30 ng/µl stock solutions were prepared by dilution with
bidistilled water.
Duplex PCR.
A duplex PCR system simultaneously targeting a DNA sequence characterizing the Cor a 1.0301
isoform of the hazelnut allergen (GenBank acc. number Z72440.1) and one characterizing the Ara h
2 peanut allergen (GenBank acc. number L77197.1) was designed, developed and validated. The
primer sequences chosen for the analyses are reported in table 1.
The PCR primers to be incorporated in the single DNA strand to be hybridised with the PNA array
(Cor a1_74 and Ara h2_455) were labelled with a Cy5 fluorophore at their 5’ end.
The samples for PCR screening were amplified using the method described below, whereas all
samples to be used on the array platform underwent a double amplification: the first step was used
to amplify the target sequences, while the second step was an unbalanced PCR used to selectively
amplify the target DNA single strands to be hybridised on the array.
Polymerase chain reactions were performed in a final volume of 50 µl. All the reagents were
supplied by Euroclone and the primers purchased from Thermoelectron. The concentration of the
reagents in the first PCR were: 1x reaction buffer, 3 mM MgCl2, 0.2 mM dNTPs, 0.4 µM of each
primer, 0.1 u/µl of hot start Blue Taq, 150 ng of DNA. The concentrations for the second step of the
unbalanced PCR were the same, apart from the primer concentrations brought to 0.2 µM for the
oligonucleotide priming the non target DNA strand, and 2.0 µM for the oligonucleotide priming the
target DNA strand (Table 1). The PCR was carried out in a PCR-sprint thermal cycler
(Thermohybaid) using the following conditions: 1 cycle of DNA denaturation and Blue Taq
activation at 95 °C for 5 minutes; 40 cycles consisting of DNA denaturation at 95 °C for 50
seconds, primer annealing at 60 °C for 50 seconds and elongation at 72 °C for 50 seconds; one step
of final elongation at 72 °C for 5 minutes.
Table 1

A PNA-Array platform for the detection…
105
PNA array preparation
PNA design
The PNA sequences were first checked to minimize any secondary structure which would result in a
loss of hybridization efficiency, using the online available program Mfold (version 3.1) (Zuker,
2003). The sequence specificity of the probes was first evaluated using the BLAST homology
search system from DDBJ (http://www.ddbj.nig.ac.jp/E-mail/homology.html) and then both probes
were checked in order to avoid hybridization with any other non-target region among those
amplified by the duplex PCR, by aligning the PNA sequences to the DNA sequences of the other
amplified products. The sequences chosen for the analyses are reported in table 1.
PNA synthesis
The PNA oligomers were synthesized by solid-phase synthesis on a 433A Peptide Synthesizer
(Applied Biosystems) using the BOC strategy and HBTU/DIEA coupling, as described in a
previous work (Lesignoli et al., 2001). Swelling, downloading and cleavage of the PNAs from the
resin were done manually. Two 2-(2-aminoethoxy)ethoxyacetic acid spacers were added at the N-
terminus of the PNA to link it to the solid surface of the array. The crude products were purified by
reversed phase HPLC using a Phenomenex C18 peptide column (3 µm, 250 mm × 10 mm) with a
binary gradient (flow rate: 4mL/minutes); eluent A: water /TFA = 100 : 0.2; eluent B:
water/acetonitrile/TFA = 60 : 40 : 0.2; detector UV (260 nm). The purified products were
characterized by Electrospray Ionization-mass spectrometry (ESI-MS).
Array preparation
“CodeLink Activated Slides” (Amersham Biosciences) were used as solid supports to which the
amino-terminal group of the PNA probes were covalently linked. The deposition of the probes was
carried out using a GMS 417 Arrayer (Genetic Microsystem) with a pin-and-ring deposition system.
Non targetGAC AAC GCC ATA AAA GCA CTC Ara
h 2_655
LL – CGA TCA ACA CAT TCA Peanut
TargetGGC GGC AGA GAC AGA TAC TAA Ara
h 2_455
Non targetCAC AAA ACG TAC AAC TCC TTG G Cor
a 1_229
LL – ATG ATT TCA ATG CTC Hazelnut
TargetTAG ATT CCG ACA ACC TCA TCC Cor
a 1_74
PNA sequence
(H-NH2)Target
Copied
strand
Primer sequence
(5’-3’)Primer
Table 1. Primers and PNAs used for the assay. (L: (2-aminoethoxy) etheroyl acid spacer group)

Chapter 5
106
The manufacturer instructions for the deposition protocol were slightly changed in order to comply
with the special requirement of the chemical structures of PNAs: in particular a 100 mM carbonate
buffer (pH 9.0) containing 10 % acetonitrile and 0.001 % sodium dodecyl sulphate (SDS) was used
as deposition buffer. Moreover, after every deposition, the pin-and-ring system was purged with
water for 10 seconds and further washed with acetonitrile/water (1:1), in order to avoid dragging of
the probes in subsequent depositions. The probes were coupled to the surface and the remaining
reactive sites were blocked by leaving the slides in a humid chamber (relative humidity 75 %) at
room temperature for 12 hours, followed by immersion in a glass rack containing a 50 mM solution
of ethanolamine, 0.1M TRIS, pH 9, prewarmed at 50 °C, for 30 minutes. The slides were washed
twice with bidistilled water at room temperature and then slowly shaken for 30 minutes in plastic
tubes containing a 4X salinesodium citrate (SSC) solution and a 0.1 % SDS buffer prewarmed at 50
°C. Each slide was then washed with bidistilled water at room temperature and centrifuged in a
plastic tube at 800 rpm for 3 minutes. Slides were then ready to undergo the hybridization protocol
or could be stored in a desiccated chamber for future use. It has to be remarked that, since a
fluorescent control probe (CP sequence: NH2–(AC)11–Cy5) was deposited to check the efficiency of
the deposition step, all the previously described operations were carried out away from direct light
in order to prevent degradation of the Cy5 fluorophore.
Array analysis
Sample hybridization
DNA samples to be tested were prepared by diluting 50 µl of the PCR product to a final volume of
65 µl and a final concentration of 4X SSC and 0.1 % SDS buffer. Hybridization was performed by
loading the samples to “in situ frame” chambers (Eppendorf, 0030 127.510) and leaving the slides
under slow shaking for 2 hours at 40 °C. After the hybridization step all the slides were treated
individually to prevent cross contamination. The slides were washed under slow shaking for 5
minutes at 40 °C with a 2 X SSC, 0.1 % SDS buffer prewarmed at 40 °C, followed by treatment for
1 minute with 0.2 X SSC and for 1minute with 0.1X SSC at room temperature. The slides were then
spin-dried at 1000 rpm for 5 minutes. It has to be noticed that all post hybridization steps were
performed in a dark environment to prevent degradation of the Cy5 fluorophore used to label the
target sequences.

A PNA-Array platform for the detection…
107
Image acquisition
The fluorescent signal deriving from hybridization was acquired using a GMS 418 Array Scanner
(Genetic Microsystem) at λex = 646 nm and λem = 664 nm. In order to correctly compare the
hybridization data, all the images reported were acquired with laser power = 100 and
photomultiplier gain = 40.
Results and discussion
The primer pairs chosen for the development of the duplex PCR, assessed for their specificity
during the design step by alignment in the online available databases, were then individually tested
with real standard samples in order to verify their ability to amplify only their specific targets. For
this reason the primer pairs designed for the detection of hazelnut and peanut were individually
tested with a panel of 15 in-house standard food matrices composed by nuts (brazilian nut, almond,
hazelnut, pistachio and walnut), legumes (lupine, chickpea, peanut, pea and soybean) and cereals
(barley, maize, wheat, oat and rice), using the PCR method developed, as described in the material
and methods section. In order to avoid false negative results and to confirm the presence of
vegetable amplifiable DNA, all the standards, once extracted, were tested using a protocol for the
amplification of different non-coding regions of chloroplast DNA (Taberlet et al., 1991). The results
(data not shown) indicated that a positive amplification could be observed only when the designed
primer pairs were applied to their specific targets and no amplification was observed for non target
matrices. The length of the amplicons obtained was found to be consistent with the design of the
single PCRs: 156 bp for hazelnut and 201 bp for peanut.
The limits of detection for the single and duplex PCR designed were then evaluated using
subsequent dilutions of stock solutions of their target DNA ranging from 150 ng to 1 pg. Detection
limits for the single PCRs were found to be 5 pg (data not shown), while the duplex PCR system, in
agreement whit what already known in the literature (Matsuoka et al., 2000), was found to have a
lower sensitivity, being able to amplify the target sequences down to 50 pg of target DNA (Figure.
1). The limit of detection for the PNA probes was assessed by hybridization of the PNA designed to
target hazelnut with a synthetic 15mer oligonucleotide complementary to the probe and labelled
with a Cy5 fluorescent group. The same set of probe concentrations (50, 40, 30, 20 and 10 M) was
spotted on ten slides which were then individually hybridized with concentration of the target
oligonucleotide corresponding to 0.8 µM, 0.4 µM, 0.2 µM, 0.1 µM, 50 nM, 25 nM, 12.5 nM, 6.75

Chapter 5
108
nM, 1 nM, 0.01 nM. The best hybridization signal (data not shown) in the whole range of target
concentrations was observed for the 30 µM PNA, while no significant improvement was observed
by increasing the PNA concentration. A statistically significative enhancement of the fluorescent
signal (more than ten times the signal/noise ratio) was detected down to 1nM which can then be
assumed as limit of detection of the array system. Although the oligonucleotide cannot completely
mime the behaviour of a longer single stranded DNA, such as those resulting from amplification,
these results were taken as indicative for choosing the concentration of the PNA probes to be
spotted.
The array device was prepared by depositing nine replicates for each probe to be coupled, in three
parallel lines corresponding to: H) 30 µM solution of the PNA for the detection of hazelnut; P) 30
µM solution of the PNA for the detection of peanut; CP) 30 µM Cy5 labelled control probe to
control the efficiency of the deposition step.
In order to test the selectivity of hybridization, the PNA array platform was tested with two samples
amplified from hazelnut and peanut standards respectively. The samples were prepared by double
amplification as described in the “Materials and Methods” section, in order to produce a consistent
amount of the target single strands. The samples were individually hybridized on two different
arrays according to the protocol and then their images were acquired via a fluorescent reader. The
results show that the PNA probes were able to selectively recognize the presence of hazelnut
(Figure. 2a) and peanut (Figure. 2b) respectively.
M M1 2 3 4 5 6 7 8 9 10 11 N
100 bp
200 bp
300 bp
Hazelnut
Peanut
M M1 2 3 4 5 6 7 8 9 10 11 N
100 bp
200 bp
300 bp
Hazelnut
Peanut
CPBPH CPBPH CPBPH CPBPH
a) b)
Figure 1: Limits of detection of the duplex PCR for the detection of hazelnut and peanut. Hazelnut amplicon size: 156 bp; Peanut amplicon size: 201 bp. Samples were prepared with concentration of the target DNAs corresponding to: 150 ng (1), 50 ng (2), 10 ng (3), 5 ng (4), 1 ng (5), 500 pg (6), 100 pg (7), 50 pg (8), 10 pg (9), 5 pg (10), 1 pg (11). M: 100 bp size marker. N: negative control.
Figure 2: Evaluation of the PNA specificity. The arrays were tested with the PCR product deriving from amplification of DNA extracted from hazelnut (a) and peanut (b). H: hazelnut PNA; P: peanut PNA; B: blank lane; CP: Cy5 labelled control probe.

A PNA-Array platform for the detection…
109
In order to evaluate the applicability of the PNA array method to the detection of traces of hazelnut
and peanut in foodstuffs, a panel of commercial food products, purchased on randomly chosen food
stores, was chosen in order to test their content of hazelnut and/or peanut as claimed on the label, or
for their possible presence as result of accidental contamination during manufacturing (table 2). Out
of ten selected products, the presence of hazelnut as ingredient was declared in five samples and of
peanut in one sample, while the possible presence of traces of tree nuts and peanuts as a result of
manufacturing carryover was declared in three samples.
All samples were preliminarily tested with the duplex PCR method in order to evaluate their
composition and to compare the results with what observed with the subsequent PNA array test.
Almost all the selected samples, a part from sample 6, contained hazelnut at various levels, while
only sample 3 contained both hazelnut and peanut (Figure. 3). This means that traces of hazelnut
were found in four samples which didn’t report hazelnut among the ingredients (samples 1, 3, 5, 9),
two of which did not declared it as possible contaminant (samples 3 and 5); no contamination was
found for peanut.
Sample 1 and sample 3 were then selected to be tested on the PNA array as representative for the
analyses of hidden allergens. In fact: sample 1, in which the presence of hazelnut was declared as
possible contaminant, was found to contain hazelnut; sample 3, in which the presence of peanut as
ingredient was declared but not the presence of hazelnut either as ingredient or as possible
contaminant, was found to contain both peanut and hazelnut.
HazelnutChocolate cream with hazelnut10
Possible traces of tree nuts
and peanutMilk chocolate9
Hazelnut. Possible traces of other tree nuts and peanut
Biscuit topped with cocoa cream and milk chocolate
8
HazelnutHazelnut wafer7
not presentCocoa and vanilla wafer6
not presentSnack with cereals and cocoa5
HazelnutMuesli snack with cocoa4
PeanutMuesli snack with milk chocolate3
HazelnutBreakfast cereals with chocolate and hazelnut2
Possible traces of tree nuts and peanut
Breakfast cereals1
Declared contentProductSample
Table 2: Commercial foodstuffs tested by PNA-arrays

Chapter 5
110
The samples selected were doubly amplified, and then hybridized as described in the “Materials and
Methods” section. The results obtained with the PNA array device were in agreement with those
previously observed with the duplex PCR: sample 1 gave raise to a strong hybridization signal only
on the first lane, indicating the presence of hazelnut in the tested product (Figure. 4a), whereas in
sample 3 a strong fluorescent signal was observed on the second lane and a weaker signal was also
observed for lane one, indicating the simultaneous presence of peanut and hazelnut in the tested
product (Figure. 4b).
Conclusions
A new duplex PCR method for the detection of hidden allergens in foodstuffs was developed and
tested. Its sensitivity was found to be comparable with similar methods published for other
applications and was evaluated to be 50 pg of target DNA when using standards. Its applicability to
commercial samples for screening purposes was also assessed by testing a number of selected
products. It has to be noticed that the limit of detection of the PCR method proposed might differ
when applied to food samples on account of the processing they underwent. Moreover commercial
samples different from those tested might need a specific extraction methods to obtain a pure DNA
extract.
M 1 2 3 4 5 6 7 8 9 10N
150 bp200 bp
Hazelnut
Peanut
M 1 2 3 4 5 6 7 8 9 10N
150 bp200 bp
Hazelnut
Peanut
CPBPH CPBPH CPBPH CPBPH
a) b)
Figure 3: Duplex PCR for the detection of hazelnut and peanut applied to commercial foodstuffs, as reported in table 2. Hazelnut amplicon size: 156 bp; Peanut amplicon size: 201 bp. M: 50 bp size marker. N: negative control
Figure 4: PNA array analyses for the detection of hazelnut and peanut applied to commercial foodstuffs (the numbers refer to the products reported in table 2): sample 1(a) and sample 3 (b). H: hazelnut PNA; P: peanut PNA; B: blank lane; CP: Cy5 labelled control probe.

A PNA-Array platform for the detection…
111
The availability of the duplex PCR method constituted the basis for the development of a PNA
array device which allowed to simultaneously detect the presence of DNA from hazelnut and
peanut, two ingredients which are possible source of hidden allergens in food products. The results
here presented show that this combined approach can constitute a fast and reliable method for the
indirect unambiguous determination of hazelnut and peanut in foodstuffs. Furthermore, when
compared to conventional electrophoresis methods, this platform has the advantage to perform in
one step the simultaneous detection of the presence of target organisms (i.e. hazelnut and peanut)
and to confirm the identity of the amplified products via specific sequence recognition. On account
of its sensitivity the method proposed is particularly suitable for detecting hidden allergens in food.
The model here proposed can be easily further extended with new target DNA sequences and new
PNA probes, in order to build up a complete array device for the detection of many potential
sources of food allergens in foodstuffs.
References
Aché J D, Castro A J, Rodriguez-Garcia M I (2002) Micron, 33:33-37.
Besler M (2001) Determination of allergens in foods. Trends in Analytical Chemistry, 20:662-672.
Dueholm K L, Nielsen P E (1997) Chemistry, properties and applications of PNA (Peptide Nucleic Acid). New J. Chem, 21: 19-31.
Egholm M, Buchardt O, Christensen L, Behrens C, Freler S, Driver D, Berg R, Kim S, Nordern B, Nielsen P E (1993) PNA hybridizes to complementary oligonucleotides obeying the Watson-Crick hydrogen bonding rules. Nature, 365:566-568.
European Parliament and Council (2003). Directive 2003/89/EC of 10 November 2003 amending Directive 2000/13/EC as regards indication of the ingredients present in foodstuffs. Official J Europ Commun, L308, 15e18.
Ewan P W (1996) Clinical study of peanut and nut allergy in 62 consecutive patients: New features and associations. Br Med J, 312 (7038):1074-1078.
Germini A, Mezzelani A, Lesignoli F, Corradini R, Marchelli R, Bordoni R, Consolandi C, De Bellis G (2004) Detection of genetically modified soybean using peptide nucleic acids (PNAs) and microarray technology. J Agr Food Chem, 52 (14):4535-4540.
Germini A, Scaravelli E, Lesignoli F, Sforza S, Corradini R, Marchelli R (2005) Polymerase chain reaction coupled with peptide nucleic acid high-performance liquid chromatography for the sensitive detection of traces of potentially allergenic hazelnut in foodstuffs. Eur Food Res Technol, 220:619-624.
Herman L, De Block1 J, Viane R (2003) Detection of hazelnut DNA traces in chocolate by PCR. Int J Food Sci Tech, 38:633–640.
Holzhauser T, Wangorsch A, Vieths S (2000) Polymerase chain reaction (PCR) for detection of potentially allergenic hazelnut residues in complex food matrixes. Eur Food Res Technol, 211:360-365.
Jackson W F (2003) Food Allergy. Concise monograph series. International Life Sciences Institute Europe, Belgium.
Jensen K K, Orum H, Nielsen P E, Nordén B (1997) Kinetics for hybridization of peptide nucleic acids (PNA) with DNA and RNA studied with the BIAcore technique. Biochemistry, 36:5072-5077.

Chapter 5
112
Ko ppel E, Stadler M, Lu thy J, Hubner P (1998) Detection of wheat contamination in oats by Polymerase Chain Reaction (PCR) and Enzyme-Linked Immunosorbent Assay (ELISA). Zeitschrift fur Lebensmittel -Untersuchung und -Forschung, 206 (6):399-403.
Lesignoli F, Germini A, Corradini R, Sforza S, Galaverna G, Dossena A, Marchelli R. (2001) Recognition and strand displacement of DNA oligonucleotides by peptide nucleic acids (PNAs): High-performance ion-exchange chromatographic analysis. J Chromatogr A, 922:177-185.
Matsuoka T, Kawashima Y, Akiyama H, Miura H, Goda Y, Kusakabe Y, Isshiki K, Toyoda M, Hino A. (2000) A method of detecting recombinant DNAs from four lines of genetically modified maize. J Food Hyg Soc Japan, 41:137-143.
Poms R E, Klein Ch, Anklam E (2004) Methods for allergen analysis in food: A review. Food Addit Contam, 21:1-31.
Quist D, Chapela I H (2001) Transgenic DNA introgressed into traditional maize landraces in Oaxaca, Mexico. Nature, 414:541.
Sicherer S H, Munoz-Furlong A, Burks A W and Sampson H A (1999) Prevalence of peanut and tree nut allergy in the US determined by a random digit dial telephone survey. J Allergy Clin Immunol, 103:559-562.
Son D Y, Scheurer S, Hoffmann A, Haustein D, Vieths S (1999) Pollen-related food allergy: Cloning and immunological analysis of isoforms and mutants of Mal d 1, the major apple allergen, and Bet v 1, the major birch pollen allergen. Eur J Nutr, 38 (4):201-215.
Taberlet P, Gielly L, Pautou G, Buovet J (1991) Universal primers for amplification of three non-coding regions of chloroplast DNA. Plant Molecular Biology, 17:1105-1109.
Yunginger J W, Sweeney K G, Sturner W Q, Giannandrea L A, Teigland J D, Bray M, Benson P A, York J A, Biedrzycki L, Squillace D L and Helm R M (1988) Fatal food-induced anaphylaxis. JAMA, 260:1450-1452.
Zuker M (2003) Mfold web server for nucleic acid folding and hybridization prediction. Nucleic Acids Res, 31(13):1-10.

Chapter 6
Unconventional method based on circular dichroism to detect peanut DNA in
food by means of a PNA probe and a cyanine dye
An innovative and unconventional method based on circular dichroism for the identification of
peanut DNA in food was developed. The specific DNA target sequence can be detected after PCR
amplification at the nanomolar level by using an achiral PNA probe complementary to the amplified
tract of the peanut Ara h 2 gene, and the combined use of an achiral 3,3’-diethylthiadicarbocyanine
dye (DiSC2(5)). The optimized method was applied to the identification and quantification of DNA
extracted and amplified by PCR from peanuts and from peanut-containing foods.
Stefano Sforza, Elena Scaravelli, Roberto Corradini, Rosangela Marchelli “Unconventional method based on circular dicroism to detect peanut DNA in food by means of a
PNA probe and a cyanine dye”. Chirality, 2005; 17:1-7

Chapter 6
114
Introduction
Peanuts are one of the most common causes of severe allergic reactions to foods even at minimal
doses (100 µg of peanut proteins) (Hourihane et al., 1997a, 1997b), leading to life-threatening
anaphylaxis and even death (Sampson et al., 1992; Yunginger et al., 1988). Avoidance of peanut-
containing foods can be sometimes difficult for allergic patients because of mislabelling of the
products, recycling of peanut-containing foods, or cross-contamination during processing. In order
to protect the consumer, detection methods are required which specifically detect the presence of
hidden allergens in a wide variety of food items.
Enzyme linked immunosorbent assays (ELISA) (Besler, 2001) are currently the most common
methods to determine allergenic proteins in food products; however industrial processes often
involve heat treatments, which may denature food proteins (Klein et al., 1984), thus modifying the
protein structure and so interfering with their detection. In this case, an alternative is represented by
the detection of the specific DNA of a determined species. DNA is less modified under heat and
pressure processing and therefore it can provide a food index for the presence of hidden allergens in
foods (Hird et al., 2003). The DNA extracted from food must be amplified by using PCR
(Polymerase Chain Reaction). The presence of the amplified DNA product, which can be easily
verified by gel electrophoresis, is taken as a proof of the identity of the specific DNA, although this
is not always sufficient to get a definitive confirmation, since aspecific amplifications can often
generate false positives, making necessary further confirmatory tests (Holzhauser et al., 2002; Borst
et al., 2004; Prakoso et al., 2003).
One of the most promising approaches to confirm the DNA sequences after PCR amplification
makes use of peptide nucleic acids (PNAs), oligonucleotide analogues with a pseudopeptide
backbone (Nielsen, 2004), which bind to complementary DNA sequences through standard Watson-
Crick hydrogen bonds and show a higher affinity for DNA than DNA itself, due to the absence of
electrostatic repulsions between negative charges typical of DNA-DNA duplexes. Moreover, PNA-
DNA duplexes are also characterized by a very high sequence specificity (Egholm et al., 1993). An
HPLC method has been recently developed by our group for identifying specific DNA sequences by
means of PNA probes (Lesignoli et al., 2001) and its use for the confirmation of the presence of
hazelnut DNA previously amplified by PCR has also been reported (Germini et al., 2005).
In 1999 Armitage et al. reported that hybridization of PNA to DNA sequences can be readily
visualized by using 3,3’-diethylthiadicarbocyanine dye (DiSC2(5), Figure 1), which strongly
aggregates to PNA-DNA duplexes changing its absorbtion properties: the solution containing the
dye alone in its prevailing monomeric state has a typical blue color, whereas upon aggregation to

Unconventional method based on circular dichroism…
115
the PNA-DNA duplex, the solution becomes purple, due to the appearance of a characteristic band
at 540 nm (Smith et al., 1999).
However, although outstanding results have been obtained for the detection of point mutations
related to genetic diseases in humans (Wilhelmsson et al., 2002; Komiyama et al., 2003), several
problems hamper its widespread use. First, the DiSC2(5) dye has a strong tendency to aggregate
also on free PNAs, often generating confusing results. Moreover, the colorimetric detection has low
sensitivity, requiring a DNA concentration in the low micromolar range, which is not easily
obtained.
In this work we investigated the possibility to use of the DiSC2(5) dye and a PNA probe in order to
confirm DNA sequences after PCR amplification by means of circular dichroism spectroscopy.
This technique has never been viewed before for this purpose. The rationale derives from the well
known fact that, upon aggregation on PNA-DNA duplexes, not only a diagnostic absorbance band
at 540 nm wavelength appears, but also a strong CD signal is generated in the same region, due to
the asymmetric conformation of the DiSC2(5) dye aggregate induced by the PNA-DNA double
helix. Moreover the right-handedness of the PNA-DNA helix also induces a right-handed helical
arrangement of the dye aggregate, thus generating a strong exciton coupling effect which defines
the shape of the CD band (Smith et al., 1999). The use of circular dichroism can overcome the
limitations of the absorbance measurements, since it gives a positive signal only in the presence of
chiral compounds: the DiSC2(5) dye, which is achiral, aggregates on the PNA-DNA duplex and on
single strand PNA, but only the first one is a chiral complex, since the DNA is chiral but the PNA is
not. Moreover, the strong intensity of the generated CD band may allow for a sensitive detection of
DNA even at very low concentrations.
The DNA target of this work is an internal sequence of the peanut Ara h 2 gene (GenBank acc.
number L77197) which codifies for one of the major allergen in peanuts. DNA detection, after
amplification by Polymerase Chain Reaction (PCR), is based on the use of a complementary 15-mer
PNA probe and the DiSC2(5) dye. The appearance of the CD signal in the 500-600 nm region with a
right handed exciton coupling will confirm the presence and the identity of the amplified DNA.
This method will be applied both to model systems and to foods.
N
SS
N+
Figure 1: Structure of DiSC2(5) dye.
Chapter 6
116
Materials and methods
PNA design
The PNA sequence was designed in order to minimize any secondary structure which would result
in a loss of hybridization efficiency, using the online available program Mfold (version 3.1; Zuker,
2003). The sequence specificity of the probe was first evaluated using the BLAST homology search
system from DDBJ (http://www.ddbj.nig.ac.jp/E-mail/homology.html) (and then it was checked in
order to avoid hybridization with any other non-target region among other amplified products.) The
sequence chosen for the analyses is H-CGATCAACACATTCA-NH2.
PNA synthesis
The PNA H-CGATCAACACATTCA-NH2 was synthesised by solid-phase synthesis on a ABI
433A Peptide Synthesizer (Applied Biosystems) with the Boc strategy and HATU/DIEA coupling,
as described previously (Lesignoli et al., 2001; Germini et al., 2005). Swelling, downloading and
cleavage of the PNA from the resin were done manually. Two 2-(2-aminoethoxy)ethoxyacetic acid
linkers were added at the N- terminus of the PNA for its eventual linking to solid surfaces (i.e.
microarrays). The crude product was cleaved from the resin by using a 2:6:1:1
TFMSA/TFA/thioanisole/m-cresol mixture, precipitated by Et2O and purified by reversed phase
HPLC using a Phenomenex C18 peptide column (3 µm, 250 mm × 10 mm) with a binary gradient
(flow rate: 4mL/min); eluent A: water /TFA = 100 : 0.2; eluent B: water/acetonitrile/TFA = 60 : 40 :
0.2; detector UV (260 nm). The purified product was characterized by ESI mass spectrometry
(Micromass ZMD, positive ion mode): calcd. MW 4305 Da, calcd m/z: 862.0 (MH55+), 718.5
(MH66+), 616.0 (MH7
7+) found m/z 861.9, 718.5, 615.9.
Oligonucleotide sequences
The oligonucleotide fully complementary to the PNA synthesized (5’-TGAATGTGTTGATCG-3’),
to be used in the model experiments, and a non complementary oligonucleotide (5’-
GAGCATTGAAATCAT-3’) to be used as control in the same experiments, were purchased from
Thermo Electron (Waltham, MA, USA).

Unconventional method based on circular dichroism…
117
Food samples
Unroasted peanuts without shell were provided by an italian food factory.
Muesli snacks with cereals and milk chocolate were commercially available. Declared content:
Milk chocolate (21 %) sugar syrup, extruded cereal (wheat flour, rice, maiz malt, sugar and salt)
toasted oat flakes, toasted peanut bits (7 %), brown sugar, hydrogenated vegetable oil, corn flakes
(maize, sugar, salt, malt) whole condensed milk, toasted wheat flakes, toasted almond bits (1 %),
honey (1 %), malt, emulsifying agent: mono and diglycerides of fatty acids; salt, flavours. Average
cereal contents: 36 %.
Chocolate wafers were commercially available. Declared content: Cream filling 76 % (filling with
cocoa 38 %: sweetener maltitol, vegetable fats, cocoa 11 %, whole milk powder, rice-starch,
flavours; filling with vanilla flavour 38 %: vegetable fats, sweetener maltitol, whole milk powder,
rice-starch, lecithin emulsifier agents, flavours), wheat flour, potato starch, vegetable oils, raising
agents (sodium hydrogen carbonate), lecithin emulsifier agents, salt.
DNA extraction
DNA extraction was performed using the commercial kit Wizard® Plus Minipreps DNA
purification system (Promega, Madison, WI, USA) opportunely modified as described in a previous
work (Germini et al., 2005). The modifications can be summarized as follows: once the DNA was
extracted and purified following the instructions provided by the commercial kit, it underwent a
further purification step by addition of 0.1 volumes of 3 M sodium acetate (pH 5.2) and two
volumes of cold 95 % ethanol, followed by incubation at –70 °C for 30 minutes. After precipitation
the DNA was pelleted by centrifugation at 12000 rpm for 15 minutes at 4 °C. The DNA pellet was
washed with 80 % ethanol and incubated at room temperature for 10 minutes, then centrifuged for 5
minutes at 12000 rpm; the DNA pellet was finally dried and then dissolved in 100 µl of water.
Polymerase chain reaction (PCR)
In order to develop a valid PCR method for the detection of specific DNA sequences coding for
peanut allergens, several primer pairs were designed on known sequences obtained from on line
available databases. The target sequence was the Ara h 2, one of the major allergens in peanut
(GenBank acc. number L77197); the specificity of the possible PCR was firstly evaluated by
aligning the designed amplicon with the available sequences using the database DDBJ Homology

Chapter 6
118
search system and then tested by PCR. The target sequence was a 201 bp region identified by the
primers Ara h 2_455 (5’-GGCGGCAGAGACAGATACTA-3’) and Ara h 2_655 (5’-
GACAACGCCATAAAAGCACTC-3’).
Polymerase chain reactions were performed in a final volume of 100 µl. All the reagents were
supplied by Euroclone (Wheterby, UK) and the primers purchased from Thermo Electron
(Waltham, MA, USA).
The DNA extracted from peanuts underwent a double amplification: the first step was used to
amplify the target sequences, while the second step was an asymmetric PCR used to selectively
amplify the target DNA single strands to be hybridized with PNA, by using the double-stranded
DNA obtained from the first PCR as the template to produce single-stranded DNA. The reagent
concentrations in the first PCR were: 1x reaction buffer, 3 mM MgCl2, 0.2 mM dNTPs, 0.4 µM of
each primer, 0.1 u/µl of hot start Blue Taq, 150 ng of extracted peanut DNA. For the second step
(the asymmetric PCR), the reagent concentrations were the same, except the primer concentrations
brought to 0.2 µM for the primer copying the non target DNA strand, and 2.0 µM for the primer
copying the target DNA strand. Both PCR procedures were carried out in a PCR-sprint thermal
cycler (Thermo Hybaid) using the following conditions: 1 cycle of DNA denaturation and Blue Taq
activation at 95 °C for 5 minutes; 40 cycles consisting of DNA denaturation at 95 °C for 50
seconds, primer annealing at 60 °C for 50 seconds and elongation at 72 °C for 50 seconds; one step
of final elongation at 72 °C for 5 minutes.
The DNA extracted from commercially available cereal snacks and chocolate wafers directly
underwent to asymmetric PCR. In order to avoid false negative results generated by the residual
presence of eventual PCR inhibitors, the extracted genomic DNA was diluted 20 times and only 4
µL of the diluted solution were added to the mastermix. All other reagent concentrations and
conditions for the asymmetric PCR were the same above reported.
DNA-PNA hybridization
DNA-PNA hybridization tests were performed in a final volume of 2 mL: phosphate buffer (NaCl
100 mM, NaH2PO4·H2O 10 mM, EDTA 0,1 mM; pH 7), PNA (300 nM), DNA and water to 2 mL
volume. The DNA used in the model experiments is a synthetic 15mer oligonucleotide
complementary to the PNA used at different concentrations (from 1 to 300 nM). The DNA in the
experiments making use of real food samples was the product of an asymmetric PCR of unknown

Unconventional method based on circular dichroism…
119
concentration (100 µL used). All samples were previously hybridized at 95 °C for 5’ and then
cooled to room temperature.
Addition of the DiSC2(5)dye
DiSC2(5) dye was purchased from Sigma-Aldrich (St. Louis, MO, USA). A stock solution of
DiSC2(5) in methanol (500 µM) was added to each sample up to a final concentration of 10 µM in a
total volume of 2 mL at room temperature; samples were then immediately analyzed in order to
record the CD spectra.
Spectral measurements
CD spectra were recorded on a JASCO J-715 spectropolarimeter equipped with a Peltier
thermostate (measurements done at 20°C). Acquisition range 400-700 nm, resolution 1 nm,
accumulation 1, band width 1.0 nm, response 1 seconds, scan speed 100 nm/minutes. All spectra
were treated with the noise reduction software included in the program J-700 for Windows Standard
Analysis, version 1.33.00.
Results and discussion
The experimental design of the approach here proposed is represented schematically in Figure 2.
Amplified DNA
+
PNA DyeDNA-PNA duplex
+
Chiral dye aggregate
CD signal at 500-600 nm
1) Presence of the specific DNA sequence
No amplified
DNA or
aspecific DNA
+
PNA DyeUnbound PNA
+
Achiral dye aggregate
No CD signal at 500-600 nm
2) Absence of the specific DNA sequence
Figure 2: The rationale of the proposed method. 1) If the correct DNA sequence is amplified, the PNA will form a specific PNA-DNA duplex. Aggregation of the dye on this chiral duplex will generate a CD signal at 500-600 nm due to the induced chirality in the dye aggregate. 2) If no amplification occurs or if a wrong DNA sequence is aspecifically amplified, the PNA will not bind the DNA. The dye will nevertheless aggregate on the free PNA, but being the PNA achiral and the dye achiral, no CD signal will be generated at 500-600 nm.
Chapter 6
120
As a model system to test our hypothesis, we used a 15-mer PNA designed to be complementary to
a sequence contained in the Ara h 2 gene (the sequences are given in the experimental section), a
gene which codes for the major peanut allergen.
In order to assess if a viable CD signal could be obtained by the dye aggregation onto the PNA-
DNA duplex present at a low concentration and in order to define the best working concentration of
the dye, we mixed the PNA strand (300 nM) with its complementary synthetic oligonucleotide (30
nM) in a phosphate buffer (pH = 7) and we added the DiSC2(5) dye to the solutions in
concentrations ranging from 1 to 30 µM. The concentration of the complementary oligonucleotide
was kept very low in order to simulate a likely DNA concentration of a PCR product. A well
defined CD spectrum was recorded starting from a 5 µM dye concentration and the CD band
appeared to level out at 10 µM, since addition of 20 or 30 µM DiSC2(5) dye did not increase the
band intensity (data not shown). This simple experiment demonstrated that a very small amount of
DNA can be detected by circular dichroism using PNA probes in connection with the DiSC2(5) dye
and, according to the data obtained, a 10 µM concentration of the DiSC2(5) dye was chosen as
optimal working condition.
In order to test the specificity of the sequence recognition, the 15-mer PNA was also mixed with a
non complementary oligonucleotide in a phosphate buffer (pH = 7) and DiSC2(5) dye (10 µM) was
added to the solution. The CD spectra of the PNA (300 nM) mixed with the fully complementary
oligonucleotide (30 nM) and with a non complementary oligonucleotide (30 nM), both added of
DiSC2(5) dye (10 µM), are reported in Figure 3. A CD spectrum of the solution containing only the
dye and the complementary oligonucleotide, without any PNA, is also reported.The appearance of
the CD band was clearly related to the presence of the specific PNA-DNA duplex, since in all cases
when the duplex was not present (PNA with non complementary oligonucleotide or oligonucleotide
alone), the signal was not significantly different form the baseline noise. It should be underlined
that, although in the case of PNA mixed with the non complementary oligonucleotide no CD signal
was detected, consistently with the likely absence of any PNA-DNA duplex, the solution
nevertheless strongly absorbed at 540 nm and therefore became purple, since the dye strongly
aggregated on the free PNA. This aspecific aggregation, although very disturbing in the case of
absorbance measurements, is totally “invisible” in circular dichroism spectrophotometry, no chiral
species being involved. Actually, since a fraction of the dye aggregates on the free PNA, this could
result in a decrease of the available dye able to aggregate on the PNA-DNA duplex and could
ultimately lead to a decrease of the potential CD signal, but the fact that the CD signal did not
increase from 10 to 30 µM dye concentration confirmed that even at 10 µM concentration, being

Unconventional method based on circular dichroism…
121
the dye present in large excess if compared to the PNA and to the DNA strands (and therefore also
if compared to the PNA-DNA duplex), the fraction aggregated on the free PNA did not affect the
intensity of the CD signal.
The absence of significant CD signals in the presence of the oligonucleotide and the dye is also of
particular importance, since, being the DNA a chiral molecule, if the dye could interact with the
single stranded DNA it may result in potentially interfering CD bands. In order to definitively rule
out an interaction of the single stranded DNA with the dye, we have also added the non
complementary oligonucleotide to the solution which contained the PNA, the complementary DNA
and the dye, and we observed that the intensity and the shape of the CD spectrum were not
influenced by this addition (data not shown). It should be underlined that ruling out an interaction of
the dye with the single stranded DNA is of a particular importance in a real application with a DNA
coming from a PCR amplification, where a short target DNA sequence is embedded in a very long
DNA tract.
A further set of experiments was then performed in order to test the correlation between the
oligonucleotide concentration and the CD signal, by mixing different concentrations of the
oligonucleotide (1, 5, 10, 50, 100, 300 and 500 nM) with the complementary PNA (300 nM) and
with the DiSC2(5) dye (10 µM). The spectra are reported in Figures 4 (from 1 to 100 nM
oligonucleotide concentration) and 5 (from 50 to 500 nM oligonucleotide concentration).
-20
-15
-10
-5
0
5
10
15
20
400 450 500 550 600 650 700
wl (nm)
CD
(m
deg
)
PNA + dye +
complementary
oligonucleotide
PNA + dye +
non complementary
oligonucleotide
dye +
complementary
oligonucleotide
without PNA
Figure 3: CD spectra obtained by adding the DiSC2(5) dye (10 µM) to: i) a solution containing the 15-mer PNA complementary to a tract of the Ara h 2 gene (300 nM) and its
complementary oligonucleotide (5’-TGAATGTGTTGATCG-3’, 30 nM); ii) a solution containing the same PNA and a non complementary oligonucleotide (5’- GAGCATTGAAATCAT-
3’, 30 nM) iii) a solution containing the complementary oligonucleotide alone. (5’-TGAATGTGTTGATCG-3’, 30 nM).

Chapter 6
122
A plot of the CD signal against the oligonucleotide concentration could be obtained by using the
total CD signal (CDTot) defined as CDTot = CD555nm – CD525nm, where CD555nm is the intensity of the
CD signal at 555 nm (positive) and CD525nm is the intensity of the CD signal at 525 nm (negative):
the formula gives the sum of the absolute intensities of the two CD bands generated by the exciton
effect. Every experiment at every different concentration was repeated three times and the average
results were used in the plot. The plots are reported as inserts in Figures 4 and 5.
-50
-40
-30
-20
-10
0
10
20
400 450 500 550 600 650 700
wl (nm)
CD
(m
deg
) 1 nM DNA
100 nM DNA
1 nM DNA
100 nM DNA
R2 = 0.9955
0.010.020.030.040.050.060.070.080.0
0 50 100 150
oligonucleotide conc. (nM)
CD
To
t
Figure 4: Increase of the CD signal according to the oligonucleotide concentration in solutions containing the 15-mer PNA complementary to a tract of the Ara h 2 gene (300 nM), the complementary oligonucleotide (5’-
TGAATGTGTTGATCG-3’, concentrations: 1, 5, 10, 50, 100 nM) and the DiSC2(5) dye (10 µM). The plot of the total CD signal against the oligonucleotide concentration is shown in the insert with the corresponding linear regression.
-120
-100
-80
-60
-40
-20
0
20
40
60
400 450 500 550 600 650 700
wl (nm)
CD
(m
deg
) 50 nM DNA
500 nM DNA
50 nM DNA
500 nM DNA
0.020.040.060.080.0
100.0120.0140.0160.0
0 200 400 600
oligonucleotide conc. (nM)
CD
To
t
Figure 5: Increase of the CD signal according to the oligonucleotide concentration in solutions containing the 15-mer PNA complementary to a tract of the Ara h 2 gene (300 nM), the complementary oligonucleotide (5’-
TGAATGTGTTGATCG-3’, concentrations: 50, 100, 300 and 500 nM) and the DiSC2(5) dye (10 µM). The plot of the
total CD signal against the oligonucleotide concentration is shown in the insert with the corresponding regression.

Unconventional method based on circular dichroism…
123
The value recorded at a 1 nM concentration of the oligonucleotide was not significantly different
from the value recorded with the non complementary oligonucleotide: as a consequence, the limit of
detection of this method can be approximately estimated to be 5 nM DNA concentration. It is
immediately evident that the response is related to the oligonucleotide concentration and it is also
linear up to 100 nM (Figure 4), whereas the signal has a tendency to level off at higher
concentrations (Figure 5). Therefore, in order to have a linear response, it appears that the PNA has
to be present in excess as compared to the DNA strand. The linearity of response has important
consequences as far as DNA quantification is concerned. If we assume that the intensity of the CD
signal only depends from the PNA-DNA duplex concentration, then it should not be strongly
influenced if the target DNA sequence is part of a much longer DNA sequence, as it happens in a
PCR product. Therefore, we can use the linear regression obtained with the complementary
oligonucleotide to “calibrate” the method, making an accurate quantification of the amount of DNA
after the PCR amplification feasible.
On the base of the promising results obtained in the model system with the complementary
oligonucleotide, the method was tested in real samples, by using PCR products instead of a
synthetic oligonucleotide.
Unroasted peanuts were used as the first sample: the DNA was extracted and a 201 base pair region
of the Ara h 2 gene was first amplified by a standard PCR procedure. Since a PCR yields double
stranded DNA and given the fact that PNA can hybridize only to single stranded DNA, a further
PCR was then performed by using different concentrations of the two primers (asymmetric PCR), in
order to have a certain amount of single stranded DNA which could be recognized and bound by the
PNA. The details of DNA amplification starting from peanuts are reported in the experimental
section. After the asymmetric amplification, 100 µL of the mixture containing the amplified DNA
was mixed with the PNA (300 nM) and the DiSC2(5) dye (10 µM). A strong signal was obtained, as
reported in figure 6, allowing to confirm the presence of a DNA containing the target sequence, i.e.
a part of the Ara h 2 gene, as it was expected.
A more interesting experiment was then performed by trying to assess the presence of peanut DNA
in cereal snacks containing peanuts (peanut declared content: 7 %): the DNA was extracted and the
region of the Ara h 2 gene directly amplified by using only asymmetric PCR, without preamplifying
the DNA by standard PCR. In order to test a negative sample, the DNA was also extracted and
amplified by asymmetric PCR also from a chocolate wafer not containing peanuts. After adding the
PNA probe and the DiSC2(5) dye, the CD spectra were recorded and are also reported in Figure 6.
This experiment consistently gave positive signals only in the presence of the peanut-containing
sample.

Chapter 6
124
The linear regression obtained as reported above was used to quantify the single stranded DNA
present in the two positive cases, by assuming that the aggregation of the dye is influenced only by
the PNA-DNA duplex. We obtained a value of 41 nM in the case of DNA coming from 100 %
peanuts (corresponding to an absolute amount of single strand DNA of 82 pmol) and a value of 9
nM for the DNA coming from the cereal snacks (corresponding to an absolute amount of single
strand DNA of 18 pmol).
It should also be noted, as a final remark, that the extreme sensitivity of the method requires the use
of a very specific PNA probe. Whenever in the post-PCR mixture an amplified DNA is present
which does not correspond to the target sequence, in order to avoid false positives, it is absolutely
mandatory that the PNA probe bears less than 4-5 bases complementary to any tract along the
overall DNA sequence. In fact, preliminary experiments showed that a complementarity of 5 bases
or more will give rise to PNA-DNA duplexes stable enough to elicit DiSC2(5) dye aggregation and
therefore the appearance of CD signals which, in that case, are false positives.
Conclusions
We report for the first time a method based on circular dichroism for the confirmation, after PCR
amplification, of a specific DNA sequence in foods by using a PNA probe and the
diethylthiadicarbocyanine dye. The method is based on the appearance of a diagnostic absorption
-30
-20
-10
0
10
20
30
400 450 500 550 600 650 700
wl (nm)
CD
(m
deg
)
peanuts
peanut-containing
cereal snacks
chocolate wafers
with no peanuts
Figure 6: CD spectra obtained by adding the DiSC2(5) dye (10 µM) to: i) a solution containing the 15-mer PNA complementary to a tract of the Ara h 2 gene (300 nM) and the DNA
extracted and amplified from unroasted peanuts; ii) a solution containing the 15-mer PNA complementary to a tract of the Ara h 2 gene (300 nM) and the DNA
extracted and amplified from peanut-containing (7%) cereal snacks; iii) a solution containing the 15-mer PNA complementary to a tract of the Ara h 2 gene (300 nM) and the DNA
extracted and amplified from chocolate wafers with no peanuts.

Unconventional method based on circular dichroism…
125
band at 540 nm, due to the aggregation of the dye onto the PNA-DNA duplex, accompanied by the
selective elicitation of a CD signal at the same wavelength due to the chirality of the dye aggregate
induced by the right-handedness of the PNA-DNA duplex. The method appears to be very selective,
since the free PNA/dye aggregate, which exists in solution, does not give rise to any CD signal,
being achiral, and the dye does not aggregate on free DNA. The method was demonstrated to be
very sensitive, allowing the confirmation of DNA down to a 5 nM concentration, and the response
was shown to be linear in the 5-100 nM range.
Application to real food samples demonstrated that the method can be used for the confirmation of
peanut DNA after PCR amplification also in complex food matrices, making this approach a
specific and efficient way to confirm the presence of hidden allergens in food.
References
Besler M (2001) Determination of allergens in foods. Trac-Trend Anal Chem, 20:662-672.
Borst A, Box A T A, Fluit A C (2004) False-positive results and contamination in nucleic acid amplification assays: Suggestions for a prevent and destroy strategy. Eur J Clin Microbiol, 23:289-299.
Egholm M, Behrens C, Christensen L, Berg R H, Nielsen P E, Buchardt O (1993) Peptide nucleic acids containing adenine or guanine recognize thymine and cytosine in complementary DNA sequences. J Chem Soc Chem Commun, 9:800-801.
Germini A, Scaravelli E, Lesignoli F, Sforza S, Corradini R, Marchelli R (2005) Polymerase chain reaction coupled with peptide nucleic acid high-performance liquid chromatography for the sensitive detection of traces of potentially allergenic hazelnut in foodstuffs. Eur Food Res Technol, 220:619-624.
Hird H, Lloyd J, Goodier R, Brown J, Reece P (2003) Detection of peanut using real-time polymerase chain reaction. Eur Food Res Technol, 217:265-268.
Holzhauser T, Stephan O, Vieths S (2002) Detection of Potentially Allergenic Hazelnut (Corylus
avellana) Residues in Food: A Comparative Study with DNA PCR-ELISA and Protein Sandwich-ELISA. J Agric Food Chem, 50:5808-5815.
Hourihane J, Kilburn S, Dean P, Warner J (1997a) Clinical characteristics of peanut allergy. Clin Exp Allergy, 27:634-639.
Hourihane J, Kilburn S, Nordlee J, Hefle S, Taylor S, Warner J. (1997b) An evaluation of the sensitivity of subjects with peanut allergy to very low doses of peanut protein: A randomized, double-blind, placebo-controlled food challenge study. J Allergy Clin Immunol, 100:596-600.
Klein E, Fincke A, Baudner S, Gunther H O (1984) Rev Choc Confevt Bakery, 9:22-23.
Komiyama M, Ye S, Liang X Yamamoto Y, Tomita T, Zhou JM, Aburatani H (2003) Pna for one-base differentiating protection of DNA from nuclease and its use for SNPs detection. J Am Chem Soc, 125:3758-3762.
Lesignoli F, Germini A, Corradini R, Sforza S, Galaverna G, Dossena A, Marchelli R (2001) Recognition and strand displacement of DNA oligonucleotides by peptide nucleic acids (PNAs) - High-performance ion-exchange chromatographic analysis. J Chromatogr A, 922:177-185.
Nielsen PE editor (2004) Peptide Nucleic Acids – Protocols and Applications. Norfolk: Horizon Bioscience; pp:318.
Prakoso B, Nitisinprasert S, Stevens WF (2003) Genetically modified soybeans: false-positive detection in fermented natural soybean (tempe). Biotechnol Lett 25:1485-1490.

Chapter 6
126
Sampson H, Mendelson L, Rosen J. (1992) Fatal and near-fatal anaphylactic reactions to food in children and adolescents. N Engl J Med, 327:380-384.
Smith J O, Olson D A, Armitage B A (1999) Molecular recognition of PNA-containing hybrids: spontaneous assembly of helical cyanine dye aggregates on PNA templates. J Am Chem Soc, 121:2686-2695.
Wilhelmsson L M, Norden B, Mukherjee K, Dulay M T, Zare R N (2002) Genetic screening using the colour change of a PNA-DNA hybrid –binding cyanine dye. Nucleic Acids Res, 30:e3.
Yunginger J, Sweeney K, Sturner W, Giannandrea L, Teigland J, Bray M, Benson P, York J, Biedrzycki L, Squillance D, Helm R (1988) Fatal food-induced anaphylaxis. J Am Med Assoc, 260:1450-1452.
Zuker M (2003) Mfold web server for nucleic acid folding and hybridization prediction. Nucleic Acids Res, 31:3406-3415.

Chapter 7
Light up probes in real-time PCR for peanut detection
The possible application of a Peptide Nucleic Acid (PNA) based probe, a so called Light Up probe,
in real-time PCR detection of peanut has been investigated. The Light-up probe is a linear probe in
which a PNA probe is conjugated the thiazole orange (TO) as fluorophore,.
Preliminary results showed that this innovative method is capable to detect peanut DNA with
sensitivity and efficiency that are comparable to that of current real-time PCR detection systems.
Although further studies are still needed to assess and improve the specificity of the new method, it
might have the potential to develop into a future methodology that can be employed to detect traces
of peanut in food.
Elena Scaravelli, Alessandro Tonelli, Tullia Tedeschi, Andrea Germini, Roberto Corradini,
Arjon J. van Hengel and Rosangela Marchelli

Chapter 7
128
Introduction
The availability of accurate and sensitive detection methods for hidden allergens in food products is
crucial for either the food industry to control and ensure the correct labelling of their products and
for government regulatory agencies in order to enforce legislation (European Parliament and
Council, 2000; 2007). Peanut is included in the list of food allergens that have to be declared on the
labels and it is known as one of the most allergenic (Bock and Atkins, 1990; Sampson et al., 1992);
even the intake of minimal doses (e.g. 200 µg) can be sufficient to trigger an allergic reaction (Tariq
et al., 1996; Wensing et al., 2002).
The development of any detection method relies on the identification of a target analyte which can
be the allergenic protein or the DNA sequence coding for a specific protein. DNA detection
methods are based on the Polymerase Chain Reaction. They are currently used for the detection of
microbial pathogens (Malorny et al., 2003), genetically modified organisms in food products
(Anklam et al., 2002; Holst-Jensen et al., 2003; Germini et al., 2004; Germini et al., 2005 ) and
more recently also for food allergens in foodstuffs (Poms and Anklam, 2004).
PCR is an enzymatic reaction that consists in 25-45 cycles which allow the amplification of a DNA
target sequence up to a level that can be revealed. Real-time PCR is based on fluorescence
detection: the presence of the amplified product is revealed by detection of a fluorescent signal
which is monitored while the amplification occurs. The use of fluorescent dyes allows the
amplification and detection steps of the PCR to be combined but, according to the different dye
chemistries applied, real-time PCR can be grouped in two main categories: unspecific and specific
detection.
When the detection is unspecific, dyes intercalating any double stranded DNA (dsDNA) are
employed. The first dye that established the proof-of-principle was the ethidium bromide (EtBr)
(Higuchi et al., 1992, 1993). EtBr was added to the PCR reaction with continuous monitoring
during the cycles; a plot of the increased fluorescence caused by EtBr binding the newly
synthesised DNA against PCR cycles allowed calculating the amount of starting material. Several
dyes are now commercially available and the most commonly used are SYBR Green ® I (Morrison
et al., 1998; Karlsen et al., 1995) or SYBR Gold ®. Although these DNA-binding dyes are relatively
inexpensive and can be incorporated into already optimized protocols, also significant
disadvantages may be involved. The random binding of the dyes to any dsDNA results in non
specific fluorescence and the specificity of the reaction, as with conventional PCR, is entirely
determined by its primers.

Light up probes in real-time PCR…
129
On the contrary, the template specific analysis is based on the use of a fluorescent probe specifically
designed per each PCR assay. The fluorescent signal is only generated if the amplicon-specific
probe hybridizes to its complementary target.
The advantage of fluorogenic probes, over DNA binding dyes, is that specific hybridization
between probe and target is required to generate the fluorescent signal. This means that non-specific
amplifications due to mis-priming or primer-dimer artifacts do not generate signals. Another
advantage of fluorogenic probes is the possibility to label each probe with a different,
distinguishable reporter dye which allows the amplification and individual detection of distinct
sequences in a single PCR reaction. The disadvantage of fluorogenic probes is that different probes
must be synthesized to detect different sequences.
As listed in Table 1, probes can be grouped in linear and structured molecules (Bustin and Nolan,
2004). Linear probes have the advantage of a better binding efficiency because the absence of any
secondary structured avoids competition with intramolecular hybridization. On the other hand,
thermodynamic studies showed that structured probes result in a higher hybridization specificity
and better recognition of mismatches (Bonnet et al., 1999).
Type Probe Fluorophore /
Quencher References
ResonSense® and Angler® F & Q Lee et al., 2002
Hybeacons ™ F French et al., 2001, 2002
Light up probes F Svanvik et al., 2000a, 2000b, 2001; Isacsson et
al., 2000; Wolffs et al., 2001
Hydrolysis (TaqMan®) Probes F & Q Holland et al., 1991; Lee et al., 1993 ; Livak et
al., 1995
Lanthanide Probes F Nurmi et al., 2000, 2002
Hybridization Probes F & Q Pals et al., 2001; Aslanidis 1999
Eclipse™ F & Q Afonina et al.,2002
Linear
Probes
Strand-displacement probes
(Yin-Yang probes) F & Q Li et al., 2002; Shengqi et al., 2002
Molecular Beacons F & Q Mhlanga et al., 2001; Vet et al., 2005; Kuhn et
al., 2001, 2002; Totsingan et al., in press)
Scorpions™ F & Q Whitcombe et al., 1999; Solinas et al., 2001;
Thelwell et al., 2000
Structured
Probes
Cyclons™ F & Q Jiang et al., 1999; Kandimalla 2000
Table 1: list of linear and structured probes used in real-time PCR. The mechanism of fluorescence is distinguished in presence of only one fluorophore (F) or one fluorophore and one quencher (F & Q) combined to get the signal emission.

Chapter 7
130
Another fluorogenic probe characteristic is the mechanism of fluorescence generation: it is different
among the different types of probes. They all are labelled with at least one fluorophore but in some
cases they are equipped with a fluorescence donor-acceptor pair of dyes. Therefore the fluorescence
detection technique could be based on the quenching of fluorescence by energy transfer from one
fluorophore to another fluorophore or to a non-fluorescent molecule (Marras, 2006). This particular
probe design is widely used for the TaqMan® probes: an acceptor dye, known as quencher, receives
energy from the donor fluorophore and dissipates it by fluorescence resonance energy transfer
(FRET). If the acceptor is a fluorophore, the transferred energy is emitted as fluorescence,
characteristic for the acceptor fluorophore, whereas when the acceptor is not fluorescent, the
absorbed energy is lost as heat without any fluorescent emission.
In this study the possible application of a light up probe in real-time PCR for peanut allergens
detection has been investigated. The Light-up probe is a linear probe composed of only one
fluorophore, the thiazole orange (TO), conjugated to a PNA sequence (Figure 1).
TO is a derivative of an asymmetric cyanine dye; in this type of dye, the two aromatic systems can
rotate around the interconnecting methylene bond. The linker in the light up probe is flexible in
order to allow the dye to interact with the target nucleic acids hybridized to the PNA sequence. Due
to this interaction, the aromatic moieties becomes fixed in a co-planar geometry and the dye gives
rise to a strong fluorescent signal which can be readily detected (Svanvik et al., 2000a, 2000b).
Figure 1: Structure of a light up probe
PNA sequence
linker
Tiazole OrangePNA sequence
linker
Tiazole Orange

Light up probes in real-time PCR…
131
Materials and Methods
Light up probe (LUPeanut)
PNA H-CTC TTC TTG TCT-NH2 was synthesized by an automated Fmoc-SPPS protocol (Solid
Phase Peptide Synthesis) on a ABI 433A synthesizer, following the procedures provided by the
company. The thiazole orange (TO) derivative (6-TO exanoic acid) was introduced by manual solid
phase synthesis, by using a DIC (Diisopropylcarbodiimide) / DhBTOH (3-Hydroxy-1,2,3-
benzotriazin-4(3H)-one) coupling protocol. The free PNA was cleaved from the resin by using a 9:1
mixture of TFA/m-cresol and precipitated by Et2O. The residue was dissolved in water and purified
by using a water pre-equilibrated Sep-pak® C18 cartridge. Coloured eluates obtained upon elution
of H2O/MeCN = 70/30 were collected and analyzed by HPLC and ESI-MS spectrometry. ESI calcd
m/z: 1189 (MH33+), 892 (MH4
4+), 713.8 (MH55+), 595 (MH6
6+), found m/z: 1189, 892, 714, 595.
Molar absorptivity of the probe at 260 nm was estimated as the sum of the contributions from PNA
and TO (Nygren et al., 1998): ε260 = 11,7001G + 268004C + 602007T + ε260TO 7100 = 105 800 M-1
cm-1. The concentration of the probe was determined by absorption measurements at room
temperature (Ultraspect pro 3300, Amersham Biosciences, Biochrom Ltd, England).
The thermal melting temperature (Tm) of the probe–target complex in the PCR buffer (Qiagen
GmbH, Germany) was estimated by determining the Tm for a probe–oligonucleotide complex (2
µM), by A260 measurements. The oligonucleotide (Sigma Genosys) had the sequence 5’AGA CAA
GAA GAG 3’. The measurement of the melting temperature was carried out on the LS55
Luminescence Spectrometer (Perkin Elmer, USA).
Real-time PCR conditions with light up probe:
The amplicon sequence of PCR B (Scaravelli et al., in press), designed on the DNA sequence
coding for the peanut allergen Ara h 3, was used for real-time amplification with the specifically
designed light up probe LUPeanut.
To optimise the performance of the PCR reactions with the light up probe, the following parameters
were tested: PCR mastermixes (TaqMan® Universal PCR Master Mix, Applied Biosystems, UK;
HotStartTaq Master Mix Kit, Qiagen GmbH, Germany), LUPpeanut concentrations (0.1, 0.25, 0.5,
1 µM) and thermal cycle (Table 2).
The optimal assay was set as follows: primer concentration of 0.9 µM, probe concentration 1 µM,
around 100 ng of template DNA, final volume of 25 µl, PCR mastermix HotStartTaq Master Mix

Chapter 7
132
Kit (Qiagen GmbH, Germany) and with the thermal cycling 2 as listed in Table 2. In each thermal
cycle, a final step for analysing the melting curve with fluorescence monitoring was included
(dissociation curve), with a temperature ramp spanning from 35 to 95 °C and a ramp rate of 2 % as
suggested by the instrument manufacturer. Signal acquisition started at 35 °C and continued during
the entire step.
In order to test the probe specificity, two non-peanut specific DNA sequences were amplified by
adding their own specific DNA and the peanut specific light up probe. The two pairs of primers
used were: AlfaFor 5'-AGAAACGGACTTGAGGAGACA-3' and AlfaRev 5'-
AGCAGCAAGTCCAAGCCA-3'; DeltaFor 5'-TGTGAGCAACT- GAATGAGCTTAA-3' and
DeltaRev 5'-AAACCCACAAGTCCTAGGCAA-3'.
All reactions were run on the ABI Prism® 7900HT Sequence Detection System (Applied
Biosystems, UK). Fluorescence was monitored at the end of the annealing phase using 495 nm
excitation and 518 nm emission (the 6-FAM channel of the instrument).
In each analysis and for each parameter tested, a positive (adding peanut DNA), negative (adding
non peanut DNA) and non template (adding water) control were always included. All results were
analyzed by setting the automatic baseline of the instrument and 0.30 as threshold (no passive
reference).
The final Ct values used for quantitative calculation refer to the mean value of three replicates of
amplification.
Real-time PCR using Taqman probes
The set of primers and probe (TaqMan®) for the amplicon sequence PCR B (Scaravelli et al., in
press), designed on the DNA sequence coding for the peanut allergen Ara h 3, was used for real-
time amplification according to the optimised condition previously described. In each 96 wells
plate, a positive (with peanut DNA) and a non template (adding water instead of DNA) control were
always included in the analysis.
Table 2: list of thermal cycles tested. In bold the steps of data acquisition
Thermal cycle DNA Denaturation 40 cycles Melting curve
DNA denaturation Primers annealing Sequence elongation
1 95C/10' 95C/15'' 55C/1' 72C/30'' 95C/15'' 35C/1' 95C/15''
2 95C/10' 95C/15'' 60C/1' 72C/30'' 95C/15'' 35C/1' 95C/15''
3 95C/10' 95C/15'' 60C/30'' 72C/30'' 95C/15'' 35C/1' 95C/15''
4 95C/10' 95C/15'' 65C/45'' 72C/30'' 95C/15'' 35C/1' 95C/15''
5 95C/10' 95C/15'' 65C/45'' 72C/30'' 95C/15'' 35C/1' 95C/15''
6 95C/10' 95C/15'' 75C/1' + 60C/15'' 72C/30'' 95C/15'' 35C/1' 95C/15''

Light up probes in real-time PCR…
133
Results and discussion
Many probes (Table 1) have been studied in order to improve the PCR performances, especially
when traces of a certain DNA target need to be detected. Some commercial (Tepnel, UK; Congen /
R-Biopharm, Germany) or published methods (Hird et al., 2003; Stephan and Vieths, 2004,
Scaravelli et al., in press) for peanut allergens DNA detection are already available. Most of them
are based on conventional PCR coupled with gel electrophoresis or, in the case of real-time PCR,
they mainly apply the TaqMan® chemistry. With the aim of achieving a better sensitivity in an
already developed real-time PCR protocol, a study on the application of PNA as fluorescence-
monitoring systems for DNA amplification is reported in this work. Light up probes combine the
advantages of PNA probes with the fluorescence properties of TO: hybridization to DNA with high
sequence specificity and with up to 50-fold increase in fluorescence (Svanvik et al., 2000a).
Moreover these hybridization probes are provided with a single reporter dye (TO), which is
sufficient to monitor the increase in fluorescence intensity, instead of measuring the change in the
fluorescence intensity distribution necessary when using energy transfer probes.
A 12 mer light up probe targeting a 105 bp fragment of the Ara h 3 gene amplified by the primers of
the PCR B assay (Scaravelli et al., in press), has been specifically designed and successfully
synthesized as confirmed by the ESI-MS spectrum (Figure 2).
Thanks to the particular hybridization properties of PNA, the interaction of light-up probes with
target nucleic acid depends on the probe sequence. In this case a pirimidine reach sequence has
been chosen because it could form a PNA2–DNA triplex (Egholm et al., 1992; Kim et al., 1993).
Figure 2: Spectrum from ESI-MS analysis of the LUPeanut (MW calculated = 3564.2; MW found =
3565, M+H+)

Chapter 7
134
Homopiridine sequences are known to be particularly stable and exhibiting very low fluorescence
as free probe (Svanvik et al., 2000a).
When designing the light up probe, the sequence specificity was one of the main requirements to
fulfil. It was difficult to predict the correct Tm because many factors could influence the theoretical
calculation such as the possible formation of triplex (PNA2-DNA) with a pirimidine rich sequence,
and an increased stability due to the interaction of TO linked to the PNA probe with the DNA
strand, as previously shown. The theorical Tm of the LUPeanut/DNA duplex without TO was
calculated at 48 °C but the measured Tm was 58 °C.
According to recent studies, the light up probe should bind the DNA at the annealing step during the
PCR reaction and dissociate during the extension phase without interfering with the reaction itself
(Kubista et al., 2001).
In order to test the influence of LUPeanut on the PCR reaction, the amplicon sequence PCR B was
amplified in presence of different concentrations of light up probe (0.1, 0.25, 0.5, 1µM) and the
fluorescence enhancement during the annealing step (thermal cycle 2 from Table 2) was monitored.
Figure 3 shows the amplification plot obtained by this amplification series. Thanks to the probe
design, LUPeanut did not inhibit DNA amplification, as might have been expected from PCR
clamping studies. But, despite previous findings (Kubista et al., 2001), the probe concentration
seems to affect PCR efficiency. Probe concentrations equal or lower than 0.25 µM did not produce
any fluorescent signal and the best result was obtained with the highest probe concentration (1 µM).
The fluorescence signal was obtained by utilizing the HotStartTaq Master Mix Kit (Qiagen GmbH,
Germany); the two mastermix reagents tested seemed to influence the PCR reaction in the presence
Figure 3: amplification plot obtained with different LUPeanut concentration (0.1, 0.25, 0.5, 1 µM)

Light up probes in real-time PCR…
135
of the light up probe. The agarose gel (data not shown), confirmed an intense amplification lane at
105bp, only when using mastermix from Qiagen (Qiagen GmbH, Germany); on the contrary the
mastermix from Applied Biosystem (Applied Biosystems, UK), normally used in the optimized
condition of the PCR B assay, did not allow an efficient amplification. A possible explanation could
be the different efficiency of the two Taq Polymerases activity in presence of a PNA probe in
solution or the different components of the PCR buffers.
In order to check the specificity and the free probe fluorescence during the amplification process,
the negative control and the non template control (NTC) were also tested for each probe
concentration. No fluorescence signal resulted from both PCR reaction tested: in the presence of the
specific PCR B pair of primers and a non peanut DNA extract (negative control), no aspecific
amplified product was detected by the LUPeanut probe; moreover no fluorescence enhancement
was detected when water was added to the mastermix instead of a DNA extract (NTC). These
results highlighted the absence of primer-dimer artifacts, as also confirmed by gel electrophoresis,
the specificity of the couple of primers of the PCR B assay and the ability of the probe not to give a
high background if dsDNA is not synthesised during the PCR process.
Since the results obtained were comparable to the PCR B assay which is based on TaqMan®
chemistry, the sensitivity of the new light up probe based assay has been tested by amplifying
peanut DNA dilutions ranging from 1 pg to 100 ng. The Cycles Threshold (Ct: the cycle at which
the fluorescence signal is higher than the background) collected were used to generate a linear
curve, by plotting the Ct values against the logarithm of the amount of DNA (Figure 4).
The detection limit of the light-up probe was 10 pg DNA per reaction tube when three independent
PCR reactions were carried out. According to our previous findings on the sensitivity of the PCR B
assay using its specific TaqMan probe, PCR B can detect up to 2.5 pg of peanut DNA, which
corresponds to less than one peanut genome equivalent (Scaravelli et al., in press). The fluorescence
20
24
28
32
36
40
-3 -2 -1 0 1 2 3
log (ng DNA)
Ct
va
lues
Figure 4: linear correlation obtained by plotting the Ct values against the logarithm of the DNA amount in the PCR
reaction. Peanut DNA dilutions (0.001, 0.01, 0.1, 1, 10, 100 ng) were used for the PCR reactions.

Chapter 7
136
efficiency of the light up probe in the present PCR condition allowed the detection of three peanut
genome equivalent which is a value comparable to the already optimized method.
Studies in progress
The specificity of the LUPeanut method was cross checked also by amplifying two non peanut
specific amplicons, as described in the Material and Methods section, in presence of the light up
peanut specific probe. The amplification plot showed a fluorescence enhancement also when the
sequences amplified were not the PCR B amplicon. From the fluorescent melting curve
(dissociation curve), the Tm of the positive and false-positive samples were similar (Tm = 80°C)
which could be explained by the high stability of the hybrids formed by the LUPeanut with DNA
synthesised during the PCR process.
The first critical step in achieving high probe specificity is represented by the probe design. In this
case the selection of the specific 12 mer sequence was carried out avoiding any complementarity
with all the vegetable sequences present in the available database (http://www.ncbi.nlm.nih.gov/).
Another critical step, that has to be considered when aiming at the specificity from both primers and
probe, is the thermal cycle and the point of signal acquisition. Different conditions and point of data
acquisition during the thermal cycle were tested as listed in Table 2 (Material and Methods section)
in order to destabilize and discriminate the non-fully complementary sequences. None of the
parameters tested could significantly reduce the fluorescence signal coming from the false-positive
samples. A possible explanation could be that the linker is too long and could also allow unspecific
interactions of TO with other dsDNA sequences, without hybridization of the PNA sequence giving
rise to a fluorescence detectable signal. Another reason for aspecificity would be the dependence of
the fluorescence response from the concentration of the light up probe, which has been shown to
decrease dramatically at a low (0.1 µM) concentration of the probe. Other experiments carried out
in solution and analysed in a normal spectrofluorimeter showed that an excess of probe led to
aspecific interactions with dsDNA (data not shown).This means that the concentration range in
which the probe can still discriminate different dsDNA sequences has to be investigateed in detail.
Moreover, from experiments with complementary and non-complementary oligonucleotides, there
was no evidence for the formation a triplex since no hysteresis was observed (data not shown).
Another problem is the long term stability of the probe. The purified product needs to be stocked
dried and redissolved in small aliquots when required to be used.

Light up probes in real-time PCR…
137
Conclusions
The preliminary results obtained indicate that sensitivity and efficiency comparable to that of
current real-time detection systems can be obtained without extensive optimization. However, a
deeper investigation on the aspecific hybridization of the PNA sequence or indiscriminate binding
of the TO to dsDNA is necessary for the critical evaluation of LUPeanut assay effectiveness to be
compared to other probe systems (e.g. TaqMan®).
References
Afonina I A, Reed M W, Lusby E, Shishkina I G, Belousov Y S (2002) Minor groove binder-conjugated DNA probes for quantitative DNA detection by hybridization-triggered fluorescence. Biotechniques, 32: 940-949.
Anklam E, Gadani F, Heinze P, Pijnenburg H, Van Den Eede G (2002) Analytical methods for detection and determination of genetically modified organisms in agricultural crops and plant-derived food products. Eur Food Res Technol, 214:3.
Aslanidis C, Nauck M, Schmitz G (1999) High Speed prothrombin G->A 20210 and methylenetetrahydrofolate reductase C->T 677 mutation detection using real-time fluorescence PCR and melting curves. Biotechniques, 27:234-238.
Bock S A and Atkins F M (1990) Patterns of food hypersensitivity during sixteen years of double-blind, placebo-controlled food challenges. Pediatrics, 117:561.
Bonnet G, Tyagi S, Libchaber A, Kramer F R (1999) Thermodinamic basis of the enhanced specificy of structured DNA probes. Proc Natl Acad Sci USA, 96:6171-6176.
Bustin S A and Nolan T (2004) Chemistries. In: An A-Z manual of quantitative PCR, IUL Press, La Jolla, Ca USA. pp 215-278.
Congen / R-Biopharm, SureFood® Allergen Peanut real-time PCR Kit (Congen / R-Biopharm, Germany).
Egholm M, Nielsen P, Buchardt O, Berg R H (1992) Recognition of guanine and adenine in DNA by cytosine and thymine containing peptide nucleic acids (PNA). J. Am. Chem. Soc., 114:9677–9678.
European Parliament and Council (2000) Directive 2000/13/EC of 20 March 2000 on the approximation of the laws of the Member States relating to the labelling, presentation and advertising of foodstuffs. Official J Europ Commun, L109, 29e42.
European Parliament and Council (2007) Directive 2007/68/EC of 27 November 2007 amending Annex IIIa to directive 2000/13/EC as regards certain food ingredients. Official J Europ Communun, L310, 11-14.
French D J, Archard C L, Brown T, McDowell D G (2001) HyBeacon probes: a new tool for DNA sequence detection and allele discrimination. Mol Cell Probes, 15:363-374.
French D J, Archard C L, Brown T, McDowell D G (2002) Ultra-rapid DNA analysis using HyBeacons™ probes and direct amplification from saliva. Mol Cell Probes, 16:319-326.
Germini A, Rossi S, Zanetti A, Corradini R, Fogher C, Marchelli R (2005) Development of a Peptide Nucleic Acid Array Platform for the Detection of Genetically Modified Organisms in Food. J Agr Food Chem, 53(10):3958-3962.
Germini A, Zanetti A, Salati C, Rossi S, Forre C, Schmid S, Fogher C, Marchelli R (2004) Development of a seven-target multiplex PCR for the simultaneous detection of transgenic soybean and maize in feeds and foods. J Agr Food Chem, 52(11):3275-3280.
Higuchi R, Dollinger G, Walsh P S, Griffith R (1992) Simultaneous amplification and detection of specific DNA sequences. Biotechnology (NY), 10:413-417.

Chapter 7
138
Higuchi R, Fockler C, Dollinger G, Watson R (1993) PCR analysis: Real-Time monitoring of DNA amplification reactions. Biotechnology (NY), 11:1026-1030.
Hird H, Lloyd J, Goodier R, Brown J, Reece P(2003) Detection of peanut using real-time polymerase chain reaction. Eur Food Res Technol, 217:265–268.
Holland P M, Abramson R D, Watson R, Gelfand D H (1991) Detection of specific polymerase chain reaction product by utilizing the 5' to 3' exonuclease activity of Thermus aquaticus DNA polymerase. Proceedings of the National Academy of Sciences USA, 88:7276–7280.
Holst-Jensen A, Ronning S B, Lovseth A, Berdal K G (2003) PCR technology for screening and quantification of genetically modified organisms (GMOs). Anal Bioanal Chem, 375:985.
Isacsson J, Cao H, Ohlsson L, Nordgren S, Svanvik N, Westman G, Kubista M, Sjo¨back R, Sehlstedt U (2000) Rapid and specific detection of PCR products using light-up probes. Mol Cell Probes, 14:321-328.
Jiang Z, Kandimalla E R, Zhao Q, Shen L Z, DeLuca A, Normano N, Ruskowski M, Agrawal S (1999) Pseudo-cyclic oligonucleotides: in vitro and in vivo properties. Bioorg Med Chem, 7:2727- 2735.
Kandamilla E R, Agrawal S (2000) “Cyclons” as hybridization-based fluorescent primers-probes: Synthesis, properties and application in real-time PCR. Bioorg Med Chem, 8: 1911-1916.
Karlsen F, Steen H B, Nesland J M (1995) SYBR Green I DNA staining increases the detection sensitivity of viruses by polymerase chain reaction. J Virol Methods, 55:153-156.
Kim S K, Nielsen P E, Egholm M, Buchardt O, Berg R H, Norde´n, B (1993) Right-handed triplex formed between peptide nucleic-acid PNA-T(8) and poly(dA) shown by linear and circular-dichroism spectroscopy. J. Am. Chem. Soc., 115:6477- 6481.
Kubista M, Sta˚hlberg A, Bar T (2001) Light-up probe based real-time Q-PCR. In: Raghavachari, R., Tan, W. (Eds.), Genomics and Proteomics Technologies. Proceedings of SPIE, vol. 4264. International Society of Optical Engineering, Bellingham, WA, pp. 53–58.
Kuhn H, Demidov V V, Coul J M, Fiandaca M J, Gildea B D, Frank-Kamenetskii M D (2002) Hybridization of DNA and PNA Molecular Beacons to Single-Stranded and Double-Stranded DNA Targets. J Am Chem Soc, vol 124, n.6.
Kuhn H, Demidov V V, Gildea B D, Fiandaca M J, Coul J M, Frank-Kamenetskii M D (2001) PNA Beacons for Duplex DNA. Antisense Nucleic A, 11: 265-270.
Lee L G, Connell C R, Bloch W (1993) Allelic discrimination by nick-translation PCR with fluorogenic probes. Nucleic Acids Res, 21:3761–3766.
Lee M A, Siddle A L, Page R H (2002) ResonSense® : simple linear fluorescent probes for quantitative homogeneous rapid polymerase chain reaction. Analitica Chimica Acta, 457:61-70.
Li Q, Luan G, Guo Q, Liang J (2002) A new class of homogeneous nucleic acid probes based on specific displacement hybridization. Nucleic Acids Res, 30:E5.
Livak K J, Flood S J A, Marmaro J, Giusti W, Deetz K (1995) Oligonucleotides with fluorescent dyes at opposite ends provide a quenched probe system useful for detecting PCR product and nucleic acid hybridization. PCR Methods and Applications, 4:357–362.
Malorny B, Tassios P T, Radstrom P, Cook N, Wagner M, Hoorfar J (2003) Standardization of diagnostic PCR for the detection of foodborne pathogens. Int J Food Microbiol, 83:39.
Marras S A E (2006) Selection of Fluorophore and Quencher Pairs for Fluorescent Nucleic Acid Hybridization Probes. Methods in Molecular Biology: Fluorescent Energy Transfer Nucleic Acid Probes: Designs and Protocols. Edited by: V.V. Didenko © Humana Press Inc., Totowa, NJ.
Mhlanga M M, Malmberg L (2001) Using molecular beacons to detect single-nucleotide polymorphisms with real-time PCR. Methods, 25(4):463-71.
Morrison T B, Weis J J, Wittwer C T (1998) Quantification of low-copy transcripts by continuous SYBR Green I monitoring during amplification. Biotechniques, 24:954-958, 960, 962.
Nurmi J, Wikman T, Karp M, Lovgren T (2002) High-performance real-time quantitative RT-PCR using lanthanide probes and dual-temperature hybridization assay. Anal Chem, 74:3525-3532.
Nurmi J, Ylikoski A, Soukka T, Karp M, Lovgren T (2000) A new label technology for the detection of specific polymerase chain reaction products in a closed tube. Nucleic Acids Res, 28:E28.

Light up probes in real-time PCR…
139
Nygren J, Svanvik N, Kubista M (1998) The interactions between the fluorescent dye thiazole orange and DNA. Biopolymers, 46:39-51.
Pals G, Young C, Mao H S, Worsham M J (2001) Detection of a single base substitution in a single cell using the LightCycler. J Biochem Biophys Methods, 47:121-129.
Poms R E and Anklam E (2004) Polymerase chain reaction techniques for food allergen detection. J AOAC Int, 87:1391.
Sampson H A, Mendelson L, Rosen J P (1992) Fatal and near-fatal anaphylactic reactions to food in children and adolescents. New Engl J Med, 327:380.
Shengqi W, Xiaohong W, Suhong C, Wei G (2002) A new fluorescent quantitative polymerase chain reaction technique. Anal Biochem, 309: 206–211.
Solinas A, Brown L J, McKeen C, Mellor J M, Nicol J, Thelwell N, Brown T (2001) Duplex Scorpion primers in SNP analysis and FRET applications. Nucleic Acids Res, 29(20):E96.
Stephan O, Vieths S (2004) Development of a real-time PCR and a sandwich ELISA for detection of potentially allergenic trace amounts of peanut (Arachis hypogaea) in processed foods. J Agric Food Chem, 52:3754-3760.
Svanvik N, Nygren J, Westman G, Kubista M (2001) Free-probe fluorescence of light-up probes. J Am Chem Soc, 123:803–809.
Svanvik N, Westman G, Wang D, Kubista M, (2000a) Light-up probes: thiazole orange-conjugated peptide nucleic acid for detection of target nucleic acid in homogeneous solution. Anal Biochem, 281:26–35.
Svanvik N., Sta˚hlberg A., Sehlstedt U., Sjo¨back R., Kubista M., (2000b) Detection of PCR products in real-time using light-up probes. Anal Biochem, 287:179–182.
Tariq S M, Stevens M, Matthews S, Ridout S, Twiselton R and Hide D W (1996) Cohort study of peanut and nut sensitisation by age of 4 years. B M J, 313: 514.
Tepnel, BioKits Allergen DNA Selection Module PCR (Tepnel, UK).
Thelwell N, Millington S, Solinas A, Booth J, Brown T (2000) Mode of action and application of Scorpions primers mutation detection. Nucleic Acid Res, 28: 3752-3761.
Totsingan F, Rossi S, Corradini R, Tedeschi T, Sforza S, Juris A, Scaravelli E, Marchelli R Label-Free Selective DNA Detection with High Mismatch Recogniton by PNA Beacons and Ion Exchange HPLC. Org Biomol Chem, in press.
Vet J A, Marras S A (2005) Design and optimization of molecular beacon real-time polymerase chain reaction assays. Methods Mol Biol, 288:273-90.
Wensing M, Penninks A H, Hefle S L, Koppelman S J, Bruijnzeel-Koomen A, Knulst A C (2002) The distribution of individual threshold doses eliciting allergic reactions in a population with peanut allergy. J Allergy Clin Immunol, 110:915.
Whitcombe D, Theaker J, Guy S P, Brown T, Little S (1999) Detection of PCR products using self-probing amplicons and fluorescence. Nat Biotechnolgy, 17:804-807.
Wolffs P, Knutsson R, Sjöback R, Rådström P (2001) PNA-Based Light-Up Probes for Real-Time Detection of Sequence- Specific PCR Products. BioTechniques, 31:766-771.


141
Concluding remarks
A major concern in the protection of allergic consumers is the availability of detection methods that
are able to identify the presence of trace amounts of allergenic ingredients in food products. In this
thesis multiple DNA based methods for the detection of peanut, which is considered one of the
major food allergens, have been developed. Three real-time PCR methods have been developed and
optimized all targeting a specific region of the peanut allergen Ara h 3. Cookie and chocolate model
matrices were developed and used as "standard test materials". This allowed the application of the
method for semi-quantitative purposes in a range between 10 and 10000 mg kg-1. The sensitivity
that can be achieved with the developed real-time PCR methods was found be in line with clinical
thresholds. A comparative study employing real-time PCR and ELISA revealed a similar
performance for both detection methods. Furthermore, ELISA and real-time PCR were found to be
affected in a similar manner by heat treatments undergone by the food samples. Analysis of
hundreds of market samples stressed that the availability of multiple and diverse detection
methodologies is a key issue in food allergen detection since each technique can be differently
affected by factors like the food matrix, the allergen targeted and the industrial processes employed.
A detailed knowledge of the performance as well as the advantages and disadvantages of each
method contributes in the assessment of the reliability of protein and DNA based methods and
supports the selection of the most suitable method.
The need of multiple and diverse detection methods constituted the basis for further studies
employing innovative techniques. The development of a PNA array device allowed the
simultaneous detection of DNA from hazelnut and peanut in food products. Moreover, the
unconventional application of circular dichroism offered another sensitive method that can be used
for the detection of peanut allergens in complex food matrices. New studies on the use of Light Up
Probes in real-time PCR were initiated and might develop into future methodologies that can be
employed to detect hidden allergens.
All the investigated techniques and their further applications contribute to the protection of allergic
consumer and provide tools that are essential to reduce the risk of the accidental ingestion of hidden
allergens.


143
Annex I

Annex I Cookies
ELISA DISPSTICK RT PCR
sample no 0.7-10ppm 10-20 ppm >20 ppm pos / neg 0.7-10ppm 10-20 ppm >20 ppm 0.7-10ppm 10-20 ppm >20 ppm QUALIT PEA NUT PEA NUT PEA NUTGermany 20 0.9 P X 7.5
33 7.9 P X x40 1.0 P X
43 >20ppm P P 568.0 X X X X x x
44 3.4 P P POS X X X x46 20.23 P P 81.0 X X X X x x 30
Belgium 184 2.5 P 3.6 X X x x 12231 > 20ppm P 37.0 X X 5.6
232 1.9 P X
244 3.7 P P 4.0 X X X X x x256 > 20ppm P P 368.0 X X X X x x 15
The Netherlands 318 >20ppm P P POS X X X x x
367 2.2 P 3.0 X X x x391 1.2 P x
Austria
Czech Republic 319 >20ppm P P 20.8 X X X X x ?
320 >20ppm P P 86.0 X X X X x ?325 >20ppm P P 86.4 X X X X x 34
329 2.0 P P x 30
331 >20ppm P P 12.3 X X X x 30333 2.6 P P 2.6 X X X X ?
339 6.7 P POS X 4.6
343 > 20ppm P P 437.0 X X X X x x 7.5344 > 20ppm P P 7677.0 X X X X x 7.5
345 > 20ppm P P 222.0 X X X X 20347 10.0 P P 15.0 X X X X x x 14
349 > 20ppm P P 254.0 X X X X ?
352 4.3 P 4.4 X X ?353 1.8 P POS X
354 2.3 P P POS X X X x 3.9355 > 20ppm P P 26.5 X X X X 65
358 > 20ppm P 24.6 X X x ?
359 > 20ppm P P 164.0 X X X X x ?360 > 20ppm P P 11.7 X X X x 28
364 > 20ppm P P 392.0 X X X X x x 48.5
Poland 425 1.1 P X
435 > 20ppm P P 5.8 X X X
Hungary 442 >20ppm P P POS X X X x x 5
Slovakia 505 > 20ppm P P 41.0 X X X X ?506 11.0 P P 18.2 X X X 20
507 > 20ppm P P 10966.0 X X X X 20508 > 20ppm P P 320.6 X X X X 24
509 > 20ppm P P 1231.0 X X X X 14
510 > 20ppm P P 51.4 X X X X 7511 3.2 P P 5.8 X X X X 14
513 2.2 P X ?514 2.3 P 3.5 X X
517 1.2 P 8.8 X 25
518 > 20ppm P P 86.6 X X X X 24520 > 20ppm P P 629.0 X X X X 1
523 1.4 P 5.2 X
524 > 20ppm P P 406.0 X X X X 7.522525 > 20ppm P P 22.3 X X X X ?
531 3.0 P POS X ?533 9.5 P P 13.6 X X X x ?
537 3.3 P P 3.6 X X X X 7.8
538 4.5 P P 2.8 X X X X ?540 1.3 P P 7.3 X X X 19
542 5.2 P POS X
Bulgaria 527 > 20ppm P 4.2 X x 32
528 > 20ppm P 5.3 X 3
529 > 20ppm P P 76.0 X X X X ?
ELISA- RT PCR-DIPSTICK ingredients "may contain" cocoa /choco
content %
RT PCR-ELISART PCR-DIPSTICK
present in factory

Annex 1 Cookies
ELISA DISPSTICK RT PCR
sample no 0.7-10ppm 10-20 ppm >20 ppm pos / neg 0.7-10ppm 10-20 ppm >20 ppm 0.7-10ppm 10-20 ppm >20 ppm QUALIT PEA NUT PEA NUT PEA NUTGermany 10 0.4 P X x ?
29 0.3 P X
54 0.1 P X
57 0.5 P POS X x
61 0.3 P X
8 0.0 POS
Belgium 198 0.0 P X 11
203 0.1 P X x 6
204 -0.1 P X 23
224 0.2 P X x
251 -0.2 P X 48
254 -0.1 P X 48
The Netherlands 380 -0.3 P X x 39
381 -0.3 P X x 47whitechoc.
386 -0.3 P X x 15
398 -0.2 P X x x 30
374 0.5 X X x x
Austria 176 0.2 P X171 -0.2 POS
Czech Republic 361 -0.2 P X 28
Poland 434 -0.2 P X x 31
Hungary 461 -0.1 P X x
462 0.2 P X x
448 -0.2 X X X x
440 -0.2 X X X
Slovakia 535 0.2 POS
Bulgaria
ELISA- RT PCR-DIPSTICK RT PCR-DIPSTICKRT PCR-ELISA ingredients present in factory cocoa /choco
content %
"may contain"

Annex I Cookies
ELISA DISPSTICK RT PCR
sample no 0.7-10ppm 10-20 ppm >20 ppm pos / neg 0.7-10ppm 10-20 ppm >20 ppm 0.7-10ppm 10-20 ppm >20 ppm QUALIT PEA NUT PEA NUT PEA NUTGermany 39 0.0 X X X x x 22
Belgium 202 > 20ppm P P 4765 X X X X x
236 0.2 X X X x 13
239 0.2 X X X x 22257 0.2 X X X x x 26
568 X X X x x
The Netherlands
Austria
Czech Republic 322 0.1 X X X x x 15323 0.2 26 X x x 15
332 >20ppm P P 41492 X X X X x 30346 > 20ppm P P 339582 X X X X x x 7.5
351 > 20ppm P P 186351 X X X X x 7
Poland
Hungary 451 -0.3 X X X x x 3.6
452 -0.3 X X X x ?
Slovakia 512 > 20ppm P P 60858 X X X X x 30
526 > 20ppm P P 106087 X X X X x 7.5541 > 20ppm P P 225042 X X X X x 30
Bulgaria
cocoa /choco
content %
present in factoryingredients "may contain"ELISA- RT PCR-DIPSTICK RT PCR-DIPSTICK
RT PCR-ELISA

Annex I Chocolates
ELISA DISPSTICK RT PCR
sample no 0.7-10ppm 10-20 ppm >20 ppm pos / neg 0.7-10ppm 10-20 ppm >20 ppm 0.7-10ppm 10-20 ppm >20 ppm QUALIT PEA NUT PEA NUT PEA NUT
Germany 84 2.6 P P x x 50
86 >20ppm P P 259.0 X X X X x x 30
87 >20ppm P P 37.5 X X X X x x 50
89 >20ppm P P 29.7 X X X X x x 30
90 20.0 P P 11.3 X X X X x x 30
98 20.0 P P 7.1 X X X x x 30
99 7.6 P P x x 50
100 15.0 P P 9.8 X X X x x 30
101 6.4 P P POS X X X x x 60
147 3.0 P P POS X X X x milk
Belgium 122 5.6 P X x 30 choc.
124 0.8 P X x milk/dark 32%
143 2.7 P X x 46
The Netherlands 415 1.5 P POS X x 30
416 2.7 P POS X x 50
420 0.7 P X x 35
Austria
Czech Republic 263 0.7 P POS X x 40
264 > 20ppm P P 11.6 X X X x 40
265 9.5 P P x 40
266 > 20ppm P P POS X X X x 40
267 1.6 P X x 40
268 2.6 P X x 40
Poland 548 > 20ppm P P 18.2 X X X x x 30
549 10.3 P X x x 51
550 > 20ppm P P 118.4 X X X X x x white
555 11.0 P 8.9 X x x 25
556 > 20ppm P POS X x x 77
558 > 20ppm P P 106.0 X X X X milk
559 1.9 P P x x 30
562 1.3 P X x 61
564 1.0 P X x x 64
Hungary 465 >20ppm P P 67.7 X X X X x 28
466 >20ppm P 12.6 X x 52
467 >20ppm P P 601.0 X X X X x 28
468 12.8 P X x 51
469 >20ppm P P 70.5 X X X X 30
470 3.6 P POS X x 30
471 5.8 P 4.8 X X 30
472 >20ppm P 6.8 X x 52
474 >20ppm P P 61.0 X X X X x stracciatella 7%
475 19.5 P P 16.5 X X X X x 25
476 1.0 P POS X x 25
477 8.2 P P 10.4 X X X x 25
481 >20ppm P P 67.7 X X X X x 30
483 6.0 P 12.0 X x 28
Slovakia 485 >20ppm P P 13.5 X X X x 62
485 >20ppm P P 125.2 X X X X x x 29
487 0.8 P X x x 48
488 >20ppm P P 15.2 X X X x x 29
490 >20ppm P 5.5 X x x 35
492 8.2 P POS X x x 28
493 > 20ppm P P 986.3 X X X X x x 28
494 11.9 P P 9.5 X X X x x 28
495 > 20ppm P P 14.7 X X X x x 28
496 > 20ppm P P 917.5 X X X X x x 29
498 > 20ppm P P 4658.3 X X X X
500 > 20ppm P P 84.5 X X X X x 44
501 > 20ppm P P 21.0 X X X X x x 45
503 15.3 P 6.1 X x
566 > 20ppm P P 45.7 X X X X x x
567 > 20ppm P P 1841.2 X X X X x x
Bulgaria 544 > 20ppm P 1.6 X x x 54
545 > 20ppm P P 10682.0 X X X X
Romania 275 3.1 P X x x 30
276 17.3 P P 13.6 X X X X x x 30
277 >20ppm P P 246.2 X X X X x 10
280 >20ppm P P 15.2 X X X 31
281 6.9 P P 4.0 X X X X 31
282 >20ppm P P 4.9 X X X 31
283 8.0 P P POS X X X 31
284 1.0 P 3.4 X X x x 10
290 2.5 P X stracciatella31%
301 11.6 P P 11.8 X X X X x 25.5
302 > 20ppm P P 57.4 X X X X x 25.5
303 > 20ppm P P 53.2 X X X X x 20
305 6.0 P P 8.1 X X X X x white 20%
306 > 20ppm P P 36.5 X X X X x 30
307 > 20ppm P P 47.1 X X X X x 25.5
308 > 20ppm P P 190.2 X X X X x 10
309 > 20ppm P P 113.6 X X X X x 10
310 15.1 P P 6.7 X X X 25
311 > 20ppm P P 106.6 X X X X 25
312 > 20ppm P P 50.1 X X X X 25
313 > 20ppm P P 16.9 X X X x 10
314 > 20ppm P P 23.9 X X X X x 10
315 > 20ppm P P 126.7 X X X X x 10
316 > 20ppm P P 36.0 X X X X x 10
317 > 20ppm P P 45.1 X X X X x 10
RT PCR-ELISART PCR-DIPSTICK
ingredients "may contain"ELISA- RT PCR-DIPSTICK
present in factory cocoa content
%

Annex I Chocolates
ELISA DISPSTICK RT PCR
sample no 0.7-10ppm 10-20 ppm >20 ppm pos / neg 0.7-10ppm 10-20 ppm >20 ppm 0.7-10ppm 10-20 ppm >20 ppm QUALIT PEA NUT PEA NUT PEA NUT
Germany
Belgium
The Netherlands
Austria
Czech Republic
Poland
Hungary 484 0.03 X X X x x 28
Slovakia 489 >20ppm P P 15839.2 X X X x x 28 ?
497 > 20ppm P P 23457.8 X X X x ?
499 > 20ppm P P 29086.9 X X X x x 29 ?
565 > 20ppm P P 30057 X X X x 29 ?
Bulgaria
Romania
RT PCR-DIPSTICKRT PCR-ELISA cocoa content
%
"may contain" present in factoryELISA- RT PCR-DIPSTICK
ingredients

Annex I Chocolates
ELISA DISPSTICK RT PCR
sample no 0.7-10ppm 10-20 ppm >20 ppm pos / neg 0.7-10ppm 10-20 ppm >20 ppm 0.7-10ppm 10-20 ppm >20 ppm QUALIT PEA NUT PEA NUT PEA NUT
Germany 62 0.17 X X X x 60
Belgium 127 -0.16 X X X x x white choc.
The Netherlands 414 -0.01 X X X x x 29 white choc.
408 0.5 X X X x 31
Austria 167 -0.14 X X X 34
Czech Republic 262 -0.04 X X X 30
Poland 563 -0.19 P X x x 28
554 0.6 X X X x x dark choc.?
Hungary 473 0.45 X X X x 30
479 0.6 POS x white choc.
stracciatella 7%
Slovakia
Bulgaria 543 -0.03 X X X x 48.8
Romania 304 0.23 X X X x 25.5
ELISA- RT PCR-DIPSTICK RT PCR-ELISA present in factory
RT PCR-DIPSTICKcocoa content
%
ingredients "may contain"


151
Acknowledgements
I would like to express my gratitude to all those who gave me the possibility to complete this thesis.
I wish to sincerely thank my supervisors Dr. Arjon Van Hengel and Prof. Rosangela Marchelli for
their scientific support and encouragement which helped me in all the time of my research and
writing of this thesis.
I would like to thank the Department of Organic and Industrial Chemistry at the University of
Parma and the Institute for Reference Materials and Measurements (European Commission, Joint
Research Centre, IRMM, Belgium) where I could carry out my doctoral studies.
I wish to express my thanks to Mr Alejandro Herrero Molina, the Director of the Institute for
Reference Materials and Measurements, and Franz Ulberth for the opportunity to perform part of
my doctoral studies in the Food Safety and Quality Unit.
I gratefully acknowledge Prof. Elke Anklam for having supported this PhD project .
Finally I would like to thank all friends and colleagues of the University of Parma and from all over
Europe who patiently helped me giving their suggestions, listening to my complaints and worries
and cheering me up during these three years of personal and professional growth.

152
Curriculum Vitae
Elena Scaravelli
Born: Suzzara (Italy) 09-01-1979
Nationality: Italian
Permanent address via Zara Chiaviche, 22
46029 Suzzara (Mantova)
Italy
Tel. +39 347 1496237
e-mail: [email protected]
Studies
1993-1998: Secondary school (Liceo Scientifico) specializing in scientific studies at “Istituto
Magistrale statale A. Manzoni”, Suzzara (MN); Overall marks: 58/60.
1998-2003: Degree in Food Sciences and Technologies (5 years); Facolta’ di Agraria -
Universita’ degli Studi di Parma (Italy). Title of the thesis: “Hidden Allergens in
Foodstuff: PCR and PNA methodologies for Detection of Hazelnut and Peanut”;
Overall marks: 110/110 cum laude.
2003: Qualification for practising the profession of food technologist (Esame di Stato).
2004: Four months as a trainee in the Food Safety and Quality Unit of the Institute for
Reference Materials and Measurements (European Commission, Joint Research
Centre in Geel, Belgium) and fellowships at the Department of Organic and
Industrial Chemistry of the University of Parma.
2005-2008: Doctoral Studies (from January to September 2005 at the Department of Organic and
Industrial Chemistry of the University of Parma; from October 2005 till now in the
Fodd Safety and Quality Unit at Institute for Reference Materials and Measurements
(European Commission , Joint Research Centre in Geel, Belgium)
Publications:
E Scaravelli (September 2005) "Allergeni nascosti negli alimenti: metodiche PCR e PNA per la determinazione di nocciola e arachide". Tecnologie Alimentari.
A Germini, E Scaravelli, F Lesignoli, S Sforza, R Corradini, R Marchelli (2005) "Polymerase chain reaction coupled with peptide nucleic acid high-performance liquid chromatography for the

153
sensitive detection of traces of potentially allergenic hazelnut in foodstuffs" European Food Research and Technology, 220(5-6):619-624.
S Sforza, E Scaravelli, R Corradini, R Marchelli (2005) “Unconventional method based on circular dicroism to detect peanut DNA in food by means of PNA probe and a cyanine dye”. Chirality, 17:1-7.
S Rossi, E Scaravelli, A Germini, R Corradini, R Marchelli (2006) "A PNA-array platform for the detection of hidden allergens in food stuffs". European Food Research and Technology, 223: 1-6.
E Scaravelli, M Brohée, R Marchelli, A J van Hengel (in press) "Development of three real-time PCR assays to detect peanut allergen residue in processed food products". European Food Research and Technology.
F Totsingan, S Rossi, R Corradini,T Tedeschi, S Sforza, A Juris , E Scaravelli, R Marchelli ( in press) Label-Free Selective DNA Detection with High Mismatch Recogniton by PNA Beacons and Ion Exchange HPLC. Organic & Biomolecular Chemistry.
Poster Presentation
A Germini, E Scaravelli, R Marchelli "Development of a Peptide Nucleic Acid/HPLC method for the detection of traces of potentially allergenic hazelnut in foodstuff". 9th International Symposium on Immunological, Chemical and Clinical Problems of Food Allergy" 18 – 21 April 2004; Budapest (Hungary).
E Scaravelli, S Sforza, R Corradini, R Marchelli "A new unconventional method based on circular dichroism to detect peanut and hazelnut DNA in food by means of a PNA probe and a cyanine dye". 17th International Symposium on Chiral Discrimination, 11-14 Settembre 2005; Parma (Italy).
E Scaravelli, A Germini, S Rossi, S Sforza, R Corradini, R Marchelli "Detection of GMOs and allergens in foodstuffs by means of PNAs". European Food Chemistry XIII, 21-23 Settembre 2005; Hamburg (Germany).
E Scaravelli, R Marchelli, A J van Hengel "PCR based methods and Peptide Nucleic Acids for the detection of hidden allergens in food products". 11th Workshop on the Developments in the Italian PhD Research in Food Science, Technology and Biotechnology- Settembre 27-29, 2006; Universita' degli Studi di Teramo (Italy).
E Scaravelli, A Germini, S Sforza, S Rossi, R Marchelli, A J van Hengel "PCR based methods and Peptide Nucleic Acids for the detection of hidden allergens in food products". VI Congresso Nazionale di Chimica degli Alimenti, 7 - 10 Novembre 2006; Alba, Cuneo (Italy).
Oral presentation
"Detection of peanut allergen residues in processed food products: the development of three real-time PCR assays compared with ELISA". Euronalysis XIV, 10-14 Settembre 2007; Antwerp (Belgium).
"Development of new real-time PCR assays for food allergen detection". Life Sciences Symposium at IRMM, 15 Gennaio 2008; IRMM, Geel Belgium.