detection of tactile inputs in the rat vibrissa pathway
TRANSCRIPT
Detection of tactile inputs in the rat vibrissa pathway
Douglas R. Ollerenshaw, Bilal A. Bari, Daniel C. Millard, Lauren E. Orr, Qi Wang,and Garrett B. StanleyCoulter Department of Biomedical Engineering, Georgia Institute of Technology and Emory University, Atlanta, Georgia
Submitted 4 January 2012; accepted in final form 15 April 2012
Ollerenshaw DR, Bari BA, Millard DC, Orr LE, Wang Q,Stanley GB. Detection of tactile inputs in the rat vibrissa pathway. JNeurophysiol 108: 479–490, 2012. First published April 18, 2012;doi:10.1152/jn.00004.2012.—The rapid detection of sensory inputs iscrucial for survival. Sensory detection explicitly requires the integra-tion of incoming sensory information and the ability to distinguishbetween relevant information and ongoing neural activity. In thisstudy, head-fixed rats were trained to detect the presence of a briefdeflection of their whiskers resulting from a focused puff of air. Theanimals showed a monotonic increase in response probability and adecrease in reaction time with increased stimulus strength. High-speedvideo analysis of whisker motion revealed that animals were morelikely to detect the stimulus during periods of reduced self-inducedmotion of the whiskers, thereby allowing the stimulus-induced whis-ker motion to exceed the ongoing noise. In parallel, we used voltage-sensitive dye (VSD) imaging of barrel cortex in anesthetized ratsreceiving the same stimulus set as those in the behavioral portion ofthis study to assess candidate codes that make use of the full spatio-temporal representation and to compare variability in the trial-by-trialnature of the cortical response and the corresponding variability in thebehavioral response. By application of an accumulating evidenceframework to the population cortical activity measured in separateanimals, a strong correspondence was made between the behavioraloutput and the neural signaling, in terms of both the response prob-abilities and the reaction times. Taken together, the results hereprovide evidence for detection performance that is strongly reliant onthe relative strength of signal versus noise, with strong correspon-dence between behavior and parallel electrophysiological findings.
psychometric performance; ideal observer; voltage-sensitive dye
HOW THE BRAIN INTEGRATES sensory information, and how it ulti-mately uses that information to initiate a motor response, areamong the most important questions facing the field of sensoryneuroscience. Given that most rodents are nocturnal and relyheavily on their facial whiskers for navigation and survival, therodent vibrissa system has evolved into an incredibly sophisti-cated sensorimotor system (Diamond et al. 2008; Petersen 2007).Recent studies have shown that the vibrissa system is capable ofa wide range of sensory tasks, such as whisker contact detection(Stüttgen et al. 2006; Stüttgen and Schwarz 2008), object local-ization (Hutson andMasterton 1986; Mehta et al. 2007; O’Connoret al. 2010a, 2010b; Shuler et al. 2002), texture, pattern, andvibrotactile discrimination (Adibi and Arabzadeh 2011; Adibi etal. 2012; Brecht et al. 1997; Carvell and Simons 1990; Gerdjikovet al. 2010; Guic-Robles et al. 1989; Ritt et al. 2008; Von Heimen-dahl et al. 2007; Wolfe et al. 2008), and aperture width discrim-ination (Krupa et al. 2001, 2004), but how this information isextracted by the neural circuitry is still largely unknown.
Between the arrival of a stimulus-induced neural signal inthe primary sensory cortex and the subsequent motor response,the brain must evaluate the available evidence to determinewhether the activity constitutes an important event or is insteadenvironmental or internal noise (Gold and Shadlen 2007).Although the decision process is likely mediated in brainregions that are not purely sensory in nature, by assuming therole of an ideal observer of cortical activation we can learnmuch about what information is available to downstreamstructures and evaluate possible candidate codes upon whichthe computation might actually be based (Jacobs et al. 2009;Wang et al. 2010). Although behavioral outcomes are ulti-mately linked to the concerted suprathreshold neuronal activ-ity, much of what we currently understand is limited to mea-surements of single neurons or small groups of neurons, uponwhich neurometric comparisons to psychometric performanceare made (Britten et al. 1992; Shadlen and Newsome 2001;Stüttgen and Schwarz 2008).In their natural environments, rats and other rodents actively
move their whiskers to palpate their surroundings (Berg andKleinfeld 2003; Bermejo et al. 2002; Brecht et al. 1997;Carvell and Simons 1990; Gustafson and Felbain-Keramidas1977). The resulting sensory input to this pathway is a complexcombination of both the macro- and micromotions of thewhisker that relate to the properties of the objects beingpalpated (Birdwell et al. 2007; Hartmann et al. 2003; Knutsenet al. 2005; Neimark et al. 2003; Ritt et al. 2008; Wolfe et al.2008) and the self-induced movement of the whisker (Curtisand Kleinfeld 2009; Jenks et al. 2010). Tactile sensing thusexplicitly requires the disassociation of self-induced motionfrom the exogenous sensory input. It has been shown that thepathway encodes information directly related to whisker mo-tion, even when the whiskers are not in contact with an object(Khatri et al. 2009; Leiser and Moxon 2007; Yu et al. 2006).How this might affect the animal’s ability to detect an exoge-nous stimulus in the presence of endogenous, self-generated“noise” has not been well studied.In this study, head-fixed rats were trained to detect the
presence of a brief deflection of their whiskers resulting froma focused puff of air. The animals showed a monotonic in-crease in response probability and a subsequent decrease inreaction time with increased stimulus strength. High-speedvideo analysis of whisker motion was used to measure bothstimulus-induced as well as self-generated motion of the vibris-sae, with evidence indicating that animals were more likely todetect the stimulus during periods of reduced self-motion of thewhiskers, thereby allowing the stimulus-induced whisker mo-tion to exceed the ongoing noise. In parallel to the behavioraldetection experiments conducted here, we used voltage-sensi-tive dye (VSD) imaging of barrel cortex in anesthetized rats
Address for reprint requests and other correspondence: G. B. Stanley,Coulter Dept. of Biomedical Engineering, Georgia Inst. of Technology andEmory Univ., 313 Ferst Dr., Atlanta, GA 30332 (e-mail: [email protected]).
J Neurophysiol 108: 479–490, 2012.First published April 18, 2012; doi:10.1152/jn.00004.2012.
4790022-3077/12 Copyright © 2012 the American Physiological Societywww.jn.org
at Em
ory University on A
ugust 3, 2012http://jn.physiology.org/
Dow
nloaded from

receiving the same stimulus set as those in the behavioralportion of this study to assess candidate codes that make use ofthe full spatiotemporal representation and to compare variabil-ity in the trial-by-trial nature of the cortical response (Petersenet al. 2003b) and the corresponding variability in the behav-ioral response. By application of an accumulating evidenceframework to the population cortical activity measured inseparate animals, a strong correspondence was made betweenthe behavioral output and the neural signaling, in terms of boththe response probabilities and the reaction times.
METHODS
Five Long-Evans rats (Charles River Laboratories, Wilmington,MA; 7 wk of age, �250 g at beginning of study) were used in thebehavioral portion of this study, and two Sprague-Dawley rats(Charles River Laboratories; 200–350 g) were used in the acute VSDexperiments. Animals were housed on a 12:12-h light-dark cycle, withall experimental sessions occurring during the light phase. All proce-dures were in accordance with protocols approved by the GeorgiaInstitute of Technology Animal Care and Use Committee.
Procedure to implant head post. All animals used in the behavioraltask were habituated to human contact for a minimum of 5 days priorto the surgical procedure to implant the head post. The head postconsisted of a stainless steel machine screw implanted with thethreaded end facing upward. All surgical procedures adhered toaseptic principles. Anesthesia was induced with isoflurane at 4–5% inthe home cage and was subsequently maintained at 1.5–3% with anose cone. The depth of anesthesia was monitored through toe-pinchreflexes and a noninvasive continuous measurement of heart rate andblood oxygenation. The scalp was shaved and cleaned of hair withdepilatory cream. Animals were then placed in a stereotactic deviceusing nonpenetrating ear bars, and the eyes were covered in ophthal-mic ointment to prevent drying. Atropine (0.05 mg/kg sc) and saline(10 ml/kg sc) were administered. The body temperature was thermo-statically maintained at 37°C throughout the procedure. The scalp wascleaned with alcohol and a 10% povidone-iodine solution, followedby an injection of lidocaine prior to incision. After the skull wascleared of connective tissue, six to eight holes were drilled and1.4-mm-diameter stainless steel screws were inserted to anchor thehead post to the bone. The head post was then held over themidline, and dental cement was applied over the base of the postand the skull screws. The wound was treated with antibioticointment and closed with metal wound clips. Buprenorphine (Bu-prenex, 0.03 mg/kg sc) was provided as an analgesic, and antibi-otics (Baytril, 5 mg/kg im) were administered for a minimum of 3days postoperatively. Animals were given a minimum of 10 daysof recovery before commencing behavioral training.
Water restriction schedule. Water restriction was implementedafter a minimum of 10 days of recovery from head post implantation.Training and data recording sessions took place daily, Mondaythrough Friday, and animals did not have access to water in their homecages on those days. Correct responses in the behavioral task wererewarded with 75- to 100-�l aliquots of water, and animals were allowedto continue performing the task until sated. The weight of the animal wastracked daily, and, when necessary, water supplements were providedafter the daily experimental session in order to maintain the weight of theanimal within 90% of its age-adjusted value. Water was provided adlibitum from Friday afternoon through Sunday afternoon of every week,and for 1 full week every 2 months.
Behavioral apparatus. The behavioral apparatus is illustrated inFig. 1A and was contained in a standard operant conditioning chamber(model 80003, Lafayette Instruments, Lafayette, IN) placed inside asound- and light-attenuating cubicle (ENV-014, Med Associates, St.Albans, VT). A 6-cm aluminum extension was attached to the ani-
mals’ head post prior to each behavioral session with a set screw. Thishead post extension was then held rigidly with a stainless steel clampextending from the side of the operant conditioning chamber. Thebody of the animal was contained in a custom-built body restraint boxdesigned to prevent excessive movement while the animal was headfixed. A movable plate at the front of the restraint box provided alocation for the animal to rest its forepaws while it was head fixed.The body restraint box was rigidly attached to the floor of the operantconditioning chamber. A stainless steel water spout was directly infront of the animal and served both to deliver water rewards and tomeasure licking responses. As described by Hayar et al. (2006), thepositive lead of an A/D converter was attached to the stainless steelspout and the negative lead was attached to the aluminum floor of thebody restraint box. Contact of the animal’s tongue with the waterspout resulted in an �600-mV potential change across the two leads.This potential was converted to a binary value, time-stamped, andstored in the data file, thus allowing the onset and offset of each lickof the water spout to be recorded. Water was fed through the spout bya peristaltic pump (model 80204M, Lafayette Instruments). A tonegenerator (model 80223M, Lafayette Instruments) and a stimulus light(model 80221M, Lafayette Instruments) were installed directly abovethe water spout. A white noise masking stimulus was deliveredthrough speakers installed in front of the animal, one to either side.
Stimuli consisted of brief 150-ms puffs of air delivered to thevibrissa array on one side of the face (Ahissar et al. 2000; Derdikmanet al. 2003; Sosnik et al. 2001). The air puffs were delivered througha custom-built air nozzle constructed from stainless steel hypodermictubing (19 gauge, 0.032-in. ID at tip; Smallparts). The air puff nozzlewas aligned 15° from the longitudinal axis of the animal and aimedsuch that the air stream impacted the vibrissae approximately halfwaybetween the follicle and the tip, but away from the face. The pressureof the air puff was adjusted with a computer-controlled voltageregulator (part no. QPV1TFEE015CXL, Proportion Air, McCords-ville, IN) and varied from 0 to 15 psi. The duration of the air puff wascontrolled by a miniature normally closed solenoid valve (part no.5001T332, McMaster-Carr, Atlanta, GA). Both the solenoid and thepressure regulator were placed outside the sound-attenuating chamberto prevent auditory confounds. A second air puff nozzle with identicaldimensions was placed adjacent to the stimulus nozzle but aimed suchthat it did not result in deflections of the whiskers. This second nozzle,referred to as the “distracter nozzle,” was programmed to release apuff of air intermittently on a 0- to 5-s uniform distribution and wasdesigned to prevent the animal from cueing off of the sound of the airpuff during the behavioral task.
Control of the behavioral task and data logging were performedwith custom software written in Microsoft Visual Basic 6. The interiorof the behavioral chamber was illuminated with infrared light (modelVQ2121, Lorex Technology, Markham ON, Canada), and the ani-mal’s behavioral state during the task performance was monitoredwith a low-speed CCD camera (model DMK 21BF04, The ImagingSource, Charlotte, NC).
Training and behavioral task. After the animal was placed on awater restriction schedule, it was systematically habituated to headfixation and trained to perform the full detection task. The first stepwas to train the animal to lick the response spout in order to receivea water reward. In this stage of training, the animal was allowed tofreely roam the operant conditioning chamber and approach the waterspout at will. Water was dispensed on a 1-s interval as long as theanimal continued to lick the spout, and the animal was allowed todrink until sated. The animals quickly learned to voluntarily enter thebody restraint box to approach the water spout. After 2–3 days, arubber version of the head post extension was clamped onto the headpost and held by hand while the animal drank from the water spout.After the animal was able to tolerate manual fixation without signs ofdistress, the rubber head post extension was affixed in the head postclamp, allowing a limited degree of mobility. The length of time that
480 DETECTION IN VIBRISSA PATHWAY
J Neurophysiol • doi:10.1152/jn.00004.2012 • www.jn.org
at Em
ory University on A
ugust 3, 2012http://jn.physiology.org/
Dow
nloaded from

the animal was affixed in the head clamp was gradually increased, aswas the delay between water rewards.
After the animal was capable of tolerating head fixation for aminimum of 5 min, with a 4-s delay between water rewards, therubber head post extension was replaced with the aluminum versionand the animal was moved to the next stage of training, in which lickresponses were conditioned on the air puff stimulus. In this stage oftraining, the animal was placed on a modified version of the task inwhich premature licks were not penalized. Thus the animal was ableto lick the spout freely, but only the first lick within a maximum of 2s following a 15 psi puff of air to the whiskers was rewarded with awater drop. The window of opportunity following the air puff wasgradually decreased to 500 ms over a number of days. Simultane-ously, a delay was added if any licks were detected within a 1-swindow preceding the scheduled stimulus delivery time. This delaywas gradually increased to 1.5–5.5 s randomly chosen on a uniformdistribution. The animals quickly learned to withhold licking until thestimulus was detected. Finally, the white noise masking stimulus andthe distracter puffs were added. Training and habituation procedureswere based on those described by Schwarz et al. (2010).
In the full version of the task, described schematically in Fig. 1B,a 500-ms tone signaled the start of a new trial. The white noisemasking stimulus was muted during presentation of the tone. On S�trials, or those in which the animal was expected to respond, thestimulus delay was drawn from a 1.5- to 5.5-s uniform distribution. Toprevent random licking, any licks occurring within 1 s of the sched-uled stimulus resulted in a further 1.5- to 5.5-s delay. A trial wascategorized as a “hit” if the animal licked the water spout within500 ms of the air puff stimulus and a “miss” otherwise. Hits were
rewarded with a 70- to 100-�l aliquot of water (activation of theperistaltic pump for 1–1.5 s), and misses were not penalized. On eachtrial, 1 of 11 possible stimulus strengths was randomly chosen (0 psi,0.375 psi, 0.75 psi, 1.125 psi, 1.5 psi, 1.875 psi, 2.25 psi, 3 psi, 4.5 psi,7.5 psi, 11.25 psi). The resulting angular deflection velocities of thewhiskers were measured by high-speed video analysis of an anesthe-tized animal undergoing the same range of stimulus strengths (seebelow). On every fifth trial, a test stimulus consisting of the maximumair pressure (15 psi) was presented to probe the attentional/motiva-tional state of the animal. The test stimulus was repeated if the animalfailed to respond, and the session was halted if the animal failed torespond to three consecutive test pulses. Catch trials (labeled S�)were interleaved on 10–20% of trials. S� trials were identical to S�trials with the exception that only the distracter air puff nozzle wasactivated at the scheduled stimulus delivery time, thus probing theanimal’s probability of responding by chance or as a result of potentialauditory confounds. Responses on S� trials were labeled as “falsealarms” and were penalized with a 5- to 10-s time-out in which thestimulus light was turned on. “Correct rejections,” or S� trials onwhich the animal did not respond in the window of opportunity, werenot rewarded. All trials were preceded by a 1-s period designed toensure separation between individual trials and to ensure that animalshad sufficient time to consume the water reward from the previoustrial.
Animals generally performed one session per day and were allowedto work until sated. In cases in which two sessions were performed ina day, the first session was halted after 15–20 min and the animalwaited a minimum of 1 h before starting the second session. Well-trained animals generally performed 100� correct trials per day.
Fig. 1. A go/no-go behavioral detection task was used to probe the sensitivity of head-fixed rats to brief whisker deflections. A: schematic of the behavioralapparatus. Head-fixed animals were trained to respond to air puff stimuli delivered to their whiskers by licking a response spout. B: timeline of the behavioraltask. After a tone, the tactile stimulus was presented at a random time, where the duration between the tone and the stimulus was drawn from a uniformdistribution on 1.5–5.5 ms. To discourage guessing, a “no-lick period” was imposed in which any licks within 1 s prior to the forthcoming stimulus resulted inan additional delay of the stimulus. Animals had a 500-ms window in which to respond by licking the spout after the delivery of a stimulus. Responses to airpuff (S�) trials were rewarded with a 70- to 100-�l drop of water. Catch (S�) trials were interleaved on 10% of trials, where a distracter nozzle (positionednear the air nozzle but not aimed at the vibrissae) was activated to test for chance response probability. Responses on S� trials were penalized with a 5- to 10-stime-out in which the stimulus light was activated. Failure to respond on S� trials was not penalized, and correctly withholding on S� trials was not rewarded.C: to quantify the strength of the air puff stimulus, high-speed video was recorded while the stimulus was delivered to an anesthetized animal with only a singlerow of whiskers remaining. Shown are 4 frames from a representative video with a tracking polynomial overlaid on the C2 whisker, which was the whisker thatwas deflected maximally by the air puff. Although multiple whiskers were deflected, only the maximally deflected whisker was considered for tracking purposes.The polynomial fit to the whisker is designated by the solid white line, while the dashed white line indicates the initial position of the whisker. The coordinatesystem used in the tracking algorithm is shown in the 1st frame.
481DETECTION IN VIBRISSA PATHWAY
J Neurophysiol • doi:10.1152/jn.00004.2012 • www.jn.org
at Em
ory University on A
ugust 3, 2012http://jn.physiology.org/
Dow
nloaded from
Across all 5 animals, over 10,000 total trials were performed (includ-ing test pulses and S� trials), with each animal being presented eachof the 11 possible stimulus strengths an average of 81 times.
Behavioral data analysis. To prevent the inclusion of trials inwhich the animal was not highly motivated, trials were excluded fromanalysis if the animal did not correctly respond to the subsequent teststimulus. Thus a pair of successful responses to test stimuli bracketedeach five-trial block. This relatively conservative criterion resulted inthe exclusion of �10% of all trials. Psychometric curves wereconstructed from the measured behavioral response rates by fitting asigmoidal curve of the form P(V) � 1 � (1 � �)e�(V/�)�
where V isthe whisker deflection velocity and �, �, and � are free parametersthat were calculated with a nonlinear least-squares regression algo-rithm in MATLAB. The combined psychometric curve was con-structed by pooling the behavioral data from all five animals. Errorbars represent 95% confidence intervals. Response times were calcu-lated as the mean time between stimulus onset and the first emittedlick within the response window, limiting the longest possible reactiontime to 500 ms. Error bars for the latency data points represent SE.
High-speed videography. High-speed video was used both to mapthe known air pressure of the chosen range of stimuli to the resultingangular deflection velocities as well as to monitor the effect ofwhisker motion on detection performance in the awake animal. Toprevent self-motion of the animal’s whisker pad from affecting themeasured velocities resulting from the air puffs, this analysis wasperformed on an animal under isoflurane anesthesia. While all of thereported behavioral results were obtained in animals in which the fullvibrissa array was intact, the vibrissae were subsequently trimmed,leaving only the C row intact in order to facilitate imaging. High-speed video was acquired with an infrared CMOS camera (FastecInLine 1000 with 1 GB onboard memory). The camera was mounteddirectly above the animal’s head and focused on the whiskers ofinterest. Backlighting was achieved with two infrared LED arrays(model VQ2121, Lorex Technology) placed �10 cm below the regionof interest; 3/16th-in. opaque white plastic was placed directly abovethe LEDs to act as a diffuser and to improve the contrast of thewhiskers. All video was recorded at either 440 � 330 or 640 � 238pixels/frame at a temporal resolution of 500 frames/s with exposuretime limited to 0.665 ms/frame. The spatial resolution of the region ofinterest was 7.0–8.5 pixels/mm (Jenks et al. 2010).
All whisker tracking was implemented with a custom routinewritten in MATLAB. The whisker tracking routine was based on thatdescribed by Knutsen et al. (2005), which was subsequently madeavailable online (http://code.google.com/p/whiskertracker/). On asubset of videos, results from our custom tracking routine werecompared and provided similar results. In the tracking program, threepoints were chosen on each whisker of interest, one defining the baseof the whisker at its junction with the facial pad, one defining a point�20 mm from the base that defined the length of the whisker that wastracked, and a third intermediate point about which a vertical searchwas performed on each frame to locate the new position of thewhisker. In each frame, a search algorithm was performed in both thepositive and negative x (medial-lateral)-directions from the new in-termediate point to define the new x- and y-positions of each pixelrepresenting the whisker between two user-defined extremes. Notethat this algorithm does not prevent the base of the whisker frommoving in the y-direction (rostral-caudal), as it clearly does duringself-induced motion of the whisker pad in awake animals. These newx- and y-locations were then fit with a second-order polynomial ineach frame. Example frames of the high-speed video with a polyno-mial fit to the C2 whisker are shown in Fig. 1C. The local whiskerangle, in degrees, was computed in each video frame by taking thefirst spatial derivative of the polynomial at the whisker base. Angularvelocity was calculated as the change in whisker angle from the previousframe to the current frame, divided by the temporal resolution of thevideo (2 ms/frame). All results were filtered with a second-order Butter-worth low-pass filter with a cutoff frequency of 50 Hz.
Whisker tracking in the anesthetized animal. To calibrate theknown stimulus strengths, in pounds per square inch of air pressure,to a more behaviorally relevant range of deflection velocities, the fullrange of air puff stimuli was applied to an anesthetized animal fourtimes per stimulus. We reasoned that the whisker with the maximumvelocity would likely dominate the cortical signal, and thus definedthe velocity for a given air puff strength as the maximum deflectionvelocity observed across all whiskers. In every case, the maximumvelocity was measured in the C2 whisker. The maximum velocity foreach of the four trials was averaged, resulting in a simple table lookupto convert between air pressure and deflection velocity.
Whisker tracking in the awake animal. After completion of datacollection with the full whisker array intact, two animals were con-tinued in the behavioral task with all whiskers excluding the C rowtrimmed. Analysis was confined to trials in which a 121°/s stimuluswas delivered. This value was chosen because it was near the animals’behavioral detection threshold, meaning the animals tended to suc-cessfully detect the stimulus on �50% of the trials. The camera wastriggered on stimulus onset and was programmed to record an intervalof 500 ms before and after the stimulus presentation. A total of 57trials were collected across 2 animals.
In the subsequent analysis, the deflection angle as a function oftime was measured for the C2 whisker. In all cases, the C2 whiskerunderwent a larger deflection than other C-row whiskers, and analysiswas therefore confined to that whisker alone. For each of the 57 trials,the mean whisker angle in the 150 ms prior to stimulus onset wassubtracted from the measured angle, and the discrete Fourier trans-form of the whisker angle was calculated over the same time intervalin MATLAB. Trials were categorized as being either “whisking” or“nonwhisking” trials based on the total power in the 0–15 Hzfrequency band, with a hard threshold manually chosen to providemaximum separation. The behavioral response probabilities for thesetwo categories of trial types were compared to assess how theanimals’ own self-generated whisker motion affected the probabilityof detecting the stimulus.
Voltage-sensitive dye imaging. Layer 2/3 population activity result-ing from whisker deflections was measured in separate animals withVSD imaging, which primarily measures subthreshold membranevoltage fluctuations with high temporal and spatial resolution (Bergeret al. 2007; Ferezou et al. 2006; Grinvald and Hildesheim 2004;Petersen et al. 2003a). Two female Sprague-Dawley rats were used forVSD imaging experiments. Surgical procedures were similar to thosedescribed above. Anesthesia was induced with isoflurane, then fol-lowed by an injection of pentobarbital sodium (Nembutal, 50 mg/kgip), and a steady depth of anesthesia was maintained throughout theprocedure with a continuous delivery of pentobarbital sodium (Nem-butal, 12.5 mg·kg�1·h�1 iv) through the tail vein. After the skull wascleared of connective tissue, a 3 � 3-mm craniotomy centered at �2.5mm caudal to bregma and �5.5 mm lateral to the midline (Paxinosand Watson 2007) was performed over the barrel cortex, with extremecare taken to avoid heat buildup during the drilling process. An�1-mm-tall dam was constructed around the craniotomy with dentalcement to facilitate the staining process. The bone fragment was thencarefully lifted, and the dura was washed with Ringer solution andthen dried with a gentle air blow for �10–15 min or until it had a“glassy” appearance (Lippert et al. 2007). VSD (VSD RH1691,Optical Imaging) was diluted in Ringer solution to 2 mg/ml. The dyesolution (�200 �l) was carefully circulated over the cortical surfacewith a micropipette and was circulated and replenished with a mi-cropipette every 5 min over a total of 2 h, allowing ample time for thedye to diffuse into the cortex. During the entire staining process, thecraniotomy was covered whenever possible to avoid premature pho-tobleaching of the dye. After staining, the surface was washed withsaline, which was also periodically reapplied during the imagingprocess to avoid drying.
Imaging was achieved with the use of a 150-W halogen lamp toilluminate the brain surface. The excitation light source was filtered at
482 DETECTION IN VIBRISSA PATHWAY
J Neurophysiol • doi:10.1152/jn.00004.2012 • www.jn.org
at Em
ory University on A
ugust 3, 2012http://jn.physiology.org/
Dow
nloaded from
621–643 nm, and the fluorescence signals were collected with aMiCam02 camera system (SciMedia, Costa Mesa, CA), which wasfocused 300 �m below the surface of the cortex, primarily imagingthe activity of layer 2/3 neurons. The camera had a frame rate of 200Hz with a resolution of 192 � 128 pixels comprising a field of viewof �4 mm � 2.5 mm at �0.63 magnification.
The air puff nozzle was placed in the same position as during thebehavioral task, and stimuli were presented to the full whisker arrayin pseudorandom order for a total of 20 trials at each of the 11deflection velocities. On each trial, 40 frames (200 ms) and 160frames (800 ms) were collected before and after stimulus presentation,respectively. The raw fluorescence values at each pixel for eachindividual trial were recorded with SciMedia software and exported toMATLAB for further analysis.
Voltage-sensitive dye data analysis. All VSD analysis was per-formed with custom-written scripts in MATLAB. Prior to furtheranalysis, the raw fluorescence data output by the imaging hardwarewere converted to a normalized value. For each trial, the first 39frames prior to stimulus onset were averaged together to obtain anaverage level of background fluorescence, F0. The background fluo-rescence was then subtracted from each of the 200 frames in aparticular trial to obtain the differential fluorescence, �F, and thennormalized by the background fluorescence to obtain the standardVSD measure of �F/F0.
Occasionally, large spontaneous waves of activity were observedbefore stimulus onset that subsequently prevented poststimulus acti-vation. To prevent the inclusion of these trials in the analysis, theactivity for the 200 ms prior to stimulus onset was averaged across theentire frame, and any trials in which this prestimulus activity varied by�3 standard deviations from the mean were discarded from theanalysis.
Additionally, for visual presentation purposes only, the frameswere smoothed with a 3 � 3 boxcar filter, all data below a thresholddefined as 10% of the maximum �F/F0 value were removed, and theresulting fluorescence image was superimposed on a backgroundimage of the cortical surface. All quantitative analyses were per-formed on the raw VSD images.
We modeled an observer of cortical activity that was assumed torepresent a higher cortical area that may be monitoring primarysensory data to form a decision variable (DV) regarding the presenceof a sensory stimulus (Cook and Maunsell 2002). The observer wasassumed to have access to activity across a wide area of barrel cortex.To model this, we found the center of mass of activation in the peakframe (generally 40–45 ms after stimulus onset) and, for each frame,averaged the �F/F0 values in a circular region with a radius of 1 mmsurrounding this point. Given a barrel diameter of �300–400 �m,this corresponds to an area of cortex containing the majority of thewhisker representations. To account for slow, nonneural changes inthe VSD signal, a linear function was fit to the averaged data in thisspatial region over the first 200 ms prior to stimulus onset. This lineartrend was then subtracted from the entire 1-s trial (Chen et al. 2008).
Accumulation of sensory evidence was modeled by temporallyintegrating the spatially averaged signal with a leaky window thatweighted data from 1 at the current time and decayed exponentially to0 for past evidence with a time constant of �. Thus the immediatesignal was given the highest weight, and past evidence decayed overtime. This model was applied to the measured VSD signal from eachindividual trial, and the means and standard deviations were calcu-lated for each deflection velocity. To calculate the probability that astimulus with a particular deflection velocity would be detected by theobserver, a detection threshold was chosen, with the response prob-ability measured as the probability of the integrated output crossingthat threshold, assuming that the distribution of signals was Gaussian.For a given integration time constant, a range of thresholds weretested to search for the one that produced the lowest mean squarederror between the predicted response probabilities and those observedbehaviorally. The neurometric decision latency was modeled by
generating 1,000 simulated trials based on the mean and standarddeviation of the measured responses, with the latency defined as thetime at which each integrated response crossed the threshold. Trials inwhich the signal did not reach the threshold were not included in thelatency calculation. These subthreshold trials would correspond withbehavioral trials in which insufficient evidence existed to trigger aresponse, and thus no behavioral latency would exist. The analysiswas repeated for a range of time constants from 1 ms up to 1,000 ms,with a new optimal threshold value calculated for each integrationtime constant.
RESULTS
We trained a total of five head-fixed male Long-Evans ratsto perform a go/no-go detection task in which they wererequired to respond by licking a water spout within a 500-mswindow following the onset of a brief puff of air delivered totheir full whisker array (Stüttgen et al. 2006; Stüttgen andSchwarz 2008). The strength of the stimulus was varied in eachtrial to determine how the deflection velocity affected both theprobability of response and the reaction time of the animals.The behavioral task is described in detail in METHODS and isshown schematically in Fig. 1, A and B. Great care was takento avoid visual, auditory, and non-whisker-mediated tactilecues. The task was performed in a sound- and light-attenuatingcubicle with a white noise masking stimulus designed toprevent the animal from cueing on the sound of the air puffstimulus. In addition, an air puff was emitted from a secondnearby “distracter nozzle” on a uniform 0- to 5-s randominterval. This distracter stimulus was intended to decouple thesound of the air puff and the water reward in case the maskingstimulus was not sufficient to fully prevent auditory cues.Catch trials were interleaved to directly measure the chanceperformance of the animals. The stream of air was carefullyaimed to avoid impinging on the animal’s face or body. Inaddition, occasional short sessions were undertaken in whichthe primary air puff nozzle was aimed slightly above thewhisker array. During these sessions, which were kept veryshort to avoid frustrating the animals, the animals failed torespond reliably to the stimuli, further indicating that they hadlearned to rely fully upon whisker deflections to perform thetask.
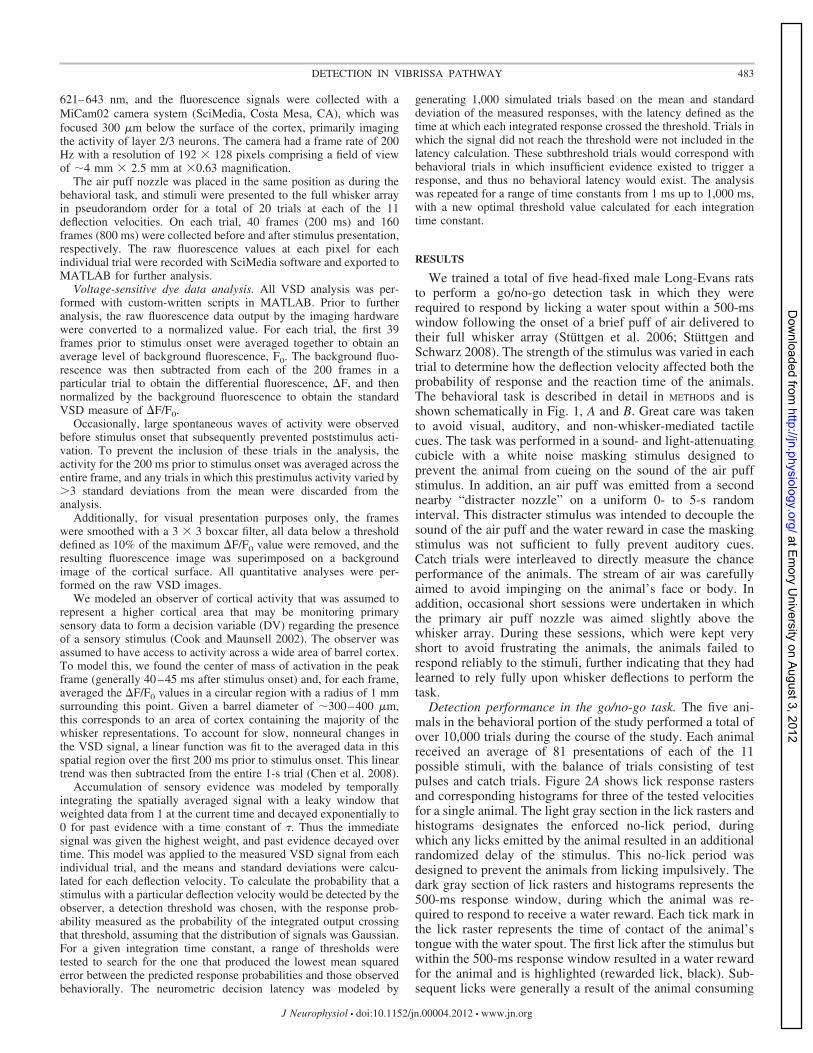
Detection performance in the go/no-go task. The five ani-mals in the behavioral portion of the study performed a total ofover 10,000 trials during the course of the study. Each animalreceived an average of 81 presentations of each of the 11possible stimuli, with the balance of trials consisting of testpulses and catch trials. Figure 2A shows lick response rastersand corresponding histograms for three of the tested velocitiesfor a single animal. The light gray section in the lick rasters andhistograms designates the enforced no-lick period, duringwhich any licks emitted by the animal resulted in an additionalrandomized delay of the stimulus. This no-lick period wasdesigned to prevent the animals from licking impulsively. Thedark gray section of lick rasters and histograms represents the500-ms response window, during which the animal was re-quired to respond to receive a water reward. Each tick mark inthe lick raster represents the time of contact of the animal’stongue with the water spout. The first lick after the stimulus butwithin the 500-ms response window resulted in a water rewardfor the animal and is highlighted (rewarded lick, black). Sub-sequent licks were generally a result of the animal consuming
483DETECTION IN VIBRISSA PATHWAY
J Neurophysiol • doi:10.1152/jn.00004.2012 • www.jn.org
at Em
ory University on A
ugust 3, 2012http://jn.physiology.org/
Dow
nloaded from
the water reward (unrewarded lick, gray). The animals’ lickingresponses were clearly periodic, and subsequent analysis (notshown) indicated an average licking frequency of �8 Hz.Figure 2B shows the individual response probabilities as afunction of deflection velocity for each of the five animals inthe study. Each of the five animals showed a maximal responseprobability of �90% for the highest velocity and responded to�10% of the 0°/s stimuli, in which no stimulus was applied. Itshould be noted that the 0°/s stimuli were distinct from thecatch trials, which are described in detail below, in that theprimary stimulus solenoid was opened on 0°/s trials but therewas no air pressure present in the line.Figure 2C shows the psychometric curve for the combined
data among all five animals. The dashed horizontal line labeled“chance” in Fig. 2C represents the averaged response proba-bility on catch trials, which were trials in which no tactilestimulus was delivered but the distracter nozzle was fired at thetime of the stimulus. Responses on catch trials were consideredfalse alarms and were penalized with a 5- to 10-s time-outperiod in which the stimulus light in the behavioral chamberwas turned on. The average response rate for all catch trialswas 9.74% (13.66%, 11.39%, 8.70%, 12.77%, and 6.67% forrats 1–5, respectively), which corresponded well with the
response rate on 0°/s trials (9.69%), further indicating that theanimals were not using auditory cues to detect the presence ofa stimulus. Assuming that the animals’ tendency to guess at thepresence of a stimulus remained constant throughout the du-ration of the trial, a theoretical chance response rate can becalculated by dividing the length of the response window (500ms) by the overall duration in which a correct guess couldresult in a reward, which was 4.5 s. This yields an expectedchance performance level of 11.11%, which also correspondswell with the experimentally measured chance performance.Figure 2D shows the mean reaction times for the highest five
velocities tested for all five of the animals in this study. Themean reaction time at the threshold velocity, 154°/s, was 309ms, and the reaction time steadily decreased with increasingstimulus strength. The reaction time at the highest velocity,335°/s, was 257 ms. This 52-ms difference between the stron-gest deflection velocity and the threshold level deflectionvelocity was statistically significant (P 0.005, 2-samplet-test). Reaction times for subthreshold deflection velocities, inwhich the animals tended to respond on less than half of thetrials, were much more variable and were therefore not plotted.
Detection in the presence of self-motion. Rats and otherrodents possess fine control over the motion of their whiskers
Fig. 2. Response probability increased and reaction time decreased with increasing stimulus strength. A: lick response rasters for a single animal for 3 deflectionvelocities. The light gray region indicates the enforced no-lick period, and the dark gray region indicates the 500-ms response window. Each tick mark in thelick raster indicates the contact of the tongue with the water spout, with all first licks falling within the response window highlighted in black (rewarded lick).The responses are divided into 50-ms bins in the accompanying histograms, with first licks again highlighted in black. B: psychometric curves for each of the5 individual animals. Solid lines represent sigmoidal fits to the response probabilities at each of the 11 tested deflection velocities (see METHODS). Individual meanresponse probabilities are shown for each of the 5 animals. C: psychometric curve for all 5 animals combined. Each data point represents the response probabilityat a particular deflection velocity with data pooled across all 5 animals. The solid line is the sigmoidal fit to the data, and the dashed horizontal line representsthe response probability on catch trials, which is the experimentally derived measure of chance performance. The average detection threshold, which is definedas the deflection strength at which the animals detect the stimulus 50% of the time, was �125°/s. D: mean reaction times for all 5 animals for the 5 highestdeflection velocities. There is a 52-ms decrease in the reaction time from the fifth-highest deflection velocity to the highest (P 0.005, 2-sample t-test).
484 DETECTION IN VIBRISSA PATHWAY
J Neurophysiol • doi:10.1152/jn.00004.2012 • www.jn.org
at Em
ory University on A
ugust 3, 2012http://jn.physiology.org/
Dow
nloaded from

and often explore their environment with a rhythmic sweepingof their vibrissae known as whisking. Multiple studies haveshown that whisking corresponds with changes in the process-ing state of cortex, leading to a reduction in the corticalresponse to passively applied stimuli (Castro-Alamancos 2004;Crochet and Petersen 2006; Fanselow and Nicolelis 1999;Ferezou et al. 2006, 2007). Through use of high-speed video,we sought to explicitly determine whether self-induced whis-ker motion affected the animals’ probability of detecting theexternally applied stimulus. After the completion of data col-lection with the full vibrissa array intact, two animals contin-ued to perform the task with only the central C row of whiskersintact and all others trimmed at skin level, in order to facilitateimaging. The whiskers were backlit with infrared LEDs (Jenkset al. 2010), and the camera was positioned directly above thehead of the animal. The angle at the base of the whisker wassubsequently evaluated with a custom MATLAB routine (seeMETHODS for details on the videography and whisker tracking).To maximize the possibility of recording both correct and
incorrect trials, the camera was only triggered on presentationof 121°/s stimuli, which was just below the behavioral detec-tion threshold (response probability with full vibrissa arrayintact � 46.58%). A total of 57 trials were recorded across the2 animals. Trials were separated into two categories based onthe amount of whisker motion in the 150-ms epoch prior tostimulus delivery: those with high power in the 0–15 Hz range,which were categorized as whisking trials, and those with lowpower in the 0–15 Hz range, which were categorized asnonwhisking trials. Figure 3A shows an example of both typesof trials, from 450 ms prior to stimulus onset to 200 ms afterstimulus onset. Figure 3B shows the mean 1 standarddeviation of the power from 0 to 75 Hz for all of the whiskingand nonwhisking trials and clearly demonstrates a distinctseparation between the two categories in the 0–15 Hz range.Figure 3B, inset, shows the angle vs. time traces for the 150 msprior to stimulus onset for all of the whisking and nonwhiskingtrials, with trials in which the animal correctly detected thestimulus shown in black and those in which the animal failedto detect the stimulus shown in gray. The behavioral responseprobabilities for both types of trials are shown in Fig. 3C,demonstrating that the animals had a significantly higher re-sponse rate on trials in which whisker motion was suppressedin the 150 ms prior to the arrival of the stimulus (P � 0.0313,Wilcoxon rank sum test). To determine whether or not thechange in response probabilities represents a change in the sig-nal or noise distributions, a change in the animals’ responsecriterion, or some combination of these factors, both the hit rateand the false alarm rates must be considered. While we did notrecord high-speed video during presentations of catch stimulito directly measure false alarm probability on these trials, analternative measure of the animals’ response criterion is theirpropensity to emit an anticipatory lick prior to stimulus pre-sentation, resulting in a subsequent delay of the stimulus. Theanimals emitted an anticipatory lick on 3 of 17 (17.6%) of thewhisking trials and 4 of 40 (10.0%) of the nonwhisking trials,representing a nonsignificant difference in the rate of anticipa-tory licking across the two trial types (P � 0.4340, Wilcoxonrank sum test). This suggests that the reduced response prob-abilities represented a change in the way the stimulus wasperceived in the whisking and nonwhisking conditions, as
opposed to a change in the attentional or motivational state ofthe animals.
Voltage-sensitive dye imaging of cortical activation. In ad-ditional experiments in the anesthetized rat, VSD imaging wasused to characterize the population cortical response resultingfrom the range of whisker deflection velocities applied duringthe behavioral task. VSD imaging has previously been shownto capture primarily subthreshold membrane potential fluctua-tions in layer 2/3 pyramidal neurons (Berger et al. 2007;Ferezou et al. 2006; Petersen et al. 2003a). Figure 4A shows aschematic of the VSD imaging setup. The air puff nozzle waspositioned as in the behavioral task, and deflections wereapplied to the entire vibrissa array. Images of the resultinglayer 2/3 cortical activation were captured at 200 Hz, with eachstimulus applied 20 times in pseudorandom order. Figure 4Bshows sample frames for five of the applied deflection veloc-ities from 15 ms to 55 ms after the stimulus presentation. The
Fig. 3. Self-motion of whiskers degrades detection performance. In a subset ofbehavioral trials, the whiskers were trimmed, leaving only the C row tofacilitate imaging. High-speed video was collected during presentation of the121°/s stimulus, which corresponded to the velocity at which the animalsresponded correctly on 45% of the trials with the full vibrissa array intact.A: whisker angle at the base was measured with custom tracking software, andtrials were categorized based on the total power in the 0–15 Hz frequencyband. Shown are representative examples of both a nonwhisking and awhisking trial. B: average power for all of the whisking (solid line) andnonwhisking (dashed line) trials in the 150 ms prior to stimulus onset, with theshaded region representing 1 standard deviation about the mean. Inset showsall of the whisking trials (top) and all of the nonwhisking trials (bottom).Behaviorally correct and incorrect trials are black and gray, respectively. C: theresponse probability was significantly higher during periods of reduced self-motion prior to the arrival of the stimulus. Response probabilities for the 2conditions were 0.55 and 0.24, respectively. Error bars represent 95% confi-dence intervals. *Statistical significance between the response probabilitiesunder the 2 conditions (P � 0.0313, Wilcoxon rank sum test).
485DETECTION IN VIBRISSA PATHWAY
J Neurophysiol • doi:10.1152/jn.00004.2012 • www.jn.org
at Em
ory University on A
ugust 3, 2012http://jn.physiology.org/
Dow
nloaded from
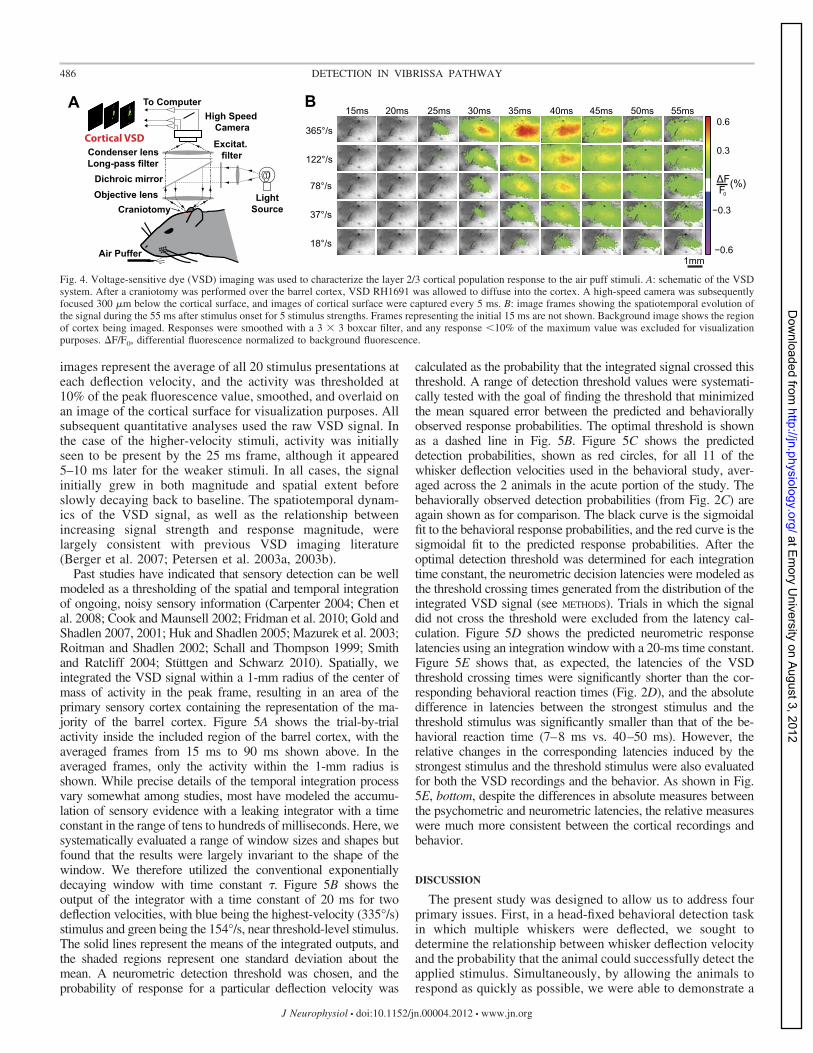
images represent the average of all 20 stimulus presentations ateach deflection velocity, and the activity was thresholded at10% of the peak fluorescence value, smoothed, and overlaid onan image of the cortical surface for visualization purposes. Allsubsequent quantitative analyses used the raw VSD signal. Inthe case of the higher-velocity stimuli, activity was initiallyseen to be present by the 25 ms frame, although it appeared5–10 ms later for the weaker stimuli. In all cases, the signalinitially grew in both magnitude and spatial extent beforeslowly decaying back to baseline. The spatiotemporal dynam-ics of the VSD signal, as well as the relationship betweenincreasing signal strength and response magnitude, werelargely consistent with previous VSD imaging literature(Berger et al. 2007; Petersen et al. 2003a, 2003b).Past studies have indicated that sensory detection can be well
modeled as a thresholding of the spatial and temporal integrationof ongoing, noisy sensory information (Carpenter 2004; Chen etal. 2008; Cook and Maunsell 2002; Fridman et al. 2010; Gold andShadlen 2007, 2001; Huk and Shadlen 2005; Mazurek et al. 2003;Roitman and Shadlen 2002; Schall and Thompson 1999; Smithand Ratcliff 2004; Stüttgen and Schwarz 2010). Spatially, weintegrated the VSD signal within a 1-mm radius of the center ofmass of activity in the peak frame, resulting in an area of theprimary sensory cortex containing the representation of the ma-jority of the barrel cortex. Figure 5A shows the trial-by-trialactivity inside the included region of the barrel cortex, with theaveraged frames from 15 ms to 90 ms shown above. In theaveraged frames, only the activity within the 1-mm radius isshown. While precise details of the temporal integration processvary somewhat among studies, most have modeled the accumu-lation of sensory evidence with a leaking integrator with a timeconstant in the range of tens to hundreds of milliseconds. Here, wesystematically evaluated a range of window sizes and shapes butfound that the results were largely invariant to the shape of thewindow. We therefore utilized the conventional exponentiallydecaying window with time constant �. Figure 5B shows theoutput of the integrator with a time constant of 20 ms for twodeflection velocities, with blue being the highest-velocity (335°/s)stimulus and green being the 154°/s, near threshold-level stimulus.The solid lines represent the means of the integrated outputs, andthe shaded regions represent one standard deviation about themean. A neurometric detection threshold was chosen, and theprobability of response for a particular deflection velocity was
calculated as the probability that the integrated signal crossed thisthreshold. A range of detection threshold values were systemati-cally tested with the goal of finding the threshold that minimizedthe mean squared error between the predicted and behaviorallyobserved response probabilities. The optimal threshold is shownas a dashed line in Fig. 5B. Figure 5C shows the predicteddetection probabilities, shown as red circles, for all 11 of thewhisker deflection velocities used in the behavioral study, aver-aged across the 2 animals in the acute portion of the study. Thebehaviorally observed detection probabilities (from Fig. 2C) areagain shown as for comparison. The black curve is the sigmoidalfit to the behavioral response probabilities, and the red curve is thesigmoidal fit to the predicted response probabilities. After theoptimal detection threshold was determined for each integrationtime constant, the neurometric decision latencies were modeled asthe threshold crossing times generated from the distribution of theintegrated VSD signal (see METHODS). Trials in which the signaldid not cross the threshold were excluded from the latency cal-culation. Figure 5D shows the predicted neurometric responselatencies using an integration window with a 20-ms time constant.Figure 5E shows that, as expected, the latencies of the VSDthreshold crossing times were significantly shorter than the cor-responding behavioral reaction times (Fig. 2D), and the absolutedifference in latencies between the strongest stimulus and thethreshold stimulus was significantly smaller than that of the be-havioral reaction time (7–8 ms vs. 40–50 ms). However, therelative changes in the corresponding latencies induced by thestrongest stimulus and the threshold stimulus were also evaluatedfor both the VSD recordings and the behavior. As shown in Fig.5E, bottom, despite the differences in absolute measures betweenthe psychometric and neurometric latencies, the relative measureswere much more consistent between the cortical recordings andbehavior.
DISCUSSION
The present study was designed to allow us to address fourprimary issues. First, in a head-fixed behavioral detection taskin which multiple whiskers were deflected, we sought todetermine the relationship between whisker deflection velocityand the probability that the animal could successfully detect theapplied stimulus. Simultaneously, by allowing the animals torespond as quickly as possible, we were able to demonstrate a
Fig. 4. Voltage-sensitive dye (VSD) imaging was used to characterize the layer 2/3 cortical population response to the air puff stimuli. A: schematic of the VSDsystem. After a craniotomy was performed over the barrel cortex, VSD RH1691 was allowed to diffuse into the cortex. A high-speed camera was subsequentlyfocused 300 �m below the cortical surface, and images of cortical surface were captured every 5 ms. B: image frames showing the spatiotemporal evolution ofthe signal during the 55 ms after stimulus onset for 5 stimulus strengths. Frames representing the initial 15 ms are not shown. Background image shows the regionof cortex being imaged. Responses were smoothed with a 3 � 3 boxcar filter, and any response 10% of the maximum value was excluded for visualizationpurposes. �F/F0, differential fluorescence normalized to background fluorescence.
486 DETECTION IN VIBRISSA PATHWAY
J Neurophysiol • doi:10.1152/jn.00004.2012 • www.jn.org
at Em
ory University on A
ugust 3, 2012http://jn.physiology.org/
Dow
nloaded from

relationship between the stimulus strength and the mean reac-tion times of the animals in the task. The animals were thenallowed to continue the task with only a single row of theirwhiskers remaining, allowing us to collect high-speed video oftheir vibrissae during presentation of threshold-level stimuli todetermine the effect that whisker motion prior to stimulus onsethad on the probability of detecting the stimulus. Finally, VSDimaging of the barrel cortex was used to characterize thepopulation cortical response to the whisker deflections used inthe behavioral task and to explore a candidate neural codingscheme that could explain both the observed response proba-bilities and reaction times.
Detectability of velocity transients in a tactile input. In thetasks utilized in this study, the behavioral performance isreported in terms of the angular velocity of the vibrissae ascalibrated through high-speed video under controlled condi-tions in anesthetized animals. When an object makes contactwith a rodent’s whisker, the motion of the whisker is transmit-ted to the densely innervated follicle at the whisker base,
giving rise to complex mechanics that have only recently beeninvestigated in detail (Birdwell et al. 2007; Towal et al. 2011).Electrophysiological studies at the thalamic and cortical levelshave largely focused on the neuronal responses to velocity andamplitude of simple tactile stimuli (Boloori et al. 2010; Leeand Simons 2004; Temereanca et al. 2008; Wang et al. 2010).Although both the amplitude and velocity of a whisker deflec-tion can covary, multiple studies have indicated that it isprimarily the velocity of the whisker deflection that is ulti-mately encoded at the level of the primary sensory cortex(Boloori et al. 2010; Pinto et al. 2000). As a first step, we havetherefore focused on the velocity of the applied stimuli whenmeasuring the animals’ response probabilities and reactiontimes, although both velocity and amplitude were seen toincrease with increased stimulus strength and other dynamicalmeasures are also possibly important. This analysis yielded adetection threshold, defined as the velocity at which the ani-mals responded with 50% probability, of �125°/s. This thresh-old value is approximately half of that measured in a very
Fig. 5. Neurometric performance based on an accumulating evidence model of the VSD signal predicts psychometric performance. A: a circular area with a radiusof 1 mm centered at the center of mass of the peak signal, designated with a white X, was treated as the input to the accumulating evidence model. Shown arethe averaged responses to the strongest air puff stimulus from 15 to 100 ms, with only the signal inside the region of interest shown. Below is the spatial averageof these frames for each of the individual trials. B: the neurometric signal is generated from leaky integration of the VSD signal from A. Specifically, the VSDsignal was convolved with an exponential window with a time constant of 20 ms. Shown are the mean and standard deviation of the integrated response for thestrongest (335°/s, shown in purple) and the fifth-strongest (154°/s, shown in cyan) velocities. For a given detection threshold, the probability of crossing thatthreshold was calculated for each of the 11 deflection strengths. The value of the threshold was chosen to minimize the mean squared error between the calculatedresponse probabilities and those measured behaviorally (Fig 2C). C: the neurometric-psychometric match using the optimized threshold values. The neurometricdata points represent the average across 2 animals. D: the neurometric latencies were measured as the time that each integrated population response crossed theoptimized threshold. Note that responses that fail to reach the threshold are not included in the measured neurometric latency. E: comparison of both the totalchange in latencies and the % change in latencies from the strongest presented stimulus to the threshold-level stimulus. Black bars represent the values measuredfrom the behaving animals, and red bars represent the output of the accumulating evidence model. The absolute change in neurometric latency is not reflectiveof the absolute change in the animals’ reaction times, but the relative change provides much closer correspondence.
487DETECTION IN VIBRISSA PATHWAY
J Neurophysiol • doi:10.1152/jn.00004.2012 • www.jn.org
at Em
ory University on A
ugust 3, 2012http://jn.physiology.org/
Dow
nloaded from
similar head-fixed detection task in which only a single whis-ker was deflected with a piezoelectric actuator (Stüttgen andSchwarz 2008). This difference can largely be accounted for bythe fact that our stimuli were applied to the entire intactvibrissa array, allowing multiple whiskers to encode the stim-ulus simultaneously, which has previously been shown toincrease the magnitude of the cortical response to a givenstimulus in anesthetized animals (Mirabella et al. 2001). Itshould be noted that although the central data reported herecorrespond to the full vibrissa array, it is our observation thatthe nozzle used to deliver the air puff stimulus produced afairly focused stream of air that was largely limited to a singlerow of vibrissae, and thus the data obtained from vibrissaarrays trimmed to a single row were not significantly differentfrom data obtained with the intact array. Furthermore, in anaperture discrimination task, in which animals were freelymoving, the ability of rats to discriminate between apertures ofsimilar widths was severely degraded when 8–12 whiskerson a given side of the face were intact (Krupa et al. 2001), andanimals performing a texture discrimination task required atleast 2 whiskers per side to accurately perform the task (Carvelland Simons 1995), suggesting that integration across thevibrissa array could account for the lower detection thresholdwe observed here.
Suppression of self-motion improves detection performance.When rats are engaged in active exploration of their environ-ments, or are trained in a task that requires active palpation ofan object, they generally engage in a 5- to 15-Hz rhythmicsweeping motion of their whiskers known as whisking (Bergand Kleinfeld 2003; Bermejo et al. 2002; Brecht et al. 1997;Carvell and Simons 1990; Gustafson and Felbain-Keramidas1977). However, in some behaviors or tasks self-generatedwhisker motion may actually be detrimental in providingaccurate tactile feedback. For example, rats in locomotion-based aperture discrimination tasks (Krupa et al. 2001, 2004),engaged in wall following (Jenks et al. 2010; Milani et al.1989), or performing passive detection tasks under head fixa-tion (Stüttgen et al. 2006) have been anecdotally reported toavoid self-motion of the whiskers.Here, using video analysis of the whisker motion while rats
were engaged in the detection task, we demonstrated not onlythat rats held their whiskers still during a majority of trials butthat their probability of accurately detecting the stimulus wasactually decreased on trials in which they engaged in activemotion of the whiskers.This result corresponds well with other studies showing that
the cortical response to peripheral inputs is attenuated when theanimal is whisking (Castro-Alamancos 2004; Crochet andPetersen 2006; Fanselow and Nicolelis 1999; Ferezou et al.2006, 2007; Hentschke et al. 2006; Poulet et al. 2012). Thisattenuation, combined with a shift to a more desynchronizedcortical state (Poulet et al. 2012), could inherently reduce theprobability of detecting a weak, passively applied stimulus.Additionally, we have previously demonstrated in the anesthe-tized animal that repetitively applied whisker movements placethe cortex in an adapted state that proves detrimental for thedetection of subsequent stimuli (Wang et al. 2010). Althoughthe extent to which adaptation exists in the awake animalappears to be less than in the anesthetized animal (Castro-Alamancos 2004), attenuation due to adaptation would alsolikely serve to diminish detection performance. It has been
shown that the pathway encodes information directly related towhisker motion, even when the whiskers are not in contactwith an object (Khatri et al. 2009; Leiser and Moxon 2007; Yuet al. 2006). An alternative explanation for the reduced re-sponse probability, therefore, could be that the neural activityresulting from whisking could overwhelm that resulting fromthe stimulus itself, effectively decreasing the signal-to-noiseratio and degrading detection performance. Finally, the ani-mals’ attentional or motivational state could be different in thetwo cases, with trials in which the animal is whisking corre-sponding to epochs in which the animal is simply less attendantto the task. Although our data set indicates that the responsecriterion is not significantly different in the two behavioralstates, none of the above scenarios, or interactions thereof, canbe ruled out without both a more complete measure of false-alarm response probabilities and simultaneous recordings ofcortical activity. While we cannot necessarily conclude that thesuppression of whisking is an active strategy employed by theanimals in our task, the results here indicate that in tasks wherethe animal must detect a weak, transient stimulus the animalmust balance incoming activity resulting from self-generatedmotion with that resulting from the stimulus itself.
VSD imaging of cortex in the anesthetized animal predictsperformance in behaving animals. According to the “sequen-tial analysis framework” of decision making, sensory evidenceabout the presence of a stimulus is built up over time andcompared with an internally determined threshold (Gold andShadlen 2007). This would allow the brain to respond quicklyto a strong, unambiguous stimulus but would require a longerintegration period for weaker inputs. The VSD signal providesan excellent measure of the subthreshold population activity inlayer 2/3 of the barrel cortex with good temporal resolution(Berger et al. 2007; Ferezou et al. 2006; Petersen et al. 2003a),thereby providing us with access to the signal that likelyrepresents sensory evidence in the behaving animal, includingthe trial-to-trial variability (Petersen et al. 2003b), which mighthelp to explain the variability both in the animals’ responseprobabilities and in the timing of their responses. As in anysensory pathway, it is not currently known where the percept ofa tactile input actually occurs in the vibrissa pathway, butlesion studies indicate that primary somatosensory cortex (S1)is necessary for simple sensory tasks such as the detection of awhisker contact (O’Connor et al. 2010a), and it is thus notmediated entirely in subcortical structures. Our observer wasmodeled as an exponentially leaky integrator with access to theaveraged signal over a broad area of barrel cortex. The modelcontained two important parameters that could be adjusted toprovide a fit between the output of the integrator and theobserved behavioral results: the time constant of integrationand the threshold above which the neural signal must pass totrigger a response. For a particular time constant, choosing theproper threshold was especially critical to avoid either includ-ing too many false alarms if set too low or missing too manylow-velocity stimuli if set too high. During task performance,the animals would likely dynamically adjust this thresholdbased on their motivation to correctly perform the task, and ourmodel threshold would represent an average threshold used bythe animals in the task.We tested a range of time constants from 1 ms up to 1,000
ms in our model but found that the best fit between thepredicted and behavioral response probabilities was achieved
488 DETECTION IN VIBRISSA PATHWAY
J Neurophysiol • doi:10.1152/jn.00004.2012 • www.jn.org
at Em
ory University on A
ugust 3, 2012http://jn.physiology.org/
Dow
nloaded from

with a time constant of 20 ms. This corresponds well withanother recent study of temporal integration in the whiskersystem of rats engaged in a vibrotactile detection task, in whichan integrator with a similarly short time constant provided agood match between the observed behavioral results and therecorded single-unit activity (Stüttgen and Schwarz 2010).The behavioral task was designed such that the animals had a
short window in which to respond to the onset of the stimulus inorder to receive a water reward on a given trial. This incentive torespond quickly was tempered with a relatively long time-outperiod in the event of a false alarm. As shown in Fig. 2D, this ledto a decreasing reaction time with increasing stimulus velocity,with a 52-ms difference in mean reaction times between thethreshold level deflection velocity and the maximum tested de-flection velocity. This represents a 17% decrease in reaction timesfrom the highest-velocity stimulus to the threshold-level stimulus.If the output of the integrator was assumed to represent the finalDV, it might be expected that the range of times at which theintegrated signal crossed the detection threshold would display asimilar 52-ms difference. Alternatively, if the output of the inte-grator is instead assumed to represent an early stage of the deci-sion making process, it might be expected that the stronger, fastersignals would continue to propagate more quickly. In this case, thepercent difference in neural reaction times would be expected tomatch, as opposed to the raw difference. Indeed, as shown in Fig.5E, the measured reaction times match much more closely inpercent change (16% change in the model reaction times) than inabsolute terms. However, studies in the somatosensory (Luna etal. 2005) and visual (Cook and Maunsell 2002; Chen et al. 2006)systems of primates have estimated integration time constants inthe hundreds of milliseconds with a similar exponentially leakingintegrator of primary sensory information. The possibility remainsthat animals in our task could be integrating information over asimilarly long timescale. Our simulations showed that doing sowould both increase and spread out the neural reaction times,leading to a much closer match in the absolute latencies, but at theexpense of accuracy in predicting the response probabilities.Taken together, the results here show that the behavioral per-
formance of the animal in simple tasks is well predicted bymeasurements of spatiotemporal cortical activation in parallelexperiments in the anesthetized animal, despite the likely differ-ences related to brain state. The approach further provides apotential framework for the evaluation of spatiotemporal corticalsignaling in more complex tasks that require discriminabilitybetween disparate sensory inputs, or for tasks that require morecomplex combinations of detection and discrimination.
ACKNOWLEDGMENTS
The authors thank Cornelius Schwarz for assistance in designing thebehavioral experiments as well as for feedback during the preparation of themanuscript. We also thank Clare Gollnick and He Zheng for valuable discus-sions throughout the project.
GRANTS
This work was supported by National Institute of Neurological Disordersand Stroke Grant 2R01-NS-048285 to G. B. Stanley. D. R. Ollerenshaw issupported by National Institutes of Health Ruth L. Kirschstein NationalResearch Service Award F31-NS-074797. B. A. Bari received support from aGeorgia Institute of Technology Petit Undergraduate Research Scholarship anda President’s Undergraduate Research Award. D. C. Millard is supported by aNational Science Foundation Graduate Research Fellowship.
DISCLOSURES
No conflicts of interest, financial or otherwise, are declared by the author(s).
AUTHOR CONTRIBUTIONS
Author contributions: D.R.O., L.E.O., Q.W., and G.B.S. conception anddesign of research; D.R.O., B.A.B., D.C.M., L.E.O., and Q.W. performedexperiments; D.R.O. and B.A.B. analyzed data; D.R.O., B.A.B., Q.W., andG.B.S. interpreted results of experiments; D.R.O. prepared figures; D.R.O. andG.B.S. drafted manuscript; D.R.O., B.A.B., D.C.M., L.E.O., Q.W., and G.B.S.edited and revised manuscript; D.R.O., B.A.B., D.C.M., L.E.O., Q.W., andG.B.S. approved final version of manuscript.
REFERENCES
Adibi M, Arabzadeh E. A comparison of neuronal and behavioral detectionand discrimination performances in rat whisker system. J Neurophysiol 105:356–365, 2011.
Adibi M, Diamond ME, Arabzadeh E. Behavioral study of whisker-medi-ated vibration sensation in rats. Proc Natl Acad Sci USA 109: 971–976,2012.
Ahissar E, Sosnik R, Haidarliu S. Transformation from temporal to ratecoding in a somatosensory thalamocortical pathway. Nature 406: 302–306,2000.
Berg RW, Kleinfeld D. Rhythmic whisking by rat: retraction as well asprotraction of the vibrissae is under active muscular control. J Neurophysiol89: 104–117, 2003.
Berger T, Borgdorff A, Crochet S, Neubauer FB, Lefort S, Fauvet B,Ferezou I, Carleton A, Lüscher HR, Petersen CCH. Combined voltageand calcium epifluorescence imaging in vitro and in vivo reveals subthresh-old and suprathreshold dynamics of mouse barrel cortex. J Neurophysiol 97:3751–3762, 2007.
Bermejo R, Vyas A, Zeigler HP. Topography of rodent whisking. I. Two-dimensional monitoring of whisker movements. Somatosens Motor Res 19:341–346, 2002.
Birdwell JA, Solomon JH, Thajchayapong M, Taylor MA, Cheely M,Towal RB, Conradt J, Hartmann MJZ. Biomechanical models for radialdistance determination by the rat vibrissal system. J Neurophysiol 98:2439–2455, 2007.
Boloori AR, Jenks RA, Desbordes G, Stanley GB. Encoding and decodingcortical representations of tactile features in the vibrissa system. J Neurosci30: 9990–10005, 2010.
Brecht M, Preilowski B, Merzenich MM. Functional architecture of themystacial vibrissae. Behav Brain Res 84: 81–97, 1997.
Britten KH, Shadlen MN, Newsome WT, Movshon JA. The analysis ofvisual motion: a comparison of neuronal and psychophysical performance.J Neurosci 12: 4745–4765, 1992.
Carpenter R. Contrast, probability, and saccadic latency: evidence for inde-pendence of detection and decision. Curr Biol 14: 1576–1580, 2004.
Carvell GE, Simons D. Biometric analyses of vibrissal tactile discriminationin the rat. J Neurosci 10: 2638–2348, 1990.
Carvell GE, Simons DJ. Task- and subject-related differences in sensorimotorbehavior during active touch. Somatosens Motor Res 12: 1–9, 1995.
Castro-Alamancos MA. Absence of rapid sensory adaptation in neocortexduring information processing states. Neuron 41: 455–464, 2004.
Chen Y, Geisler WS, Seidemann E. Optimal temporal decoding of neuralpopulation responses in a reaction-time visual detection task. J Neurophysiol99: 1366–1379, 2008.
Cook EP, Maunsell JHR. Dynamics of neuronal responses in macaque MTand VIP during motion detection. Nat Neurosci 5: 985–994, 2002.
Crochet S, Petersen CCH. Correlating whisker behavior with membranepotential in barrel cortex of awake mice. Nat Neurosci 9: 608–610, 2006.
Curtis JC, Kleinfeld D. Phase-to-rate transformations encode touch in corticalneurons of a scanning sensorimotor system. Nat Neurosci 12: 492–501,2009.
Derdikman D, Hildesheim R, Ahissar E, Arieli A, Grinvald A. Imagingspatiotemporal dynamics of surround inhibition in the barrels somatosensorycortex. J Neurosci 23: 3100–3105, 2003.
Diamond ME, von Heimendahl M, Knutsen PM, Kleinfeld D, Ahissar E.“Where” and “what” in the whisker sensorimotor system. Nat Rev Neurosci9: 601–612, 2008.
Fanselow EE, Nicolelis MAL. Behavioral modulation of tactile responses inthe rat somatosensory system. J Neurosci 19: 7603–7316, 1999.
489DETECTION IN VIBRISSA PATHWAY
J Neurophysiol • doi:10.1152/jn.00004.2012 • www.jn.org
at Em
ory University on A
ugust 3, 2012http://jn.physiology.org/
Dow
nloaded from
Ferezou I, Bolea S, Petersen CCH. Visualizing the cortical representation ofwhisker touch: voltage-sensitive dye imaging in freely moving mice. Neuron50: 617–629, 2006.
Ferezou I, Haiss F, Gentet LJ, Aronoff R, Weber B, Petersen CCH.Spatiotemporal dynamics of cortical sensorimotor integration in behavingmice. Neuron 56: 907–923, 2007.
Fridman GY, Blair HT, Blaisdell AP, Judy JW. Perceived intensity ofsomatosensory cortical electrical stimulation. Exp Brain Res 203: 499–515,2010.
Gerdjikov TV, Bergner CG, Stüttgen MC, Waiblinger C, Schwarz C.Discrimination of vibrotactile stimuli in the rat whisker system: behaviorand neurometrics. Neuron 65: 530–540, 2010.
Gold JI, Shadlen MN. The neural basis of decision making. Annu RevNeurosci 30: 535–574, 2007.
Gold JI, Shadlen MN. Neural computations that underlie decisions aboutsensory stimuli. Trends Cogn Sci 5: 10–16, 2001.
Grinvald A, Hildesheim R. VSDI: a new era in functional imaging of corticaldynamics. Nat Rev Neurosci 5: 874–885, 2004.
Guic-Robles E, Valdivieso C, Guajardo G. Rats can learn a roughnessdiscrimination using only their vibrissal system. Behav Brain Res 31:285–289, 1989.
Gustafson JW, Felbain-Keramidas SL. Behavioral and neural approaches tothe function of the mystacial vibrissae. Psychol Bull 84: 477–488, 1977.
Hartmann MJ, Johnson NJ, Towal RB, Assad C.Mechanical characteristicsof rat vibrissae: resonant frequencies and damping in isolated whiskers andin the awake behaving animal. J Neurosci 23: 6510–6519, 2003.
Hayar A, Bryant JL, Boughter JD, Heck DH. A low-cost solution tomeasure mouse licking in an electrophysiological setup with a standardanalog-to-digital converter. J Neurosci Methods 153: 203–207, 2006.
Hentschke H, Haiss F, Schwarz C. Central signals rapidly switch tactileprocessing in rat barrel cortex during whisker movements. Cereb Cortex 16:1142–1156, 2006.
Huk AC, Shadlen MN. Neural activity in macaque parietal cortex reflectstemporal integration of visual motion signals during perceptual decisionmaking. J Neurosci 25: 10420–10436, 2005.
Hutson K, Masterton R. The sensory contribution of a single vibrissa’scortical barrel. J Neurophysiol 56: 1196–1223, 1986.
Jacobs AL, Fridman G, Douglas RM, Alam NM, Latham P. Ruling out andruling in neural codes. Proc Natl Acad Sci USA 106: 5936–5941, 2009.
Jenks RA, Vaziri A, Boloori AR, Stanley GB. Self-motion and the shapingof sensory signals. J Neurophysiol 103: 2195–2207, 2010.
Khatri V, Bermejo R, Brumberg JC, Keller A, Zeigler HP.Whisking in air:encoding of kinematics by trigeminal ganglion neurons in awake rats. JNeurophysiol 101: 1836–1846, 2009.
Knutsen PM, Derdikman D, Ahissar E. Tracking whisker and head move-ments in unrestrained behaving rodents. J Neurophysiol 93: 2294–2301,2005.
Krupa DJ, Matell MS, Brisben AJ, Oliveira LM, Nicolelis MAL. Behav-ioral properties of the trigeminal somatosensory system in rats performingwhisker-dependent tactile discriminations. J Neurosci 21: 5752–5763, 2001.
Krupa DJ, Wiest MC, Shuler MG, Laubach M, Nicolelis MAL. Layer-specific somatosensory cortical activation during active tactile discrimina-tion. Science 304: 1989–1992, 2004.
Lee SH, Simons DJ. Angular tuning and velocity sensitivity in differentneuron classes within layer 4 of rat barrel cortex. J Neurophysiol 91:223–229, 2004.
Leiser SC, Moxon KA. Responses of trigeminal ganglion neurons duringnatural whisking behaviors in the awake rat. Neuron 53: 117–133, 2007.
Lippert MT, Takagaki K, Xu W, Huang X, Wu JY. Methods for voltage-sensitive dye imaging of rat cortical activity with high signal-to-noise ratio.J Neurophysiol 98: 502–512, 2007.
Luna R, Hernández A, Brody CD, Romo R. Neural codes for perceptualdiscrimination in primary somatosensory cortex. Nat Neurosci 8: 1210–1219, 2005.
Mazurek ME, Roitman JD, Ditterich J, Shadlen MN. A role for neuralintegrators in perceptual decision making. Cereb Cortex 13: 1257–1269,2003.
Mehta SB, Whitmer D, Figueroa R, Williams BA, Kleinfeld D. Activespatial perception in the vibrissa scanning sensorimotor system. PLoS Biol5: e15, 2007.
Milani H, Steiner H, Huston JP. Analysis of recovery from behavioralasymmetries induced by unilateral removal of vibrissae in the rat. BehavNeurosci 103: 1067–1074, 1989.
Mirabella G, Battiston S, Diamond ME. Integration of multiple-whiskerinputs in rat somatosensory cortex. Cereb Cortex 11: 164–170, 2001.
Neimark MA, Andermann ML, Hopfield JJ, Moore CI. Vibrissa resonanceas a transduction mechanism for tactile encoding. J Neurosci 23: 6499–6509, 2003.
O’Connor DH, Clack NG, Huber D, Komiyama T, Myers EW, SvobodaK. Vibrissa-based object localization in head-fixed mice. J Neurosci 30:1947–1967, 2010a.
O’Connor DH, Peron SP, Huber D, Svoboda K. Neural activity in barrelcortex underlying vibrissa-based object localization in mice. Neuron 67:1048–1061, 2010b.
Paxinos G, Watson C. The Rat Brain in Stereotaxic Coordinates. San Diego,CA: Academic, 2007.
Petersen CCH. The functional organization of the barrel cortex. Neuron 56:339–355, 2007.
Petersen CCH, Grinvald A, Sakmann B. Spatiotemporal dynamics ofsensory responses in layer 2/3 of rat barrel cortex measured in vivo byvoltage-sensitive dye imaging combined with whole-cell voltage recordingsand neuron reconstructions. J Neurosci 23: 1298–1309, 2003a.
Petersen CCH, Hahn TTG, Mehta M, Grinvald A, Sakmann B. Interactionof sensory responses with spontaneous depolarization in layer 2/3 barrelcortex. Proc Natl Acad Sci USA 100: 13638–13643, 2003b.
Pinto DJ, Brumberg JC, Simons DJ. Circuit dynamics and coding strategiesin rodent somatosensory cortex. J Neurophysiol 83: 1158–1156, 2000.
Poulet JFA, Fernandez LMJ, Crochet S, Petersen CCH. Thalamic controlof cortical states. Nat Neurosci 15: 370–372, 2012.
Ritt JT, Andermann ML, Moore CI. Embodied information processing:vibrissa mechanics and texture features shape micromotions in activelysensing rats. Neuron 57: 599–613, 2008.
Roitman JD, Shadlen MN. Response of neurons in the lateral intraparietalarea during a combined visual discrimination reaction time task. J Neurosci22: 9475–9489, 2002.
Schall JD, Thompson KG. Neural selection and control of visually guidedeye movements. Annu Rev Neurosci 22: 241–259, 1999.
Schwarz C, Hentschke H, Butovas S, Haiss F, Stüttgen MC, GerdjikovTV, Bergner CG, Waiblinger C. The head-fixed behaving rat—proceduresand pitfalls. Somatosens Motor Res 27: 131–148, 2010.
Shadlen MN, Newsome WT. Neural basis of a perceptual decision in theparietal cortex (area LIP) of the rhesus monkey. J Neurophysiol 86:1916–1936, 2001.
Shuler MG, Krupa DJ, Nicolelis MAL. Integration of bilateral whiskerstimuli in rats: role of the whisker barrel cortices. Cereb Cortex 12: 86–97,2002.
Smith PL, Ratcliff R. Psychology and neurobiology of simple decisions.Trends Neurosci 27: 161–168, 2004.
Sosnik R, Haidarliu S, Ahissar E. Temporal frequency of whisker move-ment. I. Representations in brain stem and thalamus. J Neurophysiol 86:339–353, 2001.
Stüttgen MC, Rüter J, Schwarz C. Two psychophysical channels of whiskerdeflection in rats align with two neuronal classes of primary afferents. JNeurosci 26: 7933–7941, 2006.
Stüttgen MC, Schwarz C. Integration of vibrotactile signals for whisker-related perception in rats is governed by short time constants: comparison ofneurometric and psychometric detection performance. J Neurosci 30: 2060–2069, 2010.
Stüttgen MC, Schwarz C. Psychophysical and neurometric detection perfor-mance under stimulus uncertainty. Nat Neurosci 11: 1091–1099, 2008.
Temereanca S, Brown EN, Simons DJ. Rapid changes in thalamic firingsynchrony during repetitive whisker stimulation. J Neurosci 28: 11153–11164, 2008.
Towal RB, Quist BW, Gopal V, Solomon JH, Hartmann MJZ. Themorphology of the rat vibrissal array: a model for quantifying spatiotempo-ral patterns of whisker-object contact. PLoS Comput Biol 7: e1001120,2011.
Von Heimendahl M, Itskov PM, Arabzadeh E, Diamond ME. Neuronalactivity in rat barrel cortex underlying texture discrimination. PLoS Biol 5:e305, 2007.
Wang Q, Webber RM, Stanley GB. Thalamic synchrony and the adaptivegating of information flow to cortex. Nat Neurosci 13: 1534–1541, 2010.
Wolfe J, Hill DN, Pahlavan S, Drew PJ, Kleinfeld D, Feldman DE. Texturecoding in the rat whisker system: slip-stick versus differential resonance.PLoS Biol 6: e215, 2008.
Yu C, Derdikman D, Haidarliu S, Ahissar E. Parallel thalamic pathways forwhisking and touch signals in the rat. PLoS Biol 4: e124, 2006.
490 DETECTION IN VIBRISSA PATHWAY
J Neurophysiol • doi:10.1152/jn.00004.2012 • www.jn.org
at Em
ory University on A
ugust 3, 2012http://jn.physiology.org/
Dow
nloaded from