detention alternatives project— using jdai strategies
TRANSCRIPT
JoAnn Ray August, 2008
1
Detention Alternatives Project—
Using JDAI Strategies
Spokane Juvenile Court
Year 3, Evaluation Report
3. General Background
The Detention Alternative Project (DAP), a project of the Spokane Juvenile Court, is in its third
year of operation. The goals of the Project are to deinstitutionalize status offenders, to decrease
disproportionate minority confinement, to eliminate double bunking in detention, and maintain
community safety and youth accountability. DAP will further develop the continuum of detention
alternatives available to the court, which currently include, Community Service, Electronic
Monitoring and Structured Alternative Confinement (school and electronic monitoring). With this
grant, the court has developed an Evening Program for probation violators, and a Weekend
Program for status offenders in violation of their court orders. During the second year and third
years, the grant proposal for DAP was broadened to include all Juvenile Court alternatives to
detention programs. During Year 3 the emphasis is upon maintaining the program and locating
continuation funding for the Evening and Weekend Programs.
GJJAC currently funds 1 part time (30 hours a week) Work Crew Officer and 1 part time (15 hours a
week) clerical support staff. In addition, GJJAC funds part time contracted program support positions
of a minority mentor (4.5 hours a week) and a family counselor (3 hours a week).
The County funds 4 FTE Juvenile Corrections Officers working in the Evening, Weekend and
Community Service Programs. The County also funds 4 FTE Probation Officers positions for
Electronic Monitoring. In addition, teachers, teacher aides and a principal are provided by E.S.D. #101
for the Structured Alternative Confinement (SAC) Program.
The Weekend and The Evening Program provide the court with additional alternatives to
detention and youth, and an opportunity to gain skills. Low, moderate and high risk youth who
have violated their probation, but who have not committed a new offense; and Status Offenders,
including, Truants, At Risk Youth and Children in Need of Services, who are in contempt of
court orders, are targeted for services. Instead of detention, these youth remain in the

JoAnn Ray August, 2008
2
community and are held accountable for their behavior by attending either an Evening or
Weekend Program. DAP is designed to teach skills and provide support.
The Evening Program provides Tutoring/Mentoring, Skills Training, Recreation, Goal Setting,
components of Evidence-based Programs, Girls Groups, Minority Mentoring, the Family
Component and Dinner for youth who have violated their probation. Other programming needs,
such as Chemical Dependency Education, are addressed depending upon participating youth.
For Status Offenders, the Weekend Program includes Tutoring, Skills Training, Minority Mentoring, the
Family Component, Work Crew and Lunch. The project relies upon community as well as court
services.
DAP uses components of “evidence based strategies” such as Motivational Interviewing and
Mentoring.
The project is based on the research findings that indicate “get tough” approaches, such as
detention, are less successful than alternative strategies in deterring criminal behavior.
JoAnn Ray August, 2008
3
4. Summary of Previous Evaluations
First Year Summary
During the first year the project served 153 Probation Violators, including 36 minority youth, saving 533 detention days.
The project served 135 Status Offenders.
Probation Violators successfully completed 74% of their sentences and Status Offenders, 59%.
Youth and parents rated their satisfaction with program highly, think the project was helpful, should be continued, and that it was preferable to detention.
Respondents report higher rates of school attendance, satisfaction with family relationships, and report that the youth was better off since DAP.
Comments indicate that the programming of DAP was valuable in helping the youth learn s/he has a choice in making decisions.
Second Year Summary
During the second grant year, the project reduced detention bed days by 3407, served 751 Probation Violators and 606 Status Offenders. Among those served, there were 21.7% minority youth.
The Recidivism Study suggested that there may be a reduction in court Referrals, Convictions, and Felony Convictions in the year following DAP services compared with the previous year for Probation Violation youth.
There may also be a reduction in the Contempt of Court Changes during the follow-up year when compared to the year before for Truants,
Youth and parents rated their satisfaction with program highly, think the project was helpful, should be continued, and that it is preferable to detention.
Respondents report higher rates of school attendance, satisfaction with family relationships, and report that the youth is better off since DAP.
Parents/youth think information provided by the Family Component will be useful.
Comments indicate that the programming of DAP is valuable in helping the youth learn s/he has a choice in making decisions.
5. Evaluation Methodology
The court has contracted with JoAnn Ray to provide the evaluation. The evaluation design for
the third year is a continuation and modification of the first and second years’ evaluation
designs.
The evaluation design includes measuring recidivism and youth and parent satisfaction, in
addition to measuring numbers of youth served, days of detention saved, and percentage
changes. The evaluator developed a Satisfaction Questionnaire which measures program
satisfaction as well as providing information on the current status of the youth. The court
JoAnn Ray August, 2008
4
personnel designed and administered a questionnaire for the Family Component and also an
Exit Questionnaire for youth.
Data collection procedures were set up by the court to collect data necessary for project
operations as well as evaluation. These data are being used as descriptive and to measure
project targets, such as demographic characteristics of youth, number of youth served, and
days in the program. Court data collection has been on going since project implementation.
Recidivism is measured for the Probation Violator’s group by the comparison of the number of
Probation Violations during the year before, to a year after DAP services. For Status Offenders,
Contempt of Court charges are compared a year before, to a year after project services. The
number of court Referrals for delinquencies, number of Convictions, and number of Felony
Convictions are compared a year before, to a year after the project services, for both Status
Offenders and Probation Violators.
The evaluator contracted with Bonnie Coate, a retired MSW with experience dealing with
troubled youth, to complete telephone calls to youth and parents of both programs.
JCS records were obtained to provide information on the youth’s delinquency, Probation
Violation and Contempt of Court actions. Truancy action information was not available from
JUVIS records, and SCOMIS records, which contain this information, were also requested.
Adult records were obtained for youth who turned 18 prior to the year’s post follow-up.
Data collection would not have been possible for this project without the help of court staff,
specifically Colleen Smith, who patiently completed most of the searches, and Margaret Martin,
who explained the new forms and procedures.
6. Process Evaluation
Description of the Program
While all JDAI programs of the Spokane Juvenile Court are included in the grant to indicate the
full extent of the courts’ activities in removing juveniles from detention, the emphasis of the
evaluation will be upon the new projects, the Weekend Program and Evening Program.
During the third year, the project continued project operations in the Evening and Weekend
Programs, minority mentoring, girls group, and family services, and has completed
arrangements for program continuation, both for the Evening and Weekend Programs. The
Evening Program runs year round while the Weekend Program is scheduled to coincide with the
school year.
The project continues to be well organized and provides services as designated by the grant.
Referrals to DAP are initiated by the Program Staff for the Probation Violation group and by the
Judges for the Status Offender group.
Statistics related specifically to these two programs, the Evening and Weekend Programs,
indicate that during Year 3, the project had 332 Probation Violation Referrals, 79 ARY Referrals,
74 Truancy Referrals and 1 Other Referral (Total 154).
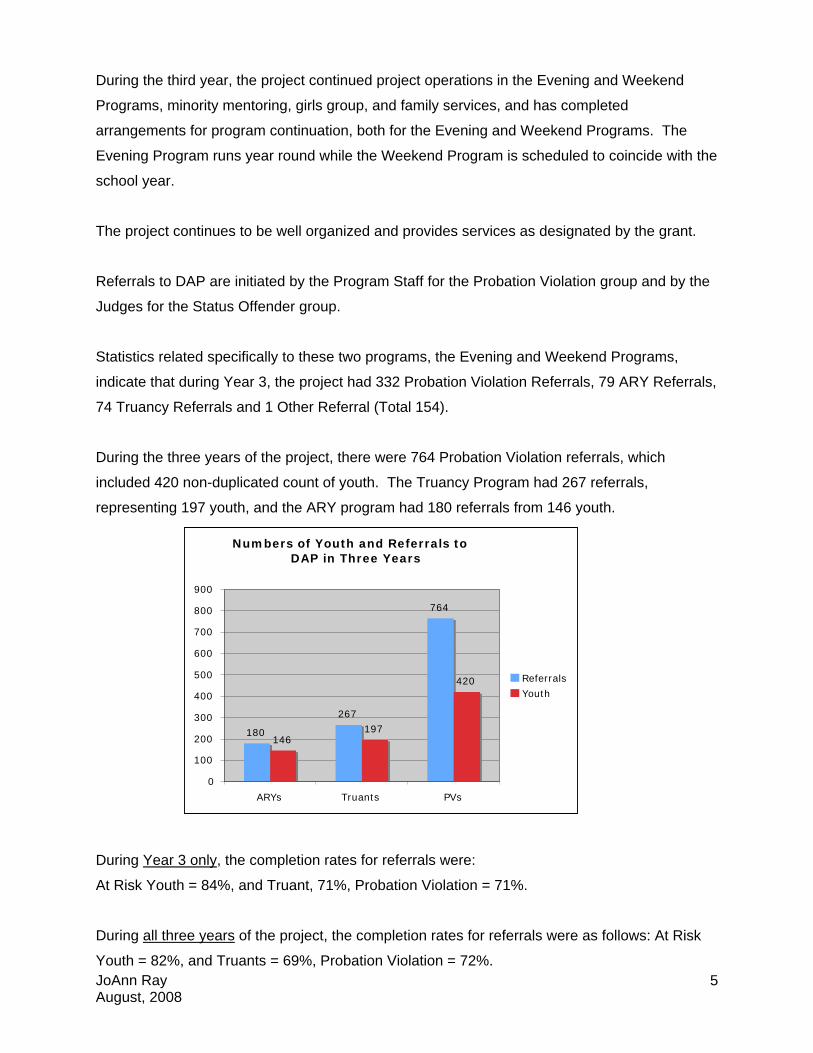
During the three years of the project, there were 764 Probation Violation referrals, which
included 420 non-duplicated count of youth. The Truancy Program had 267 referrals,
representing 197 youth, and the ARY program had 180 referrals from 146 youth.
Numbers of Youth and Referrals to DAP in Three Years
180
267
764
146197
420
0
100
200
300
400
500
600
700
800
900
ARYs Truants PVs
Referrals
Youth
During Year 3 only, the completion rates for referrals were:
At Risk Youth = 84%, and Truant, 71%, Probation Violation = 71%.
During all three years of the project, the completion rates for referrals were as follows: At Risk
Youth = 82%, and Truants = 69%, Probation Violation = 72%. JoAnn Ray August, 2008
5

Percent of Referrals Completed During Three Years
82
64
72
18
36
28
0
10
20
30
40
50
60
70
80
90
ARYs Truants PVs
Yes
No
Youth are ordered to the programs for varying lengths of time. The mean number of days
ordered for ARY referrals was 1.7, for Truancy referrals, 2.1, and for Probation Violators, 4.1.
The average number of days in the program by type of youth was: 1.4 for ARY youth, 1.5 for
Truancy youth, and 2.9 for Probation Violators. Please see Appendix, Table 2.
Average Number of Days Ordered and Served During Three Years
1.67
2.14
4.13
1.37 1.5
2.97
0
0.5
1
1.5
2
2.5
3
3.5
4
4.5
ARYs Truants PVs
Ordered
Served
Some youth were referred more than once to DAP during the three years. Twenty percent of
the ARYs, 30% of the Truants were referred a second or third time, and 42% Probation Violation
JoAnn Ray August, 2008
6

JoAnn Ray August, 2008
7
youth received multiple referrals. At times it might be necessary for several referrals as the
projects that keep a youth for only a few days. Please see Appendix, Table 3.
The Minority Mentoring component of the project was formally institutionalized during the
second grant year and continued through the third year. The court contracted with Robert
Jackson, an African American, to provide support and mentoring to the minority youth
participating in DAP.
The Family Component was developed during the second grant year and continued during the
third year. The court contracted with Harry Rosenkrantz, a licensed mental health counselor, to
provide the Family Educational/Counseling component for the Evening and Weekend Programs.
A total of 106 parents/ guardians attended during the third year, bring the total for the project to
168 parents/guardians.
During the second year of the grant, probation officers worked individually with the girls, while in
the third year one of the court staff conducted a Girl’s Group. Girls attending the Evening
Reporting Program and other court-involved girls were welcome. Sixty-nine girls attended the
Girls Group. In addition, the court staff continued to work individually with girls.
Court staff has developed a data collection and reporting system that provides needed
statistical information for the DAP Project, the court and for the evaluation. The current
coordinator of the program, David Sattler, has expressed considerable interest in the evaluation,
and has been extremely helpful and cooperative to work with. Colleen Smith has patiently
provided data for evaluation in a timely manner.
The project continues to involve students from Eastern Washington University and Gonzaga in
the program. This provides students with a valuable learning opportunity, and the court with
additional personnel to enhance the program activities.
Community agencies that were involved with the Evening Program during the third grant year,
include: the YMCA, Lutheran Social Services, Spokane Mental Health, Job Corps, Community
Colleges of Spokane, Substance Abuse Council, Solid Waste Systems, Girls Scouts of America,
Career Path Services, Spokane Regional Health District, Prevention Center, Museum of Arts
and Culture and Teen-Aide.

JoAnn Ray August, 2008
8
Several JDAI community and juvenile justice committees, including the Executive Leadership
Committee, Community Advisory Committee, the Racial Disproportionality Committee, and the
Juvenile Court Sub-Committees, provided support for the project.
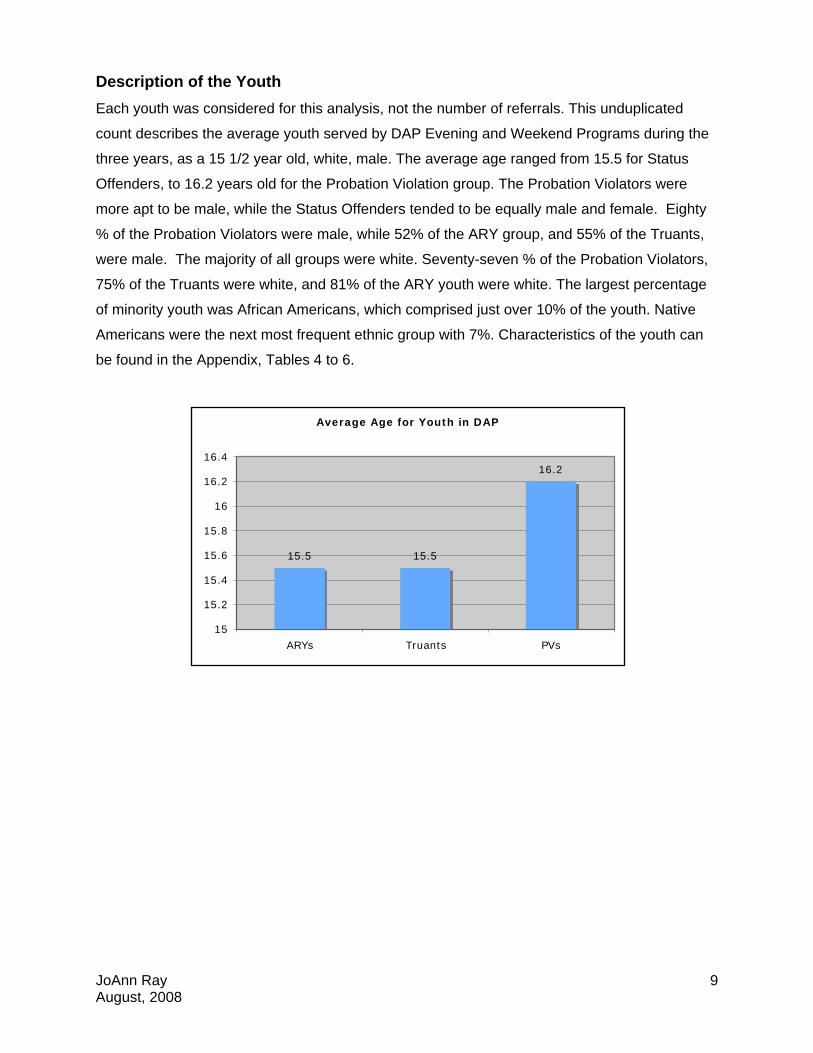
Description of the Youth
Each youth was considered for this analysis, not the number of referrals. This unduplicated
count describes the average youth served by DAP Evening and Weekend Programs during the
three years, as a 15 1/2 year old, white, male. The average age ranged from 15.5 for Status
Offenders, to 16.2 years old for the Probation Violation group. The Probation Violators were
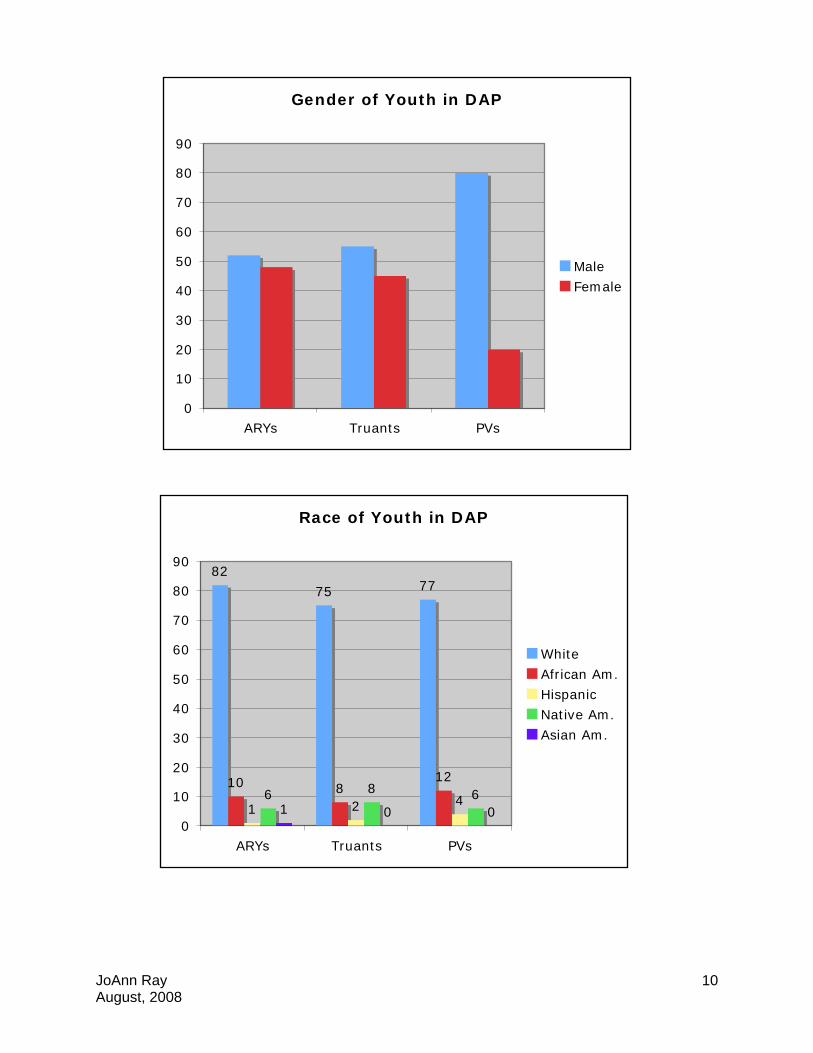
more apt to be male, while the Status Offenders tended to be equally male and female. Eighty
% of the Probation Violators were male, while 52% of the ARY group, and 55% of the Truants,
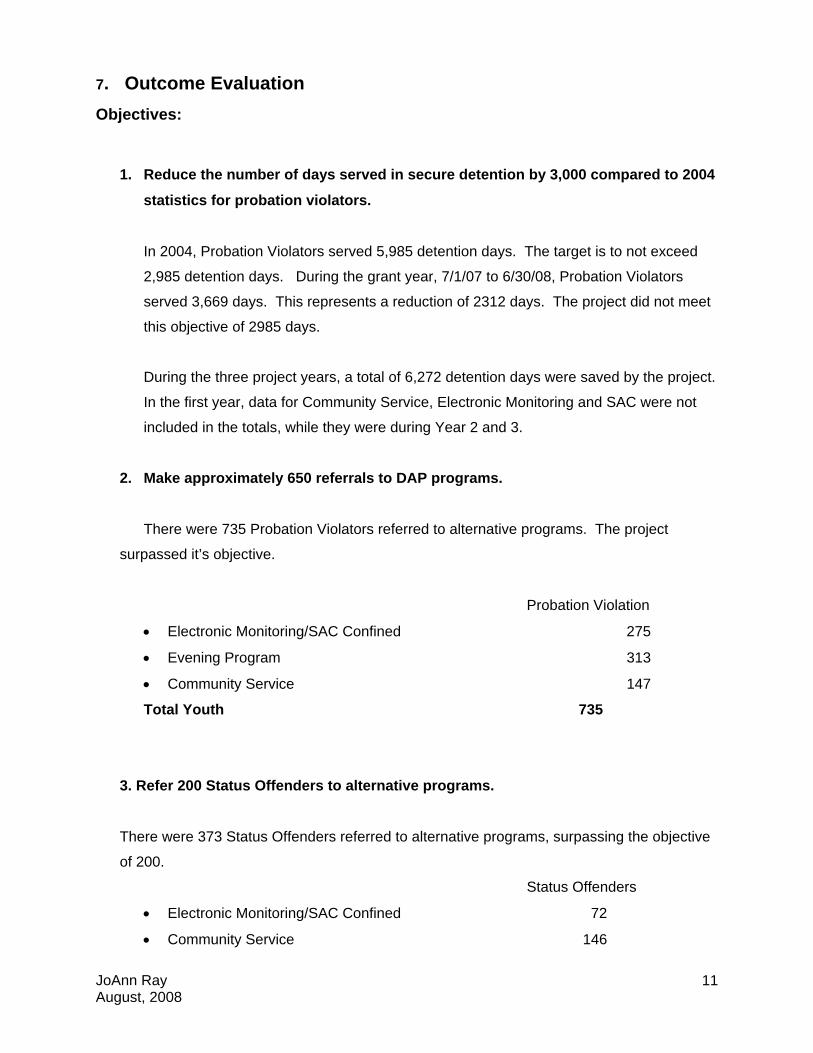
were male. The majority of all groups were white. Seventy-seven % of the Probation Violators,
75% of the Truants were white, and 81% of the ARY youth were white. The largest percentage
of minority youth was African Americans, which comprised just over 10% of the youth. Native
Americans were the next most frequent ethnic group with 7%. Characteristics of the youth can
be found in the Appendix, Tables 4 to 6.
Average Age for Youth in DAP
15.5 15.5
15
15.2
15.4
15.6
15.8
16
16.2
16.4
ARYs Truants
16.2
PVs
JoAnn Ray August, 2008
9
Gender of Youth in DAP
0
10
20
30
40
50
60
70
80
90
ARYs Truants PVs
Male
Female
Race of Youth in DAP
82
75 77
10 812
1 2 46 8 61 0 0
0
10
20
30
40
50
60
70
80
90
ARYs Truants PVs
White
African Am.
Hispanic
Native Am.
Asian Am.
JoAnn Ray August, 2008
10
JoAnn Ray August, 2008
11
7. Outcome Evaluation
Objectives:
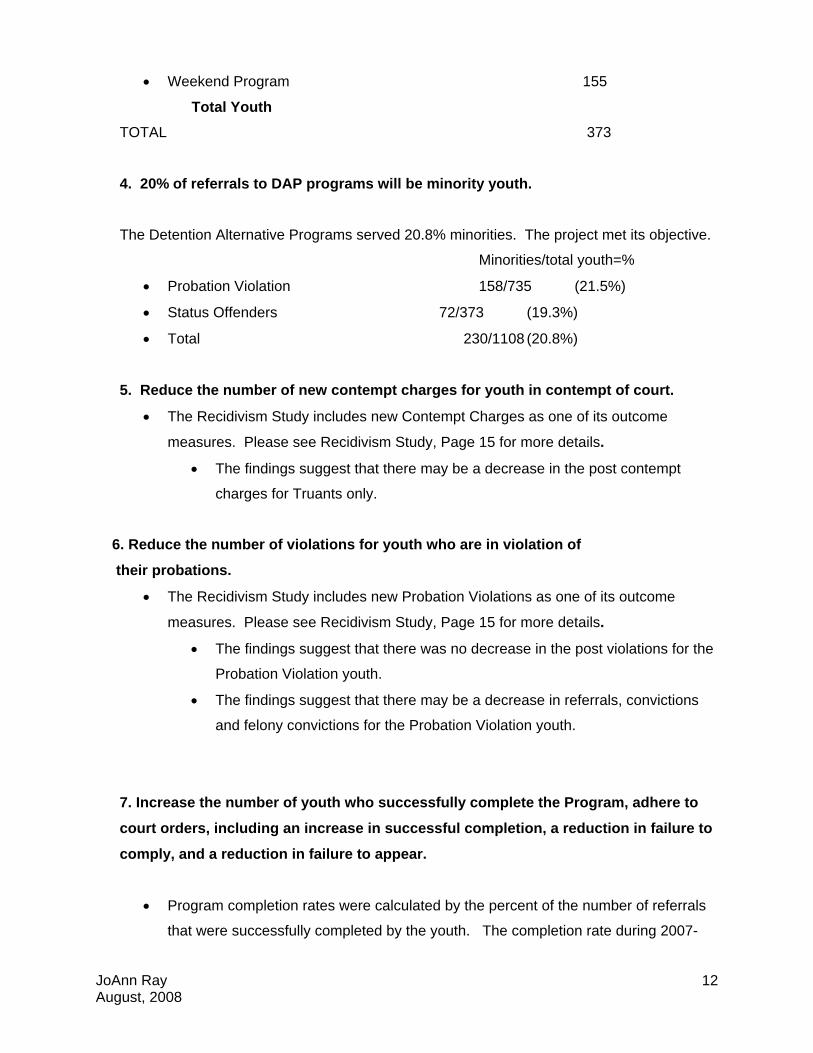
1. Reduce the number of days served in secure detention by 3,000 compared to 2004
statistics for probation violators.
In 2004, Probation Violators served 5,985 detention days. The target is to not exceed
2,985 detention days. During the grant year, 7/1/07 to 6/30/08, Probation Violators
served 3,669 days. This represents a reduction of 2312 days. The project did not meet
this objective of 2985 days.
During the three project years, a total of 6,272 detention days were saved by the project.
In the first year, data for Community Service, Electronic Monitoring and SAC were not
included in the totals, while they were during Year 2 and 3.
2. Make approximately 650 referrals to DAP programs.
There were 735 Probation Violators referred to alternative programs. The project
surpassed it’s objective.
Probation Violation
Electronic Monitoring/SAC Confined 275
Evening Program 313
Community Service 147
Total Youth 735
3. Refer 200 Status Offenders to alternative programs.
There were 373 Status Offenders referred to alternative programs, surpassing the objective
of 200.
Status Offenders
Electronic Monitoring/SAC Confined 72
Community Service 146
JoAnn Ray August, 2008
12
Weekend Program 155
Total Youth
TOTAL 373
4. 20% of referrals to DAP programs will be minority youth.
The Detention Alternative Programs served 20.8% minorities. The project met its objective.
Minorities/total youth=%
Probation Violation 158/735 (21.5%)
Status Offenders 72/373 (19.3%)
Total 230/1108 (20.8%)
5. Reduce the number of new contempt charges for youth in contempt of court.
The Recidivism Study includes new Contempt Charges as one of its outcome
measures. Please see Recidivism Study, Page 15 for more details.
The findings suggest that there may be a decrease in the post contempt
charges for Truants only.
6. Reduce the number of violations for youth who are in violation of
their probations.
The Recidivism Study includes new Probation Violations as one of its outcome
measures. Please see Recidivism Study, Page 15 for more details.
The findings suggest that there was no decrease in the post violations for the
Probation Violation youth.
The findings suggest that there may be a decrease in referrals, convictions
and felony convictions for the Probation Violation youth.
7. Increase the number of youth who successfully complete the Program, adhere to
court orders, including an increase in successful completion, a reduction in failure to
comply, and a reduction in failure to appear.
Program completion rates were calculated by the percent of the number of referrals
that were successfully completed by the youth. The completion rate during 2007-

2008 was similar to that of last year and the Status Offenders were higher than Year
1. Please see Tables 1 of the Appendix for details.
% Referrals
Completed
Probation Violations 70.8
Truancy 71.4
ARY 83.6
8. Elicit positive ratings of the project by parents and youth.
Telephone calls were completed to youth and their families to elicit opinions on
DAP. Please see the Satisfaction Survey, Page 20 and the Appendix, Tables 7
to 25 for details.
o 91% of the respondents thought the program should be continued.
o 85% of the respondents prefer the DAP program to Detention.
o Full time school attendance increased from 37% to 57% after DAP.
o 52% of the respondents thought family relationships have improved since
DAP.
o 66% feel the youth is better off now than before the program
Percent of Targetted Obejctive Reached
77.1
113
187
0
20
40
60
80
100
120
140
160
180
200
DetentionDays
Refer PV Refer Stat Off
104
Minoirty
JoAnn Ray August, 2008
13
JoAnn Ray August, 2008
14
Detention Alternative Program Recidivism Study
Methodology
A recidivism study has been completed for youth who have violated their probation, and for
Status Offenders in Contempt of Court, both for At Risk Youth and Truancy. Outcome variables
studied include: (1) the numbers of Probation Violations or Contempt of Court Charges, (2)
Referrals, (3) Convictions and (4) Felony Convictions. The rates of these outcome variables
were compared during the year before DAP to a year after DAP intervention.
Although Pre-Project samples were collected to provide comparison groups for the DAP youth,
these samples differed considerably in demographic characteristics and in the values of
variables in the baseline period. A comparison group is useful only if it is similar to the
intervention group. The comparison groups were reluctantly dropped from the study. A before-
after comparison cannot provide strong findings, however, comparisons with a dissimilar sample
would provide erroneous statistical findings and conclusions.
Sampling
Lists of youth referred to DAP during Year 1 and Year 2 were the source of the sample. The
first DAP participation ordered, if there were two or more orders, was considered the target for
counting before and after incidents. For the second year, only youth who did not participate in
the project the year before were considered. All youth referred to the program were selected for
the sample.
Data Collection
JCS records were requested for the selected names. SCOMIS records were required to
provide data for Truancy contempt charges. Adult records were obtained to track their
behaviors for youth who turned 18 before the end of the post-year.
Outcome Measures
If the project were successful, we would expect that there would be a reduction in the recidivism
rates the year after the intervention when compared to rates the year before.
JoAnn Ray August, 2008
15
The definition of "recidivism" for this study is:
The comparison of the number of Contempt of Court charges, Probation Violations,
Referrals, Convictions and Felony Convictions one year before to one year after the
targeted referral to the project.
Analysis
Analysis was completed separately for each of the groups (ARY, Truancy and Probation
Violators). Comparisons of outcome variables were analyzed one year before to one year after
DAP, using the sample that included only youth who had completed the DAP intervention.
Since the purpose of the study is to determine whether DAP has any effect upon recidivism, it
was important that those youth who were included in the recidivism study received DAP. There
are a number of youth in the DAP sample who did not complete, or in some cases, even begin
the DAP, so they could not have received the intervention. These youth who did not complete
their DAP order(s) were excluded from the Pre-Post analyses.
Non-parametric statistical tests were selected because the nature of the data, small samples
and possible sampling issues. Test used: include: Frequencies, Chi Square, and Wilcoxon
Matched Pairs statistical test.
Methodological Issues
Recidivism is likely to be a weak outcome indicator for measuring this type of project.
Recidivism can at best be seen as a “long term” outcome with many possible factors
contributing to a change in a youth’s behavior. These might include factors related to the family,
school, community and maturation. Recidivism likely results from a combination of influences
and DAP may be one of these factors. In addition, a behavioral change is not instant. There
may also be a time delay between a change in attitude and a change in behavior. It is possible
that DAP may have an influence upon behavior, but tracking for one year is insufficient to show
the effects.
The definition of recidivism is always difficult, too. Court records show only those incidents in
which the youth were rearrested. We have no self-report data. The court’s processing of cases
JoAnn Ray August, 2008
16
includes plea bargaining, diversions, dismissing cases, etc. which confuse the definition of
conviction. Referrals are included in the studies to provide another measure of delinquent
behaviors in addition to Convictions.
There is a possible threat to validity from multiple treatment effects. The court has a number of
Detention Alternative options available for youths, including DAP, Electronic monitoring and
SAC. Some youth have attended DAP more than once, and some DAP youth were involved in
other programs. Some youth also were sentenced to Detention either before or after DAP. It is
unknown whether there is an interaction effect between the various types of dispositions, and
such a study is beyond the scope of this evaluation.
Recidivism studies were completed in spite of its measurement limitations. It is important that
these studies be cautiously interpreted and considered along with other evaluation findings
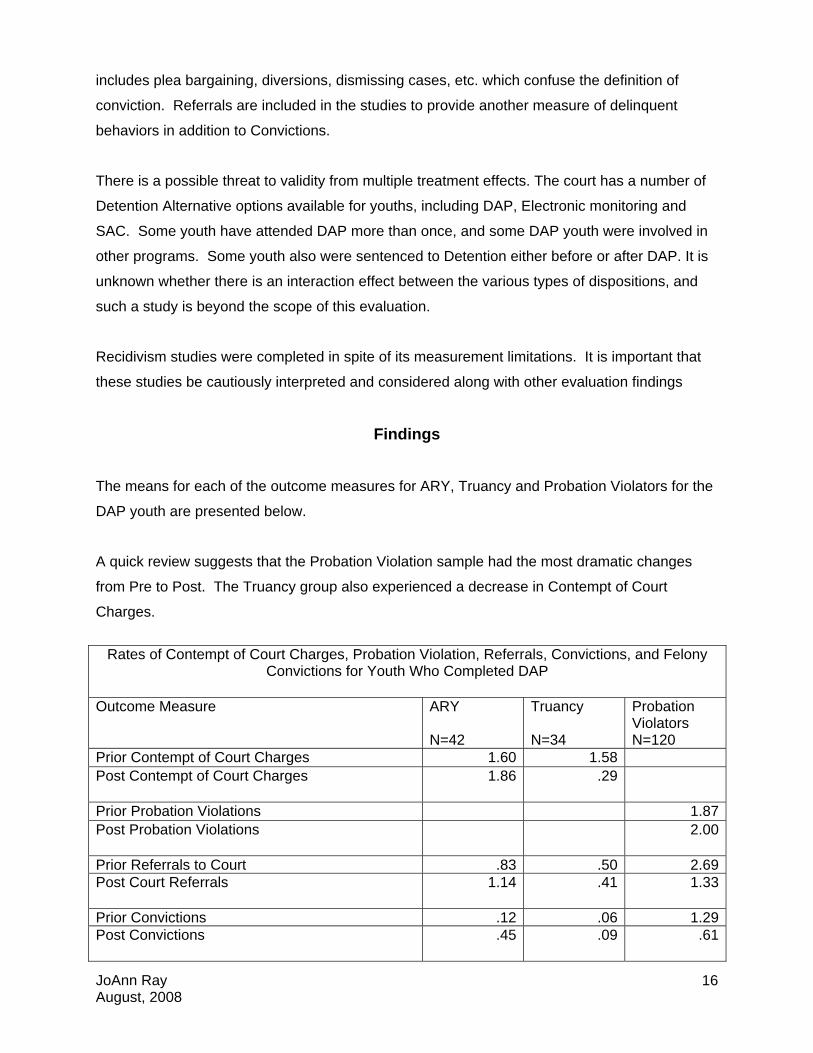
Findings
The means for each of the outcome measures for ARY, Truancy and Probation Violators for the
DAP youth are presented below.
A quick review suggests that the Probation Violation sample had the most dramatic changes
from Pre to Post. The Truancy group also experienced a decrease in Contempt of Court
Charges.
Rates of Contempt of Court Charges, Probation Violation, Referrals, Convictions, and Felony
Convictions for Youth Who Completed DAP Outcome Measure ARY
N=42
Truancy N=34
Probation Violators N=120
Prior Contempt of Court Charges 1.60 1.58 Post Contempt of Court Charges
1.86 .29
Prior Probation Violations 1.87 Post Probation Violations
2.00
Prior Referrals to Court .83 .50 2.69 Post Court Referrals
1.14 .41 1.33
Prior Convictions .12 .06 1.29 Post Convictions
.45 .09 .61

JoAnn Ray August, 2008
17
Prior Felony Convictions .02 .00 .28 Post Felony Convictions .00 .00 .20
JoAnn Ray August, 2008
18
ARY Sample
Statistical tests indicated that changes from before to after DAP were insignificant statistically
for the four outcome measures, including Contempt of court charges, Referrals, Convictions and
Felony Convictions.
Truancy Sample
The Truancy Sample had a statistically significant decrease in the number of Contempt of court
charges after DAP. It dropped from an average of 1.6 to .3 Contempt charges per youth.
The comparison of Pre-post Referral, Conviction and Felony Conviction comparison rates for
the Truancy Sample were statistically insignificant.

Probation Violations Sample
Statistical tests indicated that there were significant differences in three of the four outcome
measures. During the year after DAP the Probation Violation Sample experienced decreases in
the rates of Referrals, Convictions, and Felony Convictions.
Referrals dropped from an average of 2.7 to l.3. Convictions were reduced from 1.3 to .6 on the
average. Felony Convictions decreased from .3 to .2.
Comparison of Means for Year BeforYear After for Statistically Significa
Outcomes
0 0.5 1 1.5 2 2.5
PV - Felony Convictions
PV - Convictions
PV - Referrals
TRU - Contempt or courtcharges
Year Before DA
Year After DAP
JoAnn Ray August, 2008
19
JoAnn Ray August, 2008
20
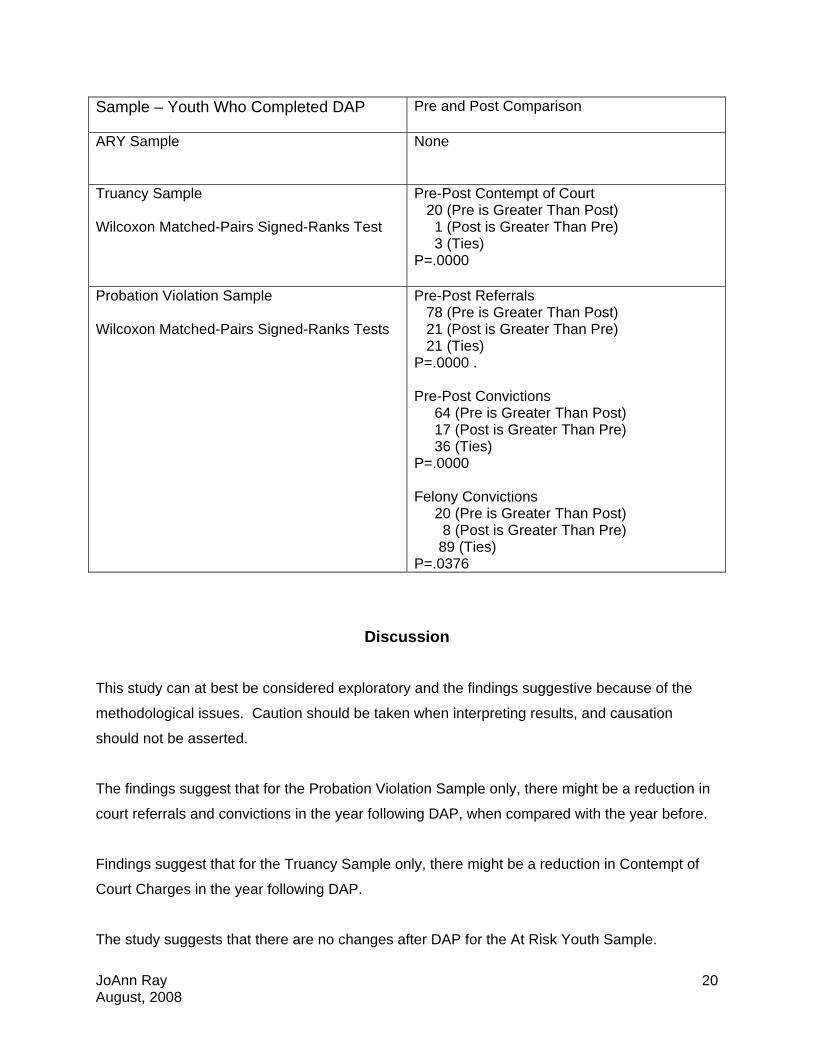
Sample – Youth Who Completed DAP Pre and Post Comparison
ARY Sample
None
Truancy Sample Wilcoxon Matched-Pairs Signed-Ranks Test
Pre-Post Contempt of Court 20 (Pre is Greater Than Post) 1 (Post is Greater Than Pre) 3 (Ties) P=.0000
Probation Violation Sample Wilcoxon Matched-Pairs Signed-Ranks Tests
Pre-Post Referrals 78 (Pre is Greater Than Post) 21 (Post is Greater Than Pre) 21 (Ties) P=.0000 . Pre-Post Convictions 64 (Pre is Greater Than Post) 17 (Post is Greater Than Pre) 36 (Ties) P=.0000 Felony Convictions 20 (Pre is Greater Than Post) 8 (Post is Greater Than Pre) 89 (Ties) P=.0376
Discussion
This study can at best be considered exploratory and the findings suggestive because of the
methodological issues. Caution should be taken when interpreting results, and causation
should not be asserted.
The findings suggest that for the Probation Violation Sample only, there might be a reduction in
court referrals and convictions in the year following DAP, when compared with the year before.
Findings suggest that for the Truancy Sample only, there might be a reduction in Contempt of
Court Charges in the year following DAP.
The study suggests that there are no changes after DAP for the At Risk Youth Sample.

JoAnn Ray August, 2008
21
It is important that the recidivism data be considered along with other outcome measures, such
as school attendance and perceptions of the value of the program.
JoAnn Ray August, 2008
22
Satisfaction With DAP Study
Satisfaction calls were completed to both youth and parents of youth provided DAP services.
Calls completed during the three project years are reported together. Project staff provided
names and contact information. Many youth and their parents could not be reached because of
an incorrect telephone number. Sixty-two calls were completed to Status Offenders and 93 to
Probation Violators. Parents completed 38% of the calls and youth, 62%.
The responses from all participants involved in the study during the three years are reported
together. Tables supporting this narrative are included in the Appendix, Table 7 to Table 33.
The profile of the youth who were involved in the Satisfaction Study is similar to those served by
the project. The average age of the youth was 15.6, and 63% were male. Seventy-nine percent
were white, with African Americans representing the largest minority group (10%).
Calls were made to youth and parents of youth Completing and Not Completing the DAP
program. Eighty-nine percent of the respondents stated the youth had completed the program.
The second and third year sample had a higher percentage of completers than did the first year.
Transportation and conflict with other activities were reasons given for not completing the
program. Please see Appendix, Table 7 for details.
Respondents were asked to specify whether the youth received specific program components
and to rate those received. Ninety-one percent of the respondents remembered receiving the
skills building classes, while the other components were less memorable. Forty-six percent
identified recreation and ten percent, tutoring as program components. Three girls, all in the
second year, remembered the girls group. Two of the minority youth, all in the first year,
remembered the minority group. Please see Appendix, Table 8.
Seventy-five percent of the respondents rated Skill Building and nine out of ten rated Recreation
as “Useful.” Over 75% rated Tutoring as “Useful.” Comments from both youth and parents
indicated that the Skill Building was valuable in teaching youth that they had a choice in their
behaviors and decisions. Please see Appendix, Table 9.
Approximately 90% of the respondents thought the program should be continued. Eighty-five
percent said they preferred DAP to detention. Most parents and youth thought that the program
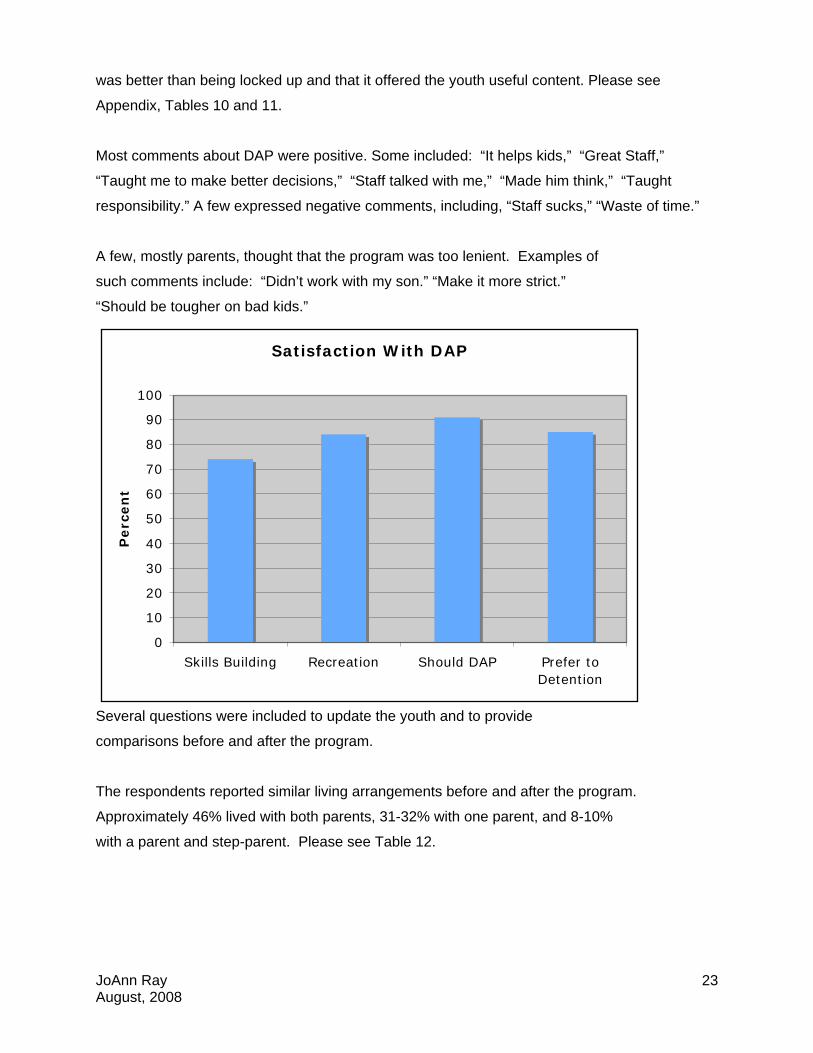
was better than being locked up and that it offered the youth useful content. Please see
Appendix, Tables 10 and 11.
Most comments about DAP were positive. Some included: “It helps kids,” “Great Staff,”
“Taught me to make better decisions,” “Staff talked with me,” “Made him think,” “Taught
responsibility.” A few expressed negative comments, including, “Staff sucks,” “Waste of time.”
A few, mostly parents, thought that the program was too lenient. Examples of
such comments include: “Didn’t work with my son.” “Make it more strict.”
“Should be tougher on bad kids.”
Satisfaction With DAP
0
10
20
30
40
50
60
70
80
90
100
Skills Building Recreation Should DAP
Perc
en
t
Prefer toDetention
Several questions were included to update the youth and to provide
comparisons before and after the program.
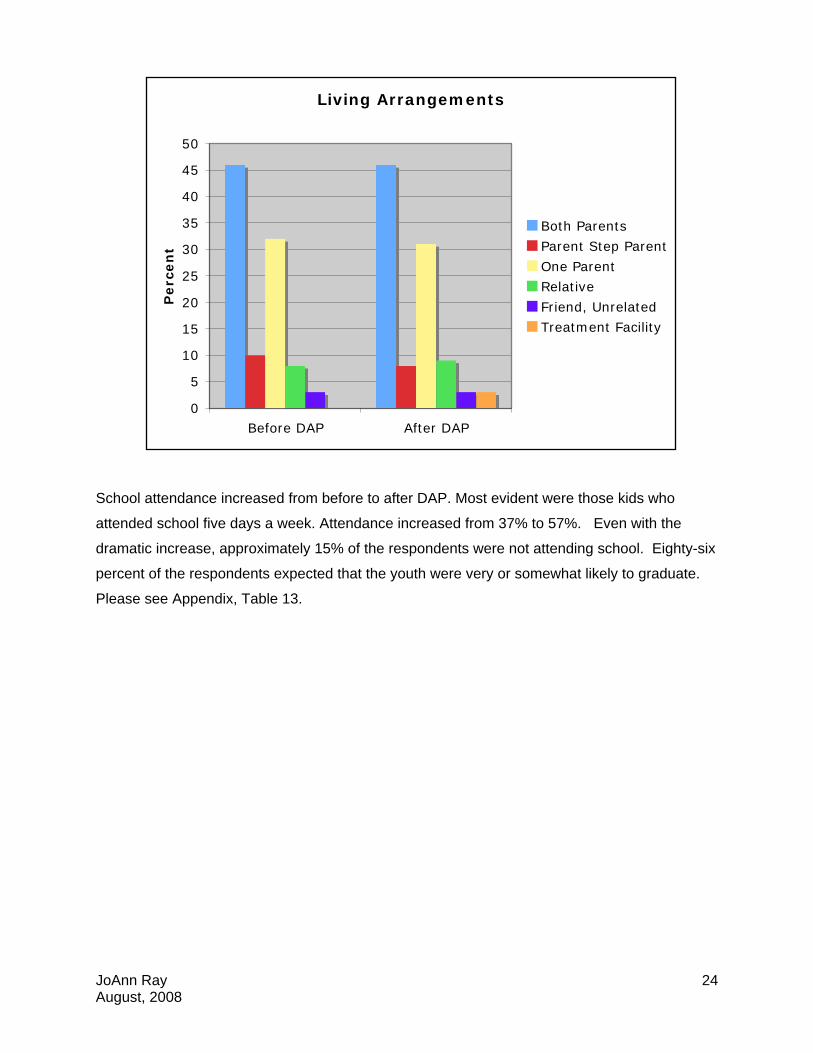
The respondents reported similar living arrangements before and after the program.
Approximately 46% lived with both parents, 31-32% with one parent, and 8-10%
with a parent and step-parent. Please see Table 12.
JoAnn Ray August, 2008
23
Living Arrangements
0
5
10
15
20
25
30
35
40
45
50
Before DAP After DAP
Perc
en
t
Both Parents
Parent Step Parent
One Parent
Relative
Friend, Unrelated
Treatment Facility
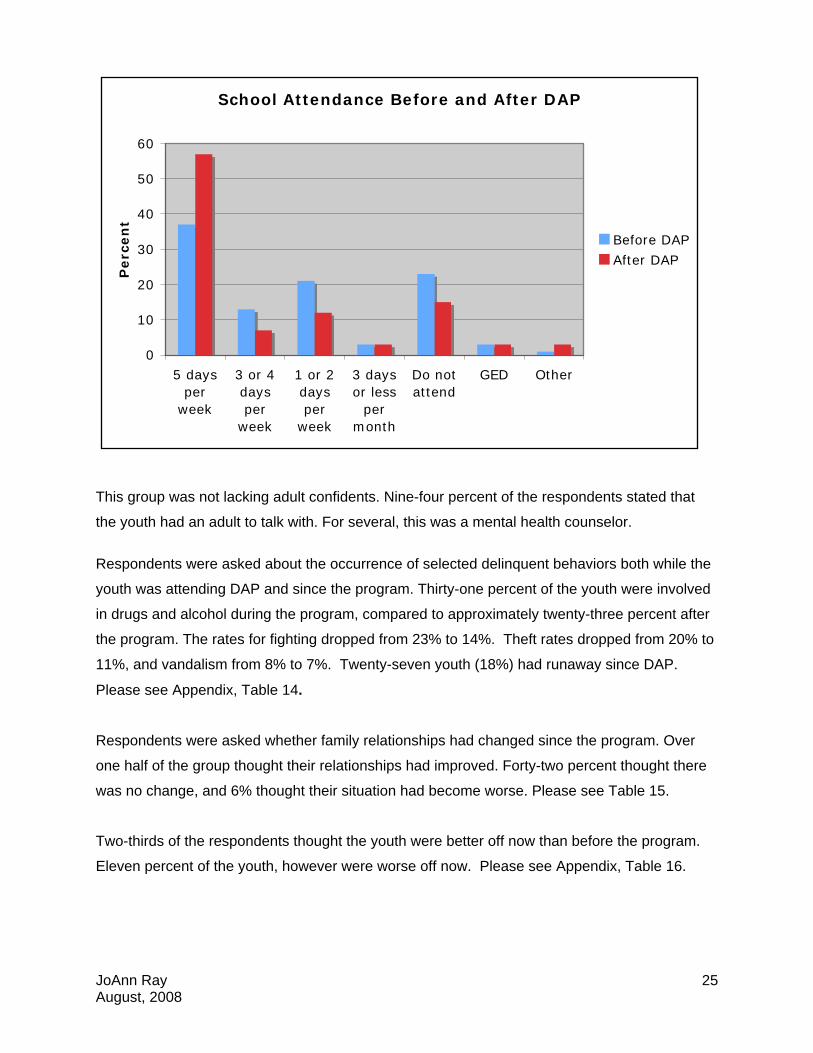
School attendance increased from before to after DAP. Most evident were those kids who
attended school five days a week. Attendance increased from 37% to 57%. Even with the
dramatic increase, approximately 15% of the respondents were not attending school. Eighty-six
percent of the respondents expected that the youth were very or somewhat likely to graduate.
Please see Appendix, Table 13.
JoAnn Ray August, 2008
24
School Attendance Before and After DAP
0
10
20
30
40
50
60
5 daysper
week
3 or 4daysper
week
1 or 2daysper
week
3 daysor less
permonth
Do notattend
GED Other
Perc
en
t
Before DAP
After DAP
This group was not lacking adult confidents. Nine-four percent of the respondents stated that
the youth had an adult to talk with. For several, this was a mental health counselor.
Respondents were asked about the occurrence of selected delinquent behaviors both while the
youth was attending DAP and since the program. Thirty-one percent of the youth were involved
in drugs and alcohol during the program, compared to approximately twenty-three percent after
the program. The rates for fighting dropped from 23% to 14%. Theft rates dropped from 20% to
11%, and vandalism from 8% to 7%. Twenty-seven youth (18%) had runaway since DAP.
Please see Appendix, Table 14.
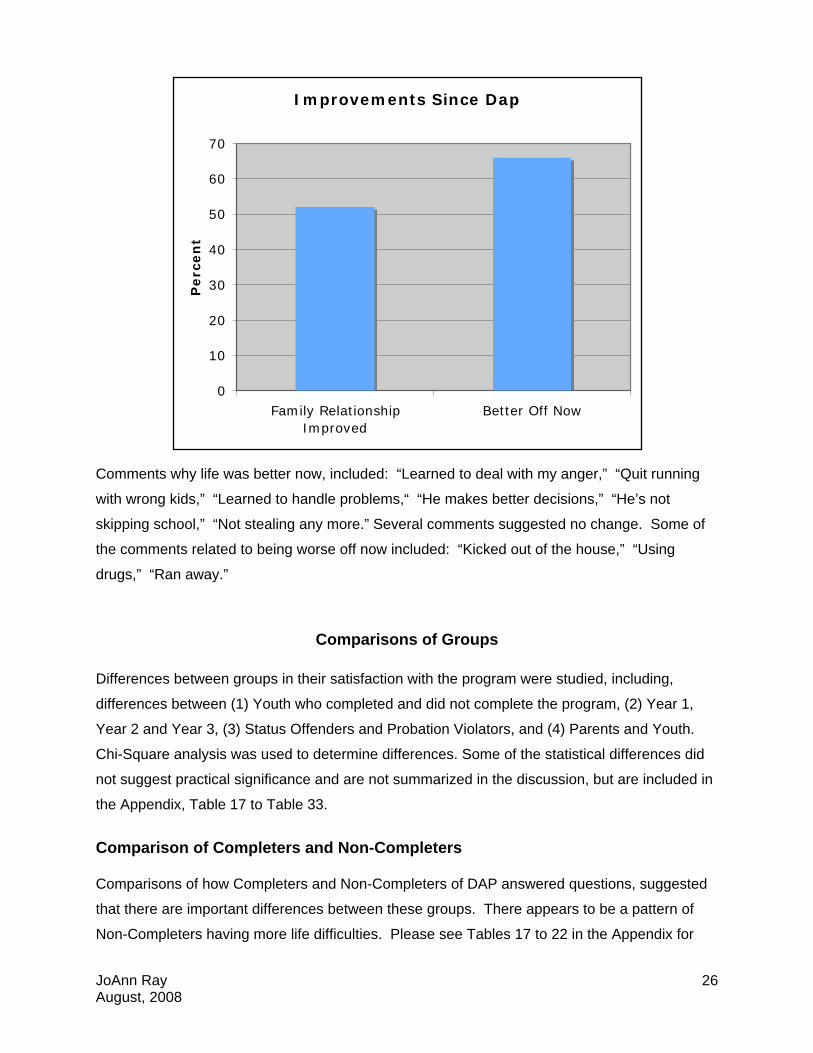
Respondents were asked whether family relationships had changed since the program. Over
one half of the group thought their relationships had improved. Forty-two percent thought there
was no change, and 6% thought their situation had become worse. Please see Table 15.
Two-thirds of the respondents thought the youth were better off now than before the program.
Eleven percent of the youth, however were worse off now. Please see Appendix, Table 16.
JoAnn Ray August, 2008
25
Improvements Since Dap
0
10
20
30
40
50
60
70
Family RelationshipImproved
Better Off Now
Perc
en
t
Comments why life was better now, included: “Learned to deal with my anger,” “Quit running
with wrong kids,” “Learned to handle problems,“ “He makes better decisions,” “He’s not
skipping school,” “Not stealing any more.” Several comments suggested no change. Some of
the comments related to being worse off now included: “Kicked out of the house,” “Using
drugs,” “Ran away.”
Comparisons of Groups
Differences between groups in their satisfaction with the program were studied, including,
differences between (1) Youth who completed and did not complete the program, (2) Year 1,
Year 2 and Year 3, (3) Status Offenders and Probation Violators, and (4) Parents and Youth.
Chi-Square analysis was used to determine differences. Some of the statistical differences did
not suggest practical significance and are not summarized in the discussion, but are included in
the Appendix, Table 17 to Table 33.
Comparison of Completers and Non-Completers
Comparisons of how Completers and Non-Completers of DAP answered questions, suggested
that there are important differences between these groups. There appears to be a pattern of
Non-Completers having more life difficulties. Please see Tables 17 to 22 in the Appendix for
JoAnn Ray August, 2008
26
JoAnn Ray August, 2008
27
more details. Page 39 of this report provides additional information on the differences between
youth by their levels of DAP completion.
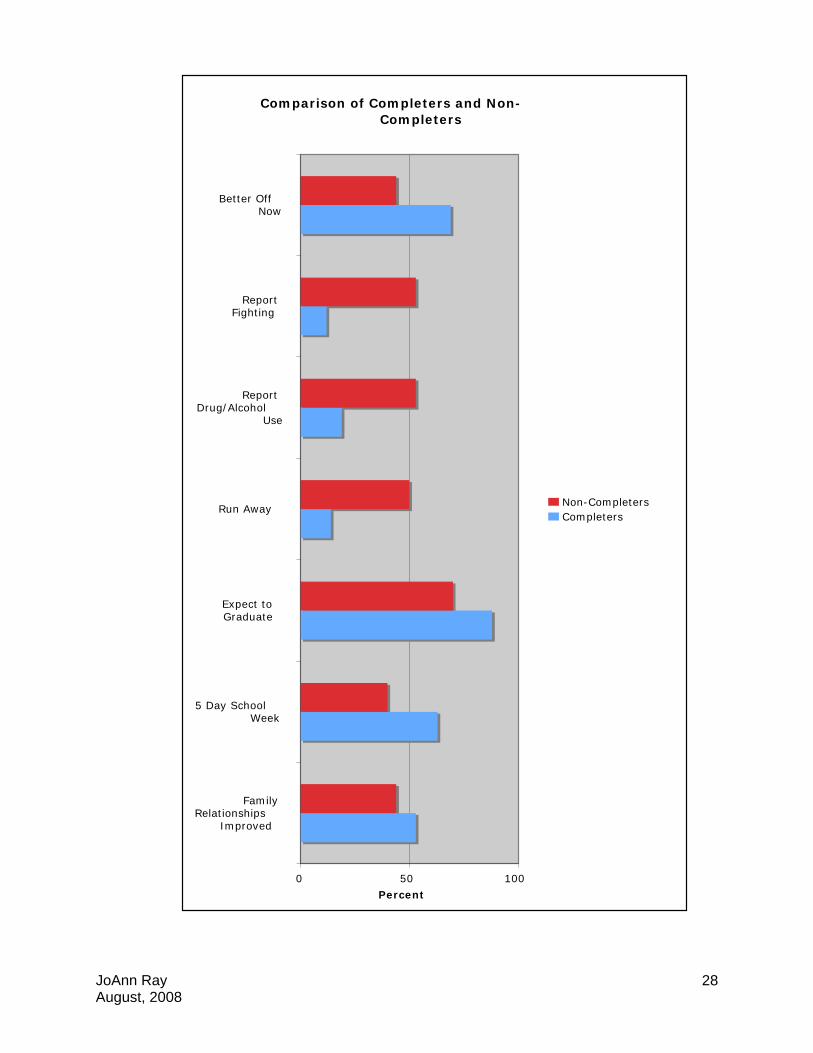
Completers of DAP were more apt to:
View their family relationships since DAP more positively. Three percent of the Completers
compared with 25% of the Non-Completers thought their family relationships deteriorated
since DAP.
Are attending school full time. Sixty-three percent of the completers compared with 40% of
the Non-completers stated they were attending school full time.
Expect to graduate from high school. Eighty-eight percent of the Completers compared with
70% of the Non-Completers expect to graduate from high school.
Have not runaway since DAP. Fifty percent of the Non-Completers and 14% of the
Completers have runaway since DAP.
Less involved in delinquent activities since DAP. Non-Completers report higher rates of
drug/alcohol use and fighting. Fifty-three percent of the Non-Completers and 19% of the
Completers used drug/alcohol since DAP. One-third of the Non-Completers and 12% of the
Completers were involved in fights.
Consider themselves “better off” since DAP. Forty-four percent of Non-completers compared
with 64% of the Completers thought they were better off than before DAP. Thirty-eight
percent of the Non-Completers and 8% of the Completers considered themselves “worse
off.
Comparison of Completers and Non-Completers
0 50 100
FamilyRelationships
Improved
5 Day SchoolWeek
Expect toGraduate
Run Away
ReportDrug/Alcohol
Use
ReportFighting
Better OffNow
Percent
Non-CompletersCompleters
JoAnn Ray August, 2008
28

JoAnn Ray August, 2008
29
Comparison of Years
Several differences in percentages were found when the year of the project was studied.
Please see Tables 23 to 25 in the Appendix for details.
Year 1 had the highest percentage of Status Offenders and Year 3, the lowest percentage
included in the sample. The low percent during Year 3 is due to completing the calls early in
the year. These included the summer months when school was not in session.
Year 2 and Year 3 Satisfaction Study participation had a higher completion rate. 96% of
Year 2 and 92% of Year 3 respondents said the youth completed the program compared
with 80% during Year 1.
Full time school attendance after the program was higher in Year 3 than the other years.
74% of the respondents interviewed in Year 3, compared with 54% in Year 2 and 46% in
Year 1 were attending school full time.
Comparison of Status Offender and Probation Violators Status Offenders and Probation Violators answered four questions differently. Please see
Tables 26 to 29 in the Appendix for details.
Probation Violators were more likely than Status Offenders to be in school before DAP, to report
theft after DAP, and to recommend the program. Probation Violators were more apt to:
Have a higher rate of students enrolled in school before DAP. Probation Violators were
almost twice as likely to attend full time school before DAP than were Status Offenders,
47% compared to 25%. This might be expected, since Truants were included in the Status
Offender category.
To recommend continuation of DAP. Ninety-seven percent of the Probation Violators
recommended program continuation while 82% of the Status Offenders did.
To self-report theft after DAP. One-fourth of the Probation Violators, compared with 11% of
the Status Offenders self-reported theft.
Comparison of Parents and Youth
Parents and youth differed in the way they answered several questions. Tables for these
questions can be found in the Appendix, Tables 30 to 33. Youth were more apt to be optimistic
about graduating from high school, perceive better family relationships and report fewer
offenses: Youth were more apt to:
JoAnn Ray August, 2008
30
Prefer DAP to Detention. Over 90% of the youth preferred DAP, while approximately 70% of
the parents did.
Perceive family relationships as better now than before DAP. Sixty percent of the youth, and
40% of the parents perceived relationships had improved.
Think that they would graduate from school. Almost all youth expected to graduate from
high school, while one-quarter of the parents doubted their child’s graduation.
Not use drugs and/or alcohol during or after the program and not be involved in theft after
DAP. Fifteen percent of the youth and 37% of the parents answered that the youth used
drugs/alcohol since DAP.

JoAnn Ray August, 2008
31
Student Evaluations
The staff of the Evening Program designed and administered student evaluations of DAP. The
instrument asked students to rate nine statements about the program. A scale from 1, Strongly
Disagree to 5, Strongly Agree, was used.
Data from ninety-five forms were entered on the computer. The majority of the responses were
positive. While some students rated all nine items as Strongly Agree, indicating the program
was valuable to them, only 1 youth rated all nine items as Strongly Disagree.
The means of the statements ranged from 3.6 to 4.2 indicating on the average, that the
participants were positive about the program. The ratings for the items were as follows:
Item Mean
This class helped me succeed with probation. 3.6
I gained new knowledge and skills from this class.
3.7
The YMCA is a good place for this class. 4.2
I felt supported and encouraged to complete the program. 4.1
The mentors were helpful. 4.2
The leaders encouraged me to participate 4.0
I can use the skills I learned outside of this class 3.9
I had fun during the game time in class.
4.1
The mix between learning and activity time was about right. 3.9
Write-in comments were encouraged. Some examples include:
1. How did the program help you?
By helping me learn PVs suck.
Had a goal to attend fully that I completed.
Program kept me from getting locked up.
Taught me other things to do in the community besides crimes.

JoAnn Ray August, 2008
32
Helped me stay off drugs.
Helped me stay out of trouble.
Didn’t get angry as much.
Helped me make good choices and that I’m not alone.
Helped me to think about actions and consequences.
2. What is one thing that you will use from the program in your daily life?
Stop and think why I want to fight.
How to handle a fight.
When you do drugs, you drop everything else.
Go to school.
Making decisions.
Think before I do something.
Listen to other people’s opinions.
Deep breathing.
Good communication.
Everything they taught, I already knew.
Don’t know.
Nothing.
3. What part of the program did you like most?
Basketball
Recreation time
Discussion
Movies
Liked the teacher
Food
4. What could be improved in the course to help other kids?

JoAnn Ray August, 2008
33
Nothing
Less learning
More peer speeches
Better food
Better movies
Not sure
Don’t know
JoAnn Ray August, 2008
34
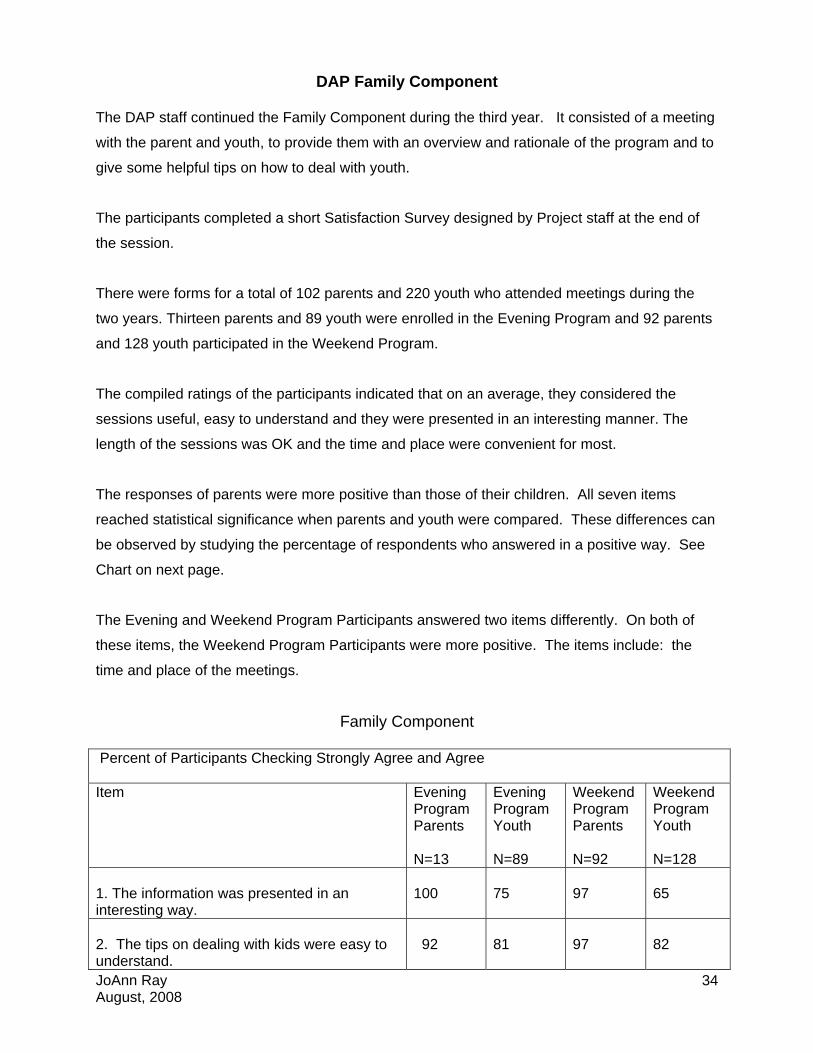
DAP Family Component The DAP staff continued the Family Component during the third year. It consisted of a meeting
with the parent and youth, to provide them with an overview and rationale of the program and to
give some helpful tips on how to deal with youth.
The participants completed a short Satisfaction Survey designed by Project staff at the end of
the session.
There were forms for a total of 102 parents and 220 youth who attended meetings during the
two years. Thirteen parents and 89 youth were enrolled in the Evening Program and 92 parents
and 128 youth participated in the Weekend Program.
The compiled ratings of the participants indicated that on an average, they considered the
sessions useful, easy to understand and they were presented in an interesting manner. The
length of the sessions was OK and the time and place were convenient for most.
The responses of parents were more positive than those of their children. All seven items
reached statistical significance when parents and youth were compared. These differences can
be observed by studying the percentage of respondents who answered in a positive way. See
Chart on next page.
The Evening and Weekend Program Participants answered two items differently. On both of
these items, the Weekend Program Participants were more positive. The items include: the
time and place of the meetings.
Family Component Percent of Participants Checking Strongly Agree and Agree Item Evening
Program Parents N=13
Evening Program Youth N=89
Weekend Program Parents N=92
Weekend Program Youth N=128
1. The information was presented in an interesting way.
100
75
97
65
2. The tips on dealing with kids were easy to understand.
92
81
97
82
JoAnn Ray August, 2008
35
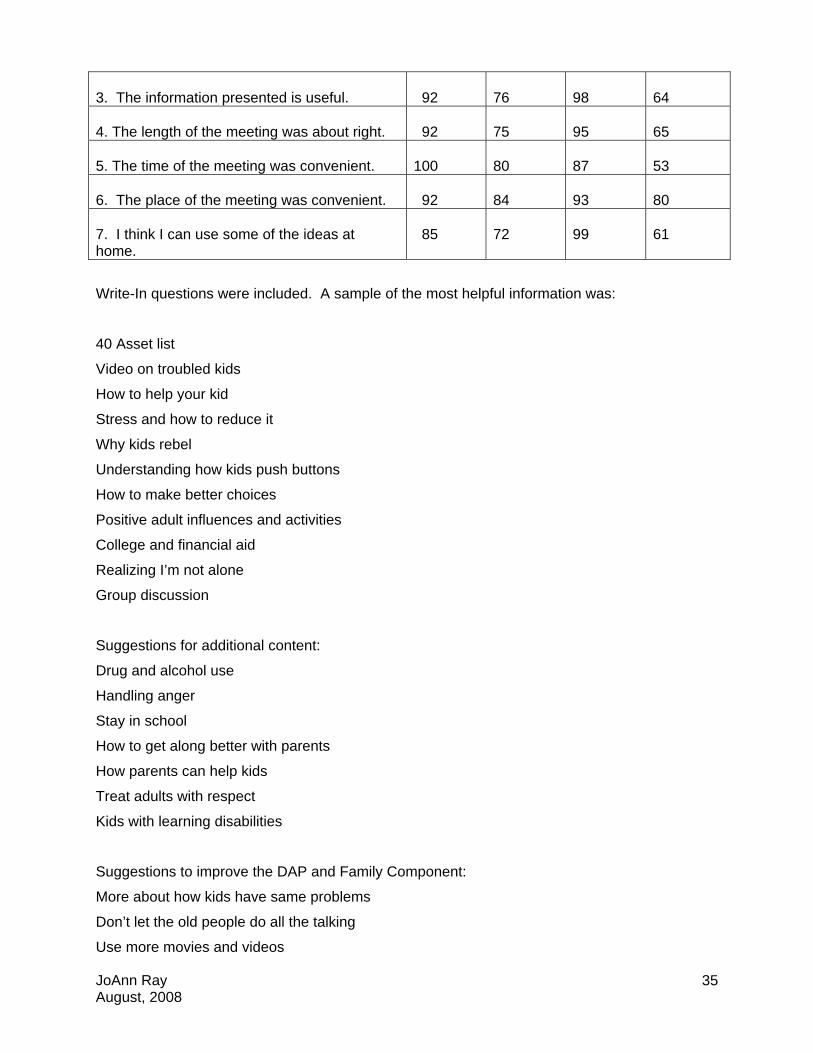
3. The information presented is useful.
92
76
98
64
4. The length of the meeting was about right.
92
75
95
65
5. The time of the meeting was convenient.
100
80
87
53
6. The place of the meeting was convenient.
92
84
93
80
7. I think I can use some of the ideas at home.
85
72
99
61
Write-In questions were included. A sample of the most helpful information was:
40 Asset list
Video on troubled kids
How to help your kid
Stress and how to reduce it
Why kids rebel
Understanding how kids push buttons
How to make better choices
Positive adult influences and activities
College and financial aid
Realizing I’m not alone
Group discussion
Suggestions for additional content:
Drug and alcohol use
Handling anger
Stay in school
How to get along better with parents
How parents can help kids
Treat adults with respect
Kids with learning disabilities
Suggestions to improve the DAP and Family Component:
More about how kids have same problems
Don’t let the old people do all the talking
Use more movies and videos

JoAnn Ray August, 2008
36
Start it at Noon
Someone to talk with in time of need
JoAnn Ray August, 2008
37
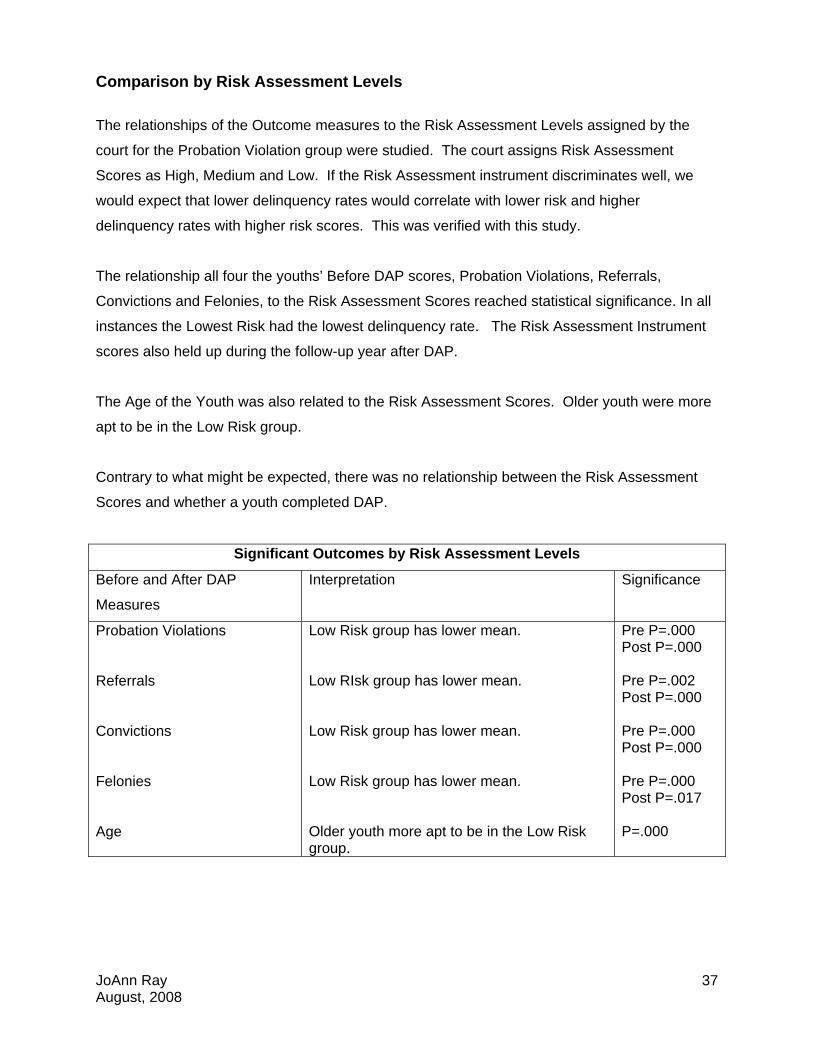
Comparison by Risk Assessment Levels
The relationships of the Outcome measures to the Risk Assessment Levels assigned by the
court for the Probation Violation group were studied. The court assigns Risk Assessment
Scores as High, Medium and Low. If the Risk Assessment instrument discriminates well, we
would expect that lower delinquency rates would correlate with lower risk and higher
delinquency rates with higher risk scores. This was verified with this study.
The relationship all four the youths’ Before DAP scores, Probation Violations, Referrals,
Convictions and Felonies, to the Risk Assessment Scores reached statistical significance. In all
instances the Lowest Risk had the lowest delinquency rate. The Risk Assessment Instrument
scores also held up during the follow-up year after DAP.
The Age of the Youth was also related to the Risk Assessment Scores. Older youth were more
apt to be in the Low Risk group.
Contrary to what might be expected, there was no relationship between the Risk Assessment
Scores and whether a youth completed DAP.
Significant Outcomes by Risk Assessment Levels
Before and After DAP
Measures
Interpretation Significance
Probation Violations Referrals Convictions Felonies Age
Low Risk group has lower mean. Low RIsk group has lower mean. Low Risk group has lower mean. Low Risk group has lower mean. Older youth more apt to be in the Low Risk group.
Pre P=.000 Post P=.000 Pre P=.002 Post P=.000 Pre P=.000 Post P=.000 Pre P=.000 Post P=.017 P=.000
JoAnn Ray August, 2008
38
Other Analyses Comparison of Youth by Level of Completion This section explores further, the question: How do youth who complete DAP differ from those who not complete it? The Satisfaction Questionnaires suggest that Completers differ from Non-Completers. See Page 30, and Appendix, Tables 17 to 22, for details on the differences suggested by the Satisfaction Survey. Briefly summarizing, youth who complete the program are more apt to:
View their family relationships since DAP more positively.
Were more apt to attend school after DAP.
Expect to graduate from high school.
Use less alcohol and drugs since DAP.
Less involved in fights since DAP.
Runaway less often since DAP.
Consider themselves “better off” since DAP.
Further analyses of the Recidivism data indicate that Completers differ from Non-Completers on
Outcome measures, and suggest that the Completers were apt to be less delinquent after DAP
than the Non-Completers.
Each of the analyzes, Probation Violators, ARYs and Truants, were analyzed individually by
comparing Completers to Non-Completers.
Measures Before DAP
Measure that differ between Completers and Non-Completers are characteristics that the might
help court personnel select youth more likely to complete DAP.
For the Probation Violation group, the youth who completed DAP were apt to have fewer
previous Probation Violations and fewer Felonies.
Completers and Non-Completers in the ARY group differed in Convictions prior to DAP.
Those with fewer prior convictions were more apt to complete DAP.
JoAnn Ray August, 2008
39
None of the four measures, Contempt of Court, Referrals, Convictions, or Felonies, differed
for the Truants by whether the youth completed DAP.
Measures After DAP
Measures after DAP suggest that DAP may have influenced the youth in reducing their status
offenses and delinquent behaviors.
The outcome measures for the Probation Violation group indicated that the Non-Completers
had a greater likelihood of Probation Violations, Convictions and Felonies after DAP. This
suggests that DAP may be successful in reducing these measures.
For the ARY group only, the Completers had a reverse relationship for Referrals. The
Completers group had a greater likelihood of being re-referred to the court after DAP. This
may be a statistical anomaly, as there appears to be no explanation for it.
For Truants, the Completers were less likely to be Convicted and less likely to be convicted
of a Felony.
Change Scores
Change scores were analyzed for these groups also. These measures also suggest if DAP has
an influence on the youth’s behaviors.
Change scores are the differences between the year prior to DAP to the year after DAP on the
outcome measures. There are four change scores, (1) Change in Probation Violation for
delinquent youth or Contempt of Court Referrals for Status Offenders, (2) Change in the number
of referrals from Before to After DAP. (3) Change in the number of Convictions from Before to
After DAP. (4) Change in the number of Felonies from Before to After DAP. The change scores
were calculated individually for the three groups.
Analyses for the Probation Violation youth by Levels of Completion for the four Change
Scores, showed that those who Completed DAP had more of a decrease from the year
before to the year after DAP on the outcomes, Probation Violations and Felonies.
JoAnn Ray August, 2008
40
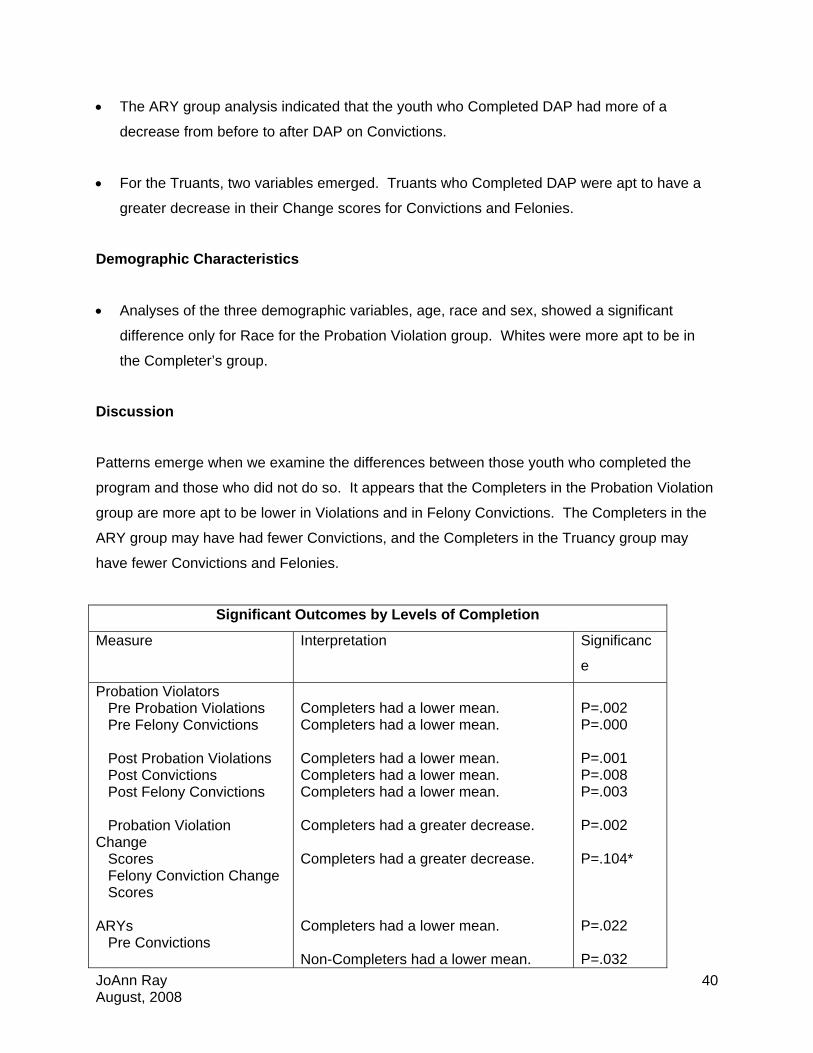
The ARY group analysis indicated that the youth who Completed DAP had more of a
decrease from before to after DAP on Convictions.
For the Truants, two variables emerged. Truants who Completed DAP were apt to have a
greater decrease in their Change scores for Convictions and Felonies.
Demographic Characteristics
Analyses of the three demographic variables, age, race and sex, showed a significant
difference only for Race for the Probation Violation group. Whites were more apt to be in
the Completer’s group.
Discussion
Patterns emerge when we examine the differences between those youth who completed the
program and those who did not do so. It appears that the Completers in the Probation Violation
group are more apt to be lower in Violations and in Felony Convictions. The Completers in the
ARY group may have had fewer Convictions, and the Completers in the Truancy group may
have fewer Convictions and Felonies.
Significant Outcomes by Levels of Completion
Measure Interpretation Significanc
e
Probation Violators Pre Probation Violations Pre Felony Convictions Post Probation Violations Post Convictions Post Felony Convictions Probation Violation Change Scores Felony Conviction Change Scores ARYs Pre Convictions
Completers had a lower mean. Completers had a lower mean. Completers had a lower mean. Completers had a lower mean. Completers had a lower mean. Completers had a greater decrease. Completers had a greater decrease. Completers had a lower mean. Non-Completers had a lower mean.
P=.002 P=.000 P=.001 P=.008 P=.003 P=.002 P=.104* P=.022 P=.032
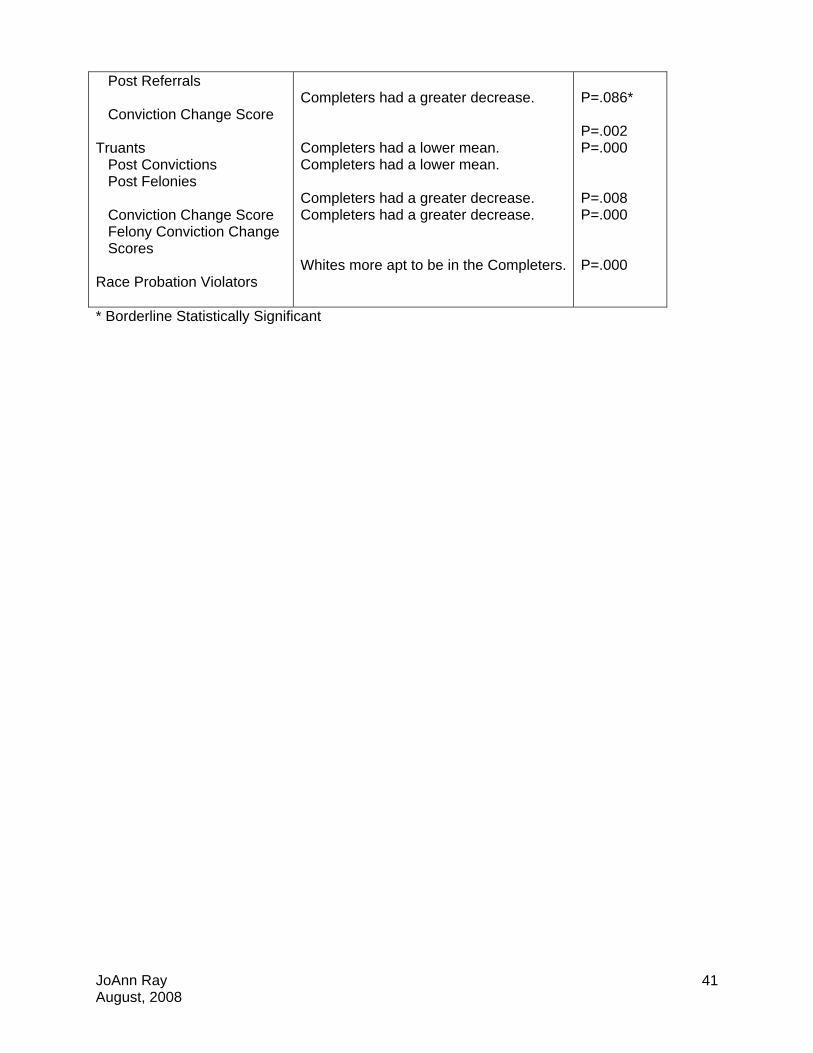
JoAnn Ray August, 2008
41
Post Referrals Conviction Change Score Truants Post Convictions Post Felonies Conviction Change Score Felony Conviction Change Scores Race Probation Violators
Completers had a greater decrease. Completers had a lower mean. Completers had a lower mean. Completers had a greater decrease. Completers had a greater decrease. Whites more apt to be in the Completers.
P=.086* P=.002 P=.000 P=.008 P=.000 P=.000
* Borderline Statistically Significant
JoAnn Ray August, 2008
42
Success Stories
The evaluator asked staff of the Evening and Weekend Programs to share a few stories
illustrating how the program helped the youth:
My favorite story is about a loud, argumentative,
outspoken, high spirited, energetic, and animated young
lady. I struggled with her "leadership skills" while trying
to find a way to channel her strengths. Because of her
"outgoing and bubbly" personality I suggested she join
the high school debate team. Well.... the following
Saturday this young lady showed up early for the Weekend
Program and was thrilled to tell me she had become involved in a "Legal Studies"
class and loved it. The best part is the teacher was thrilled to have her in the class!
A deflated young man who didn't give a darn about his education was
ordered into the Weekend Program. I made several phone calls and
wrote a letter in hopes of getting this youth to attend the program. After
many attempts I finally reached him by phone. He told me he was
having trouble at home and had dropped out of school. I explained how
important it is to follow the rules of a Court Order and if he showed up
on Saturday I'd have a cup of hot chocolate with his name on it waiting
for him! He agreed and he completed his assigned Saturdays with
perfect attendance and ended up in the Britt Program in hopes of getting
his life and education back on track.
One of the PO's referred to us a girl whom she thought would probably not make it in
the Evening Program. This youth had not been following through with a lot of things
JoAnn Ray August, 2008
43
on her probation. She had not been abiding by curfew, admitted to drug use, ran
away from home periodically, and didn't attend school. Sometimes she would at
least get to school, but then leave before the first period even ended. Amazingly,
from the first day of starting the Evening Reporting Program, she came on time
everyday. We worked with her especially on skills such as decision-making and
coping with stress. Other youth in the group would challenge her to really take a
look at whether her actions were really getting her the outcome she wanted. At first
she would come with a negative attitude and it took a lot of coaxing and
encouragement to get her to participate, but over time she began to brighten up.
Just the fact that she was showing up and staying for the whole evening was
amazing to her probation officer. She ended up completing 4 of 5 court ordered
sessions for a total of 13 days, but even beyond this, she came voluntarily 9 days on
her own!
Another youth that was referred to the Evening Reporting Program for missing
school, treatment classes, and other scheduled appointments. He began with us in
the same manner. Within the span of 10 days, he finally was able to complete 5.
He would bring to class a lot of relationship problems and would be depressed and
apathetic a lot of times. It was really difficult to get him to even participate in the
various kinds of recreational activities we do. In fact, he would stand in the corner of
the racquetball court with his puffy winter coat on and arms crossed, not wanting to
touch the volleyball as we played wolleyball. After much coaxing, he finally tried it
and was hooked ever since. After this first court order, he never missed a single
day. He came a total of 4 out of 4 court ordered sessions for a total of 25 days. He
even began coming on his own for 6 extra days, just to convince us to play
wolleyball on our recreation time.
Another youth was sent to the Evening Reporting Program 2 times completing a total
of 7 days for running away, breaking curfew, skipping classes, using THC and
alcohol, and not keeping in contact with her probation officer. Her second time in the
program, we really got to the core issues of what was going on with her. There were
many family conflicts at home, so she would run to get away from the situation or if

JoAnn Ray August, 2008
44
she went to school she would use substances, which in turn would prevent her from
being able to stay in school that day. Using Motivational Interviewing, we discussed
her dilemma over not getting behind in school verses her inability to stay in school.
We related this to ice skating, as that was the recreational activity for the day, and
seeing her cycle of using in action brought her to an "ahh ha" moment. She hasn't
been even referred back to the program since.
These stories illustrate the difficulties that many of these youth face. They also show
the creativity and determination of the program staff to help the youth find new behavior
patterns. A remark by one of the staff sums up what is really important: I think success
for our clientele is measured in very small, subtle ways. It is my hope that they know
I'm on their side and I care about them.
JoAnn Ray August, 2008
45
8. Conclusions and Recommendations
This grant partially funded the Evening and Weekend DAP programming for Status Offenders
and Probation Violators, increasing detention alternative options for the court. This court project
continued to be well organized and the staff addressed tasks in a timely manner. DAP
coordinated with community agencies to provide needed program services. Community
agencies are involved with the project and DAP is supported by JDAI community and juvenile
justice committees.
During the third year, the project met or surpassed all objectives except the reduction of
detention days. The project exceeded the number of youth served in both programs.
There were high levels of satisfaction among the youth and the parents of the youth who
attended DAP. Almost all respondents agreed that the project should be continued, and that
DAP was preferable to detention. The Skills Classes and Recreation received high rating from
respondents, as well. Comments from youth and parents indicated that the programming of
DAP is valuable in helping the youth learn s/he has a choice in making decisions. Many youth
reported they are better off now and that family relationships are better.
Four measures in the Recidivism Study, Contempt of Court Charges for Truants, Referrals,
Convictions and Felony Convictions for Probation Violation group, showed statistically
significant decreases from the year before to the year after DAP. Because of methodological
issues, these statistical findings must be cautiously interpreted. These findings must be
considered along with other outcome measures.
The success stories of youth in the program give us information that numbers cannot. They
illustrate the difficulties that many of these youth face—family difficulties, school issues,
substance use. These stories also show the creativity and determination of the staff to help the
youth find new behavior patterns. It may be necessary for a youth to be referred several times,
and to complete a number of days before there is any apparent behavioral change. As the
program staff said, change is in small steps. Even youth who do not complete the program may
benefit greatly by the days that they were present. This program offers youth an opportunity for
learning unlike detention. It teaches youth they have a choice. It shows the youth that there are
people who care about them and are not there to punish, but to help them deal with their life
situations.

JoAnn Ray August, 2008
46
The detention alternative programs are especially appropriate for youth who have not committed
a criminal offense. The Evening and Weekend Programs will be continuing with funding from the
county. The Evening Program operates year round, while the Weekend Program follows the
school year. DAP expands the efforts of the court with another option to remove youth from
detention who have not committed an offense.