detention basin design - suny polytechnic …people.sunyit.edu/~barans/classes/ctc260/student...
TRANSCRIPT

Abdelhak Hajjari
CTC 260
Project #: 4
May 6, 2009
DETENTION BASIN DESIGN

Table of Contents
1. INTRODUCTION ----------------------------------------------------------------------------------------- 1 2. SITE INFORMATION AND WATERSHED PARAMETERS ----------------------------------- 1
2.1. Site Information ------------------------------------------------------------------------------------------------ 1
2.2. Watershed Delineation and Drainage area calculation ------------------------------------------- 1
3. PEAK DISCHARGE AND HYDROGRAPH COMPUTATION --------------------------------- 2 3.1. Method ------------------------------------------------------------------------------------------------------------ 2
3.2. Predevelopment ------------------------------------------------------------------------------------------------ 3 3.2.1. Time of Concentration -------------------------------------------------------------------------------------------------- 3
3.2.2. Curve Number and Runoff Computation ----------------------------------------------------------------------------- 6
3.2.3. Peak Discharge ---------------------------------------------------------------------------------------------------------- 7
3.2.4. Discharge Hydrograph ------------------------------------------------------------------------------------------------- 7
3.3. Postdevelopment ---------------------------------------------------------------------------------------------- 8 3.3.1. Time of concentration --------------------------------------------------------------------------------------------------- 8
3.3.2. Curve Number and Runoff Computation ----------------------------------------------------------------------------- 9
3.3.3. Peak Discharge -------------------------------------------------------------------------------------------------------- 11
3.3.4. Discharge Hydrograph ----------------------------------------------------------------------------------------------- 11
3.4. Peak Discharge Comaprison ----------------------------------------------------------------------------- 12
4. DETENTION BASIN DESIGN ---------------------------------------------------------------------- 13 4.1. Design Requirements --------------------------------------------------------------------------------------- 13
4.2. Detention Basin Type and Location -------------------------------------------------------------------- 13
4.3. Detention Basin Dimensions ----------------------------------------------------------------------------- 13
4.4. Outlet Structure and Outflow Computation ---------------------------------------------------------- 14
4.5. Outflow Routing ----------------------------------------------------------------------------------------------- 16
5. SUMMARY AND CONCLUSION ------------------------------------------------------------------ 18 APPENDIX A: INTENSITY-DURATION-FREQUENCY CURVES------------------------- 19 REFERENCES ----------------------------------------------------------------------------------------------- 21
Table of Figures Figure 1: Map of Site and Delineated Watershed ................................................................................ 2
Figure 2: Delineated Watershed and Hydraulic Path - Predevelopment .............................................. 4
Figure 3: Discharge Hydrograph - Predevelopment ............................................................................ 8
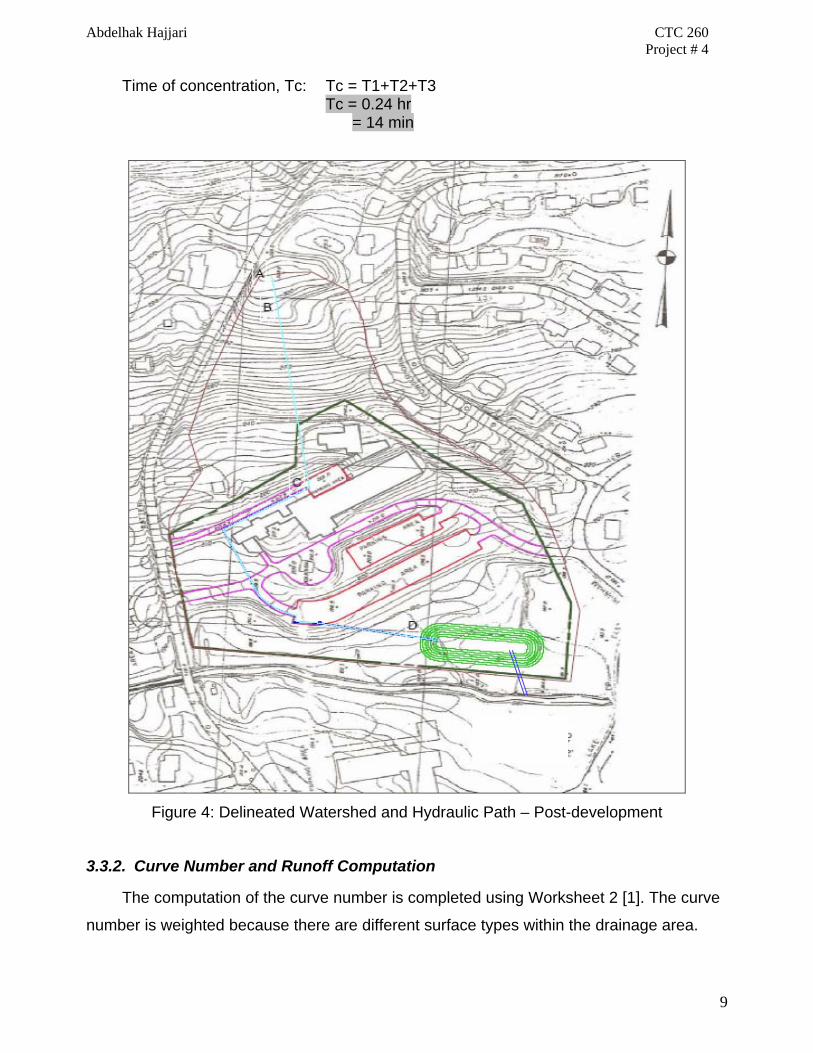
Figure 4: Delineated Watershed and Hydraulic Path – Post-development .......................................... 9
Figure 5: Discharge Hydrograph - Postdevelopment ......................................................................... 12
Figure 6: Discharge Hydrograph - Postdevelopment ......................................................................... 12
Figure 7: Schematic illustration of the proposed open-cut basin ....................................................... 14
Figure 8: Storage Volume versus Water Elevation Level .................................................................. 14
Figure 9: Outflow Structure of Detention Basin ................................................................................ 15
Figure 10: Outflow Discharge versus Water Elevation Level ........................................................... 15
Figure 11: Graph of 2S/Dt+O versus O, and 2S/Dt-O versus O ........................................................ 16
Figure 12: Inflow and Outflow Hydrographs ..................................................................................... 17
Figure 13: Discharge Hydrographs .................................................................................................... 18
Figure A.1: Rainfall intensity for storm duration of 5, 10, 15, 30, and 60 minutes……………….. 19
Figure A.2: Rainfall IDF curves for storm duration of 2, 3, 6, 12, and 12 hours………………… 19
List of Tables Table 1: Time of Concentration Computation – Predevelopment ....................................................... 5
Table 2: Curve Number, C, and Runoff, Q, Computation – Predevelopment ..................................... 6
Table 3: Peak Discharge Computation - Predevelopment ................................................................... 7
Table 4: Curve Number, CN, and Runoff, Q, Computation – Post-development ............................. 10
Table 5: Peak Discharge Computation – Post-development .............................................................. 11
Table 6: Storage Volume Computation .............................................................................................. 13
Table 7: Outflow Computation .......................................................................................................... 15
Table 8: Routing Computation Parameters ........................................................................................ 16
Table 9: Detention Basin Routing Table ............................................................................................ 17
Table 10: Peak runoff rate summary .................................................................................................. 18
Table A.1: Rainfall intensity for storm duration of 5, 10, 15, 30, and 60 minutes………………… 20
Table A.2: Rainfall intensity for storm duration of 2, 3, 6, 12, and 12 hours…………………….. 20

Abdelhak Hajjari CTC 260 Project # 4
1
1. INTRODUCTION In this report, we present the steps followed to design a detention basin for the
proposed tract. The site is located near St. Paul, Minnesota. The TR-55 graphical peak
discharge method, described in [1], is used in the runoff computations.
To design the detention basin for the proposed plan, we first calculate the peak runoff
for two site conditions: Pre-development phase (present) and Post-development phase
(developed).
By trial and error, we design a detention basin and route the inflow hydrograph
through the basin. The peak rate of runoff entering the natural stream after development
will be attenuated so that it will not exceed the pre-development peak runoff rate for a 100-
year frequency storm.
2. SITE INFORMATION AND WATERSHED PARAMETERS
2.1. Site Information The provided site information and watershed parameters are,
a. Site location: Near St. Paul, Minnesota
b. Type II rainfall distribution (from Figure B-2 in [1])
c. Hydrologic Soil group: B
d. Cover Description:
Predevelopment: Woods, good condition
Postdevelopment: Impervious (parking lots, roads and roofs) Lawns, good condition Woods, fair condition
2.2. Watershed Delineation and Drainage area calculation The drainage area tributary to the proposed detention basin is delineated as shown in
Figure A.1. Note that the drainage area includes land uphill of the tract that drains onto the
tract. This area is used to compute both predevelopment and postdevelopment runoff for
detention design because it best represents total runoff leaving the tract.
The area is measured using Autocad software and the value found is:
Area = 631500 ft2
= 14.5 acres = 0.023 square mile

Abdelhak Hajjari CTC 260 Project # 4
2
Figure 1: Map of Site and Delineated Watershed
3. PEAK DISCHARGE AND HYDROGRAPH COMPUTATION
3.1. Method The peak runoff is calculated using the graphical peak discharge method, described
in TR-55 report [1]. The hydrograph is determined using the exhibits which are also
provided in the TR-55 report [1].

Abdelhak Hajjari CTC 260 Project # 4
3
The following steps are followed in determining the peak runoff in the graphical peak
discharge method:
a) Total drainage area, Am, in square miles b) Time of concentration, Tc, in hours c) Weighted curve number, CN d) Appropriate rainfall distribution (I, IA, II, or III) e) Total runoff, Q, in inches computed from CN and rainfall f) 24-hour rainfall, P, in inches g) Initial abstraction, Ia (in). From Table 5-1 of [1]. h) Ratio of Ia/P
The peak discharge, qp, is computed using the following equation,
qp = qu Am Q Fp (Equation 1)
where, qp is the peak discharge (cfs), qu is the unit peak discharge from exhibit 4 (csm/in),
Am is the drainage area (mi2), Q is the runoff (in), and Fp is pond and swamp adjustment
factor (In our case, we assume that there is no pond or swamp so Fp =1)
The computation of the hydrograph coordinates for selected Tc, Tt (Note here that Tt
= 0 because the flow is running directly to the outlet) and Ia/P is carried out using the
appropriate sheets in Exhibit 5-II [1]. The flow at any time of the hydrograph is
q = qt Am Q (Equation 2)
where, q is the hydrograph coordinate (cfs) at hydrograph time t, qt is the tabular
hydrograph unit discharge from exhibit 5 (csm/in), Am is the drainage area (mi2), and Q is
the runoff (in).
3.2. Predevelopment 3.2.1. Time of Concentration
The hydraulic path used to calculate the time of concentration is shown in Figure 2.
Segmentation of the hydraulic path is also shown in Figure 2. Note that it is assumed that
there is no open channel in the watershed and only two segments are considered.
Segment AB corresponds to the sheet flow and Segment BC corresponds to the shallow
concentrated flow.

Abdelhak Hajjari CTC 260 Project # 4
4
Figure 2: Delineated Watershed and Hydraulic Path - Predevelopment
The two segments have the following parameters:
Sheet flow: Grass Length, L = 100 ft Slope, s = 10% Manning’s roughness coefficient, n=0.40
Shallow concentrated flow: Length, L = 1180 ft Slope, s = 10%

Abdelhak Hajjari CTC 260 Project # 4
5
The time of concentration is found to be: (For details, see Table 1)
Sheet flow: T1 = 0.20 hr Shallow concentrated flow: T2 = 0.07 hr
Time of concentration, Tc: Tc = T1+T2 Tc = 0.27 hr
= 16 min
Note: the Manning’s roughness coefficient for the sheet flow is assumed to be equal to 0.40 because the surface is wooded.
Table 1: Time of Concentration Computation – Predevelopment
Abdelhak Hajjari CTC 260 Project # 4
6
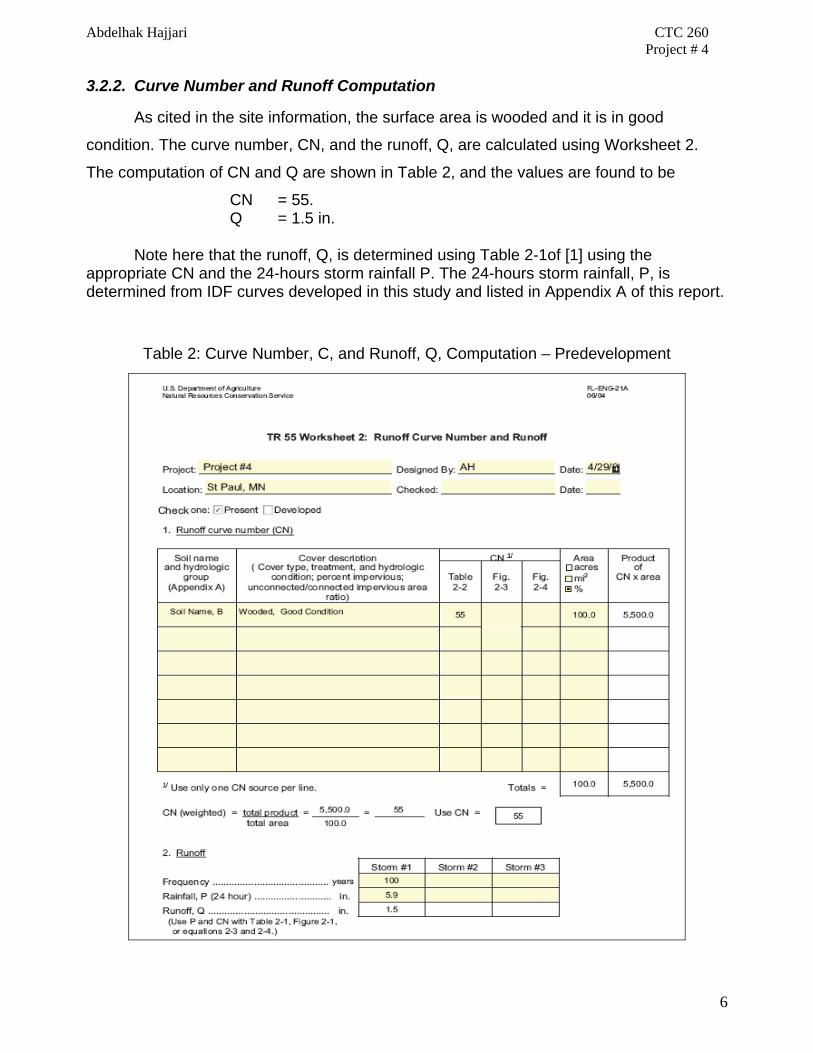
3.2.2. Curve Number and Runoff Computation
As cited in the site information, the surface area is wooded and it is in good
condition. The curve number, CN, and the runoff, Q, are calculated using Worksheet 2.
The computation of CN and Q are shown in Table 2, and the values are found to be
CN = 55. Q = 1.5 in.
Note here that the runoff, Q, is determined using Table 2-1of [1] using the appropriate CN and the 24-hours storm rainfall P. The 24-hours storm rainfall, P, is determined from IDF curves developed in this study and listed in Appendix A of this report.
Table 2: Curve Number, C, and Runoff, Q, Computation – Predevelopment
Abdelhak Hajjari CTC 260 Project # 4
7
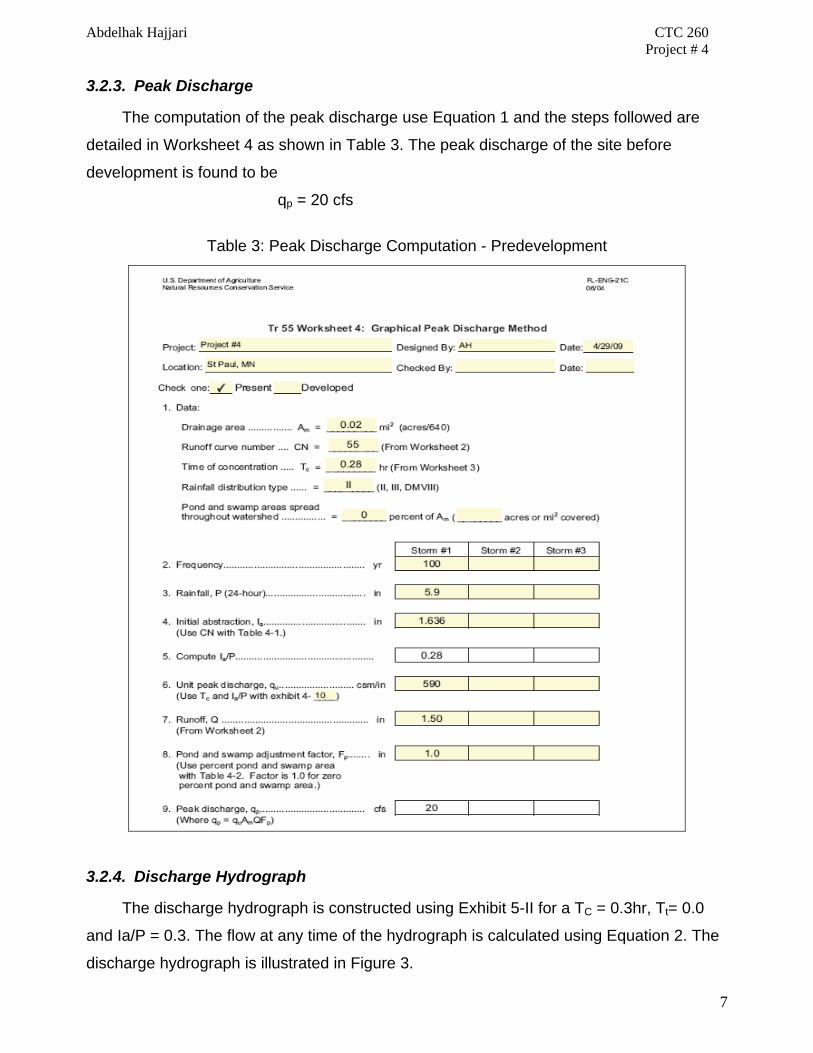
3.2.3. Peak Discharge
The computation of the peak discharge use Equation 1 and the steps followed are
detailed in Worksheet 4 as shown in Table 3. The peak discharge of the site before
development is found to be
qp = 20 cfs
Table 3: Peak Discharge Computation - Predevelopment
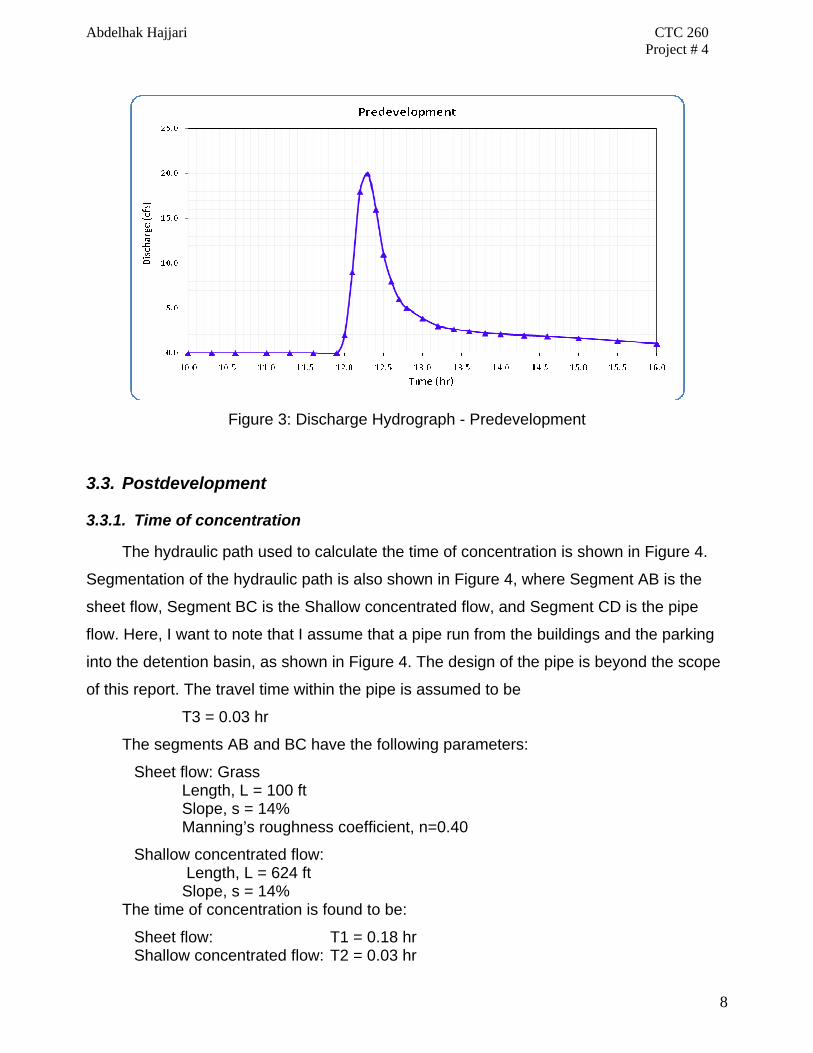
3.2.4. Discharge Hydrograph
The discharge hydrograph is constructed using Exhibit 5-II for a TC = 0.3hr, Tt= 0.0
and Ia/P = 0.3. The flow at any time of the hydrograph is calculated using Equation 2. The
discharge hydrograph is illustrated in Figure 3.
Abdelhak Hajjari CTC 260 Project # 4
8
Figure 3: Discharge Hydrograph - Predevelopment
3.3. Postdevelopment
3.3.1. Time of concentration
The hydraulic path used to calculate the time of concentration is shown in Figure 4.
Segmentation of the hydraulic path is also shown in Figure 4, where Segment AB is the
sheet flow, Segment BC is the Shallow concentrated flow, and Segment CD is the pipe
flow. Here, I want to note that I assume that a pipe run from the buildings and the parking
into the detention basin, as shown in Figure 4. The design of the pipe is beyond the scope
of this report. The travel time within the pipe is assumed to be
T3 = 0.03 hr
The segments AB and BC have the following parameters:
Sheet flow: Grass Length, L = 100 ft Slope, s = 14% Manning’s roughness coefficient, n=0.40
Shallow concentrated flow: Length, L = 624 ft Slope, s = 14%
The time of concentration is found to be:
Sheet flow: T1 = 0.18 hr Shallow concentrated flow: T2 = 0.03 hr
Abdelhak Hajjari CTC 260 Project # 4
9
Time of concentration, Tc: Tc = T1+T2+T3 Tc = 0.24 hr
= 14 min
Figure 4: Delineated Watershed and Hydraulic Path – Post-development
3.3.2. Curve Number and Runoff Computation
The computation of the curve number is completed using Worksheet 2 [1]. The curve
number is weighted because there are different surface types within the drainage area.

Abdelhak Hajjari CTC 260 Project # 4
10
Four types exist in the site under study. The hydrologic soil group B, is assumed for the
site. Type 1: Impervious (Parking lots, Paved roads, and Roofs): 2.76 acres with CN = 98 Type 2: Lawn, Good Condition: 4.49 acres with CN = 61 Type 3: Woods, Fair Condition: 2.9 acres with CN = 60 Type 4: Woods, Good Condition (Part outside the tract): 4.35 acres with CN = 55 The computation of CN and Q are shown in Table 2, and the values are found to be
CN = 66. Q = 2.4 in.
Table 4: Curve Number, CN, and Runoff, Q, Computation – Post-development
Abdelhak Hajjari CTC 260 Project # 4
11
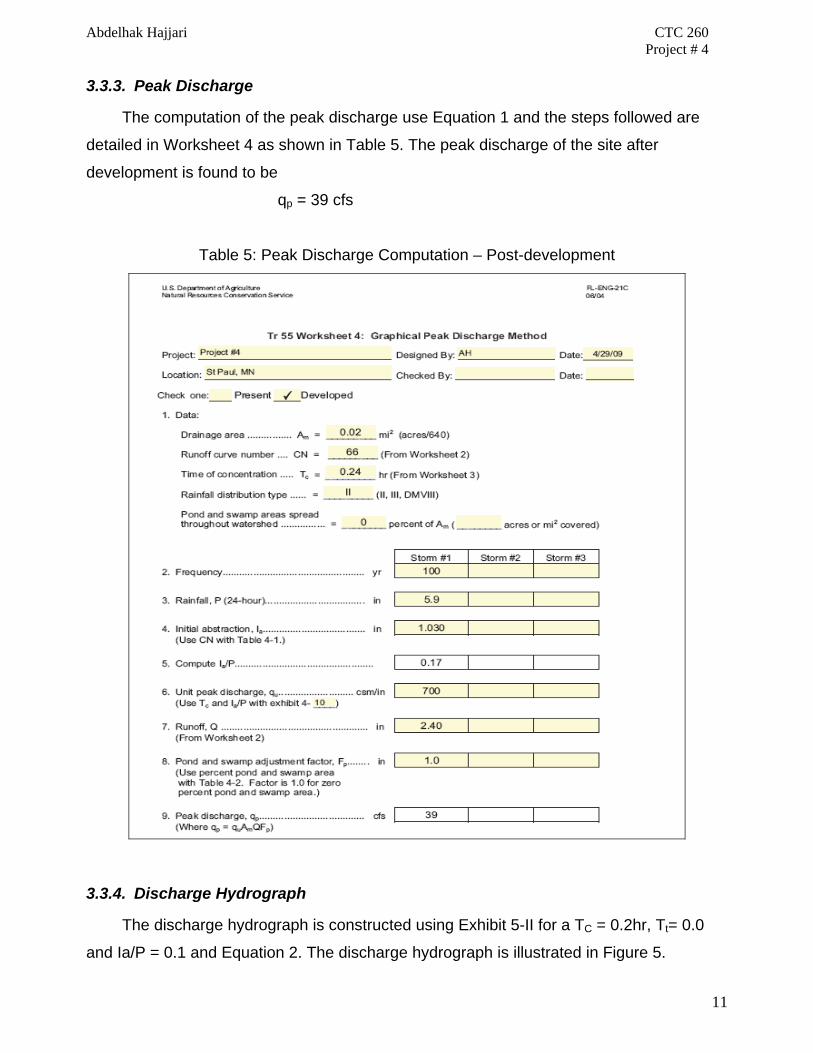
3.3.3. Peak Discharge
The computation of the peak discharge use Equation 1 and the steps followed are
detailed in Worksheet 4 as shown in Table 5. The peak discharge of the site after
development is found to be
qp = 39 cfs
Table 5: Peak Discharge Computation – Post-development
3.3.4. Discharge Hydrograph
The discharge hydrograph is constructed using Exhibit 5-II for a TC = 0.2hr, Tt= 0.0
and Ia/P = 0.1 and Equation 2. The discharge hydrograph is illustrated in Figure 5.

Abdelhak Hajjari CTC 260 Project # 4
12
Figure 5: Discharge Hydrograph - Postdevelopment
3.4. Peak Discharge Comaprison The peak discharge of the site before and after development is shown in Figure 6. As
seen, the peak discharge increased from 20.00 cfs to 39.00 cfs after development and it
occurred in an earlier time. To attenuate the peak runoff to a level equal to less than the
predevelopment peak, a detention basin has to be built. The design of the detention basin
for this site is given in the following section.
Figure 6: Discharge Hydrograph - Postdevelopment
Abdelhak Hajjari CTC 260 Project # 4
13
4. DETENTION BASIN DESIGN The steps followed for designing the detention basin are:
Step 1: Locate proper site for construction of the basin Step 2: Determine the required volume and dimensions of detention basin Step 3: Design outlet structure Step 4: Route the outflow Step 5: Check if the design requirements are met. If the design requirements are not
met repeat step 2 to step 4 until design requirements are met.
4.1. Design Requirements The detention basin requirements are:
- The peak runoff leaving the tract after development is equal to or less than the
peak runoff leaving the tract before development.
- Runoff and basin routing computations are to be by NRCS Method.
- Basin side slopes are 3:1 (horizontal to vertical).
4.2. Detention Basin Type and Location In this project, a dry open-cut basin is proposed. The location of the basin is chosen
to be along the south-east boundary of the tract as shown in Figure 4 because this is the
lowest point on the site and is adjacent the natural stream that flows south of the tract.
Note here that a grading at the southerly border of the tract may be required in order
to flow all runoff toward the detention basin.
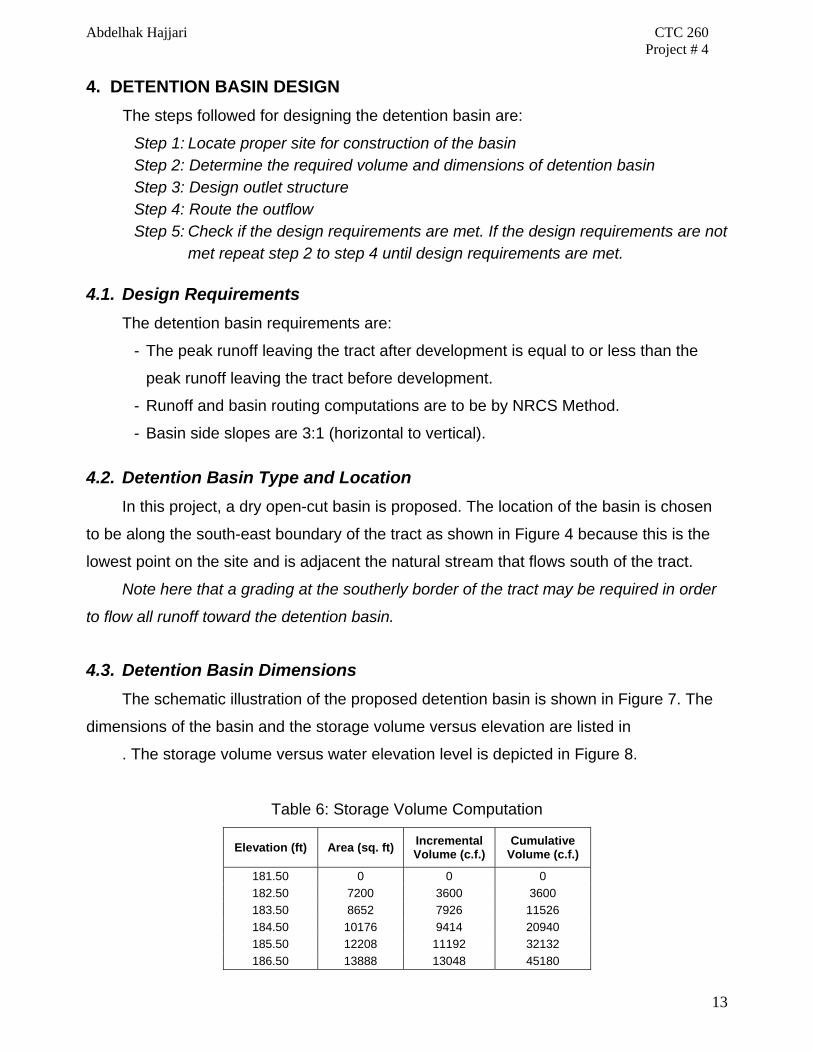
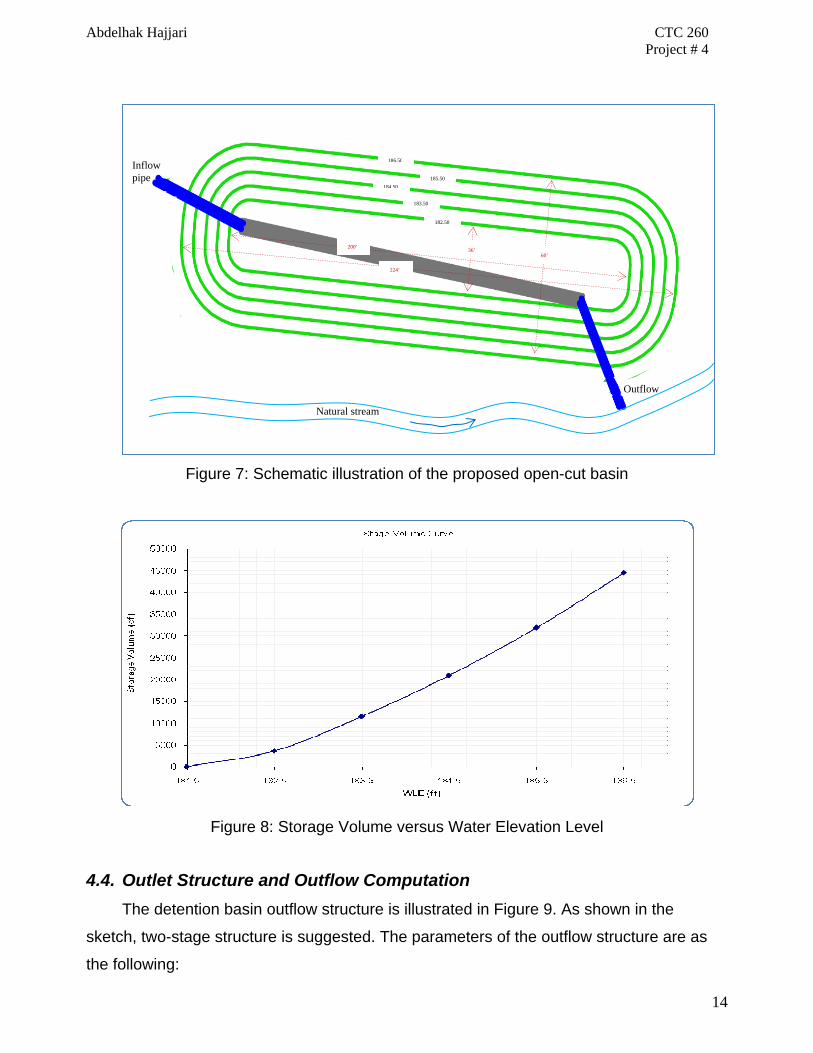
4.3. Detention Basin Dimensions
The schematic illustration of the proposed detention basin is shown in Figure 7. The
dimensions of the basin and the storage volume versus elevation are listed in
. The storage volume versus water elevation level is depicted in Figure 8.
Table 6: Storage Volume Computation
Elevation (ft) Area (sq. ft) Incremental Volume (c.f.)
Cumulative Volume (c.f.)
181.50 0 0 0 182.50 7200 3600 3600 183.50 8652 7926 11526 184.50 10176 9414 20940 185.50 12208 11192 32132 186.50 13888 13048 45180
Abdelhak Hajjari CTC 260 Project # 4
14
Figure 7: Schematic illustration of the proposed open-cut basin
Figure 8: Storage Volume versus Water Elevation Level
4.4. Outlet Structure and Outflow Computation The detention basin outflow structure is illustrated in Figure 9. As shown in the
sketch, two-stage structure is suggested. The parameters of the outflow structure are as
the following:
182.50
183.50
184.50185.50
186.50Inflow pipe
Outflow
Natural stream
36’200’60’
224’

Abdelhak Hajjari CTC 260 Project # 4
15
Orifice Weir Orifice diameter (ft) : 1.00 Crest length (ft): 1.50Area of orifice (sq. ft) : 0.785 Wall thickness (ft): 0.50Invert elevation (ft) : 181.50 Crest elevation (ft): 183.50Discharge Coefficient, c : 0.62
Figure 9: Outflow Structure of Detention Basin
The outflow computation is shown in Table 7, and the discharge rating versus water
elevation level is plotted in Figure 10.
Table 7: Outflow Computation
Water Level Elevation (ft)
Orifice Weir Total Discharge (cfs) Head,
h (ft) Discharge,
Q (cfs) Head, H (ft)
Discharge Coefficient, c
Discharge, Q (cfs)
181.50 0.00 0.00 0.00 - 0.00 0.00 182.50 0.50 2.76 0.00 - 0.00 2.76 183.50 1.50 4.79 0.00 - 0.00 4.79 184.50 2.50 6.18 1.00 3.32 4.98 11.16 185.50 3.00 6.77 2.00 3.32 14.09 20.85 186.50 4.00 7.82 3.00 3.32 25.88 33.69
Figure 10: Outflow Discharge versus Water Elevation Level
12” Orifice Invert 181.50
18” Weir Crest 183.50
Outflow pipe
Top of berm

Abdelhak Hajjari CTC 260 Project # 4
16
4.5. Outflow Routing Now that the detention basin size and the outflow structure are selected, we compute
the outflow routings to determine the peak outflow. The routing hydrograph is computed
using the routing method which relies on continuity equation [2].
First, we create a table of values of 2S/∆t - O and 2S/∆t + O versus outflow, O. For
this purpose, the storage volume and discharge rating, determined in the previous steps,
are used. The incremental time period was chosen as ∆t = 0.20 hour which is equal to 720
seconds. The results are depicted in
Table 8 and the graph is shown in Figure 11.
Table 8: Routing Computation Parameters
Cu. Volume (c.f.) Outflow (cfs) 2S/∆t - O (cfs) 2S/∆t + O (cfs) 0 0.00 0.0 0.0
3600 2.76 7.2 12.8 11526 4.79 27.2 36.8 20940 11.16 47.0 69.3 32132 20.85 68.4 110.1 45180 33.69 91.8 159.2
Figure 11: Graph of 2S/Dt+O versus O, and 2S/Dt-O versus O
The detention basin routing table is listed in Table 9. the inflow and outflow
hydrograophs are plotted in Figure 12. As seen in Table 9, by routing through the detention
basin, the runoff rate was attenuated to rate below predevelopment runoff value. The

Abdelhak Hajjari CTC 260 Project # 4
17
resulting peak outflow rate is 19.90 cfs, which is less than the peak runoff of the site before
development, and hence the detention basin design was accepted.
Table 9: Detention Basin Routing Table Time (hr) I1 (cfs) I1+I2 (cfs) 2S/Dt-O (cfs) 2S/Dt+O (cfs) O2 (cfs)
10.0 0 0.20 0.00 0.00 0.00 10.2 0.20 0.45 0.10 0.20 0.05 10.4 0.25 0.80 0.17 0.55 0.20 10.6 0.55 1.19 0.25 0.97 0.25 10.8 0.64 1.84 0.35 1.44 0.32
11.00 1.20 2.67 0.42 2.19 0.55 11.20 1.47 3.34 1.50 3.09 0.58 11.40 1.87 4.17 2.72 4.84 1.04 11.60 2.30 9.55 3.93 6.89 1.51 11.80 7.25 25.25 7.76 13.48 2.81 12.00 18.00 58.00 24.03 33.01 4.46 12.20 40.00 52.50 53.60 82.03 14.13 12.40 12.50 18.90 66.30 106.10 19.90 12.60 6.40 10.70 55.34 85.20 14.93 12.80 4.30 7.80 45.02 66.04 10.52 13.00 3.50 6.60 36.96 52.82 7.93 13.20 3.10 5.80 31.32 43.56 6.12 13.40 2.70 5.20 27.40 37.12 4.85 13.60 2.50 4.70 23.70 32.60 4.43 13.80 2.20 4.20 20.20 28.40 4.08 14.00 2.00 3.87 16.87 24.40 3.74 14.20 1.87 3.64 13.82 20.74 3.43 14.40 1.77 3.47 11.08 17.46 3.15 14.60 1.70 3.30 8.66 14.55 2.91 14.80 1.60 3.10 6.73 11.96 2.58 15.00 1.50 2.96 5.53 9.83 2.28 15.20 1.46 2.88 4.78 8.49 2.05 15.40 1.42 2.78 4.31 7.66 1.96 15.60 1.36 2.64 3.99 7.09 1.75 15.80 1.28 2.48 3.73 6.63 1.48 16.00 1.20 2.36 3.49 6.21 1.40 16.20 1.16 2.28 3.29 5.85 1.32 16.40 1.12 2.20 3.13 5.57 1.27
Figure 12: Inflow and Outflow Hydrographs
Abdelhak Hajjari CTC 260 Project # 4
18
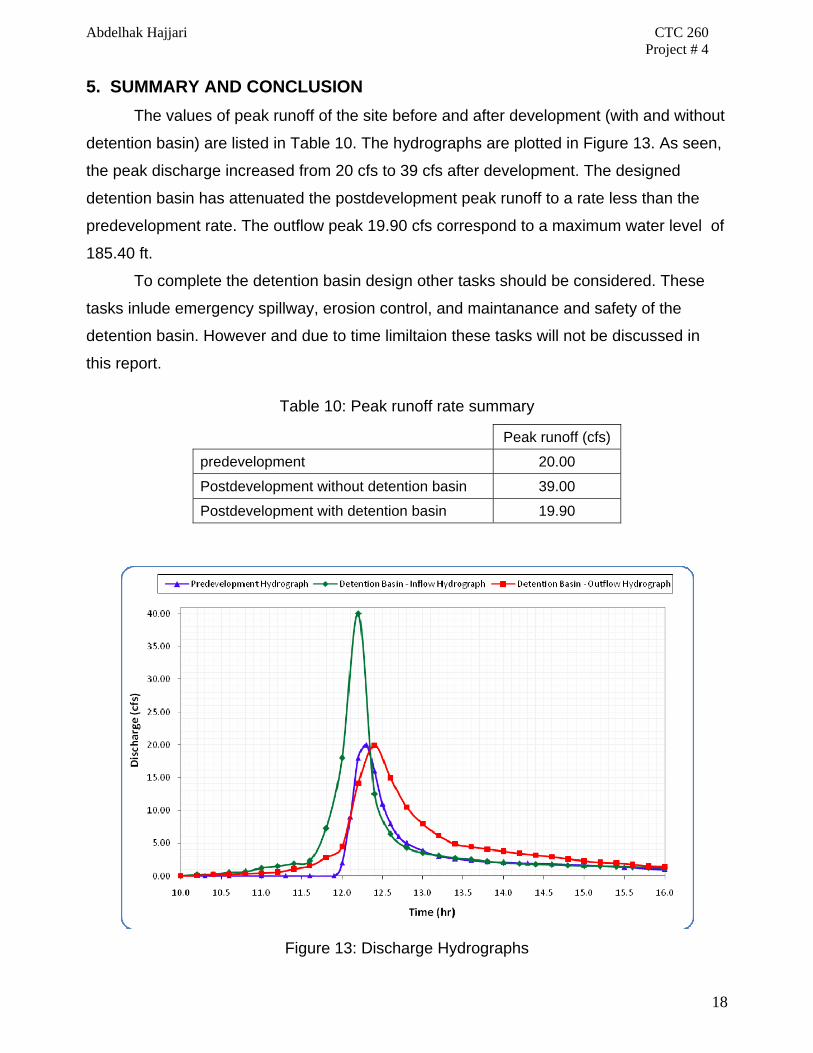
5. SUMMARY AND CONCLUSION The values of peak runoff of the site before and after development (with and without
detention basin) are listed in Table 10. The hydrographs are plotted in Figure 13. As seen,
the peak discharge increased from 20 cfs to 39 cfs after development. The designed
detention basin has attenuated the postdevelopment peak runoff to a rate less than the
predevelopment rate. The outflow peak 19.90 cfs correspond to a maximum water level of
185.40 ft.
To complete the detention basin design other tasks should be considered. These
tasks inlude emergency spillway, erosion control, and maintanance and safety of the
detention basin. However and due to time limiltaion these tasks will not be discussed in
this report.
Table 10: Peak runoff rate summary
Peak runoff (cfs)
predevelopment 20.00
Postdevelopment without detention basin 39.00
Postdevelopment with detention basin 19.90
Figure 13: Discharge Hydrographs
Abdelhak Hajjari CTC 260 Project # 4
19
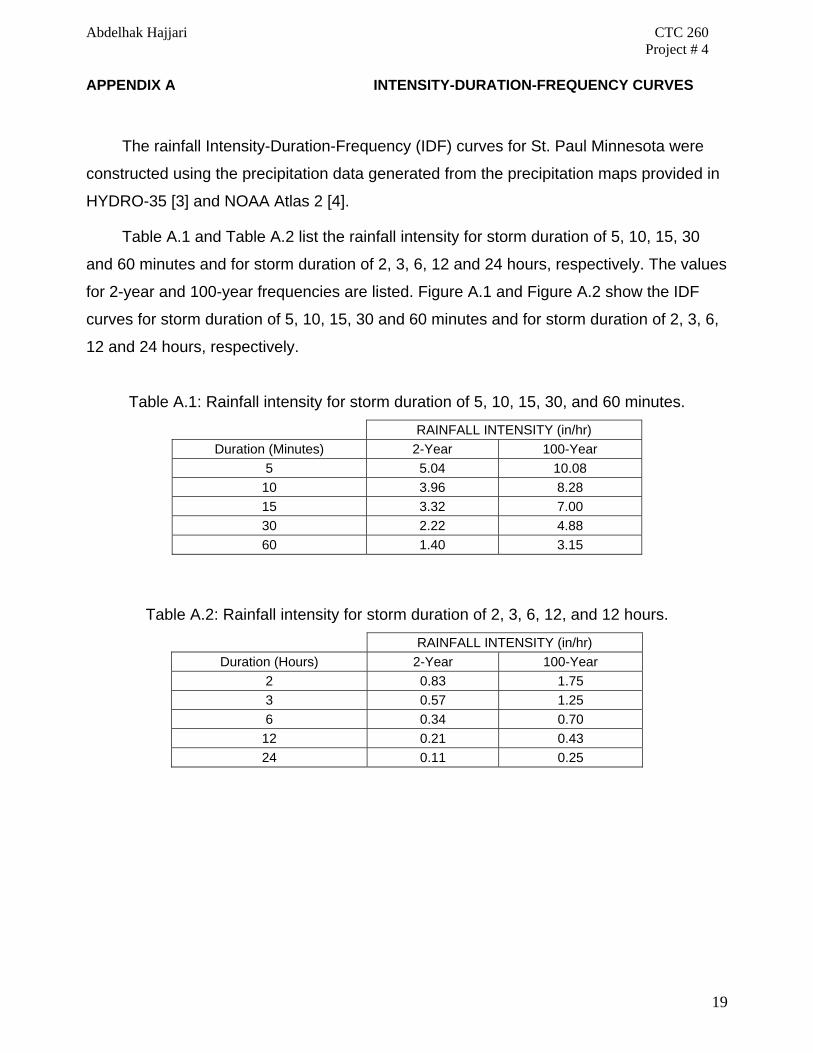
APPENDIX A INTENSITY-DURATION-FREQUENCY CURVES
The rainfall Intensity-Duration-Frequency (IDF) curves for St. Paul Minnesota were
constructed using the precipitation data generated from the precipitation maps provided in
HYDRO-35 [3] and NOAA Atlas 2 [4].
Table A.1 and Table A.2 list the rainfall intensity for storm duration of 5, 10, 15, 30
and 60 minutes and for storm duration of 2, 3, 6, 12 and 24 hours, respectively. The values
for 2-year and 100-year frequencies are listed. Figure A.1 and Figure A.2 show the IDF
curves for storm duration of 5, 10, 15, 30 and 60 minutes and for storm duration of 2, 3, 6,
12 and 24 hours, respectively.
Table A.1: Rainfall intensity for storm duration of 5, 10, 15, 30, and 60 minutes.
RAINFALL INTENSITY (in/hr) Duration (Minutes) 2-Year 100-Year
5 5.04 10.08 10 3.96 8.28 15 3.32 7.00 30 2.22 4.88 60 1.40 3.15
Table A.2: Rainfall intensity for storm duration of 2, 3, 6, 12, and 12 hours.
RAINFALL INTENSITY (in/hr) Duration (Hours) 2-Year 100-Year
2 0.83 1.75 3 0.57 1.25 6 0.34 0.70 12 0.21 0.43 24 0.11 0.25

Abdelhak Hajjari CTC 260 Project # 4
20
Figure A.1: Rainfall intensity for storm duration of 5, 10, 15, 30, and 60 minutes.
Figure A.2: Rainfall IDF curves for storm duration of 2, 3, 6, 12, and 12 hours.

Abdelhak Hajjari CTC 260 Project # 4
21
References: 1. Urban Hydrology for Small Watersheds, US Department of Agriculture Soil
Conservation Service Technical Release (TR55), http://www.info.usda.gov/CED/ftp/CED/tr55.pdf
2. Gribbin, John E., Introduction to Hydraulics and Hydrology, 3rd edition, Prentice Hall, 2007.
3. Five- To 60-Minute Precipitation Frequency for the Eastern and Central United States, NOAA Technical Memorandum NWS Hydro-35, Silver Spring, Md., June 1977.
4. Precipitation Frequency Atlas Maps (Central and Eastern U.S.), http://www.srh.noaa.gov/lub/climate/precip-atlas.