determinants and strategies for exports of agri...
TRANSCRIPT

Determ
inan
ts and
Strategies fo
r Expo
rts of A
gri-Fo
od
Firms
2018R
841
Cho Sungju ㅣ Moon Hanpil ㅣ Kim Sanghyun ㅣ Oh Saera
Determinants and Strategies for Exports of Agri-Food Firms
www.krei.re.kr
R 841 l 2018. 10. l
www.krei.re.kr
Determinants and Strategies for Exports ofAgri-Food Firms
+
601 Bitgaram-ro, Naju-si, Jeollanam-do, Republic of Korea
T. 1833-5500 F. 061) 820-2211

Cho Sungju ㅣ Moon Hanpil ㅣ Kim Sanghyun ㅣ Oh Saera
Determinants and Strategies for Exports of Agri-Food Firms
www.krei.re.kr
R 841 l 2018. 10. l

Researchers
Cho Sungju︱Research Fellow︱General research, Actual Analysis related writing
Moon Hanpil︱Senior Research Fellow︱Analysis methodology, in-depth interview related writing
Kim Sanghyun︱Research Fellow︱Export strategy, survey related writing
Oh Saera︱Researcher︱Precedent research, survey related writing
Research Report R841
Determinants and Strategies for Exports of Agri-Food Firms
Registration ︱No. 6-0007 (May 25, 1979)
Published on ︱August 2019
Publisher ︱Kim Chang-gil
Published by ︱Korea Rural Economic Institute (KREI)
(58321) 601, Bitgaram-ro, Naju-si, Jeollanam-do
TEL 1833-5500
Printed by ︱Pribe (+82-61-332-1492)
ISBN ︱979-11-6149-302-2 93520
∙ The contents of this book may be cited freely by specifying the source.
Unauthorized reproduction or copying is a violation of the law.

i
PREFACE
As a result of the proliferation of FTAs (Free Trade Agreements), both
imports and exports of agri-food have been expanding daily. Thus the
importance of policies impacting agri-food exports has increased in terms
of their effect on companies entering and applying the global value
chain, associating agriculture and food industry, developing new markets,
and creating jobs. It is therefore important to develop systematic export
strategies in the farming industry. Unfortunately, there are insufficient
studies evaluating domestic agri-food firms as leading export entities in
this continuously developing overseas market. For this reason, this study
analyzed the factors affecting agri-food companies entering and staying
in the export market, and strategies influencing export performance.
Based on the results of this analysis, we present policy implications for
strategic determinants of export performance, effective strategies for each
type of agri-food firm, and for export support programs.
We hope that the conclusion of this study based on analysis of exports
of agri-food firms from various perspectives will be a basis for study
and help stimulate future research for developing more detailed export
strategies. Last but not least, we would like to thank all the people who
helped and cooperated for this study.
October 2018
President, KREI
Kim Chang-gil


iii
ABSTRACT
Background of Research
¡ As a result of the proliferation of bilateral and plurilateral trade agree-
ments, imports and exports of agri-food have been expanding daily.
Thus the importance of policies impacting agri-food exports has in-
creased in terms of their effect on companies entering and applying the
global value chain, associating agriculture and food industry, develop-
ing new markets, and creating jobs. It is therefore important to develop
systematic export strategies in the farming industry as well.
Unfortunately, there have been few theoretical and empirical studies in
the field of domestic agri-food and on the role of agri-food exporters
as the core of new trade theory. Therefore the main purpose of this
study was to analyze the determinants of exports and the factors influ-
encing export performance for agri-food exporters. Based on the results
of this analysis, we identified strategic determinants as per export per-
formance and effective strategies for each type of agri-food firms, and
deduced policy implications to improve export support programs. This
study does have differentiated points as an empirical study that ana-
lyzed the impacts of characteristics, strategies, and in/out changes in the
surroundings of agri-food firms on decision making and export
performance.
Method of Research
¡ For our analysis, we used literature review, statistical analysis, econo-
metric analysis, surveys, interviews and expert consultation. Based on
a review of precedent studies on the analysis for determinants of export
activity and export performance, this study examined the theoretical and
empirical backgrounds, and the status of agri-food exports by analyzing
the current status of agri-food firms. Statistical data were collected from
iv
various sources and used for the analysis. We further examined the ef-
fects of corporate characteristics and changes in the external environ-
ment on export decision making and export performance utilizing
Statistics Korea’s MDIS Business Activities of Statistics Korea, aT’s
performance data for export support projects, and so forth. By using the
results of our survey of the agri-food firms, we also analyzed the rela-
tionship between export strategy and export performance by type of ag-
ri-food firm. The research model and the survey questionnaires were re-
viewed by experts and reflected in the study. We also conducted inter-
views mainly with high performance firms to complement the results of
the empirical results.
Research Results and Implications
¡ In our analysis of decisions by companies to export and the survival
of firms in export markets, the sunk cost and productivity for exports
had positive effects on export decision making in both agri-food and
manufacturing industries, supporting the self-selection hypothesis of the
new trade theory. On the other hand, the learning-by-exporting hypoth-
esis, which suggests that productivity increases with the entry of ex-
ports, was not significant. In addition, productivity improvement pos-
itively influenced the export stability in the manufacturing sector, but
not in the agri-food sector. Therefore, in order to expand exports in the
agri-food sector, it is important to create an industrial ecosystem where
many clearly differentiated agri-food firms can exist.
¡ Our analysis of the stability of agri-food export routes found that com-
panies with stable export routes had stable leads in agri-food exports.
Our examination of the factors influencing the continuity of export
routes showed that the probability of discontinuing export routes was
increased by product diversification whereas the probability of continu-
ing export routes was increased by market diversification. We also
found that the existence of these same export routes had the direct ef-
fect of increasing the probability of continuing the export; the higher

v
the relative export price and the export subsidy rate, the higher the
probability of discontinuing the export.
¡ Using our survey analysis, we evaluated the relationship between export
strategy and export performance (export per capita, export intensity,
market diversification, export growth rate and years of continuing ex-
port) as well as the effectiveness of these export strategies. By analyz-
ing entire company samples, we determined that the relationship be-
tween strategy and performance differed depending on what perform-
ance indicator was considered, and some strategies even had a negative
effect on export performance. For example, strategies focusing on ex-
port risk management including supply management, export insurance,
FX risk management, and etc. (by using export per capita as a perform-
ance variable) were found to be effective in improving export perform-
ance per capita; whereas strategies regarding monitoring of the export
market, logistics, and distribution were found to be effective to improve
export intensity. Strategies such as focusing on the main products, oper-
ating a brand management department, field surveys, and R&D invest-
ments were found to have positive effects on increasing the number of
export markets but not on export per capita or export intensity. By ana-
lyzing the effects of continuous exports by region and product group,
we observed that securing steady export volume had a positive impact
on years of continuing export, export growth rate, and so forth.
Therefore, focusing on the main products was effective in improving
export growth and targeting overseas Korean customers. Furthermore,
acquiring certification and managing mid & long-term export plans
were effective in maintaining exports. Thus, in addition to policy sup-
port for productivity improvement of agri-food firms in general, it is
advisable to improve the delivery of overseas market information, and
expand support programs for joint marketing and logistics infrastructure
in export markets for better utilization by the firms.
¡ To identify effective export strategies by type of agri-food exporter, we
divided the surveyed firms into four groups prior to analysis. Based on

vi
the results of the surveys and investigation of company practices, we
came up with the following political directions by complementing the
results of quantitative analysis.
¡ In the case of exporting fresh agricultural products (type A), we found
that emphasizing the health benefits of the product, labeling in local
languages, cooperating with local distributors and managing export risk
improved both export value and export intensity. We also show that the
possibility of expanding the pertinent market for type A firms could be
increased if they met the quarantine requirements as well as the con-
ditions of local marketing and logistics. Thus, policy instruments such
as local marketing support and provision of measures to improve price
competitiveness would be important for expanding the export market of
fresh agricultural products. In addition, since export insurance and over-
seas promotional programs are highly participative, the efficiency of ex-
port support can be improved by reinforcing policy instruments.
¡ In the case of small exporters of processed agricultural products (type
B1), focusing on current export markets along with developing poten-
tial markets such as niche markets and pursuing export stability through
export volume and risk management were shown to be effective in im-
proving short-term export performance. On the other hand, in the case
of medium-sized exporters of processed agricultural products (type B2),
aiming at large markets rather than niche markets, seeking market di-
versification and investing in R&D would be effective strategies to im-
prove export performance. Therefore, support programs to target niche
markets and to improve quality and technology competitiveness would
be effective for expanding exports of type B1 products, whereas con-
tinuing support by reinforcing existing policies can help stabilize the
exports of the agri-food industry as a whole. Putting all the results of
the surveys together, providing information on new markets and their
non-tariff barriers would enable B1 and B2 firms to advance in these
markets, while the type B1 firms can make inroads into new markets
if this is preceded by initial investment support.

vii
¡ In the case of consignment production exporters for processed agri-food
(Type C), these companies can focus on marketing and specialization
of exports relatively better than the other types of companies, so related
strategies would be effective to improve export performance. Type C
companies have competitive export strength but have difficulty pene-
trating new markets due to factors such as non-tariff barriers. Therefore
efforts to lower non-tariff barriers in trade negotiations would enable
type-C firms to expand their export market. Thus, in order to expand
overall export in the agri-food industry, it is also necessary to develop
policies to increase the export intensity of competitive exporters such
as type-C firms.


ix
CONTENTS
CHAPTER 1. INTRODUCTION
1. Need and Objective of Research ························································· 1
2. Precedent study and Distinctiveness of this Study ···························· 4
3. Contents and Method of Research ···················································· 19
CHAPTER 2. STATUS OF AGRI-FOOD EXPORTERS
1. Trend of Agri-food Export ································································· 23
2. Status of Exporters ·············································································· 25
3. Main Contents and Characteristics ···················································· 35
CHAPER 3. DETERMINANTS FOR EXPORT OF AGRI-FOOD FIRMS
1. Determinants for Exports ···································································· 37
2. Export sustainability ············································································ 50
3. Major Characteristics and Implications ············································· 72
CHAPTER 4. STRATEGY AND PERFORMANCE OF AGRI-FOOD
EXPORTERS
1. Surveys on agri-food exporters ·························································· 78
2. Export strategy analysis for agri-food firms ···································· 93
3. Identifying effective export strategies for companies by type
(survey) ······························································································· 110
4. Policy implications ············································································ 127
CHAPTER 5. SUMMARY AND IMPLICATIONS ······························ 133

x
List of Tables
<Table 2-1> Agri-food export value by countries ··································· 24
<Table 2-2> Trend for major export items and their changes ·············· 24
<Table 2-3> The number of exporters and export value for F&B and
agriculture ··············································································· 26
<Table 2-4> Number of companies and export value by industry and
employment scale ·································································· 27
<Table 2-5> Number of companies and export value (2016) by industry
and employment scale ··························································· 28
<Table 2-6> Trend of changes in export countries by company and
number of export items ························································ 32
<Table 2-7> Trend of changes in the number of export items by export
destination country ································································· 33
<Table 2-8> Trend of changes in number of export destination countries
by category ············································································· 34
<Table 3-1> gap of productivity distribution between exporters and
domestic companies: Kolmogorov-Smirnov test ················· 43
<Table 3-2> Current status of the number of exporters and their share by
industry (2006~2016) ···························································· 44
<Table 3-3> Determinants for exports analysis variables and basic
statistics ·················································································· 45
<Table 3-4> Food manufacturers and general manufacturers’ determinants
for exports ·············································································· 48
<Table 3-5> Effects of entering export markets on productivity: propensity
score matching ······································································· 50
<Table 3-6> Export stop hazard ratio for food companies and general
manufacturers ········································································· 54

xi
<Table 3-7> Comparison of export routes distribution and export
performance by type for the period for the analysis ········ 60
<Table 3-8> Variable and basic statistics used in the determinants analysis
for export routes sustainability ············································· 64
<Table 3-9> Binomial logistic regression model estimation result of
discrete hazard function for export stop(overall sample, and
by export market area) ························································· 68
<Table 3-10> Binomial logistic regression model estimation result of
discrete hazard function for export stop(by export item
group) ···················································································· 69
<Table 4-1> Survey for agri-food firms’ export strategy analysis ········ 78
<Table 4-2> characteristics of agri-food exporters survey subject ········· 80
<Table 4-3> Classification of agri-food exporters type ··························· 81
<Table 4-4> Reasons for agri-food exporters’ overseas market
penetration ·············································································· 82
<Table 4-5> Experienced difficulties when penetrating new markets ··· 83
<Table 4-6> Reasons not to consider new market penetration ·············· 84
<Table 4-7> Setting the overseas market price by agri-food exporters 85
<Table 4-8> Evaluation of global competitiveness by agri-food
exporters ················································································· 86
<Table 4-9> Export performance evaluation of agri-food exporters ······ 87
<Table 4-10> Degree of satisfaction on export evaluation of agri-food
exporters ··············································································· 88
<Table 4-11> Level of participation for export support programs by
agri-food exporters ······························································· 89
<Table 4-12> Evaluation on CEO’s expertise of agri-food exporters ··· 92
<Table 4-13> basic statistics for surveyed companies (N=500) ············· 95
<Table 4-14> Analysis results for effects of company’s export strategies
on the agri-food export performance ································ 97

xii
<Table 4-15> Continuing export routes distribution by area for 159
agri-food firms ··································································· 101
<Table 4-16> Continuing export routes distribution by item of 159
agri-food firms ··································································· 102
<Table 4-17> export growth rate and company’s export strategies ····· 104
<Table 4-18> Years of continuing export and company’s export
strategies ············································································· 108
<Table 4-19> basic statistics for companies by type ···························· 112
<Table 4-20> Strategy factors for fresh agricultural products
exporters(Type A)’s performance index ·························· 113
<Table 4-21> Strategy factors for small scale processed agri-food
exporters(Type B1) by performance index ····················· 118
<Table 4-22> Strategy factors for medium-size exporters for processed
agri-food(Type B2) by performance index ····················· 122
<Table 4-23> strategy factors for consigned production exporters for
processed agri-food(Type C) by performance index ····· 124
<Table 5-1> Agri-food firms’ export entry and continuing ·················· 137
<Table 5-2> Factors having effects on export routes sustainability ···· 138
<Table 5-3> Company’s characteristics, export strategy, and export
performance ·········································································· 141

xiii
List of Figures
<Figure 1-1> Changes in productivity distribution of a monopolistic
competition industry before and after the free trade ········· 6
<Figure 1-2> Research scope and working system ································· 21
<Figure 2-1> Trend of Agri-food Export ················································· 23
<Figure 2-2> Component ratio for agri-food exporters by intensity of
export ····················································································· 29
<Figure 2-3> Share of export value for agri-food exporters by intensity of
export ····················································································· 29
<Figure 2-4> Top agri-food firms level of trade concentration(export) ····· 30
<Figure 2-5> Changes in share of export value by major F&B and
cigarettes manufacturing countries ······································ 31
<Figure 3-1> total factor productivity distribution by industry ·············· 41
<Figure 3-2> Labor productivity distribution by industry ······················· 42
<Figure 3-3> Export survival function estimation result for food
companies ·············································································· 52
<Figure 3-4> Export survival function estimation result for manufacturers
(Excl. food) ··········································································· 53
<Figure 3-5> Estimation result of export survival function for agri-food
firms(2005~2017) ·································································· 57
<Figure 3-6> Estimation result of export survival function for agri-food
firms by region(2005~2017) ················································ 58
<Figure 3-7> Estimation result of export survival function for agri-food
firms by item group(2005~2017) ······································· 59
<Figure 3-8> Export routes by export growth rate and average export growth
rate distribution by the order of continuing year ··················· 61
<Figure 4-1> Survey results for expansion wanted export support
programs ················································································ 91


Chapter 1. INTRODUCTION
1. Need and Objective of Research
As a result of the proliferation of bilateral and plurilateral trade agree-
ments, both foreign imports and Korean exports have been expanding daily.
Thus systematic export strategies for agri-food exporters in the farming in-
dustry are needed and especially vital since they are utilizing the global
value chain1 where adding high value to products and services are partic-
ularly emphasized.
In the past several years, Korean agri-food exports have continuously
increased. According to FAO, the growth rate of world agri-food exports
was 2.1% in 2008 ~ 2016 while that of Korea was 8.7%. However, the ag-
ri-food sector accounts for only 1.2% of all Korean exports compared to
7.7% of all world exports (as of 2016).2 The export value of the agri-food
sector has been continuously increasing but other industries have grown as
well, leading it to stay at 1% of Korean exports.
The Korean government has provided various support programs and de-
1 The global value chain means a series of process (entire process from planning,
producing, packaging, and to selling) where goods or services are delivered to the
end consumers while they are distributed among companies across various
countries. (UNCTAD 2010).2 Data for agri-food export: FAOSTAT(www.fao.org/faostat: 2018. 11. 1.), Data for
product export: UN COMTRADE(comtrade.un.org: 2018. 11. 1.).

2 Introduction
voted large-scale budgets to actively expanding agri-food exports. There are
several reasons for this, including the political importance from the per-
spective of associating agriculture and the food industry, adding value and
creating jobs by penetrating new markets, and entering into the global value
chain and its utilization. Conventional agri-food export policies have fo-
cused on fresh produce or simple processed food due to the associated pos-
itive effects of increased farm income, mitigation of domestic oversupply,
and price stabilization by expanding agri-food exports. Because agri-food
export markets tend towards neighboring countries with similar food culture
and where many overseas Koreans live, capital and technology intensive
items rather than land and labor from the production perspective have been
getting the spotlight as promising export items for fresh produce and simple
processed agri-food. Consequently, agri-food export related studies have
been conducted on export items with comparative advantages and overseas
markets with relatively good conditions for export development in terms of
establishing export infrastructure, organizing producers, reducing logistics
cost, at-site consumer surveys, etc.
On the other hand, there have been few theoretical and empirical studies
in the field of domestic agri-food on the role of agri-food exporters as the
core of new trade theory3 replacing traditional trade theories based on na-
tional level comparative advantages. There have been trials to seek win-win
cooperation between enterprises and agriculture aiming to expand export by
having enterprises participate in agriculture. However, concerns that enter-
3 Traditional trade theory is represented by David Ricardo’s comparative advantage
theory and the theorem of Hecksher-Ohlin while it describes that specialization
among countries occurs depending on the productivity level (level of technology
advancement) and the level of resource possessed resulting in international trade for
respective specialized industries to resolve the problem of unevenness of production
resources. However, the type of trade where various countries export same products
among countries ever since 1960s is hard to be explained by this traditional trade
theory. Krugman(1979) explained that trade can occur in the same industry by ap-
plying the theory of increasing returns to scale and imperfect competi-
tion(monopolistic competition) to the international trade while it was acknowledged
as new trade theory.

Introduction 3
prises might compete with farmers or enter into agriculture for the purpose
of farmland speculation, rather creating new value through technological in-
novation, have dominated other concerns and prevented such trials from
proceeding in earnest.
Nevertheless, it is known that putting enterprise at the core of exports can
realize economies of scale with regard to the accumulation of production
technology and management know-how, penetration of overseas markets,
securement of sales networks, effective enhancement in the value chain, and
acquisition of capital finance.
With the exception of a small number of conglomerates, SMEs or small
exporters make up most of the agri-food exporters in Korea. It is therefore
important for policies to establish institutional frameworks helping these
companies to strengthen by accumulating export knowhow, technology in-
novation, new product development, and R&D investments. The expansion
of agri-food exports can lead the way to improved productivity and in-
creased value added. This creates jobs not only for the agriculture industry,
which is already facing many issues such as an aging workforce, congested
scaling, and oversupply, but also for all the related industries, including the
food industry, that can utilize economies of scale.
Keeping this background in mind, this study was conducted to analyze
what the determinants of export for agri-food exporters are and what factors
have positive effects on export performance. The total exports of a com-
pany can be increased by increasing the export volume (amount) of existing
export items (Intensive margin), by exporting new items to existing mar-
kets, or by developing new markets to export the existing items (Extensive
margin). The former demonstrates how solid the export is and how stable
the growth is, whereas the latter is an important factor from the perspective
of expanding the scale of exports, increasing export routes, and generating
faster growth. Based on the results of this analysis, this study has some pol-
icy implications which can be referred to in order to improve export sup-
port programs and help to identify the features of effective export strategies
based on strategy determinants for export performance and by type of ag-
ri-food firms.

4 Introduction
2. Precedent study and Distinctiveness of this Study
2.1. Theoretical background4
Traditional trade theory based on conventional comparative advantages
cannot explain the vibrant intra-industry trade wherein developed countries
with little difference in the level of technology and natural resources import
and export heterogeneous products in the same industry at the same time.
At the start of the 1980s, many experts believed that this intra-industry
trade occurred among developed countries mostly due to an imperfect com-
petitive market structure caused by economies of scale, production technol-
ogy that provided higher profit margins, product differentiation by compa-
nies, and consumer’s pursuit of diversity (Krugman 1979, 1980; Lancaster
1980; Helpman 1981).
The market structure of imperfect competition is mostly the result of
economies of scale. Especially if products are heterogeneous in the same
industry, economies of scale would play a role in promoting a monopolistic
competition structure wherein a number of companies sell differentiated
products to generate their own market dominating power (using the suppo-
sition that a company produces a single product).
Since heterogeneous products are mostly produced in industries that re-
quire accumulated technology, knowhow, and capacity for innovation, the
initial fixed investment or sunk cost, namely ‘industry entering cost’ is rela-
tively high, thus economies of scale take place. As the number of differ-
entiated products increases, the degree of availability will be higher due to
the broader range of selections that consumers can have.
However, the volume that a single company can supply will decrease as
the number of companies increases due to the limited market where similar
products compete with each other in a monopolistic competition structured
4 Written by referring to Moon(2010), Joo-Ryang Lee et al.(2014), Han-Pil
Moon(2018).

Introduction 5
industry. Companies unable to bear the increase in average cost due to the
decrease in sales volume will be liquidated while the diversification of
products will also decrease (Han-pil Moon 2018).
Thus "differentiated products producing company’s pursuit of economies
of scale" and "consumer’s needs for product diversity" function as mutual
constraint factors. Krugman (1979) insisted that international trade is the
way to solve this issue since international trade can expand the market to
sell the products of said industries. Each company can expand its pro-
duction scale, thus reducing the average production cost. Eventually, the
consumers of each country can consume new products from other countries
through this international trade. In addition, the reduced average cost by
trade yields decreases in the average price of products and increases in con-
sumer’s actual income (Han-pil Moon 2018).
Intra-industry trade takes place between two countries with little difference
in the level of technology and natural resources due to producers of differ-
entiated products and consumer’s needs for product diversity. This kind of
intra-industry trade can confer a benefit on diversity and actual income growth
for all the entities of the economy. It is contradictory to the idea that the
welfare of all involved countries would increase but there would be some
contracted industries in the traditional trade theory (Han-pil Moon 2018).
Melitz (2003) proved how free trade can create new levels of benefits by combin-
ing the income increase as per the scale up, monopolistic competition market struc-
ture, and consumer’s preference for diversity, if there are ‘heterogeneous firms'
producing differentiated products in the industry with economies of scale.
Melitz’s (2003) heterogeneous business model is based on the following
three assumptions. First, there are a variety of companies with different
productivities, thus implying a product’s distinctiveness in the industry with
economies of scale (monopolistic competition market is assumed). Second,
the productivity distribution of heterogeneous companies is a normal dis-
tribution while the shape of the distribution will be determined by the level
of technology of the country or industry (comparative advantages among
countries are assumed). Third, each company invests fixed cost at the point
of its respective productivity in the distribution, then the cost will be real-
ized after the company enters into the industry. Based on the foregoing as-
sumptions, <Figure 1-1> illustrates the productivity distribution of an

6 Introduction
industry. The productivity of a company would be higher if located further
right on the axis, implying productivity further left means lower pro-
ductivity of a company. In other words, the companies located further right
on the productivity distribution scale of the industry would have lower mar-
ginal production costs, while those located towards the would have higher
marginal production costs (Moon 2010; Joo-Ryang Lee et al. 2014: 21).
After entering into a relevant industry, a company that can acknowledge
their relative productivity levels recovers its fixed costs but if it is below
the , the minimum level that can create profits it will exit from the industry.
Based on the foregoing, the productivity of this industry has a shape of
left-truncated distribution, and the average productivity becomes . If free
trade takes place in this industry under these circumstances, then foreign com-
panies, which can bear all the fixed costs for export such as overseas market
research costs and cost for securing logistics network, together with variable
costs such as tariff and transportation cost, will enter into this domestic market.
At that point, domestic companies with relatively low productivity will be
liquidated while the minimum entry level of productivity will be higher at
. As a result, the average productivity of this industry is increased to .
On the other hand, the domestic companies with high level of productivity
bearing additional costs for their international trade can make inroads into
overseas market thus increasing profits. This can apply to the small number
of companies with the level of productivity above in the right side graph
of the <Figure 1-1> (Moon 2010; Joo-Ryang Lee et al. 2014: 22).
<Figure 1-1> Changes in productivity distribution of a monopolistic competition
industry before and after the free trade
Source: Joo-Ryang Lee et al.(2014).

Introduction 7
While it is common knowledge that an individual company can increase
its market share and profits by improving its productivity. Melitz’s (2003)
‘heterogeneous business model' is acclaimed for providing a new theoretical
background for free trade where the average productivity of an entire in-
dustry can be increased by self-selection in exports and intensified competi-
tion due to an increase in imports without any increase in an individual
company’s productivity. The Melitz model also drew the positive con-
clusion that the production resources of liquidated companies due to the in-
tensified competition as per the market-opening, are reemployed by the new
entries and companies with higher productivity (which need to increase
their scale by export) leading to redistribution of the production resources
in the industry (Moon 2010; Joo-Ryang Lee et al. 2014: 22).
Furthermore Lileeva and Trefeler (2010) recently presented research that
showed that companies, which used the excess profit from free trade were
able to gain much more from advanced manufacturing technology by improv-
ing labor productivity and by focusing on product innovation. They also paid
attention to the fact that the foregoing factors acquired by free trade induce
companies to put more investment in R&D. While the companies with high
expected return on R&D investment, which currently do not have high pro-
ductivity but believe they can maximize profits once the market expands due
to increased trade, enter into the export market. These differences in efforts
to improve their productivity also reinforces their differentiation, thus increas-
ing the average productivity of the entire industry. Therefore this can be seen
as a broadening of the ‘gain of trade’ view that was newly proposed by Melitz.
According to the new trade theories developed since Krugman, the com-
panies in the industry with economies of scale can produce their differ-
entiated products by adding their own characteristics, while trade provides
the companies with more opportunities to utilize the economies of scale
thus targeting the more expanded world market. The consumers of each
country also have more variety of products to select from which increases
their usefulness. Thus, it was found that economies of scale and monopo-
listic competition, apart from their comparative advantages, are the cause of
intra-industry trade. Intra-industry trade creates new type of trade benefits
such as reduction in industry’s average costs, increase in average pro-
ductivity, and expansion of product diversity.

8 Introduction
2.2. Research on determinants for export
The majority of research dealing with determinants of export activity is
mainly empirical analysis of fixed costs and productivity for export, and the
relationship between the company’s characteristics and export activity based
on the previously reviewed theoretical background.
The studies analyzing the relationship between export activity and pro-
ductivity are vibrantly conducted and there has been various empirical anal-
ysis conducted before Melitz (2003). These studies were designed to inves-
tigate not only the causality between export activity and productivity but al-
so the direction in which these effects operate. It can be represented mainly
by two research hypothesis: one is the self-selection that the productivity
has positive effects to export, and the other is learning by exporting that
the company’s productivity is enhanced by export. Wagner (2007, 2012,
2013) organized the research results of empirical analysis by various
countries.
Bernard and Jensen (1999) published the representative research showing
that companies with high productivity (good firms) are the ones that export
and that export activity improves the performance of companies. The results
of their analysis confirmed that the companies with high productivity be-
came exporters. Both growth rate and success measures are shown to be
high for the exporters. On the other hand, the effect that export activity has
on the performance of the company is uncertain. The rate of increase for
employment and survival probability are higher for the exporters whereas
it is shown that export activity does not necessarily improve productivity
and increase income level.
According to Wagner (2007)’s theorem, the self-selection theory is more
consistently identified than the learning by exporting theory in most of the
studies. However, the research by Baldwin and Gu (2003), Van
Biesebroeck (2005), and De Loecker (2007) proved that the theory of learn-
ing by exporting effects was validated using national data from Canada,
African countries, and Slovenia. The study of De Loecker (2007, 2013)5 as
5 De Loecker has proceeded the study based on the Slovenia business data since

Introduction 9
a representative work based on Slovenia business data (1994~2000) after
controlling the self-selection effects proved that theory of learning by ex-
porting effects and that specifically the export market entry effect as per the
productivity was valid. De Loecker (2007) showed that the learning by ex-
porting effects by industry took place at various timings and the effects
were higher for companies exporting to developed countries. In the case of
the Slovenia food industry, the learning by exporting effects took place two
years after exports started. The author also explained that the effect of pro-
ductivity improvement occurred through starting to export rather than
through the export activity on its own.
Studies regarding the relationship between the exports of Korea and pro-
ductivity have been conducted by Aw et al. (2000), Hyun-Ho Kim &
In-Yong Shin (2008), and others. Aw et al. (2000) showed that the relation-
ship between the exports of Korea and productivity did not seem to be
significant. On the other hand Hyun-Ho Kim·In-Yong Shin (2008) using
the dynamic estimation method showed that the learning by exporting ef-
fects did take place between two parties in Korea but self-selection effects
did not occur.
2.3. Research on determinants for export performance
The studies of Cavusgil and Zou (1994), Shoham (1998), Zou and Stan
(1998), Carneiro et al. (2016) represent the current research on the export
performance of companies. According to these studies, items such as export
2004, and presented the complemented research in 2013 in continuation of 2007
presentation. According to De Loecker(2007), explained that the learning by export-
ing effects could more easily be identified in the data of economic transition era
or the countries in the situation. The study of 2013 was a developed version of
model used in 2007 where the model was complemented for the productivity is en-
dogenously determined as per the experience. The author explained that the export
dummy, level of export concentration, or export value can refer to as export experi-
ence while he used the export dummy.

10 Introduction
value, export intensity, export profitability, growth rate of export, a com-
pany’s satisfaction on export performance, and export sustainability
(survival) are referred to as export performance. Many researchers who ana-
lyze export performance determine their export performance indexes by re-
ferring to these particular studies. Shoham (1998) in particular itemized the
export performance indexes as turnover, rate of return, and rate of change.
Export intensity and export value can be used as a concept of turnover,
whereas the rate of return on assets or investment and the limited rate of
return can be used as a rate of return. In addition, the export value rate of
change, export intensity rate of change, export market diversification, and
export sustainability can be used from the perspective of rate of change. A
company’s subjective satisfaction can also be included as an export per-
formance index.
A. Research on determinants of export value
Dong-Yoon Oh (2012) analyzed export trade data of SMEs and
Conglomerates from KITA to determine how the export destination coun-
tries’ (35 states) GDP, population, tariff rate, changes in FX, OECD mem-
ber nation status, and culture index affected export value. The results of
their analysis showed that Korea’s SMEs were affected to a greater degree
by the changes in environment of the export destination countries compared
to the conglomerates. SMEs cannot quickly cope with the economic growth
of the export destination countries compared to conglomerates. As the dis-
tance from the export destination country increases and the tariff increases,
the export value for a company decreases, leading to greater reduction for
SMEs. It was also found that cultural differences in export markets affect
SMEs more than conglomerates.
Jung-Gon Kim et al. (2014) empirically determined that a lack of in-
formation on the laws and system of overseas markets could be an export
market entry barrier for SMEs. He utilized the Korea Customs Service’s ex-
port data of 2002~2013 and found that the complexity of laws and systems
in overseas markets, especially the complexity in resolution of contract dis-
putes, had more negative effects to SMEs than conglomerates. Therefore he

Introduction 11
concluded that government support is needed with regards to the foregoing,
especially focusing on the vulnerable SMEs.
By examining the value of agricultural exports based on the item, export
destination country, and year together with the basic gravity model Han-pil
Moon et al.(2012) analyzed how fresh produce exports are affected.
Specifically, to measure the effects of export support programs, he used the
accumulated amount of support for export promotion as a variable exclud-
ing the support for export logistics and logistics costs. The results of his
analysis show that the government’s export support programs (export logis-
tics cost support and others) had positive effects on export expansion. The
effects of export logistics cost support were prominent for fruits and flow-
ers while the promotion support including other infra support was most ef-
fective for mushrooms. It was also found that fresh agricultural product ex-
ports would increase as the economy of overseas markets increased, espe-
cially for markets with closer proximity, whereas the per capita national in-
come and relative FX rate had little effect.
B. Research on determinants for export intensity
By using business unit data, Sterlacchini (2001) analyzed how factors
such as scale, business collaboration, geographic location, and corporate in-
novation (portion of R&D personnel) of a company or industry affect the
export performance (export probability) and intensity of export (Intensity,
export value/turnover) of manufacturers in Italy. Sterlacchini used the logit
and Probit model for the analysis while the effects of variables were varied
depending upon the scale of the analysis results. The major results of his
analysis can be summarized as: 1) For small companies with low turnover,
the scale and export performance had a positive relationship, 2) the rela-
tionship between business collaboration and export performance was neg-
ative for SMEs but positive for conglomerates, which is because SMEs
mainly conduct business collaborations for the domestic market but con-
glomerates have international business collaboration, and 3) R&D generally
has a positive relationship with export performance but some react differ-
ently depending on the scale of company.
12 Introduction
Using Germany’s manufacturing business data, Wagner (2006) analyzed
how export intensity affected the characteristics of a company by utilizing
quantile regression. This study found that the effects of the export intensity
on the characteristics of a company varied by quantiles. Firstly, it was
found that the scale of company had effects only when the intensity of ex-
port was at the low 1/4 quantile while the fact that it has a subsidiary had
significant effects when it was at the upper 1/4 quantile. The effects of
R&D also varied by quantile, while the presence of patents did not have
significant effects on the low quantile.
Using business unit data, Iyer (2010) analyzed the factors that had effects
on the intensity of export (Share of export value on turnover) of New
Zealand’s agriculture and forestry industries (including manufacturing and
services). The analyzed data was New Zealand’s Longitudinal Business
Database which Iyer analyzed by using data from 2000~2006 with the pan-
el possibility effect model. Labor productivity, employment scale, number
of export markets, number of export items, corporate age, domestic market
share, sector intensity of export, number of exporters by sectors were all
considered as independent variables. As a result of the analysis, it was
found that better labor productivity yielded higher intensity of export. They
also found that the diversification of export markets and export items and
the intensity of export had a positive relation.
C. Research on export sustainability and analysis of determinants
Prior studies regarding the sustainability of trade have mainly dealt with
the sustainability of bilateral and plurilateral trade relations by using the en-
tire industry type or manufacturing trade statistics (Besedes and Prusa
2006a, 2006b, 2011; Nitsch 2009; Obashi 2010; Hess and Persson 2011,
2012; Cadot et al. 2013). In the field of agri-food, Peterson et al. (2017)
had recognized the importance of the sustainability of the import countries
importing fresh vegetables and fruits (HS 6 digit detail #) from the U.S.
during 1996~2008 and drawn the affecting factors.
For industrial studies outside of the agri-food fields, there are reports by
Fugazza and Molina (2009), Ilmakunnas and Nurmi(2010), Pérez et

Introduction 13
al.(2004), Fu and Wu(2014), etc. Fugazza and Molina (2009) analyzed ex-
port sustainability of items by nation and what factors had effects on
sustainability. The authors established a database by using the export value
for HS 6 digit items from 96 nations, variables by nations from the World
Bank, CEPII, and so forth. They analyzed this database using the Cox pro-
portional hazard model and found that the period of continuing export
would increase as the economy level increased, whereas the risk of exports
ceasing would be lower if the export product was differentiated. They also
found that the possibility of exports ceasing would be higher as export
costs were higher, but these effects weakened over time.
Ilmakunnas and Nurmi (2010), Pérez et al. (2004), Fu and Wu (2014)
used discrete time event analysis and calculated the pattern of exporting pe-
riods and the possibility of exports ceasing for manufacturers from Finland,
Spain, and China. They then analyzed the factors that had effects on the
continuation of exports (risk of export being stopped). Ilmakunnas and
Nurmi (2010) separately estimated the export entry and export stop model.
As a result of their analysis, it was observed that the possibility of export
entry would increase and the risk of export stoppage would decrease based
on the following characteristics: the higher the company employment, the
older the corporation, the degree of internationalization of the company (if
the overseas capital is over 50%, then it is an overseas company), the high-
er the capital intensity, the higher the labor productivity, and the higher the
exporters portion in the industry export. It was also found that the
price/cost margin, and the fact that it is a multi-unit company or not were
statistically significant only for the model of export being stopped while the
risk of export being stopped would be lowered if the number of companies
one possesses is lesser . The GDP growth rate was also considered as an
external environmental factor but was not found to be statistically
significant for both models.
Pérez et al. (2004) and Fu and Wu (2014) showed similar results in their
studies. It was found that the risk of exports ceasing would decrease when
the scale (employment) was bigger, labor productivity was higher, and the
export intensity is higher. Fu and Wu (2014) compared the effects of ex-
planatory variables for the time when considering unobserved heterogeneity
of the observed value, and the other way around while it is found that the

14 Introduction
effects mostly occurred in a constant manner.
As an example of a domestic study, Sang-sik Jang (2015) analyzed the
export sustainability of business units. He analyzed the determinants for ex-
ports continuing or stopping on a yearly basis by utilizing KITA’s business
unit export data of 2003~2014. Additionally, he conducted surveys and fur-
ther examination of exports continuing or stopping based on the data ac-
tually being used by the business units. In the analysis of determinants for
exports continuing or stopping, the Probit model was used, whereas the ex-
ports stopping or continuing were dependent variables, and the number of
export items, number of export countries, export value, item dummy, and
country dummy were used as independent variables. As a result of this
analysis, it was found that the factor most affecting the continuation of ex-
ports was an increase in the number of export countries rather than in the
number of export items. It was also found that mineral products or chem-
icals as export items and Japan as the export destination country gave a
higher possibility to continued export. On the other hand, export sustain-
ability was very low for agriculture, forestry, and fishery products.
Additionally, the export sustainability for the Chinese market became lower
for new exporters to the market in the latter period than that in the earlier
period.
D. Other research regarding export performance
Yu-Hyun Nam and Cheol Lee (2013) analyzed the determinants of export
performance by using an integrated model they developed by combining the
E-S-P based on industrial organization theory and resource-based theory
(which is perceived to be a major theory of determinants for export per-
formance), the RBV model, and relational perspective based models that
appeared after the mid 1990’s. The data was collected by conducting sur-
veys from domestic manufacturers who were exporting overseas and the
structural equation was used as the analysis method. Their developed in-
tegrated model has a high degree of model fits. It also better explains the
export performance than using each individual model. This model also ex-
plains the determinants for export in a more comprehensive view than from

Introduction 15
a single point of view. As a result, they found that both competitive advant-
age and the quality of relationship with importers in the export market have
positive effects on the export performance.
Hui-Yong Lee, Jung-Hyun Yoon and Taek-Dong Yeo (2011) observed
that the organizational characteristic variable, management characteristic
variable, environmental characteristic variable, and technological character-
istic variable all have effects on the globalization of business (including ex-
port activities) and suggested that the government’s export support pro-
grams have significant effects on the relation between the above variables
and globalization of a business. The data were collected by surveys and
they drew out factors by using factor analysis (principle component analy-
sis) in order to verify the validity of these characteristic variables. As a re-
sult of conducting a moderated multiple regression analysis (cross varia-
bles) with the drawn factors, they found that R&D capabilities, global di-
rectivity, the overseas market environment, technological competences, and
technological imitation improved globalization, whereas the effect these
characteristic variables had on globalization varied as per the government’s
export support programs.
Jung-Gwon Kim (2001) conducted an analysis based on the conceptual
frame among environmental factors ranging from the ins/outs of companies,
their export marketing strategy, and export performance, which Porter and
others had previously presented. Kim collected the data for export in-
dustry/market’s characteristics, corporate characteristics, export marketing
strategy, and export marketing performance by conducting business surveys.
In order to analyze the relationship among the environmental factors, export
marketing strategy, and export performance, the factors were abstracted by
using exploratory factor analysis. A research model for confirmatory factor
analysis was then established based on the foregoing. He found that product
adaptation, promotion adaptation, support for overseas distributors/sub-
sidiaries, and experience in export were the major determinants for export
performance through the confirmatory factor analysis and path analysis.
Whereas the factor of price competitiveness was found to have relatively
little effect.

16 Introduction
2.4. Research on agri-food export strategy
Studies regarding the agri-food export strategy have been conducted
extensively. The majority of the studies target export expansion at the na-
tional level and have established export promotion strategies and presented
recommendations for improvement.
Gi-Hwan Park et al. (2013) identified some of the pending issues and
evaluated the current status of agri-food exports through the surveys of
dedicated horticultural production complex and processed food exporters,
the degree of concentration on export destination countries, and review of
government support programs for processed food. They then presented the
mid & long-term policies vital to promote agri-food exports. The basic
guidelines of the suggested policies are to establish infrastructure for secur-
ing stable export volume, to promote export oriented items, to strengthen
the relationship between agriculture and processed food export, and to ex-
pand the market deviating from the dependency of specific export market.
Gyeong-Pil Kim & Jung-Hoon Han (2015) investigated the government’s
support programs for export organization and then presented promotion
measures for better sustainable export organization by identifying their ac-
tual condition of operation. In particular, they emphasized the need to en-
hance efficiency of the promotion program, which the government con-
ducted to systematize producers and exporters. Their analysis showed that
export leading organizations that promoted for the systematization of pro-
ducers and exporters did not have better efficiency than the non-leading ex-
port organizations in terms of operation performance (export value, unit
cost for export). In addition, they analyzed the factors affecting an export
organization’s operational performance. They then presented the measures
needed to enhance the relationship between exports and distribution organ-
izations, and listed the recommended core tasks by main agent and the type
of export organization.
Myeong-Geun Uh et al. (2011), and Gyeong-Pil Kim, Sang-Hyun Kim
and Jung-Hoon Han (2017) conducted overseas consumers’ surveys and
market characteristic surveys for Korea’s export destination countries or
newly entering markets. They then presented the improvement measures

Introduction 17
they deemed vital for Korea’s export support programs and export strategies
by countries and products. Myeong-Geun Uh et al. (2011) looked for sol-
utions to expand agri-food export by mainly focusing on the newly rising
export countries (Vietnam, Russia, and etc.). They estimated the market
share of items by analyzing export performance, reviewing the govern-
ment’s export support programs, conducting actual field surveys and con-
sumer surveys. By evaluating all of these, they drew suggestions for the di-
rection for government or local governments’ production support policies.
They then emphasized the need for creating social requirements that ex-
porters can pioneer overseas markets and further develop promising items.
Specifically, they classified the agri-food export marketing strategy into
three domestic stages (production, merchandising, and export logistics) and
three overseas stages (quarantine & customs clearance, import distribution,
overseas consumers’ purchase) and then proposed the strategy important for
each stage. Gyeong-Pil Kim, Sang-Hyun Kim and Jung-Hoon Han (2017)
conducted consumer surveys of two important export markets, Vietnam and
UAE. They further investigated the difficulties, successful entry, and entry
failure samples by export stage for domestic exporters in order to refine the
strategy to expand Korea’s agri-food export markets. As a result of the con-
sumer surveys, they found that the factors affecting Vietnamese consumer’s
purchases of South Korea’s agri-food are cultural factors including dramas
and the images of South Korea. Whereas the major factors influencing con-
sumers from the UAE were images of South Korea, interest in safety, Halal
certification, and functionalities. Based on the results of their analysis, they
suggested an export strategy focusing on selection of main items by export
markets, enhancement of quality and price competitiveness, merchandising
strategy, and marketing/promotion strategy. In addition, they also compre-
hensively presented the roles of main agents (producers, exporters, and gov-
ernment) on the tasks important for expansion for export markets and sup-
port programs for each stage.

18 Introduction
2.5. Distinctiveness of this study
Previous research on agri-food exports has primarily focused on pre-
sentation of policy issues to improve competitiveness of the agri-food in-
dustry unit and to expand export markets. Thus there have been few studies
on the business unit as a main agent of agri-food export as compared to
other industries such as manufacturing. In addition, many studies have fo-
cused on fresh produce, thus resulting in insufficient analysis on the food
industry, which is one of the main components of agri-food exports.
This study conducted business unit analysis differently from many pre-
vious analyses conducted on agri-food exports based on national level trade
data or industrial level data. Specifically, this study analyzed the factors
that differentiated characteristics of heterogeneous agri-food firms that have
effects on the determinants for export. It also analyzed from multi-angled
perspectives the relationship between business strategies and various export
performance indexes considering the agri-food firms by type, item groups,
and export destination countries. With that in mind, we review the ag-
ri-food firms’ differentiated export expansion strategy and best practices
and then propose policies for export expansion of the whole agri-food
industry. Therefore, this study is distinctive from the standpoint that it is
an empirical study analyzing the effects of agri-food firms’ characteristics
and strategy, the in/out environmental changes on the determinants for ex-
port and finally export performance.

Introduction 19
3. Contents and Method of Research
3.1. Contents and range of research
This study defines agri-food firms as corporations involved in agriculture,
food production, and export. Among these agri-food firms, it is known that
the companies involved in the export of processed food are relatively siz-
able whereas the majority of exporters dealing in fresh produce or simple
processed food are small businesses. Agri-food firms are diverse types of
companies, for instance, commodity unit exporters or exporters who work
only on produced agricultural products in the dedicated horticulture com-
plex, exporters leading the supply and quality management by connecting
or systematizing individual farms and producer organization, agricultural as-
sociation corporations which producers directly deal with for export, export
union corporations being jointly invested by a number of exporters and pro-
ducers’ organizations, and many other participants in the export market
dealing with vegetables, fruits, flowers, short-term forest products, and sim-
ple processed food.
This study targeted small and medium size agri-food firms as the major
subjects for analysis among the various types of agri-food exporters.
However, analysis of determinants for exports and some areas of export
sustainability were hampered due to the limited availability of useful sta-
tistics. The target agri-food firms are thus limited to companies in the cate-
gories of food and beverage manufacturing from the secondary classi-
fication of Korean Standard Industrial Classification. In addition, when ana-
lyzing the sustainability for microscopic export routes and export strategies,
there are many small and mid-size agri-food exporters being excluded from
surveys of business activities.
The major contents of our analysis are as follows. First, the factors de-
termining entry into the export market, being liquidated from the market,
and being sustained or not were analyzed for all the agri-food firms, Then
the performance factors were analyzed for the exporters. The various in-
dexes including export value, export intensity, export sustainability, and

20 Introduction
market diversification were used to gauge export performance. Furthermore,
we investigated the performance factors for agri-food exporters by type to
highlight any different points. This study overcomes the limitations of pre-
vious quantitative analyses by using case analysis and surveys, and then de-
veloping strategies for the exporters based on type of export and policy
issue.
The following are included in this report in detail. First, the current status
of agri-food exporters is analyzed. The exporters' distribution by scale and
characteristics together with the current status of the entire export of ag-
ri-food industry is identified. Then the overall situation compared to other
industries is explained. Second, empirical analysis on the determinants for
exports of agri-food firms is conducted. Specifically, this section analyzes
what kinds of characteristics are critical for companies among the agri-food
firms entering into the export market. The study also analyzes sustainability
after entering the export market by focusing on the relationship between
productivity and agri-food firms export activity. Third, factors for previous
exporters that have effects on expansion of exports and new market devel-
opment were analyzed using various indexes including export value, export
intensity, market diversification, and export sustainability. Fourth, the rela-
tionship between export strategy and export performance of agri-food firms
is analyzed. Companies were classified by export items, scale, and pro-
duction method using the survey data. Strategic characteristics by firm type
were also analyzed. In addition, the strategies that have effects on the unit
export performance by item group and area from the perspective of in-
tensity of export were also investigated. Lastly, this study proposes neces-
sary policy directions to enhance the competitiveness of agri-food firms and
improve export support programs based on the results of analysis.

Introduction 21
<Figure 1-2> Research scope and working system
Source: Author generated.
3.2. Method of Research
This study utilized various methods including literature review, statistical
analysis, econometric analysis, surveys, interviews, and expert consultation.
After reviewing the precedent studies on determinants for export activity
and performance, the theoretical and empirical background of this study is
presented. In addition, the current status of South Korean agri-food exports
is reviewed by analyzing the current status of agri-food firms.
Next, the statistical data are collected and analyzed. How various busi-
ness characteristics and the inside and outside environmental changes have
effects on the determinants of export activity and export performance is an-
alyzed by using Statistics Korea’s MDIS survey of business activities

22 Introduction
(released each Year), aT’s export support program’s performance data, and
so forth. This study analyzes the relationship between export strategies by
firm type and export performance through the agri-food firm surveys.
In order to qualitatively complement the results of our analysis, research,
and empirical analysis, expert consultation and interviews were conducted.
Opinions on our research model and survey questionnaires from outside
professionals were reviewed and reflected in the research. Interviews focus-
ing on members of the companies with the best practices among the survey
respondents were also conducted thus complementing our empirical
analysis.

Chapter 2. STATUS OF AGRI-FOOD EXPORTERS
1. Trend of Agri-food Export
The value of South Korea’s agri-food exports for 2015~2017 averaged
US$6.46516 billion a year, but was continuously increasing over those 3
years. The value of 2017 exports was US$6.82649 billion, which is an in-
crease of 124% compared to that of 2008, 10 years ago.
<Figure 2-1> Trend of Agri-food Export
unit: US$ mil
Source: Written by the author based on the data from KATI (www.kati.net: 2018. 8. 20.)

24 STATUS OF AGRI-FOOD EXPORTERS
During the 2015~2017 period, South Korea’s major export countries in-
cluded Japan, China, USA, UAE, and Vietnam. The export value from
these 5 countries accounted for approximately 57.6% of the entire export
value. For exports in 2008, the top 5 export destination countries included
Japan, China, USA, Russia, and Hong Kong. Thus there are some differ-
ences in the export portion by countries but it is safe to say that the major
export markets have not changed much. The number of agri-food export
destination countries was 181 in 2008 and expanded to 206 in 2017.
<Table 2-1> Agri-food export value by countries
unit: US$ mil
2009 2011 2013 2015 2016 2017 2015~2017 Average
Japan 846 1,381 1,168 1,287 1,159 1,314 1,253
China 419 915 1,047 948 1,097 986 1,010
the US 338 419 627 523 716 746 662
UAE 158 189 334 188 414 447 350
Vietnam 87 214 371 354 403 375 377
Other countries 1,450 2,266 2,557 2,425 2,676 2,958 2,686
Source: Written by the author based on the data from KATI (www.kati.net: 2018. 8. 20.)
In 2015~2017, Korea’s major export items were cigarettes, other con-
fected agricultural products, confectionery, noodles, and liquors, with ciga-
rettes and processed food accounting for a large portion of the export value.
Compared with the 2008~2010 average, the major export items were sim-
ilar while beverages and other confected agricultural products had grown
the most as a proportion of all agri-food exports.
<Table 2-2> Trend for major export items and their changes
unit: US$ mil.
2008~2010 Average 2015~2017 Average
Rank itemExport
valueportion item
Export
valueportion
1 cigarettes 495 14.2 cigarettes 1,046 16.2
2Other confected
agricultural products326 9.4
Other confected
agricultural products926 14.3
3 liquors 264 7.6 confectionery 438 6.8

STATUS OF AGRI-FOOD EXPORTERS 25
(continued)
2008~2010 Average 2015~2017 Average
Rank itemExport
valueportion item
Export
valueportion
4 confectionery 263 7.6 noodles 418 6.5
5 vegetables 254 7.3 liquors 382 5.9
6 noodles 216 6.2 vegetables 331 5.1
7 sugars 215 6.2 beverages 325 5.0
8 coffee 206 5.9 fruits 274 4.2
9 fruits 174 5.0 sugars 272 4.2
10 sauces 120 3.5 coffee 272 4.2
others other agri-food 944 27.1 other agri-food 1,781 27.5
Note: The AG code’s secondary classification is applied for classifying the items. The other
agri-food implies the item with outside the rank of 10th.
Source: Written by the author based on the data from KATI (www.kati.net: 2018. 8. 20.).
2. Status of Exporters
The Statistics Korea’s trade statistics by corporate characteristics with
business unit survey data and aT’s export support program’s performance
data6 were used to examine the current status of agri-food exporters. The
trade statistics by corporate characteristics are the trade data, in which Korea
Customs Service and Statistics Korea aggregated the companies based on
export performance after reconciling the list of companies based on the ad-
ministrative statistics of company life cycle and the list of trade based on
the import & export report, and then for the companies with export
performance. This provides information such as number of exporters by
corporate characteristics, value of import and export, trade balance, and so
forth. However, it has a limitation on identifying the current status of ex-
ports by agri-food firms and exporters since the range of industry type is
not revealed in detail. Thus the aT’s support data was used as a supplement
for examining the current status of export for agri-food firms and exporters.
6 aT internal information.

26 STATUS OF AGRI-FOOD EXPORTERS
2.1. Trade statistics by corporate characteristics
According to trade statistics by corporate characteristics, the number of
exporters for F&B manufacturing (food and beverage manufacturing) was
1,500 with an export value of approximately US$3.257 in 2016. The num-
ber of exporters and export value for food manufacturing in 2016 had in-
creased by 32.1% and 11.5% respectively compared to that from 2010. The
number of exporters for beverage manufacturing was 125 in 2016, the same
as that for 2010; whereas the export value had increased by 4.7%. The ex-
port value per company for food and beverage manufacturing was between
US$2 ~3 million. The value for food manufacturing in 2016 compared to
that for 2010 had decreased by 4.3% whereas that for beverages manu-
facturing had increased by 4.7%. The number of exporters and the export
value for agriculture, forestry and fishery industries were respectively 91
and US$149 million in 2016. Compared to 2010, the number of companies
and the export value had decreased by 11.7% and 45.4% respectively. The
export value per company had decreased by 38.2% from US$2.7 million in
2010 to US$1.6 million in 2016.
<Table 2-3> The number of exporters and export value for F&B and agriculture
unit: # of unit, US$ mil., %
Number of companies(#) Export value(US$ mil.)
Industry type 2010 2016Rate of
change2010 2016
Rate of
change
computer industry 81,102 93,045 14.7 465,123 494,281 6.3
Manufacturing 34,964 40,078 14.6 397,202 418,578 5.4
F&B and cigarettes manufacturing 1,169 1,504 28.7 3,492 4,300 23.1
food manufacturing 1,041 1,375 32.1 2,642 2,946 11.5
beverage Manufacturing 125 125 0 297 311 4.7
cigarettes manufacturing 3 4 33.3 553 1,043 88.6
agriculture, forestry and fishery 103 91 -11.7 273 149 -45.4
Source: Statistics Korea trade statistics by corporate characteristics (http://kosis.kr: 2018. 1. 29.).
In examining F&B and cigarettes manufacturing by employment scale in
2016, 72.9% of the exporters falls under the 1~9 and 10~49 scales, 21.4%

STATUS OF AGRI-FOOD EXPORTERS 27
were at the 50~249 scale, and 5.7% were over 250 in scale. Compared to
2010, the export value per company for 1~9 and 10~49 had decreased by
22.3% and 12.3% respectively, whereas that for 50~249 and over 250 had
increased by 1.3% and 15.6% respectively.
<Table 2-4> Number of companies and export value by industry and
employment scale
unit: # of unit, US$ mil., %
Industry typeEmployment
scaleNumber of companies(#) Export value(US$ mil.)
2010 2016Rate of
change2010 2016
Rate of
change
computer
industry
total 81,102 93,045 14.7 465,123 494,281 6.3
1~9 52,155 58,660 12.5 24,776 24,768 0
10~49 20,412 24,051 17.8 26,525 28,673 8.1
50~249 6,950 8,366 20.4 49,440 52,380 5.9
Over 250 1,585 1,968 24.2 364,382 388,460 6.6
General
Manufacturing
total 34,964 40,078 14.6 397,202 418,578 5.4
1~9 15,121 17,315 14.5 4,995 4,417 -11.6
10~49 13,223 15,122 14.4 13,955 15,588 11.7
50~249 5,462 6,289 15.1 38,462 40,968 6.5
Over 250 1,158 1,352 16.8 339,791 357,605 5.2
F&B and
cigarettes
manufacturing
total 1,169 1,504 28.7 3,492 4,300 23.1
1~9 432 515 19.2 122 113 -7.4
10~49 427 582 36.3 272 325 19.5
50~249 229 322 40.6 486 692 42.4
Over 250 81 85 4.9 2,613 3,170 21.3
Source: Statistics Korea by corporate characteristics trade statistics (http://kosis.kr: 2018. 1. 29).
94.1% of the exporters for the F&B and cigarette manufacturing are
SMEs while the export value of these companies accounted for 25% of the
entire F&B and cigarette manufacturing export value. The number of con-
glomerates and strong medium-sized enterprises accounted for 1.9% and
4% of the entirety respectively, while their export value accounted for
37.5% each. The share of export value for SMEs and strong medium-sized
enterprises compared to the manufacturing average is relatively high where-
as that for conglomerates is low.

28 STATUS OF AGRI-FOOD EXPORTERS
<Table 2-5> Number of companies and export value (2016) by industry and
employment scale
unit: #, US$ mil.
Industry type Scale of companyNumber of
companiesExport value
Export value per
company
computer industry
Total 93,045 494,281 5.3
Conglomerate 796 317,093 398.4
Strong medium enterprise 1,689 85,137 50.4
SMEs 90,560 92,052 1
General Manufacturing
Total 40,078 418,578 10.4
Conglomerate 367 286,625 781
Strong medium enterprise 1,189 76,385 64.2
SMEs 38,522 55,568 1.4
F&B and cigarettes
manufacturing
Total 1,504 4,300 2.9
Conglomerate 29 1,611 55.6
Strong medium enterprise 60 1,612 26.9
SMEs 1,415 1,077 0.8
Note: The scale of company is classed by the average turnover, total assets, and independence
standards for SMEs and strong medium enterprises by industry specified in the Minor
Enterprises Act and Strong Medium Enterprises Act (Korea Customs Service and Statistics
Korea 2017. 12. 26. press release).
Source: Statistics Korea trade statistics by corporate characteristics (http://kosis.kr: 2018. 1. 29.).
In examining the agri-food exporters component ratio (2016) by intensity
of export7, the share of F&B and cigarette manufacturers with 1~24% in-
tensity of export was higher than the general manufacturing, while the share
of the companies with the over 75% of intensity of export was relatively
low at 7%. Compared to 2010, the share of companies with 1~24% in-
tensity of export had increased whereas that of 75% intensity companies
had decreased <Figure 2-2>.
The share of export value by intensity of export for the F&B and ciga-
rette manufacturing industry is as follows <Figure 2-3>. The share compo-
nents for the entire industry or general manufacturing had shown
differences. For F&B and cigarette manufacturing industry, the companies
7 The intensity of export implies the share of export value compared to the relevant
turnover.

STATUS OF AGRI-FOOD EXPORTERS 29
with 1~24% of intensity of export were the largest portion of the export
value, while the companies with the 25~49%, 50%~74%, and over 75% in
order had the higher export value. In addition, the F&B and cigarette manu-
facturing exporters with 1~24% intensity of export in the share of export
value in 2016 had increased compared to that in 2010.
<Figure 2-2> Component ratio for agri-food exporters by intensity of export
Source: Statistics Korea trade statistics by corporate characteristics (http://kosis.kr: 2018. 1. 29.).
<Figure 2-3> Share of export value for agri-food exporters by intensity of export
Source: Statistics Korea trade statistics by corporate characteristics (http://kosis.kr: 2018. 1. 29.).

30 STATUS OF AGRI-FOOD EXPORTERS
The export of F&B and cigarettes manufacturing industry is concentrated
in on the top 5 enterprises. Additionally, the level of export concentration
in these top 5 enterprises is relatively high compared to that of the average
manufacturing industry. The level of trade concentration by top enterprises
during the years from 2010~2016 has not changed much and it was found
that the top 100 companies accounted for the majority of the export value
<Figure 2-4>.
<Figure 2-4> Top agri-food firms level of trade concentration(export)
Source: Statistics Korea trade statistics by corporate characteristics (http://kosis.kr: 2018. 1. 29.).
When examining the share of export value by the major F&B and ciga-
rettes manufacturing countries, this was found to be concentrated in Japan
compared to that of general industry. However, in 2016, as compared to
2010, the exports had expanded to South East E. Asia countries and EU
nations together with the increased share for the US easing off the export
concentration previously seen in Japan <Figure 2-5>.

STATUS OF AGRI-FOOD EXPORTERS 31
<Figure 2-5> Changes in share of export value by major F&B and cigarettes
manufacturing countries
Source: Statistics Korea trade statistics by corporate characteristics (http://kosis.kr: 2018. 1. 29.).
2.2. Performance data for export support programs
In the Korea Agro-Fisheries & Food Trade Corporation (aT) export sup-
port program’s performance data, the current status of support by company
and export related information are being recorded.8 The performance data
of 2011~2016 are used in this section. The support performance data con-
tains not only the export the value by exporters but also the export items
(HSK 10 class) and export destination countries, thus leading to further ex-
8 The agri-food logistics support program mainly by aT was a support program for
the purpose of supporting partial expenses when exporting agri-food, which requires
high logistics costs including packaging and transportation, to promote vitalization
of export and to increase income for farm households. The more details can be
found in the website ‘Government 24’(https://www.gov.kr/: 2018. 5. 5.), and aT’s
export support system (http://atess.at.or.kr/: 2018. 5. 5.).

32 STATUS OF AGRI-FOOD EXPORTERS
amination on the trend of item diversification of business units or export
market diversification. However, the export value also included the logistics
support costs so the actual export value for the product may be different
from the data reported. Therefore, when analyzing the data changes in the
export items and the number of export destination countries are more ap-
propriate to examine than the export value.
The number of companies that received support for annual operating ex-
penses during the period of 2011~2016 was between 250~300, whereas the
309 companies received support for operating expenses in 2016. The enter-
prises exported 124 items to 65 countries in 2011 whereas they exported
211 items to 85 countries in 2016. Thus we observed that Korea’s agri-food
exporters had expanded both their export markets and the number of items.
The number of export countries by company averaged 3.8 in 2011 and 3.9
in 2016 respectively, suggesting little change, making them with little
change, but the standard deviation between companies had expanded from
4.1 to 4.8. The number of average export items in 2011 was increased to
3.9 while the relevant standard deviation was also expanded from 4.1 to 5.4.
<Table 2-6> Trend of changes in export countries by company and number of
export items
unit: # of unit
Year6Number of
companies
Number of
countries
Number of
items
Average number of
export destination
countries per company
Average number of
items per company
2011 273 65 124 3.8 3.2
2012 257 63 122 3.6 3.2
2013 251 63 138 3.7 3.2
2014 266 69 172 3.7 3.8
2015 258 75 181 4 3.7
2016 309 85 211 3.9 3.9
Source: Written by the author based on the data from aT’s export support program’s performance.
The major export destination countries (based on export value in US$)
of agri-food exporters included Japan, China, Taiwan, the USA, Vietnam,
and Hong Kong, while the number of export items to each country had in-

STATUS OF AGRI-FOOD EXPORTERS 33
creased over time. <Table 2-7>. The number of export items to Japan in-
creased from 68 in 2011 to 87 in 2016. Kimchi, paprika, and lily (cut/fresh)
the top export items. The number of export items to China increased from
21 in 2011 to 55 in 2016. The major export items to China changed from
red ginseng, citrus tea, and orchid (mountain plants) in 2011 to citrus tea,
milk, cream, and condensed milk in 2014. The number of export items to
Taiwan increased from 37 in 2011 to 63 in 2016 and while the top export
items are red ginseng, pears, and feathers. The export value of cabbages
(fresh, refrigerated) had increased since 2015 to become a major export
item. The number of export items to the US increased from 42 in 2011 to
84 in 2016 and the top export items were pears (‘Singo’ and others) and
winter mushrooms (fresh/refrigerated). The number of export items to
Vietnam increased from 39 in 2011 to 77 in 2016 and livestock products
were the main exports. Chicken (frozen), chicken wings (frozen), and feath-
ers were the top export items. , Additionally
Powdered milk (for baby/retails) became a major export item since 2014.
The number of export items to Hong Kong increased from 53 in 2011 to
98 in 2016. The top export items had been strawberries (fresh), red ginseng,
citrus tea. The export value of strawberries increased a great deal since
2013.
<Table 2-7> Trend of changes in the number of export items by export
destination country
unit: Number of items
Country 2011 2012 2013 2014 2015 2016
Japan 68 69 67 86 78 87
China 21 22 27 43 46 55
Taiwan 37 41 39 48 50 63
the US 42 45 45 63 74 84
Vietnam 39 38 41 50 54 77
Hong Kong 53 56 71 75 76 98
Average 13.5 11.9 12.7 14.7 14.6 15
Note: The major export countries were selected as countries ranked top 5 in export value for the
period of 2011~2016 while the order was based on the export value in 2016.
Source: Written by the author based on the data from aT’s export support program’s performance.

34 STATUS OF AGRI-FOOD EXPORTERS
The number of export countries by category of export item has either de-
creased or stayed steady by and large. The categories with high level of hy-
giene and quarantine requirements such as fruits and livestock products did
not show much of change in the number of countries. The major tea export
items for the exporters, who received the logistics expenses support, were
green teas or tea bags contained grains. The number of export countries ex-
panded from 4 countries in 2011 to 22 countries in 2014, but this de-
creased to 16 countries in 2016. The category that experienced the greatest
increase in the number of export countries was vegetables, and the specific
items impacted were mainly paprika, strawberries, mushrooms (winter
mushrooms and king oyster mushrooms). These exports expanded from 46
countries in 2011 to 63 countries in 2016.
<Table 2-8> Trend of changes in number of export destination countries by
category
unit: Number of countries
export item category 2011 2012 2013 2014 2015 2016
grains - - - - 11 14
fruits 37 38 36 35 35 40
other processed - - - - - 20
Kimchi 31 29 30 33 38 40
processed rice 16 1 1 7 11 12
ginseng 42 42 42 41 44 51
traditional liquor 26 25 24 28 28 29
tea 4 10 18 22 17 16
vegetables 46 38 37 44 52 63
livestock products 17 15 14 14 15 18
flowers 18 18 15 14 21 19
Average 26.3 24 24.1 26.4 27.2 29.3
Note: It includes the information based on aT’s supported items or the categories item being
supported only. The others processed food was included as a subject for the support
program in 2016.
Source: Written by the author based on the data from aT’s export support program’s performance.

STATUS OF AGRI-FOOD EXPORTERS 35
3. Main Contents and Characteristics
The export value for Korean agri-food has been increasing, as has the di-
versity of export destination countries. However, the exports are con-
centrated in major export countries such as Japan, China, the US, UAE, and
Vietnam. In terms of export destination country, the number of countries
has increased by about 14% compared to 2008 and the share of beverage
and other confected agricultural products has increased a great deal.
In examining the current status, of exporters, the number of exporters in
F&B (food, beverages) manufacturing increased 29% to 1,500 and the ex-
port value increased 11% compared to 2010. If the cigarette manufacturing
were also included, the export value would have increased about 23%. It
is mainly because cigarette exports have dramatically increased for the past
10 years by approximately 89%.
When examining the corporate characteristics, we find that 94.1% of the
F&B and cigarette manufacturing exporters are SMEs accounting for 25%
of the relevant industries’ export value. The share of SMEs’ export value
is relatively high compared to that in general manufacturing but the export
value per company is fairly low. The share of export value for the F&B
and cigarette manufacturers with 1~24% intensity of export (export val-
ue/turnover) is higher than in general manufacturing. The share of export
value for the companies with over 75% intensity is lower than the general
manufacturing average. By expanding the export of F&B and cigarettes
manufacturing to the US, EU, and SE Asia, the industry’s dependency on
exports to Japan has decreased compared to 2010.
According to the aT’s export support program’s performance data, the
number of export countries and export items has continuously expanded
while the major export items have varied depending on the country. The
top export items to Japan have consistently been Kimchi, paprika, and lily.
While the top export items to China have changed from red ginseng to cit-
rus tea, and other dairy products. The major export items to Taiwan were
red ginseng, pears. While pears, winter mushrooms, and so forth e were the
top for the US and, frozen chickens, powdered milk were the major export

36 STATUS OF AGRI-FOOD EXPORTERS
to Vietnam., While strawberry, red ginseng, citrus tea were the major ex-
ports to Hong Kong.
The number of export destination countries for Korean agri-food has con-
stantly expanded over the past 10 years. Japan, China, and the US have
been the major export destination countries. However, it the export market
has recently diversified by expanding to the Middle East (UAE, and etc.)
and S.E. Asian markets (Vietnam, and etc.). This diversification has de-
creased the export dependency on the Japan market. The major export items
have not changed much in terms of their export order in share, although
they may be varied depending upon the export destination country.
A strategy targeting a certain item does have advantages for putting all
competencies in one spot, risk diversification by diversification of export
items is advisable considering the fact that overreliance on certain items
creates difficulties in dealing with a changing environment in the export
destination country. For instance, it became difficult to export red ginseng
products to the relevant countries due to China’s own domestic production
and consumption, S.E. Asian countries (Indonesia and etc.)’ more compli-
cated quarantine, and so forth. It is therefore necessary to embrace an ex-
port diversification strategy to expand the types of items in conjunction
with a market diversification strategy to expand export destination countries
for stable export expansion.

Chapter 3. DETERMINANTS FOR EXPORT OF AGRI-FOOD FIRMS
1. Determinants for Exports
1.1. Introduction and method of analysis
According to the previously reviewed new trade theory, a company de-
cides to enter an export market, the sunk cost, which occurs when entering
export markets, becomes an important criterion (Roberts and Tybout 1997).
Therefore companies enter export markets with self-selection as per their
respective productivity level (Melitz 2003).
Empirical analysis of these trade theories primarily relies on manufactur-
ing business unit survey data to statistically and econometrically examine
whether a company with high productivity enters export markets.9 This
study also follows the precedent studies and uses the Statistics Korea
MDIS’s ‘survey of business activities’ for the analysis. The survey of busi-
ness activities publicly announced annually by the Statistics Korea since
2006 is comprehensive data with complete enumeration of all companies
with over 50 employees and budgets of KRW 300 million that are conduct-
ing industrial activities in Korea.
In order to compare the determinants for exports of food industry and
manufacturers, the food industry was limited to food and beverage manu-
9 Bernard and Jensen(1999), Arnold and Hussinger(2005) analyzed German, Kim et
al.(2009) for Korea, Todo(2011) for Japan.

38 DETERMINANTS FOR EXPORT OF AGRI-FOOD FIRMS
facturing under the industrial type classification while non-food manufactur-
ing was specified as general manufacturing excluding the food industry. In
the precedent studies, cigarette manufacturing was usually included in the
agri-food industry but it was excluded in this study due to the fact that
KT&G is dedicated to production and export cigarettes and has very differ-
ent characteristics from other F&B products.10
Since “whether to export” can be displayed as 1 or 0, the Probit or logit
models can be used for estimation. It is possible to estimate a company
with unconditional fixed-effects logit including the dummy company.
However, it is likely that bias will take place due to the incidental
parameter. This is a problem for when the duration of data (T) is shorter
than the number of panels (N) as this survey of business activities. The log-
it (conditional fixed-effects logit) does have disadvantages in reflecting en-
dogeneity as it is hard to estimate average marginal effect (AME).
The panel Probit model used in this study can be shown as the following
formula (1). Since the data is panel type, , the time-invariant variable in-
volving heterogeneity among the unobserved companies is included in order
to consider the heterogeneity of the company in this model. The following
model allows dependent variables as 0 and 1, or any kind of ratio type val-
ue between 0 and 1. The here implies the cumulative distribution func-
tion of standard normal deviate.
(1)
The dependent variable ( ) includes whether to export during the term
t. The explanatory variable ( ) includes index (# of employees, and etc.)
indicating company scale, # of business year, productivity index (labor pro-
ductivity, total factor productivity, etc.), industry, region, and dummy varia-
ble to consider invariant characteristics of year are included. When the
distribution satisfies the conditional normal distribution assumption
( ) and exogenous assumption, the reduced
10 For the case where the food industry included the cigarettes manufacturing, very
similar result from the analysis of this study was drawn.

DETERMINANTS FOR EXPORT OF AGRI-FOOD FIRMS 39
form will be as the formula (2).
By including time average variable ( ) of panel unit, we can estimate the
conditional average as the following.
(2)
Considering heteroscedasticity and serial dependence, which may exist
due to the panel data’s characteristics, the consistent estimator can be esti-
mated by quasi-maximum likelihood estimation (QMLE) by following
Papke and Wooldridge (2008). For more convenient interpretation, the aver-
age marginal effect (AME) is estimated since the estimated coefficient can-
not be interpreted as a marginal effect (changes in dependent variables on
the changes in 1 unit of explanatory variable) being different from the line-
ar model. If the kth explanatory variable is a continuous variable, the aver-
age marginal effect will be estimated as the formula (3). The here
implies the standard normal deviate probability density function.
(3)
If the kth explanatory variable is a binomial variable, the average margin-
al effect will be estimated as the formula (4). subscript implies the vec-
tor of explanatory variables excluding the kth.
(4)
1.2. Estimation of productivity
In this section, the productivity of a company, which is a major variable
of the model, is estimated. The self-selection and learning by exporting ef-
fects, which are the major theories regarding productivity and export activ-
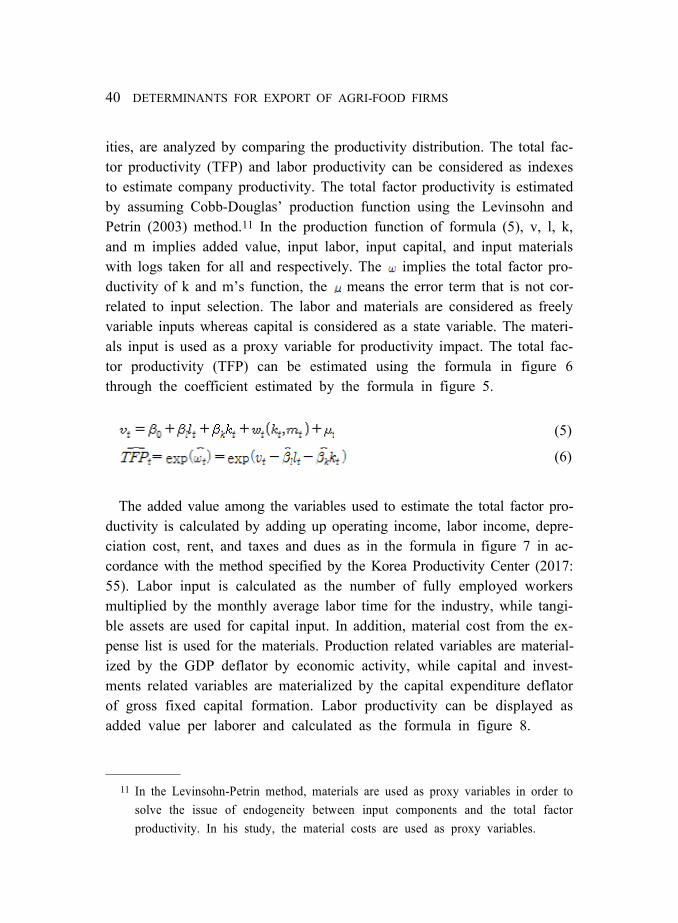
40 DETERMINANTS FOR EXPORT OF AGRI-FOOD FIRMS
ities, are analyzed by comparing the productivity distribution. The total fac-
tor productivity (TFP) and labor productivity can be considered as indexes
to estimate company productivity. The total factor productivity is estimated
by assuming Cobb-Douglas’ production function using the Levinsohn and
Petrin (2003) method.11 In the production function of formula (5), v, l, k,
and m implies added value, input labor, input capital, and input materials
with logs taken for all and respectively. The implies the total factor pro-
ductivity of k and m’s function, the means the error term that is not cor-
related to input selection. The labor and materials are considered as freely
variable inputs whereas capital is considered as a state variable. The materi-
als input is used as a proxy variable for productivity impact. The total fac-
tor productivity (TFP) can be estimated using the formula in figure 6
through the coefficient estimated by the formula in figure 5.
(5)
(6)
The added value among the variables used to estimate the total factor pro-
ductivity is calculated by adding up operating income, labor income, depre-
ciation cost, rent, and taxes and dues as in the formula in figure 7 in ac-
cordance with the method specified by the Korea Productivity Center (2017:
55). Labor input is calculated as the number of fully employed workers
multiplied by the monthly average labor time for the industry, while tangi-
ble assets are used for capital input. In addition, material cost from the ex-
pense list is used for the materials. Production related variables are material-
ized by the GDP deflator by economic activity, while capital and invest-
ments related variables are materialized by the capital expenditure deflator
of gross fixed capital formation. Labor productivity can be displayed as
added value per laborer and calculated as the formula in figure 8.
11 In the Levinsohn-Petrin method, materials are used as proxy variables in order to
solve the issue of endogeneity between input components and the total factor
productivity. In his study, the material costs are used as proxy variables.

DETERMINANTS FOR EXPORT OF AGRI-FOOD FIRMS 41
Added Value (v) = operating profits + income to labor + depreciation +
rent + taxes & dues (7)
Labor productivity = add value / the number of employees (8)
After estimating the total factor productivity and labor productivity for
the food (F&B Manufacturing) and non-food manufacturers, it was found
that the productivity mode for the exporters was higher than for the domes-
tic companies. Additionally, the exporters have thicker distribution of the
companies with higher productivity (right side of x-axis) <Figure 3-1>. A
side-by-side comparison of 2010 and 2016 showed that the productivity dis-
tribution shifted to the right overall so the productivity for both domestic
companies and exporters increased compared to 2010. The outline of dis-
tribution for the agri-food industry is rough thus making it difficult to iden-
tify by the picture, but the difference in productivity distribution for domes-
tic companies and exporters of manufacturing in 2016 compared to 2010
can be clearly observed.
<Figure 3-1> total factor productivity distribution by industry
Source: Author generated

42 DETERMINANTS FOR EXPORT OF AGRI-FOOD FIRMS
By comparing the exporters and domestic productivity of company dis-
tribution by labor productivity, the difference in distribution was clearer.
This showed a similar pattern to the previously examined distribution dif-
ference of total factor productivity (Picture 3-2).
<Figure 3-2> Labor productivity distribution by industry
Source: Author generated.
The Kolmogorov-Smirnov test, which is a non-parametric method, was
used to analyze whether the difference in productivity distribution between
exporters and non-exporters (other domestic companies) is statistically
significant. The result of the Kolmogorov-Smirnov test showed that the pro-
ductivity distributions for exporters and non-exporters in both general man-
ufacturing and food industry are statistically different from one another
(table 3-1).
Based on this result, it was found that the productivity distribution for
Korean agri-food firms has statistically shown more apparent differences
over time as whether to export. This may imply that it supports the self-se-

DETERMINANTS FOR EXPORT OF AGRI-FOOD FIRMS 43
lection theory for which companies with differentiated heterogeneity
(productivity) in the agri-food industry would participate in export.
<Table 3-1> gap of productivity distribution between exporters and domestic
companies: Kolmogorov-Smirnov test
Year 2010 2012 2014 2016
Test subject industry p-value p-value p-value p-value
total factor productivity Rate of
increase
Food 0.988 0.432 0.248 0.551
Manufacturing 0.293 0.291 0.534 0.515
total factor productivityFood 0.058 0.058 0.005 <0.001
Manufacturing <0.001 <0.001 <0.001 <0.001
Labor productivity Rate of
increase
Food 0.367 0.582 0.460 0.294
Manufacturing 0.205 0.117 0.244 0.270
Labor productivityFood 0.149 0.125 0.007 <0.001
Manufacturing <0.001 <0.001 <0.001 <0.001
Source: Author generated.
However, the gap in the rate of productivity increase distribution between
exporters and domestic companies for both general manufacturing and food
industry was not found to be significant. This may imply that it does not
support the learning by exporting theory which suggests companies in
Korea’s manufacturing industry increase productivity in order to improve
competitiveness after entering export markets. A more detailed examination
on this matter will be presented in the section on ‘determinants for exports
analysis.’
1.3. Determinants analysis
1.3.1. Analysis materials and explanation on variables
The company panel for ‘survey of business activities’ includes approx-
imately 450 agri-food firms (entirety of about 12,000 companies) and about

44 DETERMINANTS FOR EXPORT OF AGRI-FOOD FIRMS
150~200 agri-food firms (entirety of about 4~6 thousand companies) among
them have export experience. During the period from 2006~2016, approx-
imately 35~50% of the surveyed companies were conducting exports. This
study utilized the data range from 2006~2016 for the analysis.12
<Table 3-2> Current status of the number of exporters and their share by
industry (2006~2016)
subjectagri-food
Manufacturing
(excluding agri-food)Entirety
export Entirety export Entirety export Entirety
2006Number of companies 150 425 3,189 5,665 3,845 10,786
portion(%) 35.3 100 56.3 100 35.6 100
2011Number of companies 189 456 3,305 5,381 4,390 11,722
portion(%) 41.4 100 61.4 100 37.5 100
2016Number of companies 221 461 4,395 5,568 6,029 12,471
portion(%) 47.9 100 78.9 100 48.3 100
Source: The author generated based on the MDIS (mdis.kostat.go.kr: 2018. 1. 10.~11. 3.) ‘survey
of business activities’.
The Probit function of the formula in figure 9 is used in the analysis,
where the variables ( , ..., ) such as whether to export ( ), pro-
ductivity ( ), corporate characteristics (Scale, # of years for biz),
externality of region or industry, and year dummy in the previous year are
all considered. The dependent variable in the analysis is whether to export
( ) for company in t, whereas values of t-1 are used for the independent
variables.
(9)
12 In order to improve credibility of the analyzed results, the data of 5% from both
extreme sides of turnover distribution are excluded. However, the data of entire
companies is used for the statistics of parent group.

DETERMINANTS FOR EXPORT OF AGRI-FOOD FIRMS 45
The independent variable and basic statistics used in this analysis are as
shown in <Table 3-3>. The company’s decision whether to export in the
previous year is the proxy variable for fixed costs of entering export mar-
kets (quoted from Roberts and Tybout 1997; Bernard and Jensen 1999;
Tybout 2001: 29), and it generally has positive (+) effects on the decision
of whether to export (Bernard and Jensen 2004, etc.). The labor pro-
ductivity and total factor productivity are used in the productivity studies
depending upon the characteristics of the study and the materials, though
different methods of estimation are used by researchers to determine the to-
tal factor productivity. In this analysis, the log-transformed value of the
productivity estimate is used based on the method of Levinsohn and Petrin
(2003). The analysis revealed that the productivity generally has positive
(+) effects on export status (Bernard and Wagner 2001; Arnold and
Hussinger 2005, etc.).
<Table 3-3> Determinants for exports analysis variables and basic statistics
agri-food (N=584)Manufacturing(excluding agri-food)
(N=7,445)
AverageStandard
deviation
Minimum
value
Maximum
valueAverage
Standard
deviation
Minimum
value
Maximum
value
whether to export 0.41 0.49 0.00 1.00 0.67 0.47 0.00 1.00
whether to exportt-1 0.39 0.49 0.00 1.00 0.64 0.48 0.00 1.00
ln(TFP)t-1 (LP) 2.48 0.43 1.01 5.65 3.63 0.53 -5.53 3.87
ln(TFP)t-1 (OP) 2.23 0.75 -5.95 4.99 2.34 0.69 -8.97 6.61
ln(Labor
productivityt-1)4.03 0.70 -2.30 7.37 4.17 0.64 -4.14 9.35
ln(# of employeest-1) 4.81 0.65 3.78 7.62 4.80 0.63 1.61 7.95
ln(# of years for bizt-1) 2.83 0.69 0.00 4.30 2.86 0.61 0.00 4.57
Same industry outside
the regiont-1
0.42 0.12 0.00 0.69 0.42 0.10 0.02 0.67
Different industry
within the regiont-1
0.42 0.10 0.00 1.00 0.64 0.13 0.00 1.00
Same industry within
the regiont-1
0.36 0.19 0.00 1.00 0.62 0.20 0.00 1.00
Source: The author generated based on the MDIS (mdis.kostat.go.kr: 2018. 1. 10.~11. 3.) ‘Survey
of business activities’.

46 DETERMINANTS FOR EXPORT OF AGRI-FOOD FIRMS
The # of employees and # of years for business are a reflection of the
basic characteristics of various companies. The # of employees as a proxy
variable for corporate scale is information that can reflect low marginal
cost, a company’s sales and marketing competences, risk management capa-
bility, and systematization as per economies of scale (Wagner 1995: 33).
Calof (1994: 369), who organized the studies on the corporate scale and de-
cision to export, suggested that the scale does not have a positive (+) influ-
ence on the decision to export, or does not have any statistically significant
effects. According to the explanation of Love et al. (2016), the # of years
for business can relate not only to rigidity or inflexibility regarding export
but also to the general international activity experience of a company from
the standpoint of corporate management. The effect that the # of years for
business had on the decision of export was negative (-) in Bagella et al.
(2000) but positive (+) in Matteis et al. (2016).
The studies on externality of region and industry have been reviewed nu-
merous times in the literature since late 1990, but the effect is still ques-
tionable (Greenaway and Kneller 2007: 143). These studies can be divided
into the following: the studies regarding the effect of the multinational
companies in the region and industry or overseas capital flows on decision
of export (Aitken et al. 1997; Kneller and Pisu 2007); the study of analysis
for the industry integration and decision of export of company (Bagella et
al. 2000); and the study regarding the effect that other companies’ activities
in the same region and industry, where the company belongs to, on deci-
sion of export (Bernard and Jensen 2004; Greenaway and Kneller 2008). In
this study, the three externality variables are introduced by referring to the
study of Bernard and Jensen (2004). The three variables are divided into
the same industry outside the region, different industry within the region,
and the same industry within the region. They imply the share of the ex-
porter in the relevant industry of a relevant region. The increase in share
of the exporter in the same region or same industry leads to reduced export
costs by sharing the infrastructure for export, logistics, information on ex-
port and risk, and thus it may have positive effects on the decision of
export. On the other hand, if it is perceived as a competition, it will have
negative effects on the decision of export.

DETERMINANTS FOR EXPORT OF AGRI-FOOD FIRMS 47
1.3.2. Results of analysis
In order to compare food manufacturers and non-food manufacturers, an
analysis of each company group was conducted and the analysis results are
presented in <Table 3-4>.
It was found that the export experience in the previous year for both food
and general manufacturer groups had positive effects on whether to export
for the next year. In other words, a company that exported in the previous
year has a higher chance to export (or be an exporter) in the next year as
well. The average marginal effect did not have huge differences even
though it appeared that the general manufacturing was slightly high.
In addition, if the productivity (total factor productivity and labor pro-
ductivity) of the previous year is higher, it was determined that the possi-
bility of decision to export in the next year is higher coinciding with the
results of self-selection theory. Utilizing South Korean business data from
1996~2003, Kim et al. (2009) analyzed the determinants for exports. In
Kim’s study, the effect of productivity for the food and cigarettes industry
was observed to not be significant, but it was observed to be significant in
this study.
It has been observed that it is difficult to conclude that the bigger the
scale of food company the more positive the effects, however, the scale of
the general manufacturer did have positive (+) effect on decision to export.
This can also be found in the studies of Wagner (1995), Bernard and
Wagner (2001), and Arnold and Hussinger (2005). In the study by de
Matteis et al. (2016), the number of years of being in business was found
to have a positive (+) effect on decision to export.
The effect of externality for food companies did not have effects on the
decision to export, but it was found that the same industry outside the re-
gion and different industry within the region for general manufacturing has
a positive (+) effect on the decision to export. The analysis from
Greenaway and Kneller (2008), which studied British companies consider-
ing the externality by using the same method as the above, had a similar
result.13
It is very difficult to assertively interpret the effects of externality on the

48 DETERMINANTS FOR EXPORT OF AGRI-FOOD FIRMS
decision to export. However, it seems that the externality of a company
such as the export infrastructure, and share of information, which exist in
the region or industry, has positive effects on the decision to export.
<Table 3-4> Food manufacturers and general manufacturers’ determinants for
exports
(1) (2) (3) (4)
dependent variables:
whether to exportFood Food
Manufacturing
(Excl. food)
Manufacturing
(Excl. food)
Estimated
coefficient
Marginal
effect
Estimated
coefficient
Marginal
effect
Estimated
coefficient
Marginal
effect
Estimated
coefficient
Marginal
effect
whether to export
(t-1)
0.570a 0.108a 0.570a 0.108a 0.613a 0.121a 0.621a 0.122a
(0.089) (0.020) (0.089) (0.020) (0.022) (0.005) (0.023) (0.005)
ln(# of years for
biz)(t-1)
0.698a 0.105a 0.717a 0.108a 0.210a 0.033a 0.259a 0.041a
(0.263) (0.040) (0.261) (0.039) (0.080) (0.013) (0.080) (0.013)
ln(# of employees)
(t-1)
0.212 0.032 0.237 0.036 0.201a 0.032a 0.224a 0.035a
(0.142) (0.021) (0.157) (0.024) (0.043) (0.007) (0.045) (0.007)
Same industry
outside of the
area(t-1)
-0.732 -0.110 -0.719 -0.108 0.892a 0.141a 1.000a 0.156a
(0.867) (0.131) (0.865) (0.130) (0.274) (0.043) (0.276) (0.043)
Different industry
within the
area(t-1)
0.382 0.058 0.596 0.090 0.328b 0.052b 0.394b 0.062a
(1.022) (0.154) (1.041) (0.157) (0.162) (0.026) (0.166) (0.026)
Same industry
within the
area(t-1)
-0.253 -0.038 -0.155 -0.023 0.096 0.015 0.154 0.024
(0.293) (0.044) (0.286) (0.043) (0.093) (0.015) (0.094) (0.015)
ln(TFP)(t-1)0.469b 0.071b 0.124b 0.020b
(0.195) (0.029) (0.051) (0.008)
13 In the study of Greenaway and Kneller (2008), it is analyzed that the increase in
the share of exporters in the same industry outside the region, different industry
within the region, and same industry within the region increased the possibility for
decision to export by a company. But, in the study of Bernard and Jensen (2004),
the effect of externality was not apparent or had negative (-) effects for the differ-
ent industry within the region. Like such, the effects of externality may vary de-
pending on the country and industry.

DETERMINANTS FOR EXPORT OF AGRI-FOOD FIRMS 49
(continue)
(1) (2) (3) (4)
dependent variables:
whether to exportFood Food
Manufacturing
(Excl. food)
Manufacturing
(Excl. food)
Estimated
coefficient
Marginal
effect
Estimated
coefficient
Marginal
effect
Estimated
coefficient
Marginal
effect
Estimated
coefficient
Marginal
effect
ln(Labor
productivity)(t-1)
0.186b 0.028a 0.055b 0.009b
(0.090) (0.0136) (0.023) (0.004)
Constant term-1.846a -1.966a -2.130a -2.185a
(0.354) (0.364) (0.102) (0.110)
Observed value 3565 3541 47737 46629
Number of
companies584 582 7445 7378
2127.7 2066.9 26961.5 26148.7
Prob. > F <0.001 <0.001 <0.001 <0.001
Note 1) The clustered robust standard errors and delta standard errors are presented in the
parenthesis. Each A and b implies the significance level of 1% and 5% respectively.
2) The time-invariant characteristics including the corporate average variable and year
dummy, and the exogenous impact at specific time are controlled.
Source: Author generated.
1.3.3. Effect of exports on productivity
In order to verify the learning by exporting effects for the companies that
have entered into the export market, the Propensity-score matching (PSM)
method was used (Abadie and Imbens 2016). The propensity score for start-
ing export was obtained by using the explanatory variables (# of employ-
ees, # of years for biz, externality, year dummy, etc.) in the determinants
for exports analysis and then the average treatment effect on the treated
group was estimated. For drawing a more generalized result, the rate of in-
crease for total factor productivity and labor productivity across various pe-
riods, such as last year~this year (t-1/t), last year~next year (t-1/t+1), last
year~2 years later (t-1/t+2), last year~3 years later (t-1/t+3), and so forth,
were estimated as conducted in the study by Manez-Castillejo et al. (2010).
As a result of our estimation, entering the export market did not have a

50 DETERMINANTS FOR EXPORT OF AGRI-FOOD FIRMS
significant effect on the increase of productivity while it could not present
the empirical result that South Korea’s food companies and general manu-
facturers did have learning by exporting effects. Applying different periods
for the rate of increase, the estimated result, in which the rate of increase
for the total factor productivity and labor productivity is affected by enter-
ing export markets for food companies and general manufacturers, was not
determined.
<Table 3-5> Effects of entering export markets on productivity: propensity score
matching
Rate of increase
Duration
Food Manufacturing(Excl. food)
ATET N1 / N0 ATET N1 / N0
total factor
productivity Rate
of increase
t-1/t 0.020 (0.042) 156 / 3,404 -0.017 (0.016) 2,050 / 44,727
t-1/t+1 -0.027 (0.059) 139 / 2,867 -0.009 (0.019) 1,835 / 37,623
t-1/t+2 -0.002 (0.063) 104 / 2,424 0.018 (0.023) 1,435 / 31,760
t-1/t+3 -0.033 (0.067) 90 / 1,989 0.047 (0.024) 1,255 / 26,257
Labor
productivity Rate
of increase
t-1/t -0.039 (0.046) 155 / 3,389 0.016 (0.017) 2,041 / 44,576
t-1/t+1 -0.030 (0.054) 137 / 2,843 -0.011 (0.019) 1,822 / 37,439
t-1/t+2 -0.099 (0.063) 103 / 2,399 0.004 (0.022) 1,422 / 31,547
t-1/t+3 -0.062 (0.062) 89 / 1,966 0.024 (0.024) 1,241 / 26,049
Note 1) The propensity score for matching is estimated by using the explanatory variables (# of
employees, # of years for biz, externality, year dummy, etc.) used in the determinants for
exports analysis, and dummy dependent variables for start exporting based on the Probit
model.
2) Each ATET, N1, and N0 means the average treatment effect on the treated group,
observed value for the treated group, and observed value for the non-treated group,
while each ATET’s standard errors are displayed in the parenthesis.
Source: Author generated.
2. Export sustainability
Export sustainability (survival) implies how long a company, which has
entered export markets, has conducted continuous export without stopping.

DETERMINANTS FOR EXPORT OF AGRI-FOOD FIRMS 51
In the criteria for export sustainability, whether to export or to continue ex-
port routes can also be considered. For instance, examining for a company
the number of years from the year it started exporting to the year it stopped
exporting can be considered the export sustainability. In addition, if a com-
pany exported pears at a specific year from South Korea to the US, exam-
ining whether the pears have been continuously exported to the relevant
market through later years can be considered the export route’s
sustainability.
In this section we identify the actual state of agri-food firms’ export sus-
tainability and examine the export activity further to determine whether it
has been better from the aspect of quantity and quality over time. In addi-
tion, we then analyze the factors affecting export sustainability.
2.1. Analysis background
The total exports of a company can be increased by an increase of export
volume (value) for existing items (intensity of export; intensive margin).
Total exports may also be increased by exporting new items to existing
markets or by penetrating new markets with existing items (degree of ex-
port diversification; extensive margin). Based on the results from precedent
studies, export product diversification is a key reason for the increase of ex-
ports in the early stage of trade liberalization through WTO, FTA, etc.,
while the level of concentration has larger effects than that of diversifica-
tion in the mid & long-term trade relationship. For Korea’s agri-food ex-
ports, 15 FTAs have come into force from the first FTA (with Chile) in
2004 until the present. Since export policies have been focusing on export
market diversification and export item diversification, exports have in-
creased as the level of export diversification has increased. Therefore, im-
provement on intensity of exports should be the logical new focus, espe-
cially now that the major overseas market’s tariff barriers have been re-
moved and some time has passed.

52 DETERMINANTS FOR EXPORT OF AGRI-FOOD FIRMS
2.2. Export sustainability analysis by industry
Before further examining the export sustainability of agri-food firms, this
paragraph analyzes the corporate characteristics and features that affect the
export sustainability for companies in the food industry and general manu-
facturing by using the ‘survey of business activities’. Kaplan and Meier
(1958) using the survival analysis estimated the number of continuing years
after entering the export markets. By examining the survival function esti-
mation result, it was found that food companies below the middle scale
(100~300) had a higher rate of sustainability in most of the areas compared
to companies in other scales. However, food companies in the ‘over 300’
scale have a tendency to dramatically decrease over the course of 4 years
since starting exports.
<Figure 3-3> Export survival function estimation result for food companies
Source: Author generated.
On the other hand, general manufacturing companies (Excl. food) in the
over 300 scale show a rate of sustainability that is high in almost every
section while the companies with 100~300 employees have the second
highest rate of sustainability.

DETERMINANTS FOR EXPORT OF AGRI-FOOD FIRMS 53
<Figure 3-4> Export survival function estimation result for manufacturers
(Excl. food)
Source: Author generated.
In order to estimate the effects of corporate characteristics on export sus-
tainability, the Cox proportional hazards model, which is a semi-parametric
technique, was used (Cox 1972). The hazard function of the Cox model is
shown in (10).
(10)
The here is the baseline hazard function, while the means the
explanatory variables, and means the estimated coefficients of the
relevant variables.14
In the Cox model, it is assumed that a constant rate of risk exists regard-
less of time. When examining the proportional hazard assumption, we dis-
covered no proof of violations.
14 The is not directly estimated in the Cox model but, it can be drawn from
the cumulative risk function and baseline survival function. More detailed ex-
planations on the Cox model can be found in the study of Cleves, Gould, and
Marchenko(2016).

54 DETERMINANTS FOR EXPORT OF AGRI-FOOD FIRMS
In our analysis we found that the number of years for being in business
and the share in the same industry within the region for food companies
decreased the risk probability of leaving the export market. In other words,
it is inferred that companies with a long history have accumulated the man-
agement knowhow vital to lowering the risk of stopping exports, whereas
companies with a large share in the same industry within the region re-
ceived positive effects on continuing export due to the externalities such as
the export infra in the region.
It was found that as the number of years for being in business, the num-
ber of employees, level of productivity, the share in the same industry out-
side the region, and the share in the same industry within the region for
general manufacturers increases, the probability of stopping exports
decreased. It was also found that increases in scale, productivity, share of
the same industry outside the region all had positive effects on lowering the
probability of stopping exports for manufacturing companies compared to
food companies.15
<Table 3-6> Export stop hazard ratio for food companies and general
manufacturers
export stop hazard ratio
Food Manufacturing
ln(# of years for biz) 0.71b (0.10) 0.82a (0.04)
ln(# of employees) 1.13 (0.15) 0.77a (0.03)
ln(total factor productivity) 1.09 (0.24) 0.92b (0.04)
Same industry outside the region portion 0.84 (0.76) 0.37a (0.09)
Different industry within the region portion 1.81 (1.70) 0.99 (0.23)
Same industry within the region portion 0.27b (0.14) 0.18a (0.03)
Observed value 756 18,444
Number of companies 168 3723
Verifying proportional hazard assumption p = 0.17 p = 0.37
Note: The clustered robust standard errors are presented in the parenthesis. Each A and b implies
the significance level of 1% and 5% respectively.
Source: Author generated.
15 The estimated result with the labor productivity instead of the total factor pro-
ductivity (TFP) was not much from the original result.

DETERMINANTS FOR EXPORT OF AGRI-FOOD FIRMS 55
2.3. Export sustainability analysis for agri-food firms
Even though export sustainability was previously examined by the survey
of business activities, the export sustainability analysis for corporate items
and corporate-country units has limitations since there is no information
about export items and countries. In order to analyze the corporate items
and corporate-country units, trade statistics including corporate information
are required but this is not allowed by the Statistics Act. Therefore, the
aT’s export support program’s performance data, which includes the re-
quired information, was used even if it does have a limitation due to se-
lection bias for samples.16
2.3.1. Analysis methods and materials
In this section we analyze the export sustainability of agri-food firms by
utilizing the aT’s export support performance data (performance data for lo-
gistics support) for 2005~2017. The sustainability of an export routes (L)
unit is analyzed by establishing combination (N, M) of export items and ex-
port market of company.
The number of companies, which received logistics cost support at least
once for the period used in the analysis was 762, whereas 55 companies
16 In this data, the export volume and export value by country and item (actual items
based on AG codes) for agri-food companies are listed so that the period of a
company’s export of a certain item to individual overseas market can be examined.
Of course, a company that exported without receiving any support may exist.
However, there is no reason not to receive the export logistics support, which does
not require any additional costs, if a company pursues cost reduction (or profit
maximization) and satisfies the relevant requirements, since the standards for sup-
port items and subjects(companies) are not really particular. Looking at the public
announcement (aT 2018) on the support plan for agri-food export logistics cost
(central government) in 2018, there is no qualification specified for the qual-
ification except the fact that the processed items may not be qualified depending
on their portion of domestic materials used.

56 DETERMINANTS FOR EXPORT OF AGRI-FOOD FIRMS
received the support for the entire 13 straight years. In addition, the export
items and export markets, which received support during the period, were
114 and 113 respectively. Therefore, the export performance of maximum
114 (item N)×113 (market M) annually by company is possible. However,
the export markets, to which a company exported the most annually, was
34 during the period of the analysis, and the number of export items, which
a company exported the most variety of items, while the number of overall
samples for all companies during the period of analysis was 22,639.
The share of the constantly maintained export routes and the continuing
period of the export routes during the analysis period can be identified by
using The Kaplan and Meier (1958)’s survival analysis. The survival proba-
bility ( ), in which the import route is maintained at a specific time ,
can be defined as the formula in figure 11.
(11)
represents the number of export routes that is maintained until
whereas implies the number of export routes that have stopped at . The
survival probability function ( ) can be estimated by the non-parametric
maximum likelihood estimation.
2.3.2. Result of analysis
<Figure 3-5> shows the results of the survival function estimation for the
entire agri-food export routes for the analysis period. After export routes
were created, it was found that the probability of exports being continued
for the following year is 75%, 50% for continuing over 4 years (+3rd year),
and 24% for over 11 years (+10th year). In other words, 25% of the new
agri-food export routes in Korea had sustaining period of less than a year,
and 50% will end at or before the 5th year. This is similar to the results
of the Peterson et al.(2017) study which analyzed the fresh vegetable and
fruit imports in the USA for 1996~2008, and showed a sustaining rate of
64% for +1st year, 45% for +3rd year, and 28% for +10th year. Nevertheless,
the short-term sustaining rate of South Korea’s agri-food export is higher

DETERMINANTS FOR EXPORT OF AGRI-FOOD FIRMS 57
than that of the USA’s fresh vegetable and fruit imports whereas the
long-term sustaining rate is lower. Though there is a difference in the ana-
lyzed subject between the former that used the trade corporate-country unit
and the latter that is based on the trade country-country unit, it was found
that South Korea’s agri-food exports do have a lower rate of survival than
the other countries fresh fruits exports to the US when examining the cri-
teria for sustainability over the first 5 years.
<Figure 3-5> Estimation result of export survival function for agri-food firms
(2005~2017)
Note: The survival function was analyzed using 762 companies and the entire export routes
(export market, export items) of 22,639 for the period of the analysis.
Source: Author generated.
On the other hand, the rates of agri-food export sustainability drawn from
the foregoing study are higher than the results, which are the sustaining rate
of 54% for +1st year, 33% for +3rd year, and 16% for +10th year, from the
study by Sang-sik Jang (2015), which analyzed all new agri-food exporters
from 2003~2014 in Korea. This likely related to the fact that agri-food ex-
porters have higher initial fixed costs compared to general manufacturing
exporters for entering new export markets. When exporting agri-food, there
are more non-tariff actions from import countries such as quarantine, customs
clearance, and hygiene criteria as compared to industrial products.
Additionally, the supply chain (agri-food has longer distribution channels

58 DETERMINANTS FOR EXPORT OF AGRI-FOOD FIRMS
compared to industrial products), which is required in order to maintain the
freshness from the domestic market to the overseas markets, can function
as an additional trade barrier. Therefore, agri-food exporters would have high-
er sunk cost that they would have to relinquish when giving up established
export routes. They also have a tendency to avoid the re-entering costs (re-en-
tering to the existing export market) needed to restore lost export routes.
<Figure 3-6> shows the result of examining the export sustainability rate
of agri-food firms by classifying the export markets by region. We analyzed
the export areas and categorized them in to the following: ① China, ② Japan,
③ SE. Asia, ④ the USA, ⑤ EU, and ⑥ others. We found that the Japan
market has the highest export sustainability whereas the S.E. Asia market
has the lowest export sustainability for Korean agri-food firms. This is be-
cause Japan is the largest export market for Korea’s agri-foods and the market
that Korean agri-food firms have the most experience working with. This
is also a reflection of the shared business culture and trusting relationship.
On the other side of the spectrum is the S.E. Asia markets, As inferred by
Hanryu, these export routes are created and stopped more frequently since
the history of development is relatively short for S.E. Asia markets. The S.E.
Asia markets also have a more heterogeneous food culture.
<Figure 3-6> Estimation result of export survival function for agri-food firms by
region(2005~2017)
Note: The survival function was analyzed using the 762 companies and the entire export routes
(export market, export items) of 22,639 for the period of the analysis.
Source: Author generated.

DETERMINANTS FOR EXPORT OF AGRI-FOOD FIRMS 59
Next, the export sustainability rate was estimated by classifying the ex-
port items into 11 categories. The categories are as follows: ① grains, ②
processed rice, ③ tea, ④ ginseng, ⑤ fruits, ⑥ vegetables, ⑦ flowers, ⑧
Kimchi, ⑨ livestock products, ⑩ traditional liquor, and finally ⑪ other
processed products. As a result of our analysis, Kimchi had the highest ex-
port sustainability. Fruits showed a relatively low export sustainability since
they are exported in a fresh state and are sensitive to the effects of domes-
tic supply and demand, and fluctuation in their prices <Figure 3-7>. It was
found that grains, processed rice, and other processed products have the
lowest sustainability with not greater than 3~4 years of continuing export.17
<Figure 3-7> Estimation result of export survival function for agri-food firms by
item group(2005~2017)
Note: The survival function was analyzed using the 762 companies and the entire export routes
(export market, export items) of 22,639 for the period of the analysis.
Source: Author generated.
17 Rice and rice processed products have a relatively short history of being exported,
and they can be supported with export logistics costs only if the products’ raw ma-
terials have more than 50% of domestic rice. Large company’s products such as
‘Haetban’ were excluded from the subject of support.

60 DETERMINANTS FOR EXPORT OF AGRI-FOOD FIRMS
The export performances were then compared by dividing the export
routes into 3 types: creation, continuing, and extinction. As suggested in
<Table 3-7>, the extinct export routes right after creation accounts for a
25.5% share, but the proportion of their export performance is just 5.2%.
The share for the export routes continuing for over 2 years but extinct in
the current year is 20%, and the proportion of their export performance is
14.6%. On the other hand, the export performance portion of the
‘continuously surviving’ export routes, which account for 54.5% of the en-
tire export routes, reaches 80.3%. This implies that the companies con-
tinuously maintaining their export routes are the ones leading the stable
growth of agri-food export.
<Table 3-7> Comparison of export routes distribution and export performance by
type for the period for the analysis
ItemType 1
(extinct after creation)
Type 2
(continuing)
Type 3
(Stopped)
number of export routes 5,765 12,347 4,527
export routes portion 25.5% 54.5% 20.0%
Total export value(KRW mil.) 3,640 56,600 10,300
Share of export value 5.2% 80.3% 14.6%
Note: Type 1 means export routes for extinct right after the creation (export routes created in each
year but extinct in the following year), Type 2 implies the export routes continuously
maintained in before/after the relevant year (including the export routes maintained in the
following year after crated in the relevant year), and Type 3 means the export routes extinct
in the relevant year.
Source: Author generated.
The left-hand side graph of the below picture <Figure 3-8> shows 12,345
export routes with over 2 years of business and their export growth rate by
section on the basis of YoY displaying their individual frequency. The
right-hand side graph with continuing export routes and stopped export
routes presents the average export growth rate for the relevant export routes
in the order of continuing year. Examining the left side graph, it was found
that the export routes with over 50% decrease in export value compared to
the previous year account for the biggest share, approximately 21.2%.
However, the export routes with 100~500% increase in export value as

DETERMINANTS FOR EXPORT OF AGRI-FOOD FIRMS 61
compared to the last year account for 15.2%, whereas the export routes
with over 500% increase in export value account for 6.9%.
As visualized in the right side graph, the export value increased almost
2 times in the following year after the start of exporting for the continuing
export routes. This may be because the first year of export is done in a
small scale in most cases. However, it was found that the export growth
rate gradually decreases as the number of years of export increases. The ex-
port growth rate of companies continuing up to the 10th year is over 20%
implying that they make a bigger contribution to the increase in exports
than companies that stopped exports in the current year.
<Figure 3-8> Export routes by export growth rate and average export growth
rate distribution by the order of continuing year
Source: Author generated.
2.4. Determinants for sustainability of agri-food exports
2.4.1. Analysis methods and basic statistics
The discrete-time duration model proposed by Hess and Persson (2011)
is used as an empirical model to identify the determinants for whether to
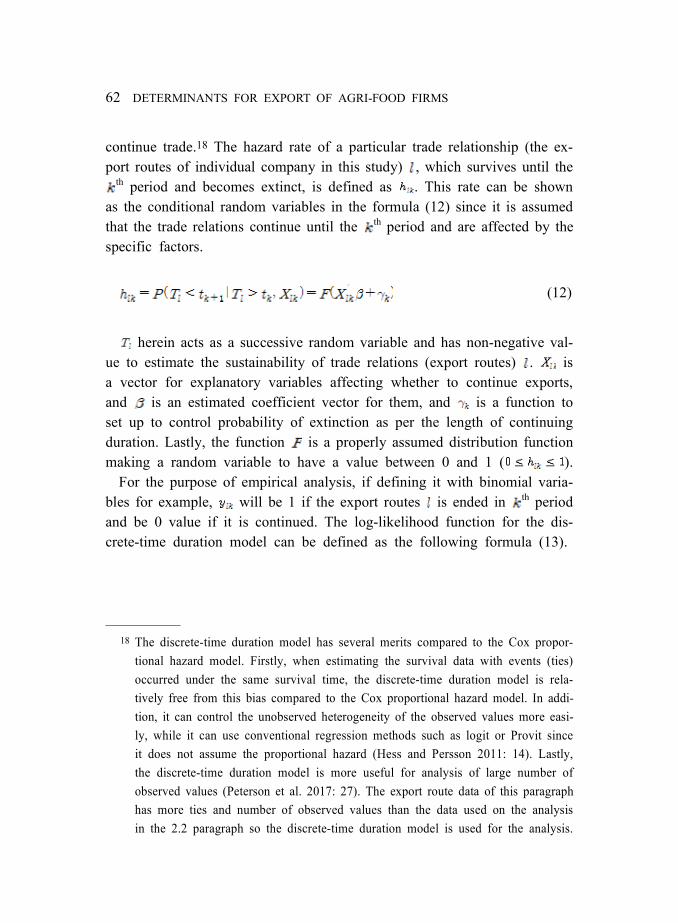
62 DETERMINANTS FOR EXPORT OF AGRI-FOOD FIRMS
continue trade.18 The hazard rate of a particular trade relationship (the ex-
port routes of individual company in this study) , which survives until the th period and becomes extinct, is defined as . This rate can be shown
as the conditional random variables in the formula (12) since it is assumed
that the trade relations continue until the th period and are affected by the
specific factors.
(12)
herein acts as a successive random variable and has non-negative val-
ue to estimate the sustainability of trade relations (export routes) . is
a vector for explanatory variables affecting whether to continue exports,
and is an estimated coefficient vector for them, and is a function to
set up to control probability of extinction as per the length of continuing
duration. Lastly, the function is a properly assumed distribution function
making a random variable to have a value between 0 and 1 ( ).
For the purpose of empirical analysis, if defining it with binomial varia-
bles for example, will be 1 if the export routes is ended in th period
and be 0 value if it is continued. The log-likelihood function for the dis-
crete-time duration model can be defined as the following formula (13).
18 The discrete-time duration model has several merits compared to the Cox propor-
tional hazard model. Firstly, when estimating the survival data with events (ties)
occurred under the same survival time, the discrete-time duration model is rela-
tively free from this bias compared to the Cox proportional hazard model. In addi-
tion, it can control the unobserved heterogeneity of the observed values more easi-
ly, while it can use conventional regression methods such as logit or Provit since
it does not assume the proportional hazard (Hess and Persson 2011: 14). Lastly,
the discrete-time duration model is more useful for analysis of large number of
observed values (Peterson et al. 2017: 27). The export route data of this paragraph
has more ties and number of observed values than the data used on the analysis
in the 2.2 paragraph so the discrete-time duration model is used for the analysis.

DETERMINANTS FOR EXPORT OF AGRI-FOOD FIRMS 63
(13)
The number of entire export routes is 22,639. Each export route can
have consistent parameter estimates of regression coefficient only if they
are independent from each other regardless of whether they the same com-
pany, market, or item. Lastly, the above function can utilize Probit, logit,
complementary log-log19 estimate, etc. models if it complies with each nor-
mal distribution, logistics distribution, and extreme-value minimum
distribution.
In this study, the binomial logistic regression model of the discrete haz-
ard function regarding the stop of agri-food export routes is defined as the
following formula (14).
(14)
The dependent variable would have the value 1 if the export route
ends in year, and the value of 0 if it were continued. In ac-
cordance with precedent studies, independent variables such as export con-
tinuing period, income level of the export market, FX rate, product diversi-
fication and market diversification by exporters, and export scale of during
the 1st year are all considered. We also added new explanatory variables
such as relative export price and number of export competitors in the same
export route, and share of logistics cost support on turnover (export support
ratio). The variables and basic statistics used in the analysis are presented
in the <Table 3-8>, and it also includes dummy variables by region ( )
and dummy variables by export product item ( ).
19 converts a real number into a value between 0 and 1 in the form of
as similar as logit.

64 DETERMINANTS FOR EXPORT OF AGRI-FOOD FIRMS
<Table 3-8> Variable and basic statistics used in the determinants analysis for
export routes sustainability
Variables Details AverageStandard deviation
dependent variables(relevant export route would be 1 when being stopped in t period, and otherwise 0)
0.453 0.003
The relevant export route would be 1 when it is included in the ith continuing period (spell i), and otherwise 0. sp1 86.3%, sp2 11.8%, sp3 1.7%
The number of years in which the relevant export route is constantly continued until the t period.
2.622 0.015
It would be 1 when the relevant export route is cut from the left (2005), otherwise 0
0.050 0.001
If the relevant export product is processed food, it would be 1, and 0 for fresh produce
0.167 0.002
log(GDP per capita for relevant import country), in US $ 9.943 0.007
FX rate of change in YoY for the relevant import country (%), in KRW(thousand)
0.632 0.727
The entire number of export items(export items diversification index) for the relevant company
8.670 0.071
The entire number of export market (export market diversification index) penetrated by the relevant company
8.587 0.043
If the item is the main item for the company, it would be 1, otherwise 0(in share of export item)
0.463 0.003
If the market is the main export market for the company, it would be 1, otherwise 0 (in share of export market)
0.320 0.003
The number of South Korea’s exporters exist in the relevant export route (including oneself)
7.160 0.060
The relative export price ratio for the relevant export route (%)- Unit cost for relevant exporter/ average unit cost for export of entire South
Korea companies(including oneself) 1.985 0.081
export support ratio(%) for the relevant export route, the share of logistics cost support amount on the export value
6.819 0.049
log((at continuously maintained spell) the 1st year’s export value(KRW) for the relevant export route)
16.915 0.015
Source: Author generated.
Considering the fact that the logit estimator is not linear to variables, and
the time series is a relatively short panel of data (8,683 units of export
route, 13 units of year), the random effect model was chosen instead of the
fixed effect model, where it is difficult to secure consistent estimators.20
Therefore includes the particular effects of an individual export route,

DETERMINANTS FOR EXPORT OF AGRI-FOOD FIRMS 65
which cannot be observed as the error term, where it is assumed that these
particular effects of an individual export route do not have relations with
others independent variables.21 For the above estimation model, the repre-
sentative particular effects of export routes include the non-tariff barriers
such as customs clearance processes being differentially applied by item
and import country, animal and plant quarantines, food hygiene examina-
tions, as well as the import tariff.
2.4.2. Analysis results
<Table 3-9> and <Table 3-10> are the binomial logistic regression model
estimation results of the discrete hazard function using the 2005~2017 ag-
ri-food export routes panel data. The results of analysis on overall samples
and the results of analysis for export markets by region are included in the
<Table 3-9>, while the results of analysis for export item group is pre-
sented in <Table 3-10>.22 The odds ratio is used for interpreting the results.
20 It is a well-known ‘Incidental parameter problem’ (Lancaster 2000). Nevertheless,
a panel analysis has merit by increasing the efficiency of estimators since it re-
duces bias of estimator, which may occur in a cross-section analysis. It also de-
creases the multi-collinearity issue when conducting a time series analysis.
Additionally, it identifies the changes of variables over time, as well as changes
by the difference of cross-section subjects.21 The random effect model may have occurrences of bias due to the correlation be-
tween observable independent variables and non-observable variables since it con-
siders the effect of an individual export route as a part of error term. In this case,
the ‘particular effects of unobserved export routes’ from the variance of error term
can explain that the share ( ) is 0 verifying the null hypothesis by the random
effect model. If this null hypothesis cannot be rejected, it is perceived as reason-
able to apply the random effect model. All the estimate results hereinafter could
not reject the relevant null hypothesis.22 Meanwhile, it cannot be interpreted as average marginal effects of a general re-
gression model since the explanatory variable estimation ( ) of the logit model is
. Thus the odds ratio is also presented for the bias of inter-
pretation of estimated results in <Table 3-9> and <Table 3-10>.

66 DETERMINANTS FOR EXPORT OF AGRI-FOOD FIRMS
The odds ratio shows the probability of export routes ceasing or continuing
when 1 unit of an explanatory variable changes. Therefore, changes in 1
unit of an explanatory variable increases the probability of export routes
continuing if the odds ratio is statistically significant and yet less than 1
(estimated coefficient has negative value).
In order to examine the effects of an export route’s continuation period
on the probability of an export ceasing, the variable ( ) meaning the
number of continuing years until the t period for the individual export route
and the cross-term of the dummy variable ( ) meaning the ith period (ith
spell) of the individual export route continuously maintained is added as the
explanatory variable. when meaning that the relevant company
was more than once eliminated from the same export route and then reen-
tered during the period of the analysis.23
Examining the entire sample’s estimation result, it was found that the
three estimated coefficients of cross-terms ( ) had a significant pos-
itive value, and the coefficient values got bigger as got bigger. This
means that the probability of an export route ceasing is bigger than that of
it continuing as the years of continuous export increase, Additionally, the
probability of an export route ceasing gets higher when exiting and reenter-
ing for the 3rd time. To present this more accurately with the odds ratio,
the probability of the export route to cease rather than continue increases
by 15.1% as the years of continuous export increase by 1 year, and the
probability is increased to 19.5% for the re-entering. These results are con-
trary to the results from most preceding studies. The major reason for this
is that the prior studies have mainly analyzed trade sustainability between
countries whereas this study analyzed the trade (export) sustainability be-
23 For instance, suppose that a company’s export route had been continuously main-
tained from 2005 to 2008, and it ceased to exist from 2009 to 2011, then it
re-maintained from 2012 to 2016. This export route has two constant export peri-
ods (spells) where the first period (1st spell) is 4 years, and the second period (2nd
spell) is 5 years. In this case, the observed value of the 2007 export route
is 3, and is 1, whereas the observed value of the 2016 export route is 5,
and is 1. Also, is 0 since 2007 is the year that the export is continued, but
is 1 since 2006 is the year that the export is stopped.

DETERMINANTS FOR EXPORT OF AGRI-FOOD FIRMS 67
tween companies and countries so it became clear that particular export
routes have been stopped more frequently. It is natural for the probability
of an individual domestic company’s Kimchi exports to Japan to cease, to
be much larger than the probability of Korea’s Kimchi exports to Japan to
cease. In fact, the study of Peterson et al.(2017), in which the USA’s im-
port sustainability for fresh vegetables and fruits from various countries is
analyzed, shows that the average period of continuous import routes is 6.8
years whereas that for export routes is 2.2 years in this study. In addition,
the prior studies classify items with mainly HS 6 digits whereas this study
classified actual items with more detailed criteria, thus making the average
period of continuous export routes shorter. The result of this study implies
that ‘Korea’s agri-food firms have a higher possibility of exports to cease
as the export routes continue’. Therefore, more effective policies are neces-
sary and vital for enhancing export sustainability of business units.
If a relevant export route already exists in 2005, the first year of the peri-
od for the study, the possibility of the actual period for export sustainability
to be cut is fairly high. There were 1,130 such export routes in the study
sample and these account for 5% of the entire sample, but the calculated
possibility of an export route continuing was 40% higher than the possi-
bility of it stopping in the case of the export route being cut in the left side.
Also, it was found that the possibility of export routes to cease for proc-
essed food was 27% higher than for them to continue. As found in the prior
studies, the probability of an export route continuing increased with the
scale of the first year exports ( ).
The GDP and FX rate of import countries were next considered as ex-
ternal variables affecting export sustainability. Our analysis showed that the
possibility of an export route continuing increased with the size of the im-
port country’s GDP per capita, whereas the FX rate of an import country
in KRW had no effect. 24
24 Suppose that FX rate increases from KRW1,000=JPY100 to KRW1,000=JPY110
(reflect the changes in KRW-US$ rate), it was initially expected that the possi-
bility of exports ceasing would be higher than that to continue in the Japan mar-
ket, but the effects of FX rate change on the risk of exports ceasing was not
significant (estimation sign is positive as expected).

<T
able
3-9
> B
inom
ial
logi
stic
reg
ress
ion
mod
el e
stim
atio
n re
sult
of
disc
rete
haz
ard
func
tion
fo
r ex
po
rt s
top
(ove
rall
sam
ple,
and
by
expo
rt m
arke
t ar
ea)
Ove
rall
sam
ple
Chi
na(c
g=1)
Japa
n(cg
=2)
SE.A
SIA
(cg=
3)th
e U
S(cg
=4)
EU(c
g=5)
Oth
ers(
cg=6
)
Var
iabl
eE
stim
ate
Pred
ictio
n er
ror
Odd
ra
tioE
stim
ate
Pred
ictio
n er
ror
Odd
ra
tioE
stim
ate
Pred
ictio
n er
ror
Odd
ra
tioE
stim
ate
Pred
ictio
n er
ror
Odd
ra
tioE
stim
ate
Pred
ictio
n er
ror
Odd
ra
tioE
stim
ate
Pred
ictio
n er
ror
Odd
ra
tioE
stim
ate
Pred
ictio
n er
ror
Odd
ra
tio
0.14
0 a
0.01
8 1.
151
0.11
2 a
0.04
9 1.
118
0.04
6 0.
041
1.04
7 0.
174
a0.
043
1.19
0 0.
212
a0.
054
1.23
6 0.
084
0.06
4 1.
087
0.12
1 a
0.03
4 1.
128
0.17
8 a
0.02
6 1.
195
0.00
7 0.
067
1.00
7 -0
.092
0.
085
0.91
2 0.
243
a0.
061
1.27
4 0.
265
a0.
070
1.30
3 0.
150
0.09
9 1.
162
0.16
8 a
0.04
8 1.
183
0.21
1 a
0.06
5 1.
235
-0.1
54
0.20
4 0.
857
-0.4
18 c
0.21
6 0.
658
0.21
5 0.
136
1.24
0 0.
418
c0.
221
1.51
9 0.
383
0.39
6 1.
467
0.24
4 b
0.10
8 1.
276
0.20
0 0.
202
1.22
1 -0
.790
0.
703
0.45
4 -0
.852
0.
771
0.42
7 0.
132
0.32
4 1.
141
1.01
7 0.
836
2.76
4 0.
367
1.13
4 1.
444
0.31
4 0.
391
1.36
8
0.17
7 1.
085
1.19
3 0.
188
1.08
1 1.
207
-0.5
06 a
0.08
4 0.
603
-0.5
61 b
0.26
0 0.
571
-1.7
14 a
0.27
5 0.
180
-1.2
68 a
0.23
1 0.
281
-0.9
23 a
0.23
0 0.
398
-1.2
50 a
0.37
5 0.
287
-0.1
64
0.15
9 0.
849
-0.3
16 a
0.11
2 0.
729
-0.3
03
0.25
2 0.
739
-0.8
10
0.78
8 0.
445
-0.5
79 b
0.26
0 0.
560
-0.3
51
0.33
6 0.
704
-0.0
05
0.54
7 0.
995
-0.2
06
0.19
9 0.
814
-0.0
55 b
0.02
6 0.
946
-0.3
43 a
0.08
5 0.
710
-7.8
93 a
2.59
5 0.
000
-0.0
22
0.03
8 0.
978
1.51
0 a
0.35
5 4.
528
-0.2
38
0.23
0 0.
788
-0.1
82 a
0.04
7 0.
833
-0.0
002
0.00
02
1.00
0 -0
.038
a0.
003
0.96
3 0.
005
0.00
4 1.
005
0.00
01
0.00
01
1.00
0 0.
051
a0.
007
1.05
2 0.
002
0.00
8 1.
002
-0.0
07 b
0.00
3 0.
993
0.00
6 a
0.00
2 1.
006
0.00
0 0.
008
1.00
0 -0
.001
0.
012
0.99
9 0.
036
a0.
006
1.03
6 -0
.007
0.
006
0.99
3 0.
021
b0.
010
1.02
2 -0
.008
c0.
004
0.99
2
-0.0
39 a
0.00
4 0.
962
-0.0
52 a
0.01
3 0.
949
-0.0
30
0.02
0 0.
970
-0.0
84 a
0.01
0 0.
920
-0.0
65 a
0.01
2 0.
937
-0.0
31 b
0.01
4 0.
969
-0.0
21 a
0.00
7 0.
979
-0.2
53 a
0.04
9 0.
776
-0.2
26
0.14
6 0.
797
-0.5
02 a
0.17
4 0.
606
-0.1
17
0.10
0 0.
890
-0.3
87 a
0.14
5 0.
679
-0.3
87 c
0.19
9 0.
679
-0.3
02 a
0.08
7 0.
739
0.01
1 0.
052
1.01
1 -0
.372
a0.
135
0.68
9 -0
.120
0.
181
0.88
7 -0
.042
0.
128
0.95
9 -0
.682
a0.
132
0.50
5 -0
.729
b0.
337
0.48
2 0.
411
a0.
095
1.50
8
-0.0
27 a
0.00
3 0.
973
-0.0
07
0.00
7 0.
993
-0.1
97 a
0.01
5 0.
821
0.02
7 0.
024
1.02
7 0.
124
a0.
019
1.13
2 -0
.139
0.
122
0.87
0 -0
.010
b0.
006
0.99
0
0.00
5 a
0.00
2 1.
005
0.00
5 0.
003
1.00
5 -0
.005
0.
016
0.99
5 0.
024
a0.
008
1.02
5 0.
063
a0.
020
1.06
5 0.
003
c0.
005
1.00
3 0.
003
0.00
2 1.
003
0.01
0 a
0.00
3 1.
010
0.02
2 b
0.01
0 1.
022
0.07
4 a
0.01
4 1.
077
0.00
4 0.
005
1.00
4 -0
.019
c0.
010
0.98
1 0.
018
0.01
2 1.
018
0.00
7 0.
005
1.00
7
-0.2
75 a
0.01
3 0.
760
-0.3
48 a
0.03
7 0.
706
-0.2
95 a
0.04
1 0.
745
-0.3
33 a
0.02
9 0.
717
-0.3
52 a
0.04
1 0.
703
-0.3
02 a
0.05
4 0.
739
-0.2
67 a
0.02
3 0.
766
Are
a du
mm
y O
XX
XX
XX
Item
gro
updu
mm
yO
OO
OO
OO
Obs
erva
tions
(N
)22
,541
3,10
73,
275
5,09
32,
670
1,45
76,
939
Exp
ort
rout
es(L
)8,
683
1,12
11,
030
2,11
497
364
02,
805
LR
-14,
324
-1,7
54
-1,7
70
-3,2
24
-160
2-8
75
-4,4
84
0.29
10.
019
0.27
70.
052
0.45
90.
056
0.29
10.
041
0.21
80.
056
0.30
50.
072
0.26
40.
035
Not
e: E
ach
a, b
, an
d c
impl
ies
the
sign
ific
ance
lev
el o
f 1
%,
5%
, an
d 10
% r
esp
ecti
vely
.
So
urce
: A
uth
or g
ener
ated
.
68 DETERMINANTS FOR EXPORT OF AGRI-FOOD FIRMS

<T
able
3-1
0> B
inom
ial
logis
tic
regr
essi
on m
odel
est
imat
ion
resu
lt o
f di
scre
te h
azar
d fu
ncti
on f
or e
xp
ort
sto
p
(by
expo
rt i
tem
gro
up)
tea(
in=3
)gi
nsen
g(in
=4)
frui
ts(i
nd=5
)ve
geta
bles
(id=
6)fl
ower
s(in
=7)
Kim
chi(
in=8
)liv
esto
ck p
rodu
cts(
in=9
)tr
aditi
onal
liq
uor(
in=1
0)
Var
iabl
eEs
timat
ePr
edic
tion
erro
rO
dd
ratio
Estim
ate
Pred
ictio
n er
ror
Odd
ra
tioEs
timat
ePr
edic
tion
erro
rO
dd
ratio
Estim
ate
Pred
ictio
n er
ror
Odd
ra
tioEs
timat
ePr
edic
tion
erro
rO
dd
ratio
Estim
ate
Pred
ictio
n er
ror
Odd
ra
tioEs
timat
ePr
edic
tion
erro
rO
dd
ratio
Estim
ate
Pred
ictio
n er
ror
Odd
ra
tio
0.24
6a
0.06
01.
279
0.08
9a
0.03
81.
093
0.33
7a
0.05
81.
400
0.09
4a
0.02
91.
099
0.24
6a
0.07
41.
279
0.18
3b
0.07
31.
201
0.36
9a
0.12
91.
446
0.44
8a
0.14
01.
565
0.24
9a
0.08
91.
283
0.10
7a
0.05
21.
113
0.42
7a
0.07
51.
532
0.19
3a
0.04
91.
212
0.15
40.
109
1.16
70.
142
0.10
01.
153
0.51
7a
0.17
91.
677
0.45
0a
0.16
41.
568
0.55
00.
393
1.73
30.
453
a0.
150
1.57
20.
878
a0.
287
2.40
70.
109
0.09
91.
116
0.05
00.
177
1.05
1-0
.148
0.28
70.
862
2.19
2c
1.30
08.
949
1.05
60.
716
2.87
5
-0.0
411.
180
0.96
00.
136
0.25
31.
146
0.27
10.
440
1.31
10.
282
0.81
11.
326
0.13
11.
084
1.14
0
-0.4
340.
327
0.64
8-0
.739
a0.
215
0.47
8-0
.898
a0.
187
0.40
8-0
.242
c0.
143
0.78
5-0
.633
c0.
352
0.53
11.
177
a0.
384
3.24
6-1
.527
b0.
707
0.21
7
-0.4
39a
0.18
00.
645
-0.9
94a
0.36
10.
370
0.03
50.
111
1.03
5-0
.020
0.06
60.
980
-0.0
860.
057
0.91
8-0
.087
b0.
044
0.91
6-0
.423
b0.
209
0.65
5-0
.179
0.13
30.
836
-0.1
160.
164
0.89
0-0
.348
b0.
165
0.70
6
-0.0
14a
0.00
50.
987
-0.0
12a
0.00
40.
988
0.00
010.
0003
1.00
0-0
.015
a0.
002
0.98
50.
006
0.00
71.
006
-0.0
080.
006
0.99
2-0
.002
0.00
60.
998
-0.0
14c
0.00
80.
986
0.04
0c
0.02
31.
041
0.07
8a
0.01
71.
081
0.01
5b
0.00
61.
015
-0.0
07c
0.00
40.
993
0.00
10.
019
1.00
10.
002
0.01
51.
002
0.07
9a
0.02
81.
082
0.34
6b
0.15
51.
413
-0.0
50a
0.01
80.
951
-0.1
11a
0.01
30.
895
-0.0
77a
0.01
40.
926
-0.0
21a
0.00
60.
979
0.06
40.
039
1.06
60.
001
0.01
51.
001
-0.1
53a
0.05
30.
858
-0.1
31a
0.03
00.
878
-1.1
81a
0.30
10.
307
-0.1
97c
0.11
60.
821
-0.2
18b
0.10
30.
804
-0.1
70b
0.08
30.
844
0.18
80.
267
1.20
7-0
.717
b0.
307
0.48
8-1
.215
a0.
371
0.29
70.
572
0.81
31.
772
-0.0
010.
239
0.99
9-0
.284
c0.
146
0.75
3-0
.034
0.11
90.
967
0.08
70.
082
1.09
1-0
.037
0.30
80.
964
0.12
80.
313
1.13
7-0
.364
0.27
50.
695
0.25
90.
521
1.29
6
-0.0
56a
0.01
30.
946
-0.0
31a
0.01
00.
969
0.00
70.
008
1.00
7-0
.015
a0.
005
0.98
5-0
.095
a0.
016
0.91
0-0
.044
a0.
016
0.95
7-0
.089
a0.
020
0.91
4-0
.102
a0.
031
0.90
3
-0.2
020.
315
0.81
70.
062
a0.
022
1.06
40.
151
b0.
075
1.16
30.
003
c0.
002
1.00
30.
048
0.03
41.
049
0.94
4c
0.55
52.
571
-0.5
30a
0.15
80.
588
0.83
8a
0.30
32.
311
-0.0
240.
018
0.97
70.
0004
0.00
71.
000
0.03
6a
0.00
81.
037
0.00
60.
005
1.00
60.
036b
0.01
81.
037
0.02
70.
032
1.02
7-0
.033
b0.
032
0.96
80.
054
b0.
025
1.05
5
-0.4
35a
0.06
80.
647
-0.3
73a
0.04
00.
689
-0.3
54a
0.03
60.
702
-0.2
52a
0.01
90.
777
-0.4
29a
0.07
10.
651
-0.3
25a
0.06
90.
723
-0.4
48a
0.09
80.
639
-0.4
24a
0.12
50.
655
Are
a du
mm
yO
OO
OO
OO
O
Item
gro
up
dum
my
XX
XX
XX
XX
Obs
erva
tions
(N
)1,
917
3,08
14,
626
8,39
71,
220
1,26
086
958
9
Exp
ort
rout
es(L
)56
21,
057
1,91
93,
494
394
379
302
188
LR
-109
3-1
,867
-2,9
69-5
,410
-713
-752
-509
-338
ρ0.
435
0.07
10.
296
0.04
50.
334
0.04
80.
264
0.03
10.
446
0.08
00.
348
0.09
00.
362
0.12
30.
328
0.13
2
Not
e1
) T
he
grai
ns(i
n=1)
, pr
oces
sed
rice
(in=
2),
and
oth
er p
roce
ssed
go
ods(
in=
11)
, w
hich
did
not
hav
e en
oug
h ob
serv
ed v
alue
s of
exp
ort
rout
es,
are
excl
uded
in
the
anal
ysis
.
2)
Eac
h a,
b,
and
c im
pli
es t
he s
igni
fica
nce
leve
l of
1%
, 5
%,
and
10%
res
pect
ivel
y.
So
urce
: A
uth
or g
ener
ated
.
DETERMINANTS FOR EXPORT OF AGRI-FOOD FIRMS 69

70 DETERMINANTS FOR EXPORT OF AGRI-FOOD FIRMS
The following notable results regarding the diversification of items and
market diversification were drawn during our study. The probability of a
company's export to cease versus continue, increased by 0.6% as the entire
number of export items for representing the diversification of items in-
creased by one. On the other hand, the probability of a company's export
route to continue versus ceasing, increased by 3.8% as the entire number
of export markets that the companies penetrated representing the diversifi-
cation of markets increased by one. In addition, it was found that the odds
ratio of dummy variables implying whether the item is the main item for
the company or not was 0.776, but the variables for identifying whether the
market was the main market or not was not statistically significant.
These results imply that market diversification has positive effects on ex-
port sustainability and that the diversification of items has negative effects
on the export sustainability. Our results also suggest that export routes for
the main items have a higher possibility of continuing, but export routes for
the non-main items in the main market have a lower possibility of
continuing.
Meanwhile, the number of South Korean exporters present in the relevant
export routes was included as the explanatory variable affecting export sus-
tainability to verify the theory that the probability of an export rout ceasing
increases as competition among domestic companies intensifies in the same
export routes. However, the result was the opposite. It was found that if
one more domestic exporter exists in the same export route, the probability
of export sustainability (vs that of stop) increases by 2.7%. This implies
that direct effects are much bigger that the effects of competition among
domestic companies. This result also suggests that increasing the number of
domestic exporters in an individual export route has multiple positive
effects. Such as increasing product awareness in the market, improving ex-
port performance by transferring or learning export know-how or marketing
strategy among domestic companies, and creating strategic collaboration
such as sharing of logistics system, using joint brands, and joint marketing
strategies (local advertisement, sales events, etc.) that would have cumu-
lative positive effects.
An export price was calculated by dividing the unit cost for export of the
relevant export route by the average unit cost for export of all Korean com-

DETERMINANTS FOR EXPORT OF AGRI-FOOD FIRMS 71
panies (including oneself) in the relevant export route. This value represents
an index for price competitiveness for exporters and is included in the ex-
planatory variable. Our analysis found that the odds ratio for an export
route to cease increased as the export price of a company exceeded the
average export price for all companies.
Lastly, it was found that the odds ratio for an export route to cease in-
creased by 1% as the share of the logistics cost support on the export value,
that is the export support rate of each export route, increased by 1%. This
implies that the logistics cost support may be helpful for export expansion
in the short term, but it may be offset by the company’s efforts such as
voluntary local market surveys, post management, quality improvement, or
cost reduction.
The second row of <Table 3-9> shows that the export market is divided
into 6 areas that isolate the export routes. The results are presented by esti-
mating with the same method (dummy by region not included). Overall, the
result for the entire sample was generally similar but some explanatory var-
iables showed the opposite sign in the estimation result by region. For ex-
ample, the probability of an export to be stopped is higher than that to be
stopped as CNY on KRW rate increases in the China market. It is possible
to infer that the export sustainability for Korea’s agri-food can be further
enhanced if: one secures quality competitiveness in the China market,
China’s rapid economic growth increases the demand for South Korea ag-
ri-food, there is in an increase of high income consumers, or proliferation
of Hanryu offsets the effects of higher price caused by increased FX rate.
On the other hand, we found that the probability of an export to cease was
higher as the GDP per capita increased in the US market. This implies that
South Korea’s agri-food was not perceived as a high value-added import
product until now in the US market. In addition, the probability of an ex-
port to cease was higher as the number of exporters increased in the same
export route, whereas the high export support rate had positive effects on
export sustainability. These results imply that the probability of an export
to cease increases as the number of competitors increases, since the US
market is the market where the most domestic agri-food firms have entered,
but export sustainability can be improved by cost reduction through export
support in these market environments.
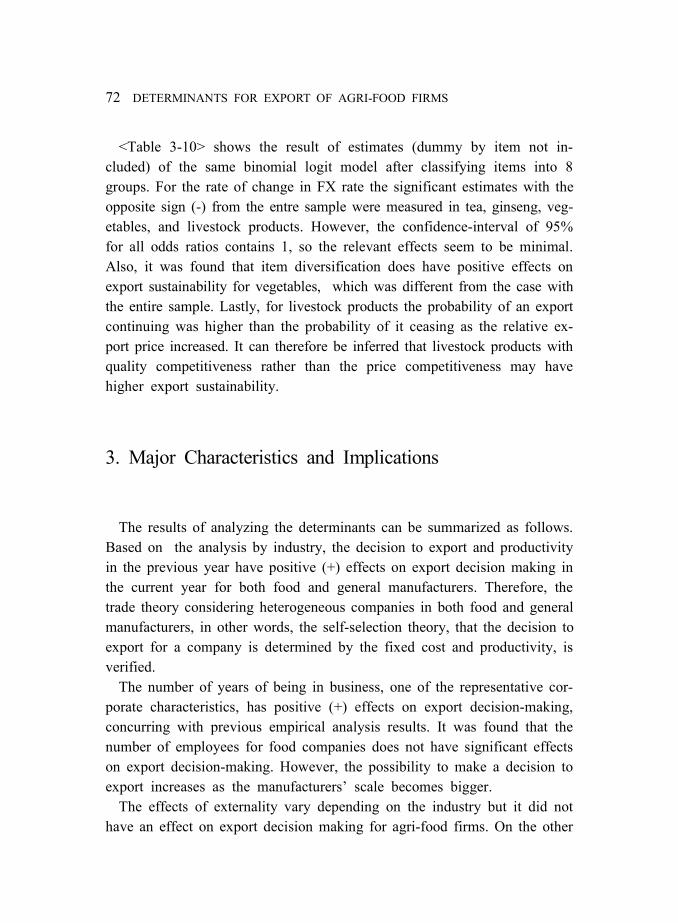
72 DETERMINANTS FOR EXPORT OF AGRI-FOOD FIRMS
<Table 3-10> shows the result of estimates (dummy by item not in-
cluded) of the same binomial logit model after classifying items into 8
groups. For the rate of change in FX rate the significant estimates with the
opposite sign (-) from the entre sample were measured in tea, ginseng, veg-
etables, and livestock products. However, the confidence-interval of 95%
for all odds ratios contains 1, so the relevant effects seem to be minimal.
Also, it was found that item diversification does have positive effects on
export sustainability for vegetables, which was different from the case with
the entire sample. Lastly, for livestock products the probability of an export
continuing was higher than the probability of it ceasing as the relative ex-
port price increased. It can therefore be inferred that livestock products with
quality competitiveness rather than the price competitiveness may have
higher export sustainability.
3. Major Characteristics and Implications
The results of analyzing the determinants can be summarized as follows.
Based on the analysis by industry, the decision to export and productivity
in the previous year have positive (+) effects on export decision making in
the current year for both food and general manufacturers. Therefore, the
trade theory considering heterogeneous companies in both food and general
manufacturers, in other words, the self-selection theory, that the decision to
export for a company is determined by the fixed cost and productivity, is
verified.
The number of years of being in business, one of the representative cor-
porate characteristics, has positive (+) effects on export decision-making,
concurring with previous empirical analysis results. It was found that the
number of employees for food companies does not have significant effects
on export decision-making. However, the possibility to make a decision to
export increases as the manufacturers’ scale becomes bigger.
The effects of externality vary depending on the industry but it did not
have an effect on export decision making for agri-food firms. On the other

DETERMINANTS FOR EXPORT OF AGRI-FOOD FIRMS 73
hand, it was found that a different industry within the region and the same
industry outside the region do have effects and increase the possibility for
export of general manufacturers. However, the direct effects of externality
such as logistics, infra, and export knowhow have bigger effects than the
competition effect for manufacturing (other than F&B manufacturing), lead-
ing to positive effects on decisions to export.
As a result of additionally verifying the learning by exporting theory, we
found no evidence that entering the export market itself had effects on the
increase of productivity. This implies that improving the productivity of
company as a whole to increase the chance of entry to the export market,
but increasing the entry to export does not improve the productivity of the
industry as a whole. Therefore, it is desirable to establish policies to focus
more on increasing exports by improvements in productivity for expanding
the entry of agri-food firms to the export market.
As a result of analyzing export sustainability by industry, the number of
years for being in business, number of employees, and having similar in-
dustry within the region are factors that affect the export sustainability for
food companies. However, unlike with general manufacturing, productivity
did not have significant effects on export sustainability for agri-food
companies. Nevertheless, it was found that the effects of externality (share
of exporters in the same industry within the region), which was not
significant for export decision making, did have impact on export
sustainability. These results appear to reflect the characteristics of the ag-
ri-food industry, which can be classified by item to have a favorable posi-
tion over manufacturing. In other words, the synergy effect among the ex-
porters in the major production sites for exporting particular agricultural
products appears to be helpful for continuation of export. Therefore, poli-
cies supporting major production sites for the major export items would in-
crease the chances to continue export for companies in the region, thus
playing a positive role in the stable growth of agri-food exports.
As a result of analyzing the export sustainability for agri-food firms by
item and export destination, it was found that 25% of Korea’s new ag-
ri-food export routes for the period of continuation is less than a year, and
50% have stopped within the 5th year. The share of export performance for
continuing export routes (54.5% of export routes) is 80.3%, so it can be in-

74 DETERMINANTS FOR EXPORT OF AGRI-FOOD FIRMS
ferred that the companies with continuing export routes lead agri-food
exports. Dissecting the export markets into 6 regions (China, Japan, S.E.
Asia, the USA, EU, and others), revealed that the Japan market has the
highest export sustainability while the S.E. Asia market’s export sustain-
ability is the lowest. We also observed that Kimchi’s export sustainability
was the highest among the 11 item categories analyzed, while the years of
continuing export for fruits, grains, processed rice, and other processed
products were relatively shorter.
Next the factors having effects over the sustainability of export routes
were analyzed. As a result, it was found that the probability of an export
to cease increased as the years of continuous export increased. It was also
found that diversifying items would increase the probability of export
routes to cease, whereas diversifying export markets would increase the
probability of export routes to continue. This result suggests that the ex-
istence of similar export routes is working as a direct effect to increase the
possibility of export sustainability. However, the probability of export
routes to cease increased as the relative export price increases and export
support rate was higher. Additionally, the probability of export routes to be
continued increased with the GDP of import country.
Our analysis by region revealed that the possibility of export sustain-
ability increased as the FX rate (CNY on KRW) increased in China. Also,
the existence of the same export routes in the USA increased the proba-
bility of export to cease, whereas the possibility of export sustainability in-
creased as the export support rate increased. In our analysis by item, it was
found that item diversification for vegetables had positive effects on export
sustainability, while the possibility of export sustainability increased as the
relative export price for livestock products increased.
The agri-food firms with continuous exports had a higher share of the en-
tire agri-food export market, implying that export sustainability plays an im-
portant role in not only stable growth but also expansion of exports. It was
also found that market diversification has positive effects on the probability
of export routes to continue, but item diversification increased the proba-
bility of export routes ceasing. Therefore, a strategy that pursues market di-
versification while focusing on the main export items of individual compa-
nies is still valid for export sustainability and the stable export growth.

DETERMINANTS FOR EXPORT OF AGRI-FOOD FIRMS 75
Nonetheless, preparing countermeasures is important for long-term export
stability considering the external risks. Even though the concentration strat-
egy on a particular item such as Kimchi can increase the sustainability of
exports, it is still vulnerable to political changes in the counter country,
such as changes in quarantine and food safety standards. In this case, ex-
panding the export destination countries can disperse external risks.
However, it will reach a point where further market expansion is difficult
to accomplish. Therefore, in the long conducting diversification and devel-
opment of competitive items should ease external impacts or risks even if
a company suffers from the rise of costs in R&D investment in the
short-term.


Chapter 4. STRATEGY AND PERFORMANCE OF AGRI-FOOD EXPORTERS
In this chapter we use surveys to analyze strategic factors affecting the
determinants for export decision making and the export performance of
companies. The subjects of our surveys include the producers’ organ-
izations, that produce and export fresh produce or simple processed ag-
ri-food, and the export-specialized companies that handle the export of
items for the above entities. Producers’ organizations are important subjects
for the relevant government’s agri-food export policies (NH, agricultural as-
sociation corporations, agriculture corporations), The results of ques-
tionnaires on the scope of utilization and the level of satisfaction with the
export support programs for agri-food firms were included in the surveys
in order to analyze the actual status of using the programs by the agri-food
firms and to function as baseline data for improving the programs.
We first analyze the characteristics and current status of the agri-food ex-
porters based on the survey results as well as what constitute effective strat-
egies based on export performance. We also include the conjoint analysis
for "export support program’s performance data" used in Chapter 3 matched
with survey subject companies.
Next, the relationship between export performance and the export strat-
egies by agri-food firms’ type was analyzed. Finally, more effective export
strategies can be revealed by complementing the results of this analysis
with the case studies on companies by type.

78 STRATEGY AND PERFORMANCE OF AGRI-FOOD EXPORTERS
Subject ◦500 agri-food exporters
Survey period ◦August ~ September 2018
Method ◦Visit subject companies and interview(survey specialized agency consigned)
Major contents
◦agri-food exporters characteristics and current status
·general current status of company, turnover and export value, major export items, major
export market countries
·overseas penetration plan and difficulties, reasons for overseas market penetration, export
manner, global competitiveness
·satisfaction level on export performance, domestic and overseas market growth
·current status of financial structure scale
◦export strategies of agri-food exporters and export support programs
·Detailed export strategy by strategy elements
·participated export support programs and efficacy/satisfaction level, importance, wanted
export support programs
Source: Author generated.
<Table 4-1> Survey for agri-food firms’ export strategy analysis
1. Surveys on agri-food exporters
Surveys were conducted to identify the differentiated export strategies of
various agri-food firm types. The surveyed agri-food firms were selected by
considering the region, company scale, export items (fresh and processed),
and so forth. The survey was preceded by a visit and interview of 500 com-
panies arranged by a professional survey agency after finalizing the survey
questionnaires through preliminary interviews.
The results of our survey analysis were used to identify the current status
and type of agri-food firms’ export, and for analyzing the factors affecting
the export decision making and strategy of agri-food firms by comparing
and analyzing the export strategies of the companies by type. In addition,
the survey results on the scope of utilization and satisfaction of export sup-
port programs for agri-food firms by type were utilized as basic data neces-
sary for improving the export support programs as well as for analyzing the
actual status of export support programs for the companies by type.
The major contents of the surveys include the major characteristics of ag-
ri-food exporters, export performance (item, export market), the company’s

STRATEGY AND PERFORMANCE OF AGRI-FOOD EXPORTERS 79
current status, any difficulties encountered in overseas market penetration,
the main export item’s global competitiveness and export performance, and
evaluation of satisfaction (refer to <Table 4-1>). In addition, the export
strategy, efficacy of export support programs, and satisfaction level were
examined for overseas market penetration and export increase for agri-food
exporters.
Among the survey subject agri-food exporters, it was found that the com-
panies exporting only fresh produce (hereinafter referred to as ‘fresh agri-
cultural products exporters’) account for 25.8% (129) of the entirety., The
companies exporting only processed agri-food (hereinafter referred to as
‘processed agri-food exporters’) account for 72.2% (361), and the compa-
nies exporting both fresh produce and processed agricultural products
(hereinafter referred to as ‘fresh and processed agri-food exporters’) account
for just 2.0% (10). It was found that these agri-food firms had an average
of 8 years of export experience and this ranged from a minimum of 1 year
to a maximum of 58 years.
The distribution fresh agricultural product exporters with 1~5 years, 6~10
years, and over 11 years of export experience was 33.9%, 25.8%, and
40.3% respectively, while that for processed agri-food exporters was 54.8%,
22.7%, and 22.4%, respectively and that for fresh and processed agri-food
exporters was 40.0%, 13.3%, and 46.7% respectively. Among these ex-
porters, it was found that the exporters operating an exclusive exports de-
partment accounted for 34.6% (173) of the entirety, whereas the exporters
having a sales department conducting exports accounted for 42.0% (201)
The exporters not operating any separate department for exports accounted
for 25.2% (126).
<Table 4-2> shows the major characteristics of the survey subject ag-
ri-food exporters. It was found that when considering all agri-food export
items, direct production items accounted for more than 2-times as much ex-
port volume as consigned production items. When considering the method
of export, the share of direct export was over 4 times higher than that of
consigned export. Looking into the production methods and manner of ex-
port, it was found that the production method of agri-food exporters export-
ing mainly fresh agricultural products had a similar portion of consigned
production and direct production, whereas for the export method the share

80 STRATEGY AND PERFORMANCE OF AGRI-FOOD EXPORTERS
of direct export was over 2 times higher than consigned export. In the case
of the agri-food exporters exporting only processed food, direct production
was approximately 4 times higher than consigned production, whereas di-
rect export was about 6 times higher than consigned export. On the other
hand, it was found that agri-food exporters handling both fresh produce and
processed food had a high share of consigned production and direct export.
<Table 4-2> characteristics of agri-food exporters survey subject
unit: number of unit, %
Subject
Production method Export method
Direct
production
Consigned
production
Direct and
Consigned
production
Totaldirect
export
consignment
export
direct and
consignme
nt export
Total
Entirety318 124 58 500 376 91 33 500
(63.6) (24.8) (11.6) (100.0) (75.2) (18.2) (6.6) (100.0)
export
items
fresh57 61 11 129 87 41 1 129
(44.2) (47.3) (8.5) (100.0) (67.4) (31.8) (0.8) (100.0)
processed259 59 43 361 282 47 32 361
(71.7) (16.3) (11.9) (100.0) (78.1) (13.0) (8.9) (100.0)
fresh and
processed
2 4 4 10 7 3 0 10
(20.0) (40.0) (40.0) (100.0) (70.0) (30.0) (0.0) (100.0)
Source: The author generated based on the corporate surveys (2018. 8.) for agri-food firms’ export
strategy analysis.
Even though companies can be divided in various ways depending upon
the objective of the study, in this study we divided the companies by apply-
ing the following 3 conditions: export items25, production method, and cor-
porate scale.
Processed food was divided by the production method (direct or con-
signed) for the export product of company, and the corporation type was
25 The export items of the various companies are classified into 12 groups. However,
the type of export items is simplified into fresh and processed considering the
number of variables to be used in the analysis and the numbers of the sample by
group.

STRATEGY AND PERFORMANCE OF AGRI-FOOD EXPORTERS 81
divided by scale considering that the variance of corporate scale (# of em-
ployees) and distribution is huge for direct production. <Table 4-3> shows
the type of company classified into 4 groups. First, the companies exporting
only fresh produce are in Type A (hereinafter fresh agricultural products
exporters). The other types are for processed food exporters, which were
classified into B1, B2, and Type C. From the companies in Type B1 and
B2 with direct production, the companies with a number of employees of
below 10 fall under Type B1 (hereinafter referred to as small scale proc-
essed agri-food exporters), that of 11 or more employees is Type B2
(hereinafter referred to as Medium-size exporters for processed agri-food).
Among the companies exporting mainly processed food, the companies
have consigned production or export after purchasing the products fall un-
der Type C (hereinafter referred to as Consigned production exporters for
processed agri-food).
<Table 4-3> Classification of agri-food exporters type
item(production)
Type
Scale
fresh produceprocessed agri-food
(direct production)
processed agri-food
(Consigned production)
# of employees with
below 10 (A) exporting only
fresh produce
(NA = 129)
(B1) direct production,
processing, & export
with below 10 (NB1 = 120)(C) Consigned production for
processing, and export
(NC = 110)# of employees with
above 10
(B2) processed direct
production export
With 11 or more (NB2 = 141)
Source: Author generated.
1.1. Characteristics of agri-food exporters’ penetration into overseas markets
The export characteristics of agri-food exporters’ penetration into over-
seas market were analyzed from the perspective of reasons for overseas
market penetration, difficulties when entering new markets, and the method
of setting the overseas market price. First, it was found that ‘revenue and
profits increase’ is the #1 objective for the agri-food exporters’ overseas

82 STRATEGY AND PERFORMANCE OF AGRI-FOOD EXPORTERS
market penetration in general. This was followed in order by ‘securing
global competitiveness’ and ‘avoiding a limited domestic market and ex-
cessive competition’. It was determined that the foregoing three reasons
were the major ones for each exporter type as well, yet they had different
characteristics by type. For the fresh agricultural products exporters (A), it
was found that the ratio of responses for ‘avoiding a limited domestic mar-
ket and excessive competition’ and ‘diversification of risks (supply, price)
for domestic market’ had a higher ratio of responses compared to other
types. For relatively large-scale companies in Type B2, C, although the
share of ‘revenue and profits increase’ for the objective of the overseas
market penetration was high, it was found that ‘securing global com-
petitiveness’ was a similarly important reason for overseas market pene-
tration by the processed agri-food export (B1, B2, C) companies compared
to the fresh agricultural products export (A) companies.
<Table 4-4> Reasons for agri-food exporters’ overseas market penetration
unit: %
subjectSecuring global
competitiveness
Differentiated
product
development
appropriate for
overseas market
revenue
and
profits
increase
Avoiding limited
domestic market
and excessive
competition
diversification
of risks(supply,
price) for
domestic
market’
others Total
Entirety 28.1 16.7 30.4 18.1 4.7 2.0 100.0
By
type
A 23.0 14.6 29.7 21.7 8.0 3.1 100.0
B1 30.1 19.2 28.6 17.7 4.4 0.0 100.0
B2 29.6 15.9 31.8 18.0 3.0 1.7 100.0
C 30.4 17.5 31.6 14.0 2.9 3.5 100.0
Note 1) A-fresh agricultural products exporters, B1-small scale processed agri-food exporters,
B2-Medium-size exporters for processed agri-food, C-Consigned production exporters for
processed agri-food.
2) Results with duplicated answers of the 1st and 2nd choices were also counted.
Source: Author generated based on the corporate surveys (2018. 8.) for analysis of agri-food
firms’ export strategy.
Next the difficulties faced by companies when penetrating new markets
were examined. From the entire surveyed group of agri-food exporters,
73.4% had plans for penetrating new markets and the rest did not have a

STRATEGY AND PERFORMANCE OF AGRI-FOOD EXPORTERS 83
plan. It is found that the difficulties experienced when penetrating new mar-
kets are ‘finding new buyers’, ‘lack of market information’, ‘local market-
ing activities’, ‘Securing funds for export’, and ‘price competitiveness’ in
that order., The proportion of responses regarding the ‘export logistics’ and
‘non-tariff barriers’ was very low. <Table 4-5>.
<Table 4-5> Experienced difficulties when penetrating new markets
unit: %
subject
finding
new
buyers
lack of
market
information
Securing
funds for
export
Local
marketing
activities
export
logistics
non-tariff
barriers
price
competiti
veness
others Total
Entirety 25.9 25.2 13.2 21.8 4.9 1.1 6.8 1.1 100.0
By
type
A 21.2 22.1 13.5 24.0 7.7 0.0 9.6 1.9 100.0
B1 29.6 27.8 18.5 18.5 3.7 0.0 0.0 1.9 100.0
B2 25.0 29.7 9.4 21.9 1.6 4.7 7.8 0.0 100.0
C 34.1 22.7 11.4 20.5 4.6 0.0 6.8 0.0 100.0
Note 1) A-fresh agricultural products exporters, B1-small scale processed agri-food exporters,
B2-Medium-size exporters for processed agri-food, C-Consigned production exporters for
processed agri-food.
2) Results with the duplicated answers of the 1st and 2nd choices were also counted.
Source: Author generated based on the corporate surveys (2018. 8.) for analysis of agri-food
firms’ export strategy.
Examining the responses by type of company revealed that the fresh
product exporters (A) had more difficulty with ‘local marketing activities’
and ‘price competitiveness’ compared to other types of export companies.
Whereas a relatively high portion of the Type B1 or B2 export companies
that directly produced products had ‘lack of market information’ issues. The
Type C companies had more difficulty in ‘finding new buyers’ when pene-
trating new markets compared to the other types of companies.
Meanwhile, 26.6% of survey subjects answered that they had not consid-
ered new market penetration. When asked the major reasons why not, the
most common responses from the survey group as a whole were ‘focusing
on previous market’ and ‘non-tariff barriers’. Breaking the responses down
by company type showed that ‘focusing on previous market’ was the pri-
mary reason for Type A fresh product companies, whereas ‘non-tariff bar-

84 STRATEGY AND PERFORMANCE OF AGRI-FOOD EXPORTERS
riers’ was the primary reason for companies exporting processed goods (B1,
B2, C). As for the rest of the reasons, ‘lack of market information’,
‘Profitability on investment’, and ‘burden of initial investment cost’ in or-
der accounted for a high portion of the answers.
<Table 4-6> Reasons not to consider new market penetration
unit: %
Subject
Focusing
on previous
market
lack of
market
information
Burden of
initial
investment cost
Profitability
on
investment
Lack of
export
volume
non-tariff
barrierothers Total
Entirety 26.5 18.1 12.3 15.4 1.8 25.7 0.3 100.0
By
type
A 38.2 18.2 15.5 12.7 2.7 12.7 0.0 100.0
B1 24.1 19.5 14.9 12.6 2.3 26.4 0.0 100.0
B2 22.8 20.2 8.8 16.7 1.8 29.8 0.0 100.0
C 18.6 14.0 10.5 19.8 0.0 36.1 1.2 100.0
Note 1) A-fresh agricultural products exporters, B1-small scale processed agri-food exporters,
B2-Medium-size exporters for processed agri-food, C-Consigned production exporters for
processed agri-food.
2) Results with the duplicated answers of the 1st and 2nd choices were also counted.
Source: The author generated based on the corporate surveys (2018. 8.) for agri-food firms’ export
strategy analysis
The agri-food export price is an important variable in determining export
strategy, and it directly affects the profitability of exporters. It was found
that the main methods of setting the overseas market price for a company
are: ‘considering the price level of local market competition products’,
‘production cost and proper margin’, ‘adjustment for local demand’, and
‘adjustment with Local importer’s demand’ in order. Examining the results
by type of company revealed that Type A and C companies answered
‘considering the price level of local market competition products’ and
‘adjustment for local demand’ the most. In addition, it seems that the Type
C companies conduct more strategic price discounting compared to the oth-
er types. The analysis also revealed that the Type B1 or B2 companies,
which directly produce and export, weigh ‘production cost and proper mar-
gin’ more in setting their price as compared to other types of companies.
However, the results of Type A companies’ answer for the fresh produce

STRATEGY AND PERFORMANCE OF AGRI-FOOD EXPORTERS 85
must be interpreted in light of the fact that the market price for some ex-
port items is set according to relevant laws.
<Table 4-7> Setting the overseas market price by agri-food exporters
unit: %
subject
production
cost and
proper
margin
considering the
price level of local
market competition
products
adjustment for
local demand
Adjustment
with Local
importer’s
demand
strategic price
discountothers Total
Entirety 25.9 29.7 19.5 16.4 8.2 0.3 100.0
By
type
A 23.2 32.9 21.3 15.7 6.5 0.5 100.0
B1 30.0 29.5 17.0 15.5 8.0 0.0 100.0
B2 28.0 26.2 18.8 18.4 8.7 0.0 100.0
C 21.9 30.6 21.3 15.6 10.0 0.6 100.0
Note 1) A-fresh agricultural products exporters, B1-small scale processed agri-food exporters,
B2-Medium-size exporters for processed agri-food, C-Consigned production exporters for
processed agri-food.
2) Results with duplicated answers of the 1st and 2nd choices were also counted.
Source: The author generated based on the corporate surveys (2018. 8.) for agri-food firms’ export
strategy analysis
1.2. Global competitiveness and export performance of agri-food exporters
Next, we examined how the surveyed agri-food exporters evaluated their
global competitiveness and export performance. The exporters’ global com-
petitiveness was examined focusing on the major product,26 while the sub-
jective evaluation and their level of satisfaction were queried and then used
for evaluation of export performance.
The levels were evaluated with the Likert 5-point scale and then con-
verted to a 100-point system. It was found that the survey subject compa-
26 The outlook for major export item’s global competitiveness of food exporters, ex-
port performance and satisfaction level for the recent 3 years, growth in domestic
and overseas markets, and product competitiveness are evaluated using Likerts
5-point scale (1=very low, 5=very high) and then converted to 100-point system.

86 STRATEGY AND PERFORMANCE OF AGRI-FOOD EXPORTERS
nies evaluated their major export items’ global competitiveness at about 70
points, whereas the quality, technology, and production cost competitive-
ness in order were evaluated as high or very high. Evaluating them across
company type shows similar scores, except for the small-scale processed
agri-food exporters (B1) who evaluated their global competitiveness as rela-
tively low.
<Table 4-8> Evaluation of global competitiveness by agri-food exporters
unit: %, point
subject very low low average high very highglobal
competitiveness
Entirety
quality 2.0 7.2 36.2 43.4 11.2 72.5
production cost 1.2 11.8 40.8 37.4 8.8 68.2
technology 2.0 6.0 32.4 46.6 13.0 70.9
By type
A
quality 0.8 4.7 31.8 51.2 11.6 73.6
production cost 0.0 10.9 45.7 35.7 7.8 68.1
technology 0.8 7.8 34.9 48.1 8.5 71.2
B1
quality 4.2 9.2 33.3 42.5 10.8 69.3
production cost 2.5 10.0 41.7 40.0 5.8 67.3
technology 3.3 10.0 38.3 37.5 10.8 68.5
B2
quality 1.4 4.3 31.9 50.4 12.1 73.5
production cost 0.7 12.1 39.7 39.0 8.5 68.5
technology 1.4 5.7 36.9 45.4 10.6 71.6
C
quality 1.8 6.4 32.7 40.9 18.2 73.5
production cost 1.8 14.6 35.5 34.6 13.6 68.7
technology 2.7 5.5 34.6 41.8 15.5 72.4
Note 1) A-fresh agricultural products exporters, B1-small scale processed agri-food exporters,
B2-Medium-size exporters for processed agri-food, C-Consigned production exporters for
processed agri-food.
2) global competitiveness is evaluated with the Likert 5-point scale (1=very low, 5=very
high), then converted to 100 point system.
Source: The author generated based on the corporate surveys (2018. 8.) for agri-food firms’ export
strategy analysis

STRATEGY AND PERFORMANCE OF AGRI-FOOD EXPORTERS 87
Next, we examined the scores given for the export performance of the
companies for the past 3 years <Table 4-9> and the degree of satisfaction
level <Table 4-10>. The levels were evaluated with the Likert 5-point scale
and then converted to a 100-point system. The degree of satisfaction was
approximately 58 points, and it was evaluated relatively high given the per-
spective of growth rate of export. Specifically, it was found that the fresh
exporters (A) displayed a relatively higher export performance evaluation
and satisfaction level than the processed exporters (B1, B2, C). On the oth-
er hand, the processed product exporters answered ‘very low’ for the mar-
ket share whose score is higher than the average of evaluated companies.
<Table 4-9> Export performance evaluation of agri-food exporters
unit: %, point
subject very low low average high very highexport
performance
Entirety
export yield 5.4 21.8 47.6 22.8 2.4 59.0
market share 9.6 24.6 41.2 21.8 2.8 56.7
growth rate of export 6.4 21.4 40.8 28.0 3.4 60.1
By type
A
export yield 5.4 18.6 48.1 26.4 1.6 60.0
market share 4.7 20.2 42.6 29.5 3.1 61.2
growth rate of export 6.2 16.3 36.4 38.8 2.3 62.9
B1
export yield 5.8 20.0 46.7 25.0 2.5 59.7
market share 11.7 25.0 41.7 20.0 1.7 55.0
growth rate of export 5.8 24.2 40.0 26.7 3.3 59.5
B2
export yield 5.7 22.0 44.7 24.1 3.6 59.6
market share 11.4 28.4 36.9 21.3 2.1 54.9
growth rate of export 7.8 19.2 43.3 24.8 5.0 60.0
C
export yield 4.6 27.3 51.8 14.6 1.8 56.4
market share 10.9 24.6 44.6 15.5 4.6 55.6
growth rate of export 5.5 27.3 43.6 20.9 2.7 57.6
Note 1) A-fresh agricultural products exporters, B1-small scale processed agri-food exporters,
B2-Medium-size exporters for processed agri-food, C-Consigned production exporters for
processed agri-food.
2) The export performance is evaluated with the Likert’s 5-point scale (1=very low, 5=very
high) criteria then converted to 100-point system.
Source: The author generated based on the corporate surveys (2018. 8.) for agri-food firms’ export
strategy analysis

88 STRATEGY AND PERFORMANCE OF AGRI-FOOD EXPORTERS
<Table 4-10> Degree of satisfaction on export evaluation of agri-food exporters
unit: %, point
subject very low low average high very high
Degree of
satisfaction
on export
Entirety
export yield 5.6 23.0 46.6 20.8 4.0 58.9
market share 9.0 24.2 43.6 19.8 3.4 56.9
growth rate of export 7.2 19.8 42.0 28.0 3.0 60.0
By type
A
export yield 6.2 20.9 45.7 24.8 2.3 59.2
market share 5.4 17.1 48.8 24.8 3.9 60.9
growth rate of export 7.0 13.2 40.3 37.2 2.3 63.0
B1
export yield 5.8 20.8 47.5 22.5 3.3 59.3
market share 9.2 24.2 45.0 19.2 2.5 56.3
growth rate of export 5.8 22.5 45.0 23.3 3.3 59.2
B2
export yield 6.4 22.0 44.0 19.9 7.8 60.1
market share 11.4 27.0 39.0 20.6 2.1 55.0
growth rate of export 8.5 19.2 42.6 27.0 2.8 59.3
C
export yield 3.6 29.1 50.0 15.5 1.8 56.5
market share 10.0 29.1 41.8 13.6 5.5 55.1
growth rate of export 7.3 25.5 40.0 23.6 3.6 58.2
Note 1) A-fresh agricultural products exporters, B1-small scale processed agri-food exporters,
B2-Medium-size exporters for processed agri-food, C-Consigned production exporters for
processed agri-food
2) Degree of satisfaction on export was evaluated with the Likert 5-point scale (1=very low,
5=very high), then converted to 100-point system.
Source: The author generated based on the corporate surveys (2018. 8.) for agri-food firms’ export
strategy analysis
1.3. Experience in participating in export support programs by agri-food exporters
The efficacy or satisfaction level on the experience in participating in ex-
port support programs by agri-food exporters was evaluated and the level
of participation was examined. The efficacy and satisfaction level were
evaluated with the Likert 5-point scale and then converted to 100-point
system. The level of participation was measured by the ratio of the number

STRATEGY AND PERFORMANCE OF AGRI-FOOD EXPORTERS 89
of exporters participating in export support programs over the total of sur-
vey participants.
The results of the survey on the level of agri-food exporters’ participation
in export support programs are as follows. It was found that the entirety
and processed agri-food exporters had a relatively high level of partic-
ipation in the following support programs: local government’s export sup-
port programs, participation in international exhibitions, KOTRA export
support programs, SMBA’s enhancement of export competences, SMBA’s
support of SME’s acquiring overseas standards certifications, overseas cer-
tification registration, export conference for inviting buyers, and export lo-
gistics cost support. However the viewed efficacy or satisfaction level for
local government’s export support programs, KOTRA export support pro-
grams, SMBA’s enhancement of export competences, SMBA’s support of
SME’s acquiring overseas standards certifications, and so forth are rela-
tively low compared to the relevant level of participation. It was also found
that the level of participation for the fresh agricultural products exporters
is high in order of export logistics cost support, local government’s export
support programs, support for participating international exhibitions, export
conference for inviting buyers, and export specialized complex arrangement
training.
<Table 4-11> Level of participation for export support programs by agri-food
exporters
by type agri-food firms
export support programsEntirety A B1 B2 C
① support for participating international exhibitions 45.8 36.4 57.5 51.8 36.4
② export conference for inviting buyers 33.4 27.1 40.8 41.1 22.7
③ support for setting up overseas antenna shops 4.0 1.6 6.7 6.4 0.9
④ frontier for market diversification 11.6 7.8 12.5 14.2 11.8
⑤ K-Food Fair 18.2 12.4 22.5 19.9 18.2
⑥ support overseas promotion events 19.2 24.8 18.3 18.4 14.5
⑦ promote strategic items for export to China 5.2 0.8 7.5 9.2 2.7
⑧ mobile application for matching buyers 4.8 3.1 5.8 7.8 1.8
⑨ promote integrated export organization 8.0 20.2 3.3 4.3 3.6

90 STRATEGY AND PERFORMANCE OF AGRI-FOOD EXPORTERS
(continue)
by type agri-food firms
export support programsEntirety A B1 B2 C
⑩ promote infra for export leading organizations 7.2 20.9 1.7 2.8 2.7
⑪ support export merchandising 15.0 14.7 11.7 20.6 11.8
⑫ support promotion to grow global brand 5.0 5.4 4.2 6.4 3.6
⑬ collaboration marketing with stars for agri-food 1.6 0.8 1.7 2.8 0.9
⑭ export logistics cost support 37.4 66.7 28.3 29.1 23.6
⑮ activate joint air logistics 7.2 10.9 2.5 7.1 8.2
⑯ overseas joint logistics center 1.2 0.8 0.8 2.1 0.9
⑰ Establishing cold-chain in China 1.0 0.0 1.7 2.1 0.0
⑱ support utilization of FTA preferential tariff 9.4 10.1 9.2 10.6 7.3
⑲ support customs clearance and logistics for sample 9.8 5.4 8.3 13.5 11.8
⑳ support export insurance 21.8 23.3 23.3 22.0 18.2
㉑ support overseas certification registration 32.0 17.1 40.8 44.0 24.5
㉒ export specialized complex arrangement training 9.0 26.4 3.3 2.8 2.7
㉓ support test expense for pesticide residue 9.0 24.8 1.7 5.7 2.7
㉔ Support test expense for food hygiene 5.0 7.8 4.2 5.0 2.7
㉕ support freshness preservation system 5.2 14.0 0.8 3.5 1.8
㉖ Information on agricultural and fishery products (KATI) 10.0 13.2 10.0 10.6 5.5
㉗ support consulting on expanding export 15.6 18.6 18.3 13.5 11.8
㉘ support localization 15.2 11.6 18.3 19.1 10.9
㉙ Enhancing SME’s export competences (SMBA) 38.0 20.2 37.5 46.8 48.2
㉚ Support SME’s acquiring overseas standards
certifications (SMBA)33.2 17.1 30.0 41.8 44.5
㉛ KOTRA export support programs 42.0 24.0 39.2 51.1 54.5
㉜ local government’s export support programs 48.4 44.2 46.7 54.6 47.3
Max 48.4 66.7 57.5 54.6 54.5
Min 1.0 0.0 0.8 2.1 0.0
Note: The level of participation was measured by the ratio that the number of exporters
participating in export support programs on the total of survey subject agri-food exporters.
Source: The author generated based on the corporate surveys (2018. 8.) for agri-food firms’ export
strategy analysis
Next we surveyed which programs need to be expanded from the per-
spective of export support programs’ importance. All the agri-food ex-
porters answered that the support for participating international exhibitions

STRATEGY AND PERFORMANCE OF AGRI-FOOD EXPORTERS 91
(1st choice 97 companies, 1st+2nd choice 132 companies, 1st+2nd+3rd choice
185 companies), export logistics cost support (1st choice 56 companies,
1st+2nd choice 97 companies, 1st+2nd+3rd choice 153companies), and export
conference for inviting buyers (1st choice 31companies, 1st+2nd choice 77
companies, 1st+2nd+3rd choice 99 companies) were important in this in
order.
<Figure 4-1> Survey results for expansion wanted export support programs
unit: number of companies
Source: The author generated based on the corporate surveys (2018. 8.) for agri-food firms’ export
strategy analysis
1.4. Evaluation of a CEO’s export expertise for agri-food export companies
A CEO’s expertise in global management can grow a company to be an
exporter by enhancing the efficiency and concentration of exports, and
working together with the export organization's competencies. Each CEO’s
expertise in exports was evaluated by the level of understanding of the ex-
port item’s export market performance and local markets, expertise in the

92 STRATEGY AND PERFORMANCE OF AGRI-FOOD EXPORTERS
export process, acknowledgement of establishing strong relationships with
buyers, and the ability to respond swiftly and accurately to an export crisis.
We found that Type C companies, which are consigned production ex-
porters for processed agri-food, scored the highest with the answer of
‘know well’ on all the expertise items implying that CEOs of Type C com-
panies have the highest expertise. The second highest was from Type A
companies, which export only fresh produce, followed by type B2, which
directly produce and export processed agri-food, and Type B1 in that order.
These results suggest that the CEOs from medium-size exporters (Type B2)
have relatively higher expertise than those from small-scale exporters (Type
B1).
The success of consigned production exporters for processed agri-food
(Type C) relies more on export performance than production since they are
export specialized companies. Therefore, CEOs of Type C companies have
relatively higher expertise than the other company types. Since Type B1
and B2 companies include companies that directly produce goods but are
not directly involved in exports, their CEO’s level of expertise on average
was evaluated relatively low.
<Table 4-12> Evaluation on CEO’s expertise of agri-food exporters
unit: %
expertisecorporate
typeknow nothing
know almost
nothingaverage know well
know very
wellTotal
Understanding
export
marketability
A 0.0 2.3 25.6 31.0 41.1 100.0
B1 1.7 2.5 38.3 40.8 16.7 100.0
B2 0.7 2.1 30.5 40.4 26.2 100.0
C 0.9 0.9 20.9 41.8 35.5 100.0
export works
A 0.0 4.7 34.9 24.8 35.7 100.0
B1 1.7 12.5 40.8 30.8 14.2 100.0
B2 1.4 4.3 43.3 29.1 22.0 100.0
C 1.8 1.8 29.1 35.5 31.8 100.0
Understanding
local market
A 1.6 4.7 33.3 25.6 34.9 100.0
B1 5.8 12.5 35.8 35.8 10.0 100.0
B2 2.1 6.4 34.0 34.8 22.7 100.0
C 0.9 3.6 25.5 30.9 39.1 100.0

STRATEGY AND PERFORMANCE OF AGRI-FOOD EXPORTERS 93
(Continued)
expertisecorporate
typeknow nothing
know almost
nothingaverage know well
know very
wellTotal
Maintaining the
relationship with
buyers
A 0.8 6.2 28.7 30.2 34.1 100.0
B1 4.2 5.0 39.2 33.3 18.3 100.0
B2 1.4 7.1 33.3 34.0 24.1 100.0
C 0.9 3.6 20.9 33.6 40.9 100.0
ability to respond
to export crisis
A 0.0 9.3 30.2 26.4 34.1 100.0
B1 5.0 10.0 43.3 32.5 9.2 100.0
B2 1.4 7.8 39.0 31.9 19.9 100.0
C 1.8 0.9 33.6 30.9 32.7 100.0
Note: A-fresh agricultural products exporters, B1-small scale processed agri-food exporters,
B2-Medium-size exporters for processed agri-food, C-Consigned production exporters for
processed agri-food.
Source: The author generated based on the corporate surveys (2018. 8.) for agri-food firms’ export
strategy analysis
2. Export strategy analysis for agri-food firms
2.1. Analysis summary and methods
In this section we analyze the relationship between agri-food firms’ ex-
port strategies and their export performance. Cavusgil and Zou (1994),
Shoham (1998), Zou and Stan (1998), and Carneiro et al. (2016) are repre-
sentative studies on a company’s export performance. According to these
studies, export value, export intensity, export profitability, growth rate of
export, export sustainability (survival), and a company’s subjective sat-
isfaction level can all be considered part of export performance. Among
these factors, the export intensity is most used universally, but various other
indexes 27 are also used in this study since the industry types of the compa-
27 Sousa(2004) organized 43 performance indexes used in the studies on the export
performance, while the level of export concentration was most frequently used in

94 STRATEGY AND PERFORMANCE OF AGRI-FOOD EXPORTERS
nies included in the data are heterogeneous.28
In this study, the export value from Cavusgil and Zou (1994), de Matteis
et al. (2016), and Wagner (1995), the export intensity used in Sterlacchini
(2001) and Wagner (2006), the export growth rate used in Cooper and
Kleinschmidt (1985), the export sustainability used in Fugazza and Molina
(2009) and Fu and Wu (2014) were all used for the indexes of export
performance.
The data from the ‘agri-food exporters survey’ and aT ‘export support
programs performance’ were utilized. First, the factors having effects on the
export value, export intensity, and market diversification were examined.
Then the export growth rate and export sustainability of company’s export
routes by unit were analyzed by combining the survey and the export sup-
port programs performance data.
2.2. Distinguishing effective export strategies (survey)
First, the Quasi-maximum likelihood estimation was used for the analysis
of the survey, and then the conditional average was estimated as in the for-
mula (15).
(15)
here means the export performance index, is an explanatory variable,
and represents an estimated coefficient. The above conditional average
was estimated by selecting proper function as per the manner of de-
pendent variables. As the indexes of export performance, agri-food export
value ( ) per employee, export intensity ( ), and the number of export
countries ( ) were used. Since the export intensity has a value between
the studies 16 times.28 The industry types included in the data were agriculture, manufacturing, and
wholesale and retail industry.

STRATEGY AND PERFORMANCE OF AGRI-FOOD EXPORTERS 95
0 and 1, the Probit function ( ) was used. The export per capita and
market diversification index (number of export countries) does not have a
negative value but a positive whole number value, thus the function
( ) was used. According to Wooldridge (2010: 727-732) and Santos
Silva and Tenreyro (2010) by applying the robustness covariance matrix to
the generalized linear model, the export intensity was estimated by
Quasi-maximum likelihood estimation (QMLE) using the Probit model.
Then the export value and export countries were estimated by the Poisson’s
QMLE.29
<Table 4-13> basic statistics for surveyed companies (N=500)
Average Standard deviation Minimum value Maximum value
export intensity 0.22 (0.29) 0.00 0.96
export value per capita(thousand US$) 225.32 (710.92) 0.00 6996.12
# of export countries 3.52 (8.78) 0.33 23.33
# of employees 68.79 (315.87) 1.00 445.50
# of years for biz 16.73 (13.60) 2.00 73.00
# of the years of export experience 9.35 (8.24) 2.00 59.00
# of participated export support programs 5.29 (3.97) 0.00 32.00
Source: The author generated based on the corporate surveys (2018. 8.) for agri-food firms’ export
strategy analysis
First, it was found that the years of export experience have a positive (+)
correlation for all performance indexes and at 10% significance level. In
other words, export performance increased as the years of export experience
increased. But the number of employees (scale) did show a negative (-) cor-
relation with export value and export intensity. This may be related to the
tendency for increased turnover as the corporate scale gets bigger. In other
words, this can be interpreted that the turnover increase as per the relevant
scale would be bigger than the increase in export value. On the other hand,
29 The method such as the negative binomial regression has a demerit that a co-
efficient changes as per the scale of dependent variables, and has discorded esti-
mator if it does not satisfy with additional assumptions compared to the Poisson’s
QMLE.

96 STRATEGY AND PERFORMANCE OF AGRI-FOOD EXPORTERS
the analysis showed that the number of export countries did have a ten-
dency to increase as the number of employees increased.
The extent of a company’s participation in government, institutions, local
government’s export support programs was used as a proxy variable for
positivity towards export. Our analysis showed that an increase in the num-
ber of participated support programs did have a positive (+) correlation
with the export value and the number of export countries, thus implying
that the export value per capita and number of export countries would in-
crease as the company’s positivity towards export increases.30
Next, the relationship between export strategy and export performance of
a company was examined. The strategies that had statistically significant
positive (+) effects on the increase of export value per capita were 3
(Pursuing functionality), 38 (utilization of co-brand), 53 (Securing stable
export volume), and 54 (export insurance). It seems that emphasizing the
functionality of a product was a natural result, as the demands for increased
functionality in products is a recent big trend in the overseas markets. In
addition, it seems that utilization of a co-brand had positive effects on the
increase in export owing to increased market awareness. The results that
factors such as securing export volume, export insurance, and FX risk man-
agement had significant positive (+) relations with an increase in export
value coincided with expectations, because they are the strategies that di-
rectly correspond to the risk of export value loss. On the other hand, the
analysis showed that the following strategies including 6 (customized pro-
duction), 13 (overseas Korean focused), 29 (quality management system),
35 (safety, hygiene test system), 39 (field survey for market penetration),
and 40 (securing buyers in exhibitions) would decrease the export value per
capita. In other words, the strategies for the specific target consumers such
as overseas Koreans or customized production may not be effective for ex-
panding the scale of export value per capita.
30 The number of participation in export support programs did not show clear correla-
tion with the number employees or the scale of turnover as the Pearson’s correla-
tion coefficient being below 0.05.

STRATEGY AND PERFORMANCE OF AGRI-FOOD EXPORTERS 97
<Table 4-14> Analysis results for effects of company’s export strategies on the
agri-food export performance
dependent variables: performance index (1) (2) (3)
Export value export intensitynumber of export
countries
Estimated
coefficient
Estimated
coefficient
Estimated
coefficient
ln(Experience in export) 0.44 a 0.38 a 0.58 a
ln(# of employees) -0.81 a -0.13 a 0.15 a
# of participation for export support programs 0.05 c 0.01 0.04 b
s1: Enhancing competitiveness of production cost -0.45 0.02 -0.37 b
s3: Pursuing product functionality 0.52 b 0.06 -0.03
s6: Custom made production or make-to-order -0.61 b 0.07 0.36 b
s7: Focusing on main export product(item) -0.10 -0.01 0.34 b
s10: Targeting niche markets 0.20 -0.09 0.24
s13: Targeting overseas Koreans -0.49 b -0.18 c -0.20
s15: Overseas market diversification is important -0.30 -0.18 c 0.21 c
s28: Operating brand management dept. -0.36 -0.14 0.50 a
s29: Establishing system for product quality
management -0.70 b -0.11 -0.08
s33: Monitoring post management of export
market0.27 0.31 a -0.33 c
s34: Acquiring certifications -0.19 -0.24 b -0.06
s35: Establishing system for dealing with food
safety and sanitary inspection-0.48 c -0.28 a -0.21
s36: Labeling product info in local language 0.20 0.19 c 0.36 a
s38: Utilizing joint/alliance/nation’s brands 0.94 a 0.29 b -0.32
s39: Conducting field surveys when entering into
new overseas markets -0.73 a -0.21 c 0.28 c
s40: Securing local buyers by export consultation
via exhibitions -0.69 a -0.05 0.08
s43: Conducting own local market advertisement
and PR-0.08 0.12 0.28
s47: Liaising/collaborating with local distributors 0.05 0.23 b 0.08
s49: Utilizing air transport 0.07 0.28 c -0.10
s50: Establishing cold-chain system for export
logistics0.18 0.08 -0.15

98 STRATEGY AND PERFORMANCE OF AGRI-FOOD EXPORTERS
(Continued)
dependent variables: performance index (1) (2) (3)
Export value export intensitynumber of export
countries
Estimated
coefficient
Estimated
coefficient
Estimated
coefficient
s53: Securing stable export volume 0.84 a 0.14 0.05
s54: export insurance 0.58 a 0.21 b 0.13
s56: FX risk management 0.59 b 0.13 0.24
s57: R&D investments -0.20 -0.12 0.29 b
s62: Establishing and managing mid & long-term
export plans0.42 -0.16 -0.12
s65: Training export personnel 0.15 -0.29 a -0.07
Constant term 5.86 a -0.99 a -1.64 a
Observed value 488 488 492
Note: The standard errors used the robust standard errors, and each a, b, c means the significance
level of 1%, 5%, and 10% respectively.
Source: Author generated.
The strategies that had positive (+) correlations with export intensity in-
cluded 33 (monitoring and post management), 36 (Labeling in local lan-
guages), 38 (utilization of co-brand), 47 (local distribution collaboration),
49 (Utilizing air transport), and 54 (export insurance). In other words, ex-
port intensity may be increased if a company increases the consumer’s
product awareness in the import country markets by labeling product in-
formation in local languages, utilization of co-brands, and managing time
delays in logistics stages through local distribution collaborations and air
shipment. In addition, continuous post management and using export in-
surance would be efficient for improving export intensity by coping with
unexpected export environmental changes. On the other hand, strategies in-
cluding 13 (Targeting overseas Koreans), 15 (overseas market diversifica-
tion), 34(Acquiring certifications), 35 (safety, hygiene test system), 39
(field survey for market penetration), and 65 (Training export personnel)
showed negative (-) relations with the export intensity.
The strategies that had a positive (+) relationship with the market diversi-
fication (number of export countries) index include: 6 (customized pro-

STRATEGY AND PERFORMANCE OF AGRI-FOOD EXPORTERS 99
duction), 7 (Focusing on main items), 15 (overseas market diversification
is important), 28 (dedicated brand management dept.), 36 (Labeling in local
languages), 39 (field survey for market penetration), and 57 (R&D invest-
ments). It was found that the strategies for products and markets in general
have effects on expanding the number of export destination countries. The
preferences and criteria for agri-food by import country vary from the hy-
giene standpoint. Therefore, it would be efficient that a company pursues
after production activities reflecting the demands and criteria of the import
countries. Then continue to apply the criteria of the various countries while
still focusing on the previous major items and penetration strategy. On the
other hand, it was analyzed that 1 (enhancing production cost competitive-
ness) and 33 (export market monitoring) have negative (-) relations with the
market diversification.
In the analysis of the entire company sample, the conclusion drawn was
that the relations between strategies and performances showed different ef-
fects depending upon the type of performance while some strategies would
have negative effects on export performance. The strategies focused on
management of export risks and increased market awareness of product
were generally efficient for improving the performance if export value and
export intensity were used as the performance indexes. Especially, the risk
management strategies for export value loss had statistically significant pos-
itive (+) relations with the export value increase. Similarly, the strategies
regarding logistics or distribution had statistically significant relationships
with the improvement of export intensity. On the other hand, the strategies
that come with the burden of high costs such as investment strategies, fa-
cilities or system development from the mid & long-term perspective, and
targeting specific consumers such as overseas Koreans would have negative
(-) effects on export value and export intensity in the short-term so it is ad-
vised to pay more attention and be critical when selecting a strategy.
Nonetheless, it was also found that the strategies (focusing on major
products, operating dedicated brand management dept. and field survey, and
R&D investments) that do not have significant effects or negative (-) ef-
fects on the export value or export intensity would have positive (+) rela-
tions with the expanding export countries.

100 STRATEGY AND PERFORMANCE OF AGRI-FOOD EXPORTERS
2.3. Identifying effective export strategies (combining surveys and export support
performances)
The export performance by country and item was previously determined
for each year using aT's logistics cost support performance data, but the
company characteristics or management strategies cannot be identified using
this data. Conversely, information on the detailed export performances of
the agri-food firms would be difficult to obtain using surveys, but qual-
itative information such as export related decision making or strategy, and
the participation method in the supply chain including produce, process and
export can be obtained by survey. By combining two different sets of data
together, more precise evaluation of the factors and strategies that have ef-
fects on the export performances of company is possible. Therefore, effec-
tive export strategies were analyzed in depth by combining the performance
data for logistics cost support and the surveys in this paragraph.
From the 2005~2017 performance data for logistics cost support a total
of 159 companies were identified which had answered the surveys of 762
companies with concrete export performance31. In order to combine the lo-
gistics cost performance data and the survey data, the formats of the two
data sets were reconciled. Since the former is time series data, and the lat-
ter is cross-sectional data, the export performance data for support costs
was converted to cross-sectional data. For the conversion, ① the export sus-
tainability period (the number of years) and ② the rate of increase for an-
nual average export value for the continuing period by company, which are
the variables for export performance of the company, were calculated using
the performance data for logistics cost support. However, two kinds of sam-
ple data were established by distinguishing the export performance varia-
bles with export market area and product item rather than merging it as one
figure. In order to establish the data by area and item, we categorized the
most recent period being maintained for individual export routes after ag-
gregating export routes into 6 areas and 11 item groups by year of compa-
nies from the performance data of logistics cost support. Then each of the
31 The time series based support performance for export logistics costs.

STRATEGY AND PERFORMANCE OF AGRI-FOOD EXPORTERS 101
observed values were defined as ‘continuing export routes by area’ and
‘continuing export routes by item. The observed values for 2 kinds of in-
dividual continuing export routes have variables such as: annual average ex-
port growth rate ( ), years of continuing export ( ), average export
value ( ), average unit cost for export ( ), number of export routes
creation (re-entry) ( ), total year of export ( ), the 1st year’s export
value for the export routes ( ), rate of average export ( ), whether
cut in the left side (whether created in 2005) ( ), and cut in the right
side (whether created in 2017) ( ) for the relevant period. The final
empirical analysis samples were established by connecting the observed
values of these two kinds of data regarding continuing export routes to the
survey answers from the 159 companies. The main factor variables for ex-
port performance were whether to select company’s export decision-making
and detailed strategies identified in the surveys. <Table 4-14> and <Table
4-15> illustrate the 670 samples for continuing export routes by area, and
the distribution of creation/stop by year for the 275 samples by item.
<Table 4-15> Continuing export routes distribution by area for 159
agri-food firms
By area 2005 2006 2007 2008 2009 2010 2011 2012 2013 2014 2015 2016 2017 Total
2005 2 4 1 3 1 3 4 46 64
2006 3 1 1 1 10 16
2007 4 1 6 1 2 2 6 22
2008 3 1 4 1 1 12 22
2009 4 8 2 2 21 37
2010 7 3 1 2 22 35
2011 12 6 5 1 4 1 38 67
2012 13 2 2 4 4 30 55
2013 5 6 2 11 30 54
2014 8 7 8 31 54
2015 9 11 40 60
2016 42 70 112
2017 72 72
Total 2 7 5 2 7 26 22 22 18 19 27 85 428 670
Note: vertical axis implies the time at the creation of export routes whereas the horizontal axis
implies the time at the stop of export routes.
Source: Author generated.

102 STRATEGY AND PERFORMANCE OF AGRI-FOOD EXPORTERS
<Table 4-16> Continuing export routes distribution by item of 159
agri-food firms
By
item2005 2006 2007 2008 2009 2010 2011 2012 2013 2014 2015 2016 2017 Total
2005 3 2 4 1 1 27 38
2006 1 1 2 7 11
2007 3 1 3 1 1 2 2 13
2008 2 3 4 3 7 19
2009 1 6 1 8 16
2010 11 2 9 22
2011 2 2 2 17 23
2012 6 1 2 1 7 17
2013 1 1 1 9 12
2014 2 1 9 12
2015 8 2 10 20
2016 8 46 54
2017 18 18
Total 3 3 3 4 4 30 8 9 4 5 11 15 176 275
Note: vertical axis implies the time at the creation of export routes whereas the horizontal axis
implies the time at the stop of export routes.
Source: Author generated.
2.3.1. Export strategy and increase in export
In order to analyze how the export strategy that a company selects effects
export increase, a coefficient was determined by establishing an estimate
equation like the formula (16) and applying the LSDV (least-squares dum-
my variables).
(16)

STRATEGY AND PERFORMANCE OF AGRI-FOOD EXPORTERS 103
is the rate of increase for annual average export value during the
period that a company continuously exists in the area for the period.
Each and respectively represents that average export value and
average unit cost for export by the company. shows the number of ex-
port routes creation (re-entry) of the company, while and each
respectively mean the total number of export years, and the initial value for
export. is the average value accounting for the aggregate value of
export logistics cost support received by company from the export value
(average subsidy ratio for export). is the average value for the num-
ber of times a company participated in export support programs for the pe-
riod which the relevant export routes are maintained while the non-linear
relationship between the variable of the quadratic term ( ) and export
performance was also examined. means the cut in the left side
dummy whereas means the cut in the right side dummy. From
to are the dummy variables representing various export strategy factors
where the value would be 0 or 1 if the relevant strategy factor was selected
in the survey. is a dummy variable for area or item group while is
a dummy variable for a company.
The second row of <Table 4-16> shows the results of the above equa-
tion’s estimate on the integrated export routes samples by area. The third
row is the estimation results on the integrated export routes samples by
item group. By considering that the coefficients of each strategy factor in
the two estimation results are statistically significant, the strategies that
have positive effects on export increase were: ① Focus on major export
products, ② export after product purchase, ③ Utilization of FTA prefer-
ential tariff, and ④ stable securing export volume. The factors that have
negative effects on export increase were: ① enhancing production cost
competitiveness, ② custom made production (make-to-order), ③ procuring
raw materials from the market or contract farming, and ④ operating dedi-
cated department for brand or design. In addition, there was no strategy that
had conflicted effects on export increase by item and area.
104 STRATEGY AND PERFORMANCE OF AGRI-FOOD EXPORTERS
<Table 4-17> export growth rate and company’s export strategies
Variable
dependent variables: annual average export growth rate(LSDV)
Data integrated export routes by
area
Data integrated export routes by
item
Estimate Prediction error Estimate Prediction error
ln(Average export value) 6.101 4.912 -143.579 272.482
ln(Average unit cost for export) 20.408 11.636 719.025 515.545
Number of export routes creation(re-entry) 19.043 27.682 232.185 315.279
Total number of export 5.614 2.128 45.267 117.342
ln(initial export value) -15.222 3.916 -932.218 338.015
Average subsidy ratio for export 2.406 3.497 29.022 53.828
the number of participation in export
support programs16.831 17.398 -196.824 235.508
(the number of participation in export
support programs)2 -0.645 0.649 7.265 13.126
cut in the left side dummy(criteria: 2005) -24.103 24.455 1190.667 968.185
cut in the right side dummy(criteria: 2017) 30.111 4.929 1041.406 506.239
s1: Enhancing competitiveness of
production cost -77.634 20.965 -445.231 410.649
s3: Pursuing product functionality -25.122 25.780 -1947.73 1856.071
s6: Custom made production or
make-to-order-1.587 34.143 -1183.100 336.605
s7: Focusing on main export product(item) 89.207 43.753 562.408 1104.053
s10: Targeting niche markets 45.678 42.572 -1474.220 1409.705
s13: Targeting overseas Koreans 22.359 55.846 -470.672 820.754
s15: Overseas market diversification is
important8.097 9.588 730.599 876.651
s18: partial process such as processing,
merchandizing , or logistics consigned-25.616 29.032 462.197 919.513
s19: export consigned to export agency -48.791 33.801 672.796 1215.133
s21: Export after product purchase 55.302 18.628 1665.966 1021.887
s23: Procurement of raw materials (contract
farming, other than the domestic
market)
-35.777 12.768 -2043.850 1136.437
s26: Utilization of proof of origin and FTA
preferential tariff 81.465 50.558 1654.660 704.465
s28: Operating brand management dept. -26.367 13.057 -557.786 983.221

STRATEGY AND PERFORMANCE OF AGRI-FOOD EXPORTERS 105
(continue)
Variable
dependent variables: annual average export growth rate(LSDV)
Data integrated export routes by
area
Data integrated export routes by
item
Estimate Prediction error Estimate Prediction error
s29: Establishing system for product quality
management 65.667 38.388 -888.573 1070.801
s33: Monitoring post management of export
market-9.673 36.781 -1463.290 741.594
s34: Acquiring certifications 10.918 19.643 438.851 954.480
s35: Establishing system for dealing with
food safety and sanitary inspection-28.765 29.662 1005.976 1110.906
s36: Labeling product info in local language -9.280 23.227 446.526 764.864
s38: Utilizing joint/alliance/nation’s brands 10.458 23.673 -803.575 1223.235
s40: securing buyers and export
consultation, through exhibitions-90.393 18.783 169.378 451.502
s43: own advertisement and PR for local
market28.107 13.451 -902.765 841.767
s47: Liaising/collaborating with local
distributors-5.163 14.543 609.241 674.686
s49: Utilizing air transport -28.082 35.617 -2909.870 1667.486
s50: Establishing cold-chain system for
export logistics-14.403 21.431 363.438 821.334
s53: Securing stable export volume 8.405 24.235 2969.801 1424.333
s54: export insurance -8.719 38.102 1343.025 728.197
s56: FX risk management -35.049 20.561 -606.625 1097.564
s57: R&D investments 1.890 19.296 2416.073 1557.689
s62: Establishing and managing mid &
long-term export plans-84.205 42.594 -436.773 1485.927
s65: Training export personnel 0.484 29.715 -2371.31 1367.476
dummy variable Area, Firm Item group, companies
explanatory power =0.29 =0.70
number of samples 350 210
Note: Each a, b, c means the significance level of 1%, 5%, and 10% respectively.
Source: Author generated.

106 STRATEGY AND PERFORMANCE OF AGRI-FOOD EXPORTERS
2.3.2. Export strategy and export sustainability
The Heckman’s 2-step model was used to analyze how the export strat-
egy selected by a company affected its export sustainability. Export routes
stopped prior to 2017 and those routes still continuing were mixed in the
samples of analysis subjects. Thus, the factors that have effects on the years
of continuing export by conducting the cut regression analysis on the con-
tinuing export routes in the step 2 after estimating the factors having effects
on export stop and whether continued in step 1. The selection equation (if
continuing, , if stopped ) of step1 on whether export sustain-
ability for each export route ( ) to be maintained, and the re-
gression equation for the years of continuing export( ) of step2 is the for-
mula (17).
<step1> (17)
<step2>
here is the explanatory variable vector having effects on export sus-
tainability whereas is the explanatory variable vector having effects on
the years of continuing export. is the parameter of the Inverse Mill’s
Ratio( ) representing the bias of each export route obtained
by the step1 estimation results.32 The two error terms are independent from
the each of the explanatory variable vectors and follows the bivariate nor-
mal distribution while the variance ( ) of is assumed as 1. Under these
assumptions, the step1 of Heckman’s sample selection model was estimated
by Probit and the step2 was estimated by the least-squares method because
the selection of explanatory variable that connects the step1 and step2 is
important. In other words, an instrument variable having effects on whether
export stopped but not having effects on the years of continuing export was
32 Each are the standard normal probability density function and the stand-
ard normal probability cumulative density function as per the estimated results of
step1.

STRATEGY AND PERFORMANCE OF AGRI-FOOD EXPORTERS 107
necessary, while the step2 estimation results adjusted with the sample se-
lection bias could be obtained by estimating with inclusion of ( ) in-
duced by the step1 estimation result, which includes the above instrument
variable, when estimating step2.
In the empirical analysis, the independent variables previously used in ex-
port sustainability analysis were used as the instrument variables.33 The
second row of <Table 4-17> shows the results of the above equation’s esti-
mate on the integrated export routes samples by area. The third row of
<Table 4-17> shows the estimation results on the integrated export route
samples by item group. By considering that the coefficients of each strategy
factor in the two estimation results were statistically significant and their
directions were the same, the factors that have positive effects on export
sustainability were: ① targeting overseas Koreans, ② export consigned to
export agency, ③ obtaining certifications (GAP, HACCP, ISO, organic
farming, environment friendly), ④ exposition or exhibitions utilized con-
sultation and securing buyers, and ⑤ establishing and managing mid &
long-term export plan. Whereas the factors having negative effects on ex-
port sustainability were: ① establishing quality management system for
product standardization and uniformity, ② utilizing air transport, and ③
R&D investments. Nevertheless, there were no strategy factors that had
statistically conflicted effects on export sustainability.
33 In order to resolve the issue of multicollinearity, the variables, which shall be in-
cluded in the 1step estimate and excluded in the 2step estimate, were selected as
the average export unit price ( ), number of export route (re-entry) creation
( ), and the total number of years for export ( ). Whereas the variables that
shall be included in the 2step estimate and excluded in the 1step estimate were
the average export value ( ), the average number of participation in export
support programs ( ) and the quadratic term of this variable.

108 STRATEGY AND PERFORMANCE OF AGRI-FOOD EXPORTERS
<Table 4-18> Years of continuing export and company’s export strategies
Variable
dependent variables: years of continuing export(Heckman’s 2-step model)
integrated data for export routes by
area
step1(whether stopped)
step2(number of continuing years)
integrated data for export routes by
item group
step1(whether stopped)
step2(number of continuing years)
EstimatePrediction
errorEstimate
Prediction
errorEstimate
Prediction
errorEstimate
Predictio
n error
ln(Average export value) 0.806a 0.076 1.017a 0.211
ln(Average unit cost for export) -0.033 0.056 0.064 0.256
Number of export routes
creation(re-entry)-0.160 0.120 -0.808 0.556
total number of export years 0.263a 0.025 0.371b 0.124
ln(initial value for export) 0.035 0.027 -0.400a 0.087 0.056 0.118 -0.559a 0.198
Average subsidy ratio for export -0.045b 0.019 0.061c 0.032 -0.148 0.113 0.224a 0.065
The number of participation in
export support programs-0.075 0.121 -0.015 0.187
(The number of participation in
export support programs)2 0.006 0.006 0.004 0.011
cut in the left side
dummy(criteria:2005)-1.130a 0.320 6.162a 0.384 -1.680 1.026 5.995a 0.595
s1:Enhancing competitiveness of
production cost 0.308 0.226 -0.046 0.536 0.766c 0.463 -1.088c 0.603
s3:Pursuing product functionality -0.126 0.180 0.941b 0.438 -0.330 0.533 0.503 0.701
s6:Custom made production or
make-to-order0.029 0.230 -0.033 0.422 0.293 0.727 -0.489 0.643
s7:Focusing on main export
product(item)0.187 0.204 -0.170 0.446 -0.021 0.598 -0.453 0.552
s10:Targeting niche markets -0.446a 0.144 0.268 0.299 0.033 0.490 -0.322 0.437
s13:Targeting overseas Koreans -0.262 0.205 1.548a 0.384 -0.533 0.553 0.827c 0.487
s15:Overseas market
diversification is important0.332c 0.170 -0.277 0.322 0.316 0.502 -0.530 0.550
s18:partial process such as
processing, merchandizing ,
or logistics consigned
-0.311 0.205 1.336a 0.419 -0.441 0.561 0.784 0.616
s19:export consigned to export
agency-0.533c 0.272 2.499a 0.731 -1.527c 0.902 3.452a 1.014
s21:Export after product
purchase0.496b 0.214 -0.651c 0.346 0.563 0.506 -0.668 0.532

STRATEGY AND PERFORMANCE OF AGRI-FOOD EXPORTERS 109
(continue)
Variable
dependent variables: years of continuing export(Heckman’s 2-step model)
integrated data for export routes by
area
step1(whether stopped)
step2(number of continuing years)
integrated data for export routes by
item group
step1(whether stopped)
step2(number of continuing years)
EstimatePrediction
errorEstimate
Prediction
errorEstimate
Prediction
errorEstimate
Prediction
error
s23: Procurement of raw
materials(contract farming,
other than the domestic
market)
0.029 0.185 0.059 0.435 -0.308 0.635 0.765 0.513
s26: Utilization of proof of
origin, FTA preferential
tariff
-0.577b 0.251 0.834 0.681 -0.630 0.828 0.931 1.019
s28: Operating brand
management dept.-0.418b 0.200 -0.075 0.436 -0.840 1.146 0.618 0.785
s29: Establishing system for
product quality
management
0.280 0.200 -0.991a 0.353 0.389 0.582 -1.335b 0.523
s33: Monitoring post
management of export
market
0.218 0.152 -0.798b 0.348 -0.108 0.579 -0.362 0.539
s34: Acquiring certifications -0.657a 0.224 1.947a 0.455 -1.008 0.826 2.116a 0.616
s35: Establishing system for
dealing with food safety
and sanitary inspection
0.144 0.185 -0.370 0.381 0.456 0.613 -0.375 0.623
s36: Labeling product info in
local language0.094 0.231 0.229 0.384 0.106 0.625 -0.373 0.557
s38: Utilizing
joint/alliance/nation’s
brands
0.041 0.270 -0.538 0.483 0.702 1.032 -0.504 0.492
s40: securing buyers and export
consultation, through
exhibitions
-0.510b 0.217 1.090a 0.415 -0.769 0.582 1.697a 0.615
s43: own advertisement and PR
for local market0.141 0.162 0.148 0.287 0.399 0.689 -1.169b 0.528
s47: Liaising/collaborating with
local distributors0.409c 0.211 -0.835b 0.377 0.161 0.626 -0.062 0.573
s49: Utilizing air transport 0.905a 0.338 -1.550a 0.434 1.173 1.099 -1.126c 0.613

110 STRATEGY AND PERFORMANCE OF AGRI-FOOD EXPORTERS
(continue)
Variable
dependent variables: years of continuing export(Heckman’s 2-step model)
integrated data for export routes by
area
step1(whether stopped)
step2(number of continuing years)
integrated data for export routes by
item group
step1(whether stopped)
step2(number of continuing years)
EstimatePrediction
errorEstimate
Prediction
errorEstimate
Prediction
errorEstimate
Prediction
error
s50: Establishing export logistics
cold-chain system0.363 0.223 -0.864b 0.401 -0.135 0.782 -0.328 0.585
s53: Securing stable export
volume-0.477b 0.189 0.776b 0.371 -0.793 0.729 0.945 0.617
s54: export insurance -0.111 0.163 0.277 0.388 0.512 0.633 -0.498 0.427
s56: FX risk management -0.471b 0.189 0.474 0.481 -0.030 0.653 -0.104 0.488
s57: R&D investments 0.058 0.208 -1.440a 0.465 0.339 0.882 -1.309c 0.709
s62: Establishing and managing
mid & long-term export
plans
-0.346c 0.182 1.047a 0.395 -0.335 0.739 1.185b 0.541
s65: Training export personnel 0.296 0.194 -0.827b 0.362 0.032 0.689 0.335 0.581
(Inverse Mill’s ratio) -4.307a 0.360 -4.289a 0.808
dummy variable Area item group
explanatory power Wald =2,382 Wald =744
number of samples 668 (cut in the left side: 242) 273 (cut in the left side: 99)
= –1.0, =4.3 = –1.0, =4.3
Note: Each a, b, c means the significance level of 1%, 5%, and 10% respectively.
Source: Author generated.
3. Identifying effective export strategies for companies by type (survey)
The management activities or the manner of business operations by com-
panies would be very different as they select distinct export strategies for
purchase of raw materials, production, processing and distribution, and mar-
keting depending upon their handling of products. Case studies of excep-

STRATEGY AND PERFORMANCE OF AGRI-FOOD EXPORTERS 111
tional companies were conducted to complement the limitation of quantita-
tive analysis results and the results were utilized for interpretation. These
excellent companies were selected comprehensively based on export per-
formance (agri-food export value per capita, export intensity, number of ex-
port countries, and export sustainability), global competitiveness, and sub-
jective export performance evaluation results of the companies.
Before describing the results of the analysis, the basic statistics of the
variables for analysis of the companies by type are as shown in <Table
4-18>. The consigned production exporters for processed agri-food (Type
C) had the largest average number of employees, followed then by the me-
dium-size exporters for processed agri-food (Type B2), the fresh agricul-
tural products exporters (Type A), and finally the small scale processed ag-
ri-food exporters (Type B1) in that order. The fresh agricultural products
exporters and the small-scale direct production processed agri-food ex-
porters had a smaller average number of employees than the entire average.
The small-scale processed agri-food exporters (Type B1) had the shortest
average # of years for business with 10.6 years whereas each the me-
dium-size exporters for processed agri-food (Type B2) and the fresh agri-
cultural products exporters (Type A) average # of years for biz were long
at 19.8 years and 18.5 years, respectively. The Type A exporters had the
longest years of export then Type B2, followed by Type C in that order.
The number of years for export of Type B1 was on average of 5.7 years,
making it 40~50% lower than that of the other types.
The fresh agricultural products exporters (Type A) had an average of ap-
proximately KRW 400 million of export value per employee, making it
higher than the rest of the group’s averages. The medium-size exporters for
processed agri-food (Type B2) had the largest number of export countries,
followed by Type C, A, and B1 in that order.
Contrary to the expectation that the small-scale processed agri-food ex-
porters (Type B1) had the most export intensity, it was the fresh agricul-
tural products exporters (Type A) who had the highest export intensity.
They were then followed by Type C, B2, and B1 in that order. Type B2
had the highest participation in export support programs with an average of
5.9, followed by Type A, B1, and C in that order.
The Type B1 companies had the shortest years of export on average and

112 STRATEGY AND PERFORMANCE OF AGRI-FOOD EXPORTERS
the lowest market diversification index (number of export countries) and
export intensity. They had higher export value per capita than the Type B2
but were lower than the other types.
<Table 4-19> basic statistics for companies by type
A B1 B2 C
Average
(Standard deviation)
Average
(Standard deviation)
Average
(Standard deviation)
Average
(Standard deviation)
export intensity 0.43 (0.35) 0.09 (0.15) 0.15 (0.22) 0.20 (0.26)
export value per capita
(thousand US$)570.99 (1142.25) 131.84 (555.32) 38.28 (103.88) 169.22 (503.58)
# of export countries 2.83 (3.35) 1.79 (1.71) 4.87 (13.83) 4.50 (9.20)
# of employees 21.43 (47.09) 5.83 (2.61) 122.24 (390.51) 124.50 (494.39)
# of years for biz 18.53 (15.05) 10.59 (7.15) 19.82 (13.73) 17.35 (14.98)
# of years in export
experience10.80 (7.10) 5.74 (4.79) 10.62 (9.26) 9.96 (9.88)
# of participation in
export support programs5.32 (3.71) 5.19 (3.78) 5.91 (4.73) 4.59 (3.26)
# of companies within the
type129 120 141 110
Note: A-fresh agricultural products exporters, B1-small scale processed agri-food exporters,
B2-Medium-size exporters for processed agri-food, C-Consigned production exporters for
processed agri-food.
Source: Author generated.
Next, we examined which operative strategies were better for improving
export performance by comprehensively assessing the analysis results, the
survey answer data, and the interviews with the companies.
3.1. Fresh agricultural products exporters (Type A)
The companies which were classified as fresh agricultural products export
companies (Type A) included NH (Unit of agricultural cooperatives), agri-
culture incorporated companies, agricultural association corporations, dedi-
cated horticultural production complex, and fresh agricultural products spe-

STRATEGY AND PERFORMANCE OF AGRI-FOOD EXPORTERS 113
cialized trade agencies. The major export item classes included fruits, vege-
tables, and mushrooms while the representative export items were pear,
strawberry, paprika, and king oyster mushroom.
<Table 4-20> Strategy factors for fresh agricultural products exporters(Type A)’s
performance index
fresh agricultural products exporters(Type A) (1) (2) (3)
export value
per capitaexport intensity
market
diversification
Estimated
coefficient
Estimated
coefficient
Estimated
coefficient
ln(Experience in export) 0.48 cc 0.46 a 0.31 a
ln(# of employees) -0.95 a -0.12 c 0.17 b
# of participation for export support programs 0.07 b 0.03 0.02
s1: Enhancing competitiveness of production cost -0.44 -0.15 -0.14
s3: Pursuing product functionality 0.62 c 0.53 b 0.10
s6: Custom made production or make-to-order -0.39 b 0.03 -0.15
s7: Focusing on main export product(item) 0.37 0.08 0.55 a
s10: Targeting niche markets -0.01 -0.02 -0.22
s13: Targeting overseas Koreans -0.41 -0.19 0.23
s15: Overseas market diversification is important -0.73 a -0.61 a 0.20
s28: Operating brand management dept. -0.01 -0.08 0.35 c
s29: Establishing system for product quality management -0.24 -0.10 -0.24
s33: Monitoring post management of export market 0.13 0.21 0.16
s34: Acquiring certifications 0.46 0.19 0.18
s35: Establishing system for dealing with food safety and
sanitary inspection-0.95 a -0.58 b -0.51 b
s36: Labeling product info in local language 0.72 a 0.19 0.13
38: Utilizing joint/alliance/nation’s brands 0.54 c 0.05 -0.29 c
s39: Conducting field surveys when entering into new overseas
markets -0.12 -0.01 0.28 c
s40: Securing local buyers by export consultation via
exhibitions -0.26 -0.09 0.39 a
s43: Conducting own local market advertisement and PR 0.01 0.00 0.15
s47: Liaising/collaborating with local distributors -0.04 0.33 c 0.05
s49: Utilizing air transport 0.32 0.37 0.42 b
s50: Establishing cold-chain system for export logistics -0.14 -0.53 b -0.67 a

114 STRATEGY AND PERFORMANCE OF AGRI-FOOD EXPORTERS
(continue)
fresh agricultural products exporters(Type A) (1) (2) (3)
export value
per capitaexport intensity
market
diversification
Estimated
coefficient
Estimated
coefficient
Estimated
coefficient
s53: Securing stable export volume -0.25 -0.20 0.16
s54: export insurance 0.35 0.43 b -0.08
s56: FX risk management 0.42 0.58 a 0.26
s57: R&D investments -0.35 -0.27 -0.06
s62: Establishing and managing mid & long-term export plans 0.49 c 0.12 -0.09
s65: Training export personnel -0.38 -0.26 0.08
Constant term 6.17 a -0.88 a -0.82 b
Observed value 124 124 128
Note: The standard errors used the robust standard errors, and each a, b, c means the significance
level of 1%, 5%, and 10% respectively.
Source: Author generated.
Our analysis showed that the strategy for pursuing functionality including
health and beauty is effective for improving the fresh agricultural products
export performance (export value per capita, export intensity).34 Health
functional food would be the first to come up for the food being empha-
sized with functionality. However, the results of analysis implied that a
strategy emphasizing functionality would also positively improve the export
performance of a company in the fresh agricultural products export. The
strategy of emphasizing functionality suggests it is important to select and
produce products with a high degree of functional contents in the pro-
duction stage, or to conduct product advertisement that specifically high-
lights a product’s relevant functionality.35
34 According to Korea’s ‘health functional food Act’, the term ‘functionality’ means
an attribute through which “one can receive useful effects for health purpose to
control nutrition or physiological actions towards human organism and functions.”35 Labeling the functionality phrase or advertising it shall be in compliance with the
labeling system and restrictions on advertisement of import countries. Japan and
the US, which are the major export destination countries for fresh produce, allow

STRATEGY AND PERFORMANCE OF AGRI-FOOD EXPORTERS 115
It was found that the market diversification focused strategy had negative
effects on export performance (export value, export intensity) in the
short-term.
This may be a reflection of the aspect of trade that requires prior quar-
antine agreement at the country level for fresh agricultural product exports.
The quarantine agreement between countries would normally take over 10
years. Thus it may have effects on export performance in the short-term
since the quarantine requirements vary depending upon countries even if
companies pursue strategic market diversification. As a result of actual in-
terviews with the companies, it was found that while companies agree on
the importance of market diversification, they are more focused on sustain-
ability and export expansion in the major markets. It was found that the
Type A companies의 37% of the Type A companies, who answered the
company survey, utilize both the market diversification strategy and the fo-
cus on major markets strategy relatively more than the other types.
Therefore, it was beneficial for improving the short-term export perform-
ance to focus on the management of major market and to secure more sta-
ble export markets from the standpoint of fresh agricultural product exports.
Along with the above, strategies should be considered that seek oppor-
tunities of market diversification while monitoring pending issues regarding
the quarantine settlement in the long-term perspective.
It was determined that the strategy of establishing a safety and hygiene
test response system has negative (-) relations with all three of the export
performance indexes. The safety and hygiene test response is the process
or personnel that handle any issues that may take place during the tests pri-
or to shipments or the process of import customs clearance. Generally the
fresh agricultural product exports are not restricted for items that were pro-
duced and selected in accordance with the export quarantine requirements
within the designated complex. It was initially expected that the safety and
hygiene test response system would have positive effects on export per-
formance due to the above points, but the results were the opposite.
functionality labels on fresh produce as long as they are backed up scientific
proofs.

116 STRATEGY AND PERFORMANCE OF AGRI-FOOD EXPORTERS
According to the opinions from the companies about this result, the actual
loss would occur by discarding the entire amount if the fresh produce ex-
ports are rejected by customs clearance due to not meeting the hygiene re-
quirements, making it difficult to solve in the short-term.36 In other words,
it is important to thoroughly supervise the safety and hygiene criteria dur-
ing the administration stage right after production and harvest rather than
waiting and having to deal with a problem overseas in a reactive manner.
It was determined that establishing a cold-chain system strategy also has
a negative (-) relationship with the export performance (export intensity, number
of export countries). Based on the survey results, the average turnover of
fresh agricultural product exporters (Type A) stating that they utilize the recently
established cold-chain system strategy was higher than that of the companies
stating that they do not.37 Since the export intensity variable means the share
of export value on turnover, the value becomes relatively smaller if the turnover
is high. Also, a logistics system can be unsophisticatedly established for compa-
nies with a relatively small number of export countries. Besides, they may
have little burden to utilize cold-chain. It seems that the strategy had a negative
(-) relationship with the export intensity and the number of export countries.
According to the in-depth survey responses from the companies, some of
the companies felt burdened by the costs of low temperature storage and
procuring or leasing refrigeration vehicles. Furthermore, the companies with
the relatively low turnover scale would have difficulties in establishing a
cold-chain system as substantiated by our survey results.
It was found that the co-brand (country, joint, united brand) strategy had
positive effects on the improvement of export value per capita but had neg-
ative effects on the expansion of the number of export destination countries.
When utilizing co-brand, it appears the improvement of export value was
36 The survey asked about the strategies that have been executed within the past 2~3
years. The companies which answered that they recently established a response
system may experience a slump in export performance as per the issues of safety
and sanitation reflecting the regression result.37 The portion of type A companies that answered that they established an export lo-
gistics cold-chain was 39%. Their average turnover is KRW 9.1 billion, whereas
the turnover of companies stating they had ‘not established’ was KRW 8.1 billion.

STRATEGY AND PERFORMANCE OF AGRI-FOOD EXPORTERS 117
due to the increased awareness in the country from co-marketing efficacy
and Hanryu. On the other hand, it was assessed that the number of export
countries increased when co-brand was not utilized. This may be because
the possible countries to export to for fresh produce are limited, and the
company’s product distinctiveness cannot become prominent only by utiliz-
ing co-branding. The fresh agricultural products specialized exporters, who
were visited for the survey, actually actively utilize the country brand such
as K-berry, K-pear, and etc. together with the images showing the compa-
nies at the same time. In addition, as survey results indicated, the number
of companies using their own brand from among the Type A companies
was 55, which is more than double the number of companies using
co-brand, which was 22. The number of companies using both co-brand
and their own brands was 20.
3.2. Small scale processed agri-food exporters (Type B1)
The Type B1 companies are the companies with less than 10 employees
among the processed food exporters, yet they directly produce their
products.38 Their major export items include processed food (fruits and
vegetable juice, vegetable oil), ginseng, processed rice, and tea.
Our study showed that strategy of focusing on niche markets was effec-
tive for improvement of export performance (export value per capita, export
intensity) <Table 4-20>. A niche market is a market made by targeting par-
ticular characteristics of consumption (Ex: organic farming food, baby food,
etc.) as per the preferences of specific consumers. According to the survey
results, companies focusing on a niche market accounted for 43% among
the small scale processed agri-food exporters (Type B1), which is higher
than 23% of companies having preference in securing large-scale markets.
Companies utilizing both strategies accounted for almost 20%, but the ma-
jority of Type B1 companies were focused on a niche market.
38 It does not mean that all the export products are directly produced by one’s own.

118 STRATEGY AND PERFORMANCE OF AGRI-FOOD EXPORTERS
<Table 4-21> Strategy factors for small scale processed agri-food exporters
(Type B1) by performance index
small scale processed agri-food exporters(Type B1) (1) (2) (3)
export value per
capitaexport intensity
market
diversification
Estimated
coefficient
Estimated
coefficient
Estimated
coefficient
ln(Experience in export) -0.47 0.28 b 0.59 a
ln(# of employees) -0.94 b -0.16 -0.05
# of participation for export support programs 0.17 a 0.02 c 0.02
s1: Enhancing competitiveness of production cost 0.48 -0.11 0.34 c
s3: Pursuing product functionality 0.80 -0.28 -0.06
s6: Custom made production or make-to-order -1.48 b -0.15 -0.19
s7: Focusing on main export product(item) -0.48 0.03 0.13
s10: Targeting niche markets 1.12 a 0.28 c -0.24
s13: Targeting overseas Koreans -0.17 -0.05 -0.36 b
s15: Overseas market diversification is important -0.74 b 0.02 0.41 a
s28: Operating brand management dept. -0.30 0.32 0.20
s29: Establishing system for product quality management -2.32 b -0.15 0.10
s33: Monitoring post management of export market 0.38 0.45 a 0.06
s34: Acquiring certifications -0.30 0.09 0.14
s35: Establishing system for dealing with food safety and
sanitary inspection-0.73 0.08 0.02
s36: Labeling product info in local language 0.55 0.34 b 0.21
s38: Utilizing joint/alliance/nation’s brands -1.67 -0.14 0.15
s39: Conducting field surveys when entering into new
overseas markets -0.87 -0.05 0.21
s40: Securing local buyers by export consultation via
exhibitions -1.44 a -0.21 -0.32
s43: Conducting own local market advertisement and PR -1.49 b 0.06 0.10
s47: Liaising/collaborating with local distributors -1.13 c 0.03 -0.30
s49: Utilizing air transport -0.03 0.51 b 0.33
s50: Establishing cold-chain system for export logistics -1.65 b -0.61 a 0.32
s53: Securing stable export volume 1.47 b 0.37 b -0.09
s54: export insurance 0.28 -0.07 -0.08
s56: FX risk management 1.82 b 0.25 c -0.22
s57: R&D investments 0.86 b 0.21 -0.07

STRATEGY AND PERFORMANCE OF AGRI-FOOD EXPORTERS 119
(continue)
small scale processed agri-food exporters(Type B1) (1) (2) (3)
export value per
capitaexport intensity
market
diversification
Estimated
coefficient
Estimated
coefficient
Estimated
coefficient
s62: Establishing and managing mid & long-term export
plans1.82 a -0.43 b 0.06
s65: Training export personnel 0.80 -0.46 b -0.28
Constant term 4.94 a -1.95 a -0.56 c
Observed value 117 117 117
Note: The standard errors used the robust standard errors, and each a, b, c means the significance
level of 1%, 5%, and 10% respectively.
Source: Author generated.
It was determined that establishing a cold-chain system strategy has a
negative (-) relationship with export performance (export value per capita,
export intensity) while companies not establishing cold-chain strategy had
a tendency to increase export performance. These results were reflected by
the properties of the major export items of small-scale processed agri-food
exporters (Type B1) that are mostly transportable at room temperature. The
Type B1 companies not establishing a cold-chain strategy accounted for
80%, while the companies with a cold-chain strategy mainly export fer-
mented paste varieties, Kimchi, and fruit juice. As mentioned when analyz-
ing the fresh agricultural product exporters (Type A), establishing and using
cold-chain facilities or vehicles may be burdensome for companies, so the
strategy is primarily useful for companies of a certain scale or larger.39
It was revealed in our analysis that securing stable export volume and FX
risk management were effective for improving export performance (export
value per capita, export intensity). These strategies were effective for Type
B1 companies, which are small scale, since the risk for securing export vol-
39 As a result of survey, the companies using the established cold-chain strategy from
the Type B1 have KRW 74.503 billion in average turnover (2015~2017 average)
which is more than 15 times bigger than the KRW4.801 million for that of the
companies without the strategy.

120 STRATEGY AND PERFORMANCE OF AGRI-FOOD EXPORTERS
ume and FX changes is relatively big.
It was also found that the strategy for having mid & long-term export
plans and their management had positive effects on the increase of export
value per capita but negative effects on the increase of export intensity. It
seems that the positive effects occurred because companies (from among
the small scale companies) having mid & long-term export plans increased
the short-term export value under stable circumstances, and they tended to
have big turnover. The companies selecting this strategy among the small
scale processed agri-food exporters (Type B1) were 3 times greater in ex-
port value, approximately 8 times bigger in turnover, and about 2% lower
in export intensity than the companies that did not select this strategy.
The market diversification promoting strategies appeared to have opposite
effects depending upon export performance. While diversification seemed
effective for expanding the number of export destination countries, it had
negative effects on export value per capita. In our actual interview with the
companies (ginseng beverage exporters), it was found that small-scale com-
panies focused on the current major export markets due to the issues of
costs and labor involved in promoting market diversification. These results
are in contrast with the results for the Type B2 companies (medium-size
exporters for processed agri-food), which are larger in scale than B1
companies. In other words, focusing on current export markets for the
short-term, rather than promoting market diversification, was more efficient
at increasing export value for small-scale Type B1 companies.
3.3. Medium-size exporters for processed agri-food (Type B2)
The type B2 group is composed of rather larger scale companies than the
B1. On average, the type B2 company had over 20 times the number of
employees and 3.6 fold higher turnover compared to the Type B1. The me-
dium-size exporters for processed agri-food (Type B2) mainly export proc-
essed products, Kimchi, ginseng, tea, processed rice, and so forth.
As a result of our analysis of medium-size exporters of processed ag-
ri-food (Type B2), it was revealed that the custom made made-to-order

STRATEGY AND PERFORMANCE OF AGRI-FOOD EXPORTERS 121
strategy had positive effects on export performance (export intensity, num-
ber of export countries) <Table 4-21>. These results contrast with the anal-
ysis results for the Type B1 small-scale companies.40 Considering the fact
that the export volume at a certain level is already secured as well as the
production infrastructure for the custom made, and made-to-order, this may
not be the best strategic method for small-scale companies. On the other
hand, the larger Type B2 companies are equipped with the facilities and in-
frastructure to produce in accordance with the requirements from manu-
facturing to the packaging stage. Also, it seems that the custom-made
made-to-order product export strategy has positive effects on the improve-
ment of export performance since the order volume would likely satisfy the
proper level of company’s desirable efficacy.
As mentioned above, focusing on a niche market strategy had negative
effects on export performance (export value per capita, export intensity).
These results were opposite to the analysis results for the Type B1 compa-
nies (small scale processed agri-food exporters). As a result of actual inter-
views, it seems that it would be difficult to show performance in the
short-term by penetrating niche markets. The interviewed companies (rice
wine export) used PR strategies to actively utilize social networks targeting
young consumers in China, but explained that they did not generate notable
profits from a short-term perspective. Therefore, securing broader consumer
markets rather than a specific consumer group would be much more effec-
tive for improving export performance for the Type B2 (medium-size ex-
porters for processed agri-food) companies from the standpoint of
short-term performance. However, it seems that the companies primarily fo-
cused on securing large-scale markets but also targeted niche markets for
expanding the base at the same time according to the survey results.
40 It was analyzed that the custom made, make-to-order strategy for the small-scale
companies (B1) had a negative relationship (export value per capita) with export
performance, or the strategy is not statistically significant (level of export concen-
tration, number of export destination countries).

122 STRATEGY AND PERFORMANCE OF AGRI-FOOD EXPORTERS
<Table 4-22> Strategy factors for medium-size exporters for processed agri-food
(Type B2) by performance index
Medium-size exporters for processed agri-food(Type B2) (1) (2) (3)
export value per
capitaexport intensity
market
diversification
Estimated
coefficient
Estimated
coefficient
Estimated
coefficient
ln(Experience in export) 0.61 b 0.22 c 0.49 a
ln(# of employees) -0.70 c -0.25 b 0.22 b
# of participation for export support programs 0.04 -0.01 0.01
s1: Enhancing competitiveness of production cost -0.28 0.15 -0.65 a
s3: Pursuing product functionality 0.67 -0.17 0.36
s6: Custom made production or make-to-order -0.01 0.56 a 1.29 a
s7: Focusing on main export product(item) -0.21 -0.45 b -0.13
s10: Targeting niche markets -0.74 b -0.30 b 0.17
s13: Targeting overseas Koreans -0.65 -0.34 b -0.21
s15: Overseas market diversification is important 1.12 a -0.01 -0.03
s28: Operating brand management dept. 0.77 -0.08 0.11
s29: Establishing system for product quality management -0.05 -0.09 -0.05
s33: Monitoring post management of export market 1.20 c 0.70 a -0.06
s34: Acquiring certifications 1.15 -0.81 -0.91 b
s35: Establishing system for dealing with food safety and
sanitary inspection-1.21 b -0.32 0.08
s36: Labeling product info in local language 0.35 0.59 a 0.33
s38: Utilizing joint/alliance/nation’s brands 0.70 -0.38 -0.95 a
s39: Conducting field surveys when entering into new
overseas markets -1.17 b -0.40 c 0.67 b
s40: Securing local buyers by export consultation via
exhibitions 0.33 0.14 -0.12
s43: Conducting own local market advertisement and PR 0.46 0.23 0.59 a
s47: Liaising/collaborating with local distributors 0.27 0.46 b 0.48 b
s49: Utilizing air transport -0.24 -0.20 -0.85 a
s50: Establishing cold-chain system for export logistics 0.57 0.21 -0.14
s53: Securing stable export volume -0.03 0.02 -0.10
s54: export insurance 0.22 0.19 0.31
s56: FX risk management -0.32 0.22 0.37 c
s57: R&D investments 1.44 b -0.04 0.71 a

STRATEGY AND PERFORMANCE OF AGRI-FOOD EXPORTERS 123
(Continued)
Medium-size exporters for processed agri-food(Type B2) (1) (2) (3)
export value per
capitaexport intensity
market
diversification
Estimated
coefficient
Estimated
coefficient
Estimated
coefficient
s62: Establishing and managing mid & long-term export
plans-0.72 c -0.13 -0.17
s65: Training export personnel 0.23 -0.34 -0.37
Constant term 1.46 -0.11 -1.55 b
Observed value 138 138 138
Note: For standard errors, the robust standard errors are used while a, b, c respectively means the
significance level of 1%, 5%, and 10%.
Source: Author generated.
It was found that the field survey for market penetration strategy had
positive effects on expanding the number of export destination countries,
but had negative effects on export value per capita and export intensity. As
a result of actual interviews with companies, the direct field survey was
found to be efficient for diversification. Though they put more emphasis on
establishing ongoing, trusting relationships with buyers and contract man-
agement for previous markets after a certain period of adapting export.
It was also found that the monitoring and post management strategy had
positive effects on export performance, and this strategy can be a very use-
ful strategy for the short-term. Unlike results from previous field surveys,
this is because it can cope with fast changing trends by obtaining in-
formation on the items and market conditions with relatively low costs. It
was found from the interview surveys that monitoring export market in-
formation is useful to nimbly and dexterously deal with sudden changes in
consumers’ preferences when selecting export items.
It was determined that R&D investments for the medium-size exporters
for processed agri-food (Type B2) had positive effects on export value per
capita and market diversification. This is different from the small-scale
processed agri-food exporters (Type B1). It can be inferred that the me-
dium-size companies’ investments in development of new items or custom-
ized production can be stepping stones for quickly expanding the number
of countries based on the economies of scale.
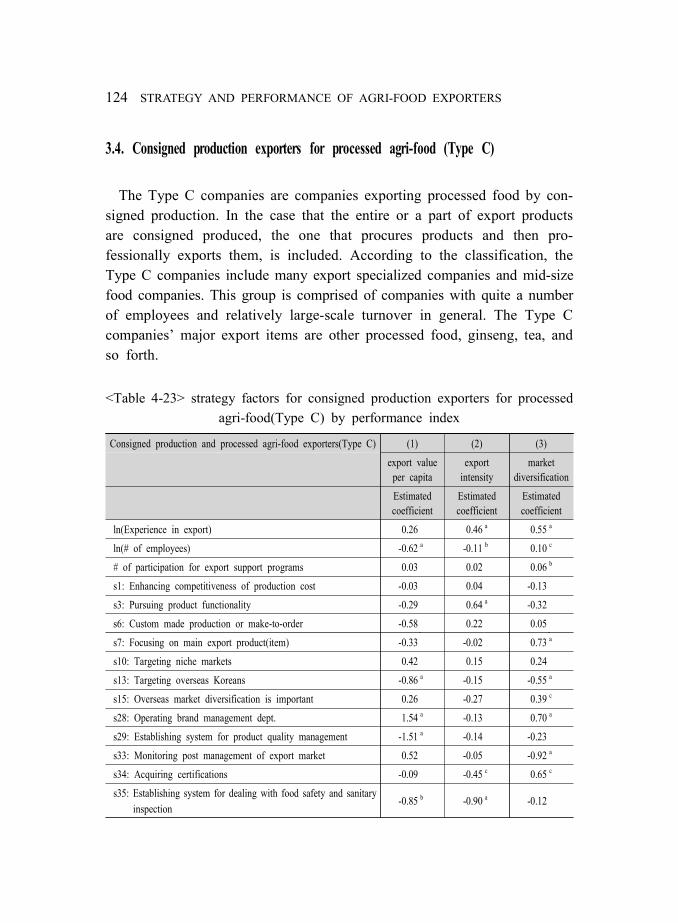
124 STRATEGY AND PERFORMANCE OF AGRI-FOOD EXPORTERS
3.4. Consigned production exporters for processed agri-food (Type C)
The Type C companies are companies exporting processed food by con-
signed production. In the case that the entire or a part of export products
are consigned produced, the one that procures products and then pro-
fessionally exports them, is included. According to the classification, the
Type C companies include many export specialized companies and mid-size
food companies. This group is comprised of companies with quite a number
of employees and relatively large-scale turnover in general. The Type C
companies’ major export items are other processed food, ginseng, tea, and
so forth.
<Table 4-23> strategy factors for consigned production exporters for processed
agri-food(Type C) by performance index
Consigned production and processed agri-food exporters(Type C) (1) (2) (3)
export value
per capita
export
intensity
market
diversification
Estimated
coefficient
Estimated
coefficient
Estimated
coefficient
ln(Experience in export) 0.26 0.46 a 0.55 a
ln(# of employees) -0.62 a -0.11 b 0.10 c
# of participation for export support programs 0.03 0.02 0.06 b
s1: Enhancing competitiveness of production cost -0.03 0.04 -0.13
s3: Pursuing product functionality -0.29 0.64 a -0.32
s6: Custom made production or make-to-order -0.58 0.22 0.05
s7: Focusing on main export product(item) -0.33 -0.02 0.73 a
s10: Targeting niche markets 0.42 0.15 0.24
s13: Targeting overseas Koreans -0.86 a -0.15 -0.55 a
s15: Overseas market diversification is important 0.26 -0.27 0.39 c
s28: Operating brand management dept. 1.54 a -0.13 0.70 a
s29: Establishing system for product quality management -1.51 a -0.14 -0.23
s33: Monitoring post management of export market 0.52 -0.05 -0.92 a
s34: Acquiring certifications -0.09 -0.45 c 0.65 c
s35: Establishing system for dealing with food safety and sanitary
inspection-0.85 b -0.90 a -0.12

STRATEGY AND PERFORMANCE OF AGRI-FOOD EXPORTERS 125
(Continued)
Consigned production and processed agri-food exporters(Type C) (1) (2) (3)
export value
per capita
export
intensity
market
diversification
Estimated
coefficient
Estimated
coefficient
Estimated
coefficient
s36: Labeling product info in local language 0.81 b 0.14 0.79 a
s38: Utilizing joint/alliance/nation’s brands -0.37 0.08 -0.53
s39: Conducting field surveys when entering into new overseas
markets 0.02 -0.28 0.27
s40: Securing local buyers by export consultation via exhibitions -1.33 a 0.48 b 0.34
s43: Conducting own local market advertisement and PR -0.03 0.52 b 0.82 a
s47: Liaising/collaborating with local distributors 0.85 a 0.39 b 0.15
s49: Utilizing air transport -0.42 0.32 0.03
s50: Establishing cold-chain system for export logistics 0.76 0.13 -0.11
s53: Securing stable export volume 0.61 0.11 -0.14
s54: export insurance 0.27 0.48 b -0.05
s56: FX risk management -0.87 b 0.06 -0.01
s57: R&D investments -0.78 -0.35 c 0.41 b
s62: Establishing and managing mid & long-term export plans -0.54 -0.23 -0.33 b
s65: Training export personnel 0.77 c -0.39 b -0.27
Constant term 6.43 a -1.36 a -2.09 a
Observed value 109 109 109
Note: The standard errors used the robust standard errors, and each a, b, c means the significance
level of 1%, 5%, and 10% respectively.
Source: Author generated.
It was found that the strategy for penetrating niche markets or targeting
overseas Koreans was not statistically significant for improving export per-
formance for consigned production exporters for processed agri-food (Type
C). Therefore, promoting export strategy by securing large-scale markets
and consumers rather than targeting a particular market would be much
more positive for improving export performance for the Type C companies.
It was found that operating an image and brand management department
was efficient for expanding export value per capita and the number of ex-
port destination countries. The companies operating a dedicated department
are relatively larger in scale than the companies without operating a dedi-

126 STRATEGY AND PERFORMANCE OF AGRI-FOOD EXPORTERS
cated department.41 Additionally, they are expected to have high utilization
of brand and corporate image and a specialized organizational system.
Therefore, it would be feasible to efficiently develop brand/images for
product PR, promote design business, and systematically manage them.
Therefore, the strategy of operating a dedicated brand management depart-
ment did have positive effects on export performance.
It was also determined that own local PR was efficient for expanding ex-
port intensity and the number of export destination countries. Plus, the local
distribution/collaboration strategy was also efficient for export value per
capita and export intensity. The account management through promoting
product directly and direct transaction would be more efficient for the con-
signed production exporters for processed agri-food (Type C) rather than
co-marketing or relying on the buyers. During the interview with the com-
panies, it was observed that while local distribution liaison/collaboration
strategy may have the burden of direct management, it was perceived to be
efficient when the export volume was big.
It was also shown that the strategy of training export personnel had pos-
itive a (+) relationship with export value per capita and a negative (-) rela-
tionship with export intensity. Training export personnel can be executed by
various manners such as employment of export personnel or expertise en-
hancing training. Type C companies had a higher portion of training export
personnel compared to other types.42 It is an encouraging result that the
training export personnel strategy is efficient for increasing export value per
capita. The enhancing human capacity strategy is normally conducted from
a long-term perspective. Nonetheless it was found that this strategy could
be efficient for increasing export value as a result of analyzing the Type
C (consigned production exporters for processed agri-food). The reason it
had negative relations with export intensity is that the export intensity vari-
41 As a result of survey, the ratio of companies operating a relevant dept. is relatively
low at approximately 17% from the type C companies, but their number of em-
ployees is 5 times bigger than the companies not operating a relevant dept. imply-
ing that it is a strategy taken by big companies. (74 vs 369). 42 The ratio of selecting the relevant strategy for A, B1, B2, and C in order is 29%,
33%, 40%, and 47% respectively.

STRATEGY AND PERFORMANCE OF AGRI-FOOD EXPORTERS 127
able is calculated as the export value on turnover.
4. Policy implications
A. Fresh agricultural product exporters (Type A)
Fresh agricultural product export is under the assumption of quarantine
settlement between countries. Therefore, it seems that some strategies are
not effective for improving fresh agricultural product exports due to the
characteristic that the number of countries that the companies can export to
are limited. However, emphasis on a product’s functionality, conforming to
labeling in local languages, local distribution collaboration, and export risk
management would all be efficient in improving export value and export
intensity. In addition, the fresh agricultural product exporters with an ex-
panding plan for the number of export destination countries need to actively
secure the various markets. Especially, since the companies utilizing the
strategy for active market research and securing buyers have notably ex-
panded the number of export destination countries.
A high proportion of fresh agricultural products exporters (Type A) focus
on their existing markets rather than considering entering new markets. A
high number of Type A exporters, compared to then average number of re-
sponses, answered the survey listing the difficulties of new market pene-
tration such as organizing local marketing, export logistics, and price
competitiveness. The global competitiveness in quality is highly evaluated,
but a high portion of the companies set the sales price considering the com-
petitors’ price. It implies that it is reflected in the reality that competitive-
ness in the local market is determined mainly by price, as the domestic
market prices are relatively constant. The satisfaction level on the export
performance is high compared to the entire average in terms of the rate of
return, market share, and growth rate. In light of the foregoing, the compa-
nies exporting fresh produce would have better market penetration if the

128 STRATEGY AND PERFORMANCE OF AGRI-FOOD EXPORTERS
burden for local marketing and logistics would be lessened.
For the fresh agricultural products exporters (Type A), participation in
support programs on topics such as export logistics cost, export insurance,
overseas promotion events, utilization of KATI information, and utilization
of FTA preferential tariff is high compared to the entire average.
Conversely, participation in support programs on topics regarding the local
government, international exhibitions, buyer invitation conferences, registra-
tion of overseas certification, KOTRA, and SBA is relatively low.
Therefore, the policies to promote participation in the support programs
such as overseas standard certification or export risk management would be
helpful for improving export performance. In addition, reinforcing the sup-
port policies would improve the efficacy of export support since partic-
ipation in events regarding the previous export insurance and overseas pro-
motion experiences is relatively high. Additional policies calculated to less-
en the burden of local marketing along with the reinforcing the support pol-
icies need to be designed. Also, since price competitiveness would have a
higher chance to be decreased in the short-term if the export logistics cost
support, which is a highly participated in program, is stopped in the future.
Nonetheless, as shown in the results, the companies with a high ratio of ex-
port support have a higher chance of being stopped from the perspective
of export sustainability. Therefore, the support policies for company’s vol-
untary improvement of competitiveness would be effective for continued
stable export and new market penetration in the long run.
B. Processed agri-food exporters (The type B1 and type B2)
The type B1 and type B2 exporters were classified by the scale of em-
ployment among all the directly producing and processing exporters, where-
as the gap in the average scale of the two groups was reflected by the com-
pany’s export experience such as the number of years for being in business
and the company’s investment potential from the perspective of turnover.
There were many commonly utilized strategies, but the strategies most effi-
ciently utilized varied depending upon the company’s scale. For small scale
processed agri-food exporters (Type B1), establishing export strategies,

STRATEGY AND PERFORMANCE OF AGRI-FOOD EXPORTERS 129
which focus on export stability by export volume and risk management, and
focus on the current major export markets targeting potential market such
as niche markets, would be efficient for improving export performance in
the short term. For the medium-size exporters of processed agri-food (Type
B2), the strategies for pursuing big scale consumer markets (rather than ni-
che markets), market diversification, and R&D investment would be most
efficient for improving export performance.
It is a particular characteristic that the analysis results are different when
the number of export countries is used as an export performance index.
Compared to the B2 companies (medium-size processed agri-food export),
the relationship between the strategies and the number of export destination
countries for the Type B1 companies (small scale processed agri-food ex-
port) was not statistically significant. In other words, it is expected that pro-
moting strategically at the higher level of a certain scale would have mean-
ingful performance improvement if a company pursued this after expanding
the number of export destination countries.
The type B1 and type B2 companies responded that the lack of market
information and non-tariff barriers mattered more in terms of the difficulties
of new market penetration compared to the entire average. The costs of ini-
tial investments or securing funds for export were a relatively big burden
for the Type B1. The type B1 and type B2 companies answered that setting
export prices were based on the production cost and the proper margin,
while the local price level or requirement level had relatively less effect on
setting prices. The quality and technological global competitiveness of B1
companies were evaluated as relatively low compared to the entire average,
but were higher than that of B2 companies. It was also analyzed that the
rate of return was generally high for the B1 and B2 companies, even
though their market share was relatively low. Therefore, it was important
for the type B1 and type B2 companies to expand their opportunities re-
garding active utilization of the market and non-tariff measures when pene-
trating new markets. Also, if the initial investment costs were supported in
advance for the type B1 companies, it would be helpful for penetrating new
markets. This would also be effective for expanding export to focus on the
support policy for market share and growth rate rather than the rate of re-
turn on export.

130 STRATEGY AND PERFORMANCE OF AGRI-FOOD EXPORTERS
The small scale processed agri-food exporters (Type B1) participation in
the export support programs regarding local government, international ex-
hibitions, and overseas certification registration was higher than the
average. On the other hand, the level of participation in most of the export
support programs for the medium-size exporters for processed agri-food
(Type B2) was above average, but participation in programs designed to
help participation in international exhibitions was slightly lower than B1
companies. It seems that the Type B2 companies expanded their export by
economies of scale, quality, and technological competitiveness to penetrate
large-scale markets. Therefore, constant support by reinforcing the existing
policies for the type B2 companies would be helpful for stable export for
the entire agri-food industry. This would also be effective for expanding ex-
port by giving the support to improve quality and technological com-
petitiveness targeting niche markets with small scale for Type B1
companies.
C. Consigned production exporters for processed agri-food (Type C)
The consigned production exporters for processed agri-food (Type C) are
companies who are able to specialize in concentrating on marketing and ex-
port, compared to other company types in our study. A quantitative analysis
result, of our study showed that operating a brand management dept., hav-
ing own local PR, having a local distribution liaison/collaboration strategy,
and training export personnel had positive effects on the export
performance. Being able to observe the efficacy of other strategies can be
a different point especially where it was difficult to promote image dedi-
cated dept. and training export personnel due to their costs, and did not
show any statistical significance.
The Type C companies answered that finding new buyers was the most
difficult when penetrating new markets. Their second most frequent answer
was that they do not consider penetrating new markets due to non-tariff
barriers. The share for setting overseas market price by considering the lo-
cal market was the biggest, which is then followed by global competitive-
ness in quality, production cost, and technology in that order. However, it

STRATEGY AND PERFORMANCE OF AGRI-FOOD EXPORTERS 131
was found that export performance or satisfaction level on rate of return,
market share, and growth rate were relatively low compared to the entire
average. Therefore, it seems that while export competitiveness was high for
the Type C companies, they were not active in penetrating new markets due
to external factors such as non-tariff barriers.
The level of participation in the export support programs excluding
KOTRA, SBA, and joint air logistics for the consigned production ex-
porters for processed agri-food (Type C) was lower than the entire average.
This may be because the Type C group was composed of companies who
export not only agri-food but also various items focusing on marketing and
local distribution. Therefore, it is necessary to create policies that seek for
ways to address unnecessary entry barriers, and provide information on ex-
ternal environments such as non-tariff measures in order to increase the lev-
el of concentration on agri-food trade by the type C companies and boost
their competitiveness for the expansion of agri-food export.


Chapter 5. SUMMARY AND IMPLICATIONS
□ Background of Research
As a result of the proliferation of FTAs (Free Trade Agreements), both
imports and exports of agri-food have been expanding daily. Thus the im-
portance of policies for impacting agri-food exports has increased in terms
of their effect on companies entering and applying the global value chain,
associating agriculture and the food industry, developing new markets, and
creating jobs. It is therefore important to develop systematic export strat-
egies in the farming industry. However, there have been few theoretical and
empirical studies on the role of agri-food exporters as the core of the new
trade theory. Therefore, one of the main purposes of this study is to analyze
the determinants of exports and the factors influencing export performance
for agri-food exporters. Based on the results of this analysis, we identified
the key strategic determinants as per export performance and effective strat-
egies for each type of agri-food firm, and then deduced policy implications
to improve export-supporting programs. This study as an empirical study
does have differentiated points that analyzed the impacts of various charac-
teristics, strategies, and in/out changes in the surroundings of agri-food
firms on decision making and export performance.
□ Method of Research
For our analysis, we used literature review, statistical analysis, econo-
metric analysis, surveys, interviews and expert consultation. Based on a re-
view of prior studies on the determinants of export and export performance,
this study examined both the theoretical and empirical backgrounds and the

134 SUMMARY AND IMPLICATIONS
status of agri-food exports by analyzing the current status of agri-food
firms. Statistical data were collected from various sources and used for the
analysis. We further examined the effects of corporate characteristics and
changes in the external environment on export decisions and export per-
formance utilizing Statistics Korea MDIS Business Activities, aT’s perform-
ance data for export supporting project, and so forth. We also used the re-
sults of our survey on the agri-food firms to analyze the relationship be-
tween export strategies and export performance of agri-food firms by type.
Furthermore, in order to qualitatively complement the analysis, surveys
along with empirical analysis results, expert consultation and interviews
were conducted. The research model and the survey questionnaires were
reviewed by experts and reflected in the study. We also conducted inter-
views mainly with high performance firms to complement the results of the
empirical analysis results.
□ Agri-food exporters’ current status and characteristics
The export value for Korean agri-food has been increasing daily. Export
destination countries have increased and diversified. In terms of export des-
tinations, the number of countries increased by about 14% compared to
2008, while the share of beverage and other confected agricultural products
has increased a great deal also. The number of exporters in F&B (food,
beverages) manufacturing was approximately 1,500 and has increased by
about 29%, and increased 11% in export value as compared to 2010. 94.1%
of the F&B and cigarette manufacturing exporters are SMEs accounting for
25% of the relevant industry’s export value. The share of SMEs’ export
value is relatively high compared to general manufacturing but the export
value per company is fairly low. The share of export value for the F&B
and cigarette manufacturers with low intensity of export was higher than
the general manufacturing average. Whereas the share of export value for
the companies with high intensity was lower than the general manufactur-
ing average. By expanding the export of F&B and cigarette manufacturing
to the USA, EU, and S.E. Asia, the industry’s dependency on export to
Japan has decreased compared to 2010. The number of export countries and
export items has been continuously expanding, while the major export items

SUMMARY AND IMPLICATIONS 135
vary depending on the countries. The top export items to Japan have con-
sistently been Kimchi, paprika, and lily. While the top export items to
China have changed from red ginseng to citrus tea, and other dairy
products. The major export items to Taiwan were red ginseng, pears, and
so forth.. While pears, winters mushrooms, and so forth were the major ex-
port items to the USA, for Vietnam, the main exports were frozen chickens,
powdered milk, and so forth. While strawberry, red ginseng, citrus tea, and
etc. were the main exports to Hong Kong .
The number of export destination countries for Korean agri-food has con-
sistently expanded over the past 10 years. Japan, China, and the USA have
been the major export destination countries. However, it was found that the
export market has diversified by expanding to the Middle East (UAE, and
etc.) and S.E. Asian markets (Vietnam, and etc.), which have decreased ex-
port dependency on the Japanese market. The major export items have not
changed much in terms of their share order but they may have varied de-
pending upon the export destination country. Risk diversification by diversi-
fication of export items is important considering the fact that a strategy tar-
geting a certain item has advantages for putting all competencies in one
spot. However, there are still difficulties in dealing with the ever changing
environments in the export destination countries. Therefore, it is necessary
to seek export diversification strategies to expand the types of items along
with the market diversification strategies to expand export destination coun-
tries and thus creating more stable export expansion.
□ Export activity factors for agri-food firms: Entry to and continuing
export
The agri-food industry and the manufacturing industry excluding ag-
ri-food were analyzed by utilizing Statistics Korea’ micro panel data from
the business activities survey for 2006~2016. The total factor productivity
and labor productivity were considered for productivity, while it was found
that the productivity of exporters was generally higher than for domestic
companies when verifying the gap of distribution. However, the difference
in the rate of increase for productivity between exporters and domestic
companies were not typically significant.

136 SUMMARY AND IMPLICATIONS
Based on the analysis by industry, it was found that whether to export
(export’s sunk cost) and productivity (total factor productivity) in the pre-
vious year had positive effects on both decision making for export of ag-
ri-food and manufacturers. This is similar to the results from the previous
empirical analysis, in which the company’s characteristics such as scale (#
of employees) and experience (# of years for biz) have positive efficacy on
export decision-making. The externality’s effects vary depending upon in-
dustry, but it was shown that the externality’s positive direct efficacy (infra,
logistics, knowhow) was more meaningful than the competition efficacy
<Table 5-1>. This result confirms the self-selection theory, in which the
company’s export decision-making was made per the productivity and fixed
costs of the new trade theory. As a result of testing the learning by export-
ing theory it was identified that the learning by exporting theory was not
statistically significant in Korea’s manufacturing and food industry.
Next, the corporate characteristics between industries that have effects on
export sustainability were examined. Examining the survival function esti-
mation result, it was found that food companies in the middle scale
(100~300) had a higher rate of sustainability than the companies under oth-
er scales, while food companies under the ‘over 300’ scale had a tendency
to dramatically decrease in the sustaining rate after the start of export.
Conversely, companies with 300 employees or more have the highest sus-
taining rate among the manufacturing (excl. food) companies.
We evaluated the effects of a company’s characteristics on export sustain-
ability by using the Cox proportional hazard model. We found that # of
years for being in business and in same industry within the region portion
for food companies, and the # of years for biz, # of employees, pro-
ductivity, and same industry outside the region, and same industry within
the region portion for manufacturers all lower the risk possibility of leaving
the export market <Table 5-1>. In other words, it is inferred that the com-
panies with the longer history would have lower risk of export being
stopped. Whereas positive externalities such as an increase in the portion
of the same industry within the region, an increase in export infrastructure
in the region, and new information have positive effects on export
continuation. However, we found that factors such as scale, productivity,
and the presence of a similar industry outside of the area for the food com-

SUMMARY AND IMPLICATIONS 137
panies did not have significant effects in decreasing the possibility of ex-
port being stopped.
<Table 5-1> Agri-food firms’ export entry and continuing
industrytotal factor
productivity
Labor
productivity
whether to
export in
the previous
year
Company’s
years of
business
Scale
same
industry
outside
of region
different
industry
in the
region
same
industry
in the
region
whether to
export
Food O O O O
Manufacturing
(Excl. food)O O O O O O O
export
sustainability
Food O O
Manufacturing
(Excl. food)O O O O O O
Note: O implies when an increase in the relevant variable did have positive effects on whether to
export or an export’s sustainability.
Source: Author generated.
It is an important task to create an industry’s ecosystem where many ag-
ri-food firms can function with distinctiveness rather than through routine
extensions of export. This is important for expanding the export of ag-
ri-food firms in the long-term since the productivity of a company is a vari-
able representing a company’s competency and ingenuity in producing dif-
ferentiated products. Likewise, the policy support focusing on vitalization
of entering export markets by highly productive companies is necessary for
improving the productivity of the agri-food industry on the whole.
□ Export activities factors for agri-food firms: export routes
sustainability
The companies-item and companies-countries unit’s export sustainability
was analyzed by utilizing the aT’s export support performance data for the
years 2005~2017. It was found that 25% of the new agri-food export routes
in Korea had a sustaining period of less than a year, and 50% would be
stopped at the 5th year. However, the companies with sustaining export
routes are the ones leading the stable agri-food export. The study area fo-

138 SUMMARY AND IMPLICATIONS
cused on ① China, ② Japan, ③ SE. Asia, ④ the US, ⑤ EU, and ⑥
others. It was found that the Japan market had the highest export sustain-
ability whereas the SE. Asia market had the lowest export sustainability. As
a result of our analysis, Kimchi was observed to have the highest export
sustainability while fruits, grains, processed rice, and other processed prod-
ucts showed relatively short years of continuing export.
<Table 5-2> Factors having effects on export routes sustainability
processed
or not
import
country
GDP
FX rate
changes
in import
country
item
diversifi-
cation
market
diversifi-
cation
# of Koran
companies
in export
routes
relative
export
price
ratio
Ratio of
export
subsidized
1st
year’s
export
value
Entire agri-food O O X O O X X O
By
regi
on
China O O O X O
Japan O O X O
SE. Asia O X O X O
the US X X O X X O
EU X O O
others O O O O O
By
item
tea O O O O
ginseng O O X O O X O
fruits X O X X O
vegetables O O O O O
flowers O O X O
Kimchi O O
livestock
productsO X O O O O O
traditional
liquorO X O O X X O
Note: O implies the positive effects on export routes to be continued by increase of the relevant
variable, whereas X means the negative effects on export routes to be continued by increase
of the relevant variable.
Source: Author generated.
Next, our analysis of the factors influencing the continuity of export
routes showed that the probability of discontinuing the export routes is in-
creased by product diversification whereas the probability of continuing the

SUMMARY AND IMPLICATIONS 139
export routes is increased by market diversification.
Our study also established that the existence of similar export routes
work as direct effects increasing the probability of continuing the export.
Conversely, we observed that the higher the relative export price and the
export subsidy rate, the higher the probability of discontinuing the export.
(<Table 5-2> Entirety).
As a result of our analysis by region, it was shown that the possibility
of export sustainability increases as the FX rate (CNY on KRW) is in-
creased in China. The existence of similar export routes in the US actually
increased the probability of export to be stopped, but the possibility of ex-
port sustainability increased as the export support rate increased. As a result
of the analysis by item, it was found that item diversification for vegetables
has positive effects on export sustainability. Our study also showed that the
possibility of export sustainability increases as the relative export price for
livestock products increases. (<Table 5-2> by area and item).
□ Export strategy analysis for agri-food exporters
Utilizing our survey data, we investigated the relationship between export
strategy and export performance (export per capita, export intensity, market
diversification, export growth rate and years of continuing export), as well
as what makes effective export strategies. (<Table 5-3>Refer to the row E,
P, and D of Entirety). In the results of the analysis of the entire company
samples, we observed that the relationship between strategy and perform-
ance differed depending on what is considered as the performance indicator
while some strategies could have a negative effect on export performance.
The strategies focused on management of export risks and increase of mar-
ket awareness of product would generally be efficient for improving per-
formance if export value per capita and export intensity are used as the per-
formance indexes. Specifically, the risk management strategies for export
value loss have statistically significant positive (+) relations with the export
value increase whereas the strategies regarding logistics or distribution have
statistically significant relations with the improvement of export intensity.
The strategies with the burden of high costs including investment strat-
egies and building facilities or systems over the long-term perspective, and

140 SUMMARY AND IMPLICATIONS
targeting specific consumers such as overseas Koreans were found to have
negative (-) effects on export value and export intensity in the short-term.
Therefore, it is advised to focus and pay more attention when selecting a
strategy. However, it was also found that the strategies (focusing on major
products, operating dedicated brand management dept. and field survey, and
R&D investments) that did not have significant effects or negative (-) ef-
fects on the export value or export intensity had positive (+) relations with
the expanding the number of export countries.
In order to meticulously and minutely analyze the factors and strategies
having effects on the company’s export performance, the export support
performance data and survey results were integrated. The observed values
are defined as ‘continuing export routes by region’ and ‘continuing export
routes by item’. This was based on the business unit export performance
from the export support performance data where each of the observed val-
ues would have variables such as the years of continuing export, unit cost
for export, and ratio of export support. The companies listed in the export
support performance data coincide with the 159 of the companies that an-
swered the surveys. The survey responses from these companies were col-
lected and aggregated into the data. Sorting the data by region and by item
established two data sets, which were then analyzed.
Bearing in mind that the coefficients on the results of two estimates and
each strategy factors appeared statistically significant, the strategies that
have positive effects on export increase are: ① focus on major export prod-
ucts, ② export after product purchase, ③ Utilization of FTA preferential
tariff, and ④ stable securing export volume. The factors that had negative
effects on export increase are: ① enhancing production cost competitive-
ness, ② custom made production(make-to-order), ③ procuring raw materi-
als from the market or contract farming, and ④ operating dedicated depart-
ment for brand or design. In addition, there was no strategy that has con-
flicted effects on export increase by item and area. (<Table 5-3> Refer to
G row of Entirety).
We estimated how a company’s export strategies have effects on export
sustainability using the Heckman’s step2 model, and found that the factors
that have positive effects on export sustainability by region and item are:
① targeting overseas Koreans, ② export consigned to export agency, ③

SUMMARY AND IMPLICATIONS 141
obtaining certifications (GAP, HACCP, ISO, organic farming, environment
friendly), ④ exposition or exhibitions utilized consultation and securing
buyers, and ⑤ establishing and managing mid & long-term export plan.
However, the factors having negative effects on export sustainability are: ①
establishing quality management system for product standardization and
uniformity, ② utilizing air transport, and ③ R&D investments. There were
no strategy factors that have statistically conflicted effects on export
sustainability. (<Table 5-3> Refer to G row of Entirety)
<Table 5-3> Company’s characteristics, export strategy, and export performance
Type All Type A Type B1 Type B2 Type C
export performance
characteristics,
export strategy
E P D G S E P D E P D E P D E P D
Experience in export O O O O O O O O O O O O O
Scale O O O
Drive for export O O O O O O
s01: Enhancing production
cost competitivenessO
s03: Pursuing functionality O O O O
s06: custom made,
make-to-orderO O O
s07: Focusing on main items O O O
s10: Focusing on niche
marketsO O
s13: Targeting overseas
KoreansO
s15: Market diversification is
importantO O O
s28: Brand management dept. O O O O
s33: monitoring, post
managementO O O O
s34: Acquiring certifications O O
s36: Labeling in local
languagesO O O O O O
s38: Utilizing co-brands O O O

142 SUMMARY AND IMPLICATIONS
(continue)
Type All Type A Type B1 Type B2 Type C
export performance
characteristics,
export strategy
E P D G S E P D E P D E P D E P D
s39: field survey for market
penetrationO O
s40: Securing buyers via
exhibitionsO O O
s43: Own local PR O O O O
s47: Liaising/collaborating
with local distributorsO O O O O O
s49: Utilizing air transport O
s53: Stable export volume O O O O O
s54: export insurance O O O O
s56: FX risk management O O O O O
s57: R&D investments O O O O
s62: Mid & long-term export
plan managementO O O
s65: Training export
personnelO
Note: O implies that relationship between the relevant explanatory variables and dependent
variables is positive (+) relation. Each export performance E, P, D, G, and S represents
export value per capita, export intensity, market diversification(number of export countries),
export growth rate, and years of continuing export.
Source: Author generated.
□ Export strategy of agri-food firms by type
What are effective export strategy for agri-food exporters by type was an-
alyzed for ① fresh exporters (Type A), ② small scale processed agri-food
exporters (Type B1), ③ medium-size exporters for processed agri-food
(Type B2), ④ consigned production exporters for 4 types of processed ag-
ri-food (Type C). Effective strategies for the companies export performance
by type was quantitatively analyzed. The export performance was examined
by export value per capita, export intensity, and number of export countries
similar to the entire companies analysis (refer to the results of analysis of
companies by type <Table 5-3>). In addition, the results of the surveys and

SUMMARY AND IMPLICATIONS 143
investigation on the company practices complemented the results of quanti-
tative analysis.
The fresh exporters (Type A) include NH, agriculture incorporated com-
panies, agricultural association corporations, dedicated horticultural pro-
duction complex, and fresh agricultural products from specialized trading
companies. Since fresh agricultural products export is under the assumption
of quarantine settlement between the countries, it seems that some strategies
are not effective for improving fresh agricultural products export due to the
characteristics that the countries which the companies can export to are
limited. However, emphasis on a product’s functionality, conforming to la-
beling in local languages, local distribution collaboration, and export risk
management were found to be efficient for improving export value and ex-
port intensity. As a result of analyzing the aspect of the number of export
destination countries, the strategy for securing buyers and company’s own
PR was found to be is needed since the exportable countries (markets) are
limited. Therefore, it likely to be effective for utilizing strategies such as
active market research and securing buyers, and utilizing own brand togeth-
er with co-brands.
The small-scale processed agri-food exporters (Type B1) are composed of
the companies with the less than 10 employees and who export directly
produced products. Their major export items include other processed prod-
ucts, ginseng, processed rice, tea, and so forth. In studying small exporters
of processed agricultural products, it was found that focusing on the current
export markets together with the potential markets, such as niche markets,
and pursuing export stability through export volume and risk management
were effective in improving export performance (export volume per capita,
and export intensity).
However, the statistically significant strategy of expanding the number of
export destination countries for the Type B1 companies export strategy is
smaller than the Type B2 companies (Medium-size processed), which is
bigger in scale. It is because export strategy for small-size companies is
more effective than market diversification for improving the total revenue
or the intensity level of export such as export value or the concentration
level of export. When a company pursues market diversification, it should
be carefully and distinctly considered, since the companies would have lim-

144 SUMMARY AND IMPLICATIONS
itation on expanding the number of export destination countries by only
very strategic activities as seen in the result of our analysis.
Medium-size exporters for processed agri-food (Type B2) have 11 or
more employees exporting directly processing food similar to the Type B1
companies. Their major export items include other processed food, Kimchi,
and ginseng. Pursuing large scale consumer markets, export market mon-
itoring, post export management, collaboration with local distributors, and
R&D investment have positive effects on improving export performance,
rather than using custom made product production, and trying to find niche
markets. However, the big scale companies’ export competencies and goals
by company should be considered since there are many ways to promote
various utilizations of strategy execution.
In the case of consigned production exporters for processed agri-food
(Type C), the companies that export products based on partial or entirely
consigned production, and purchase products and professionally export are
included. According to the above classification, the specialized trading
companies and mid-size food companies are included in the Type C. It is
mainly composed of the companies with the large number of employees or
turnover in a large scale. It seems that these companies fare better by fo-
cusing on improving export performance rather than targeting the Korean
–American markets or niche markets. In addition, it was analyzed that oper-
ating a brand management dept., having own local PR, a local distribution
liaison/collaboration strategy, training export, and have personnel strategies
have significant effects on improving export performance. It was a common
characteristic that the efficacy of strategies was observed if the company is
scaling-up efforts such as training export personnel and running im-
age-branding operations.
□ Policy directions for agri-food firms by type
In the case of exporting fresh agricultural products (type A), it was found
that emphasizing the function of the product, labeling in local languages,
cooperating with local distributors and managing export risk have all im-
proved the export value and export intensity. It was shown that the possi-
bility of expanding the pertinent market for the firms in type A could be

SUMMARY AND IMPLICATIONS 145
increased if they meet the quarantine requirements as well as the conditions
of local marketing and logistics. In addition, since export insurance and
overseas promotions supporting programs are highly participative, the effi-
ciency of export support can be improved by reinforcing policy instruments.
The type B1 and type B2 companies are classified by the scale of
employment. For the small scale processed agri-food exporters (Type B1),
establishing the export strategies, which focus on export stability by export
volume and risk management, and focusing on the current major export
markets targeting potential market such as niche markets, would be efficient
for improving export performance in the short term. For the medium-size
exporters of processed agri-food (Type B2), the strategies for pursuing big
scale consumer markets (rather than niche markets), market diversification,
and R&D investment would be efficient for improving export performance.
Providing information on the new markets and their non-tariff barriers
would enable B1 and B2 firms to advance to these markets, while the firms
in the type B1 can make inroads into new markets if the initial investments
support is preceded. It would be effective for expanding export by giving
support to improve quality and technological competitiveness targeting ni-
che markets on small scale for Type B1. While consistent support by re-
inforcing the previously in place policies for the type B2 companies would
be helpful for their stable export and for of the entire agri-food industry.
The consigned production exporters for processed agri-food (Type C) are
the companies, who are able to specialize in concentrating on marketing
and export, compared to other types. Specifically it seems that the results
showed that such factors as having an image-dedicated dept. and training
export personnel image were shown to be significant for the type C, how-
ever they cannot be executed easily due to their costs and employee
expenses.
Since the firms in type C have competitive strength in export but have
had difficulties in outer factors such as non-tariff barriers to penetrate new
markets, efforts to lower non-tariff barriers in trade negotiations would en-
able Type-C firms to expand their export market. In order to expand the
overall export of the agri-food industry, it is necessary to develop policies
to increase the export intensity of competitive exporters such as Type-C
firms. Therefore, in addition to the policy support for productivity improve-

146 SUMMARY AND IMPLICATIONS
ment of the agri-food firms in general, we advise improving provisions of
overseas market information, and expand the support programs for joint
marketing and logistics infrastructure in export markets for their better uti-
lization by the firms.
