determinants of bank technical efficiency: evidence … · determinants of bank technical...
TRANSCRIPT
Zenebe Lema, Cogent Business & Management (2017), 4: 1268356http://dx.doi.org/10.1080/23311975.2016.1268356
BANKING & FINANCE | RESEARCH ARTICLE
Determinants of bank technical efficiency: Evidence from commercial banks in EthiopiaTadesse Zenebe Lema1*
Abstract: The main objective of this study is to examine the determinants of the technical efficiency of commercial banks in Ethiopia over the period from 2011 to 2014. For this purpose, the study used secondary data from the annual reports of the commercial banks in Ethiopia under study. To estimate the technical ef-ficiency score DEA was employed on input variables (interest expense, operating expense and deposit) and output variables (interest income, non-interest income and loan). The estimated technical efficiency score indicated that, Under the con-stant returns to scale assumption Abay bank, Construction and Business bank and Cooperative bank of Oromia are found to be less efficient, while Nib international bank and Oromia international bank are found to be more efficient. Under the vari-ables returns to scale assumption Construction and Business bank, Abay bank and Cooperative bank of Oromia are found to be less efficient while Oromia international bank, Awash international bank and Wegagen bank are found to be more efficient. It is also confirmed that Oromia international bank and Nib international bank are the most scale efficient commercial banks in Ethiopia compared to the commercial banks incorporated in the study while Berhan international bank and Awash interna-tional bank are the least scale efficient banks. A Tobit model is used to examine the determinants of technical efficiency. Accordingly, it is found that level of capitaliza-tion, liquidity risk, return on asset and market share are found to have positive and significant effect on the technical efficiency score.
Subjects: Microeconomics; Banking; Financial Services Industry
Keywords: technical efficiency; intermediation approach; data envelopment analysis; Tobit model; commercial banks in Ethiopia
*Corresponding author: Tadesse Zenebe Lema, Faculty of Business and Economics, Department of Economics, Debre Tabor University, P.O. Box 272, Debre Tabor, EthiopiaE-mail: [email protected]
Reviewing editor:David McMillan, University of Stirling, UK
Additional information is available at the end of the article
ABOUT THE AUTHORTadesse Zenebe Lema is a lecturer at Debre Tabor University, Ethiopia. His research interest includes Effect, Impact and effectiveness of policies, efficiency analysis, Macroeconomics and Microeconomics. He has published paper dealing with the “Impact of Exchange Rate on Output and Inflation in Korea” and he has one paper under review dealing with the “Analysis of Technical Efficiency of Rice Production in Fogera District of Ethiopia.”
PUBLIC INTEREST STATEMENTIn today’s vibrant and competitive environment the survival of banks in a market highly depends on their resource use efficiency. This study tried to examine the determinants of the technical efficiency of commercial banks in Ethiopia using DEA and Tobit model. The study results confirmed that level of capitalization, liquidity risk, return on asset and market share are the main variables explaining efficiency variations among commercial banks in Ethiopia. Thus, stakeholders should take this into account in their plan to improve efficiency performance.
Received: 03 November 2016Accepted: 01 December 2016Published: 04 January 2017
© 2017 The Author(s). This open access article is distributed under a Creative Commons Attribution (CC-BY) 4.0 license.
Page 1 of 13
Tadesse Zenebe Lema
Page 2 of 13
Zenebe Lema, Cogent Business & Management (2017), 4: 1268356http://dx.doi.org/10.1080/23311975.2016.1268356
1. IntroductionBanks play an important role in an economy of a nation. According to Sergeant (2001), banks con-tribute to investments, employment creation and the process of economic growth and develop-ment. They are the corner stone of an economy of a given nation (Omankhanlen, 2012). They serve as a transmission mechanism for monetary policy (Peek & Rosengren, 2010). The economies of all nations depend on the efficient operation of a complex and delicately balance system of money and credit. Banks provide the bulk of money supply and are the primary means of facilitating the flow of credit (Omankhanlen, 2012). Given this fact, over the period 2011–2015, the government of Ethiopia prepared a growth and transformation plan (GTP) directed towards achieving Ethiopia’s long-term vision and sustained the rapid and broad-based economic growth performance. For this purpose, banks are given the role of rendering efficient and effective loan service for those investors engaged in industrial development field and to mobilize resources needed for implementing the plan (GoE, 2010). According to Keatinge (2014), the development of private banking system is considered im-portant to Ethiopia’s economic progress and a key to the success of the country’s GTP.
For banks to effectively play the aforesaid role, they should be efficient in transforming their ex-pensive inputs into various financial products and services. According to Rozzani and Rahman (2013), banks should be able to function efficiently to ensure their contribution to overall economic growth. In a vibrant and competitive banking system, only strong, technically efficient and profitable banks can promise a realistic return to their stakeholders and reduce the probability of bankruptcy (Adusei, 2016). It is also indicated that an efficient banking sector will be better able to withstand negative shocks and contribute to the stability of the financial system (Delis & Papanikolaou, 2009). Thus, it is crucial to analyze the efficiency performance of banks and the factors behind their efficiency perfor-mance. Previous studies showed that commercial bank in Ethiopia recorded varied efficiency score over the first GTP I period. That is, some of the commercial banks are deemed to be efficient while others, specially the government banks are found to be inefficient (Alemu, 2016). Thus, it is crucial to study the environmental factors behind such diverse efficiency score among commercial banks in Ethiopia and formulate appropriate strategy to address the inefficiency.
Studies have been conducted to examine the determinants of efficiency of banks in different parts of the world. For instance, Sufian (2009) estimated the determinants of Malaysian banks’ efficiency using a Multivariate Tobit regression. The author considered three alternative approaches which in-clude the operating approach, value added approach and intermediation approach. Accordingly, in the intermediation approach, size of the banks’ total assets has positive and significant effect on bank efficiency, while bank deposit, bank management quality and bank size have negative and significant effect. In the operating approach; Bank loan intensity (ratio of total loan to total bank asset), bank risk, diversification towards non-interest income are found to have positive and signifi-cant effect on bank efficiency, while Bank management quality, return on assets, GDP have negative and significant effect on bank efficiency. The results based on the Value-added approach also revealed that bank loan intensity, diversification towards non-interest income, return on assets have positive and significant effect on bank efficiency, while Bank management quality, total book value of shareholders equity over total assets, GDP have negative and significant effect.
Seelanatha (2012) evaluated the drivers of Technical Efficiency (TE) of Sri Lankan Commercial Banks over the period 1989–2009 using an ordinary least square method. The author used four alter-native approaches which include the TE in asset transformation, TE in intermediation, the super TE in asset transformation and the super TE in intermediation. Under TE in the asset transformation; op-erational risk, change in market capitalization and inflation have positive and significant effect on technical efficiency while assets quality, capital strength, profitability, product quality, purchased funds, market share and liquidity have negative and significant effect. Under the TE in intermediation approach; gross interest margin, operational risk, purchased funds, inflation, ownership structure and age have positive and significant effect on technical efficiency while market share has negative and significant effect on technical efficiency. Under the super TE in asset transformation; operational risk and change in market capitalization have positive and significant effect while assets quality and
Page 3 of 13
Zenebe Lema, Cogent Business & Management (2017), 4: 1268356http://dx.doi.org/10.1080/23311975.2016.1268356
liquidity have negative effect on technical efficiency. Finally under the super TE in intermediation approach; gross interest margin and ownership structure have positive and significant effect on technical efficiency while market share have negative and significant effect on technical efficiency.
Alrafadi, Kamaruddin, and Yusuf (2014) estimated the determinants of the efficiency of Libyan Banks over the period 2004–2010 using Tobit model. The study revealed that return on assets, size of operation, capital adequacy and government link of bank and efficiency have positive and signifi-cant effect on overall technical efficiency, while risk, bank size, mergers and ownership structure have negative and significant effect on overall technical efficiency. It has also shown that return on assets, size of operation, capital adequacy and government link of bank and efficiency have positive and significant effect on pure technical efficiency, while risk, bank size, mergers and ownership structure have negative and significant effect on pure technical efficiency.
Řepková (2015) evaluated the Banking efficiency determinants in the Czech Banking Sector over the period 2001–2012 using ordinary least square method. The study revealed that the level of capi-talization, liquidity risk and riskiness of portfolio have positive and significant effect on banks effi-ciency while return on asset, interest rate and GDP have negative and significant effect on banks efficiency. Singh and Fida (2015) estimated the determinants of the Technical efficiency of Oman banking sector using Tobit model. The study revealed that capital adequacy, liquidity and profitability have positive and significant effect on technical efficiency, while Bank size has positive but insignificant effect.
Sharma, Gounder, and Xiang (2015) examined the determinants of foreign Bank efficiency in a Pacific Island Country using the General Method of Moment (GMM). The author grouped the covari-ates in the GMM model into Bank-specific factors, Industry-specific factors and Macroeconomic fac-tors and three models are estimated. Accordingly, from the bank-specific factors Credit risk is found to have positive and significant effect, while personal expense and capital risk have negative and significant effect. From the Industry-specific factors, credit risk is found to have positive and signifi-cant effect on bank efficiency, while personal expense has negative and significant effect. From macroeconomic factors it is shown that credit risk has positive and significant effect on bank effi-ciency, while personal expense has negative and significant effect.
Adusei (2016) examined the determinants of the technical efficiency in rural and community banks in Ghana using binary logit. Due to Multicollinearity problem between fund quality and bank size two models are estimated. Accordingly, the results from the logit model without fund quality revealed that return on Assets has positive and significant effect on technical efficiency while Bank size, credit risk and capitalization have negative and significant effect on technical efficiency. On the other hand, the results from logit model without bank size showed that return on assets and credit risk have positive and significant effect on technical efficiency, while capitalization and fund quality have negative and significant effect. Tesfay (2016) examined the determinants of commercial Banks efficiency in Ethiopia over the period 2003–2012 using Tobit model. The study results revealed that deposit liquidity is found to have positive and significant effect on bank efficiency, while bank size has negative and significant effect on bank efficiency. The remaining covariates which include Profitability, loan quality, expenses, bank size and diversification did not have significant effect on bank efficiency.
Despite the efforts made to examine the determinants of banks efficiency in different parts of the world studies regarding the commercial banks in Ethiopia is scanty. The study conducted by Tesfay (2016) fails to incorporate many relevant variables like level of capitalization, ownership structure and market concentration in efficiency/inefficiency model. On the other hand, the current study emphasized on the GTP I period and thus different from that of Tesfay (2016). Moreover, the govern-ment of Ethiopia is implementing the second GTP II and banks are supposed to play a vital role for the achievement of this plan. Thus, evaluating the determinants of the technical efficiency of com-mercial banks over the GTP I period and indicating solutions to improve efficiency is crucial to
Page 4 of 13
Zenebe Lema, Cogent Business & Management (2017), 4: 1268356http://dx.doi.org/10.1080/23311975.2016.1268356
improve their role for the GTP II. Thus, using DEA and Tobit model, this study tried to examine the determinants of technical efficiency of commercial banks in Ethiopia over the period 2011–2014.
2. MethodologyThis study aimed at examining the determinants of the technical efficiency of commercial banks in Ethiopia. The following section presents a discussion on the data type and source and the method of analysis used to attain the objective of interest.
2.1. Data type and sourceThe Ethiopian financial system consists of 19 Banks, of which 16 are private banks (Abay Bank [AB], Addis International Bank [AIB], Awash International Bank [AWIB], Bank of Abyssinia [BA], Berhan International Bank [BRIB], Bunna International Bank [BUIB], Cooperative Bank of Oromia [CBO], Dashen Bank [DB], Debub Global Bank [DGB], Enat Bank [EB], Lion International Bank [LIB], Nib International Bank [NIB], Oromia International Bank [OIB], United Bank [UB], Wegagaen Bank [WB] and Zemen Bank [ZB]) and the remaining three are state-owned banks (Commercial Bank of Ethiopia [CBE], Development Bank of Ethiopia [DBE] and Construction and Business Bank [CBB] (Keatinge, 2014). Due to data limitation; EB, DGB, AIB and DBE are not part of this study. This study examined the determinants of the technical efficiency score of the remaining 15 commercial banks in Ethiopia over the GTP I period (from 2011 to 2015). Nonetheless, due to lack of data for some commercial banks in Ethiopia, the year 2015 is not part of this study and only the period from 2011 to 2014 is considered. For this purpose, secondary data on input variables (interest expense, operating ex-pense and deposit) and output variables (interest income, non-interest income and loan) are col-lected from the income statement and balance sheet of those commercial banks. Secondary data for variables in the Tobit model which are the level of capitalization, liquidity risk, return on assets, bank size, credit risk, market concentration1, ownership structure and market share is also collected from the income statement and balance sheet of the aforesaid commercial banks.
2.2. Variables definition and measurementsTable 1 presents the list of variables both in the DEA model and the Tobit model with their respective definition and measurement.
2.3. Method of analysisThis study adopts descriptive statistics like mean, standard deviation, minimum and maximum to describe variables in the DEA model, variables in the Tobit regression model and the efficiency distri-bution of the commercial banks in Ethiopia under study. The technical efficiency score of each com-mercial bank under study is estimated using the DEA. Tobit model is used to examine the determinants of the efficiency score of the commercial banks in Ethiopia.
2.3.1. Data envelopment analysisThere are two common approaches to measure the efficiency of DMUs, which are the parametric (econometric) and non-parametric (mathematical) techniques. The popular parametric technique is the Stochastic Frontier Approach (SFA), while that of non-parametric is the Data Envelopment Analysis (DEA) (Raphael, 2013). The major weakness of DEA as compared especially to the SFA is the fact that it does assume no random error such as measurement error (Raphael, 2012). Nonetheless, DEA does not require a prior specification about the underlying technology and it can accommodate multiple inputs and outputs (Raphael, 2013). As a result, it has got preference in the analysis of technical efficiency of DMUs particularly banks and financial institutions. DEA involves the use of a linear programming to construct a non-parametric piece-wise frontier over the data (Řepková, 2015). DEA can be either input oriented or output oriented. In the former case, efficiency is defined as the maximum possible proportional reduction in input usage, given output, while the latter case defines efficiency as a maximum proportional increase in output given input (Coelli & Rao, 2005). Given that banks have more control over the input than the output; input-oriented DEA is employed in this study. Accordingly, assuming N inputs and M outputs for each of i firms, the mathematical

Page 5 of 13
Zenebe Lema, Cogent Business & Management (2017), 4: 1268356http://dx.doi.org/10.1080/23311975.2016.1268356
programming problem to maximize the efficiency measure for the ith firm subject to the constraints that all efficiency measures must be less than or equal to one is given as (Coelli & Rao, 2005):
where, u is an M × 1 vector of output weight and v is N × 1 vector of input weight. The problem with Equation (1) is that it has an infinite number of solutions. To address this problem, the following formulation is considered imposing the constraint v′xi = 1.
(1)max u, v
(u′qj
v′xi
),
stu�qj
v�xj≤ 1, j = 1, 2 … I
u, v ≥ 0
(2)max �, V(u′qi
),
st V �Xi = 1,
u�qj − V�Xj ≤ 0, j = 1, 2 … I
Table 1. The variables in the DEA and Tobit modelS. No. Variable Variable name Measurement Expected relationship Variables in the DEA model (3 input variables and 3 output variables respectively)
1 IE Interest expense The sum of payment on fixed deposits, saving and demand deposits
2 OE Operating expense Expenses like salary and benefits, administrative and general expense, provision for doubtful debt and other and audit fee
3 DD Deposit The sum of demand, time and saving deposit
4 II Interest income The sum of interest on loans and advance, interest on deposits and interest on treasury and NBE bills
5 NII Non-interest income Commission, fees and charges on letter of credit, on letter of guarantee and local transfer and other income
6 L Loan Include real estate loan, commercial loan, industrial loan and consumer loan
Variables in the Tobit model (the first is the dependent variable and the rest are explanatory variables)
TE
1 LC Level of capitalization The ratio of equity to total assets Positive
2 LR Liquidity risk The ratio of loans to deposits Positive
3 RA Return on asset The ratio of net income to total assets
Positive
4 BS Bank size Size of operation or natural log of total assets
Positive
5 CR Credit risk The ratio of loans to assets (Total loans/total Assets)
Negative
6 OS Ownership structure Dummy variable that takes a value of 1 for government ownership 0 otherwise
Negative
7 MS Market share Total assets of one bank to the total assets of all banks
Positive
8 MC Market concentration HHI-the sum of the squared market share value of each bank in the banking sector
Negative

Page 6 of 13
Zenebe Lema, Cogent Business & Management (2017), 4: 1268356http://dx.doi.org/10.1080/23311975.2016.1268356
where μ and V are the same with the u and v in Equation (1). Based on the concept of duality, an equivalent envelopment form of the above linear programming model is given by Equation (3).
where θ is scalar, � is an I × 1 vector of constants and � ≤ 1. In the Charnes, Cooper and Rhodes (1978) (CCR) model above a constant returns to scale (CRS) is assumed where by scale of operation and efficiency of DMUs are unrelated. As a result, the model provides an overall technical efficiency score (Řepková, 2015). The CRS assumption is true when all DMUs are operating at an optimal scale. But, in reality, DMUs might experience either economies of scale or diseconomies of scale. When not all DMUs are operating at an optimal scale, technical efficiency score estimated by the CCR model will be contaminated with scale efficiencies (Řepková, 2015). The Banker, Charnes, Cooper (1984) (BCC) model addressed this by assuming a VRS and is given by Equation (4).
where I1 is an I × 1 vectors of ones. In the BCC model, technical efficiency score is decomposed into pure technical efficiency score and scale efficiency score (Alrafadi et al., 2014). Let the CCR model and BCC model efficiency score of a DMUs be �k,CRS and �k,VRS, respectively. Then the scale efficiency (SE) is given by, SE =
�k,CRS
�k,VRS=
�k,CCR
�k,BCC. Overall technical efficiency score on the other hand is given by
OTE = PTE × SE.
2.3.2. The Tobit modelThe technical efficiency score is calculated using DEA model falls within the interval 0 and 1, i.e. 0 ≤ θ ≤ 1 and thus, it is a limited dependent variable. Tobit model2 is believed to handle the charac-teristics of the distribution of the efficiency score and as such appropriate model to use (Sufian, 2009). The Tobit model to be estimated is given by Equation (5) (Henningsen, 2010).
where yit is observed dependent variable, y∗it is a latent variable, xit is a vector of explanatory variables, βi are parameters to be estimated, L is the lower limit, U is the upper limit, i = 1, 2, …, N representing individuals, t = 1, 2, …, Tt indicates the time period, Tt is the number of time periods, μt is time invariant individual specific effect and vit is a random term. The empirical regression model is specified as:
�, V ≥ 0
(3)min�,��,
st − qi + Q� ≥ 0
�Xi − X� ≥ 0
� ≥ 0
(4)min�,��,
st − qi + Q� ≥ 0
�Xi − X� ≥ 0
I1�� = 1
� ≥ 0
(5)Y∗
it = x∗
it�+ ∈it= x�
it�i + �i + vit
yit =
⎧⎪⎨⎪⎩
L, if y∗it < L
y∗it, if L < y∗it < U
U, if y∗it > U

Page 7 of 13
Zenebe Lema, Cogent Business & Management (2017), 4: 1268356http://dx.doi.org/10.1080/23311975.2016.1268356
where Y is the technical efficiency score of DMUs under study and the rest of variables are as defined before. The explanatory variables in the Tobit model are drawn from previous literature on the subject.
3. Result and discussionThis study is conducted mainly to examine the determinants of the technical efficiency of commer-cial banks in Ethiopia. The section that follows presents the results from a DEA model and Tobit model.
3.1. Descriptive statisticsSelecting the right input and output variables is the most important step in the analysis of the effi-ciency of banks. There are two commonly used approaches to do so; the intermediation approach and the production approach (Karimzadeh, 2012; Ncube, 2009). Literature indicate that the interme-diation approach is convenient for a bank level efficiency study (Tahir & Bakar, 2009) and as a result this study relied on this approach to select the list of input variables (interest expense, operating expense and deposit) and output variables (interest income, non-interest income and loan). Table 2 presents the summary statistics of those variables. As it is shown in Table 2 the banks under study recorded an average interest expense of Birr3 277 million over the period under study. The average operating expense of the commercial banks in Ethiopia under study is determined at Birr 365 million. With these expenses, they are able to mobilize on average Birr 13.869 billion. Coming to the output variables, the commercial banks in Ethiopia under study recorded an interest income, non-interest income and loan of Birr 863 million, Birr 546 million and Birr 7.037 billion, respectively.
To consider interventions that improve the technical efficiency score, it is crucial to have informa-tion regarding the sources of efficiency/inefficiency. This study addressed this by estimating a Tobit model. Table 3 presents the summary statistics of the explanatory variables in the Tobit model.
Y = � + �1LC + �
2LR + �
3RA + �
4BS + �
5CR + �
6OS + �
7MS + �
8MC+ ∈i
Table 2. Descriptive statistics of variables in the DEA model
Source: Author’s computation based on data collected from the banks` annual report (2011–2014).
Variable Obs Mean Std. dev. Min MaxInterested expense in millions of Birr 60 277.73 567.29 1.10 3,436.20
Operating expense in millions of Birr 60 365.57 669.28 15.04 4,073.16
Deposit in millions of Birr 60 13,869.00 34,906.94 263.38 192,275.20
Interest income in millions of Birr 60 863.85 2,112.13 4.90 11,996.59
Noninterest income in millions of Birr 60 546.88 1,072.97 7.44 5,198.82
Loan in millions of Birr 60 7,037.23 1,6340.04 158.00 87,261.70
Table 3. Descriptive statistics of variables in the Tobit model
Source: Author’s computation based on data collected from the banks` annual report (2011–2014).
Variable Obs Mean Std. dev. Min MaxLevel of capitalization 60 0.145 0.053 0.044 0.345
Liquidity risk 60 0.582 0.094 0.405 0.829
Return on asset 60 0.028 0.009 −0.008 0.053
Bank size 60 22.541 1.251 19.940 26.216
Credit risk 60 0.415 0.055 0.293 0.519
Ownership structure 60 0.133 0.343 0.000 1.000
Market share in % 60 6.667 15.790 0.250 66.009
Market concentration 60 4,344.241 155.455 4,081.361 4,475.607
Page 8 of 13
Zenebe Lema, Cogent Business & Management (2017), 4: 1268356http://dx.doi.org/10.1080/23311975.2016.1268356
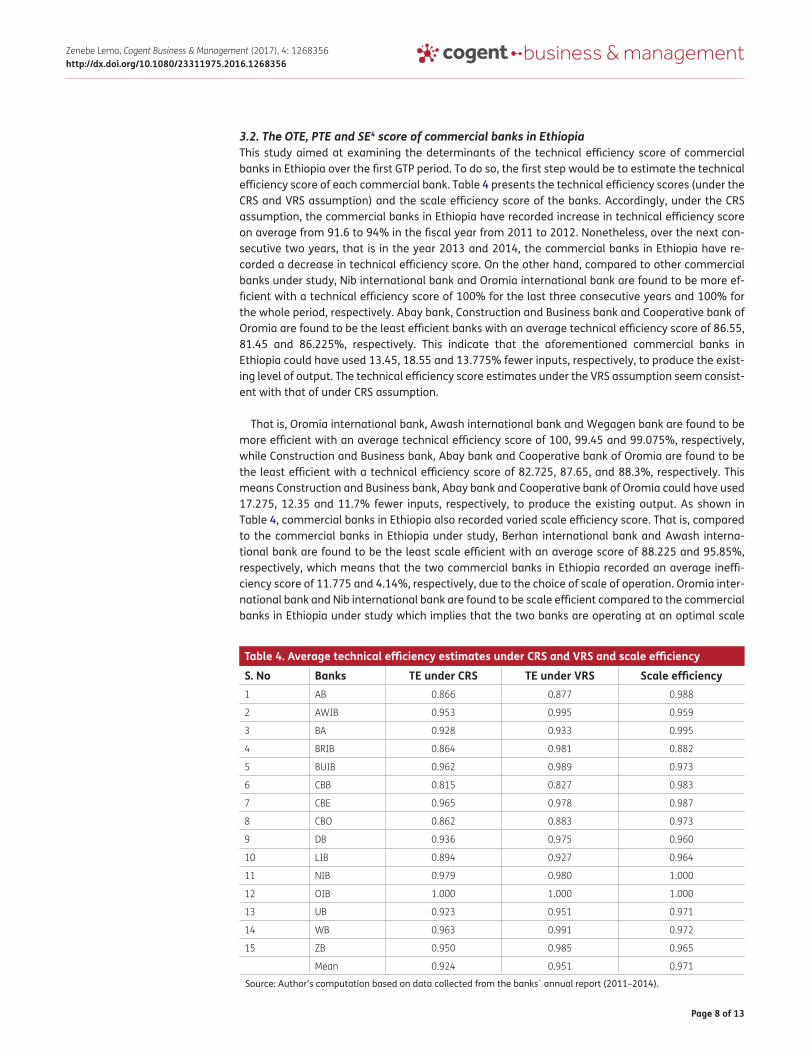
3.2. The OTE, PTE and SE4 score of commercial banks in EthiopiaThis study aimed at examining the determinants of the technical efficiency score of commercial banks in Ethiopia over the first GTP period. To do so, the first step would be to estimate the technical efficiency score of each commercial bank. Table 4 presents the technical efficiency scores (under the CRS and VRS assumption) and the scale efficiency score of the banks. Accordingly, under the CRS assumption, the commercial banks in Ethiopia have recorded increase in technical efficiency score on average from 91.6 to 94% in the fiscal year from 2011 to 2012. Nonetheless, over the next con-secutive two years, that is in the year 2013 and 2014, the commercial banks in Ethiopia have re-corded a decrease in technical efficiency score. On the other hand, compared to other commercial banks under study, Nib international bank and Oromia international bank are found to be more ef-ficient with a technical efficiency score of 100% for the last three consecutive years and 100% for the whole period, respectively. Abay bank, Construction and Business bank and Cooperative bank of Oromia are found to be the least efficient banks with an average technical efficiency score of 86.55, 81.45 and 86.225%, respectively. This indicate that the aforementioned commercial banks in Ethiopia could have used 13.45, 18.55 and 13.775% fewer inputs, respectively, to produce the exist-ing level of output. The technical efficiency score estimates under the VRS assumption seem consist-ent with that of under CRS assumption.
That is, Oromia international bank, Awash international bank and Wegagen bank are found to be more efficient with an average technical efficiency score of 100, 99.45 and 99.075%, respectively, while Construction and Business bank, Abay bank and Cooperative bank of Oromia are found to be the least efficient with a technical efficiency score of 82.725, 87.65, and 88.3%, respectively. This means Construction and Business bank, Abay bank and Cooperative bank of Oromia could have used 17.275, 12.35 and 11.7% fewer inputs, respectively, to produce the existing output. As shown in Table 4, commercial banks in Ethiopia also recorded varied scale efficiency score. That is, compared to the commercial banks in Ethiopia under study, Berhan international bank and Awash interna-tional bank are found to be the least scale efficient with an average score of 88.225 and 95.85%, respectively, which means that the two commercial banks in Ethiopia recorded an average ineffi-ciency score of 11.775 and 4.14%, respectively, due to the choice of scale of operation. Oromia inter-national bank and Nib international bank are found to be scale efficient compared to the commercial banks in Ethiopia under study which implies that the two banks are operating at an optimal scale
Table 4. Average technical efficiency estimates under CRS and VRS and scale efficiency
Source: Author’s computation based on data collected from the banks` annual report (2011–2014).
S. No Banks TE under CRS TE under VRS Scale efficiency1 AB 0.866 0.877 0.988
2 AWIB 0.953 0.995 0.959
3 BA 0.928 0.933 0.995
4 BRIB 0.864 0.981 0.882
5 BUIB 0.962 0.989 0.973
6 CBB 0.815 0.827 0.983
7 CBE 0.965 0.978 0.987
8 CBO 0.862 0.883 0.973
9 DB 0.936 0.975 0.960
10 LIB 0.894 0.927 0.964
11 NIB 0.979 0.980 1.000
12 OIB 1.000 1.000 1.000
13 UB 0.923 0.951 0.971
14 WB 0.963 0.991 0.972
15 ZB 0.950 0.985 0.965
Mean 0.924 0.951 0.971
Page 9 of 13
Zenebe Lema, Cogent Business & Management (2017), 4: 1268356http://dx.doi.org/10.1080/23311975.2016.1268356
(see Appendices A and B). Despite improvement over the period from 2011 to 2012, the Ethiopian banking industry on average recorded a decline in overall technical efficiency, pure technical effi-ciency and scale efficiency scores over the GTP I period particularly after the year 2012.
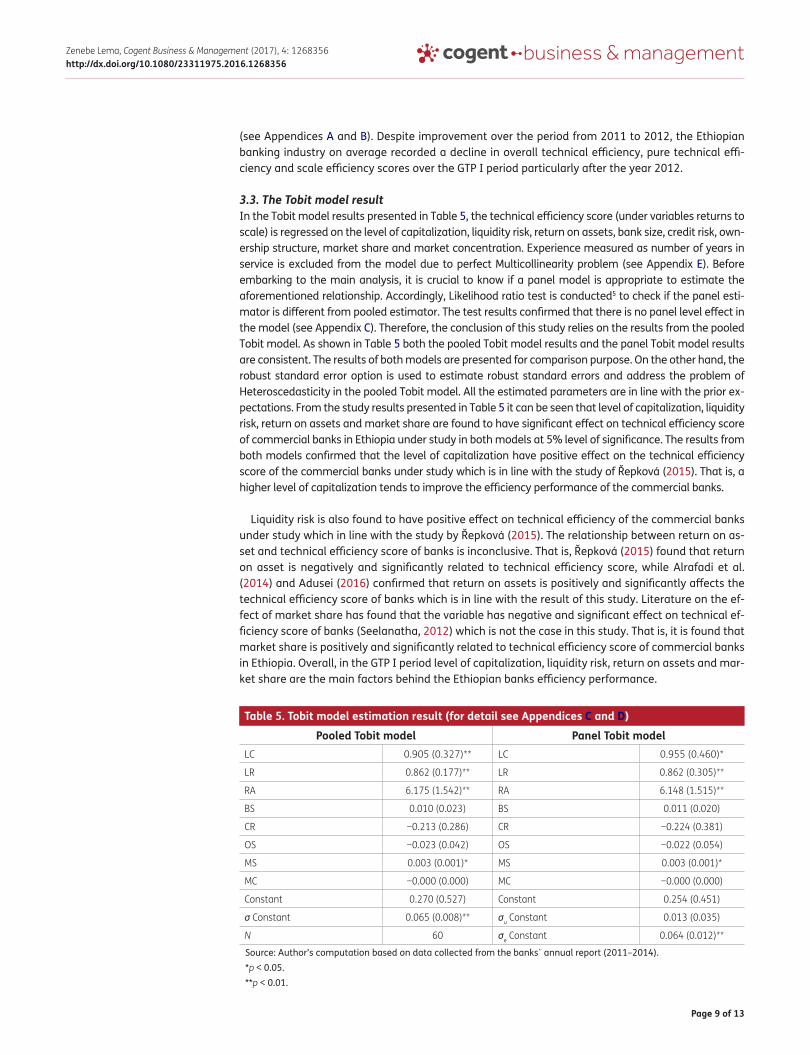
3.3. The Tobit model resultIn the Tobit model results presented in Table 5, the technical efficiency score (under variables returns to scale) is regressed on the level of capitalization, liquidity risk, return on assets, bank size, credit risk, own-ership structure, market share and market concentration. Experience measured as number of years in service is excluded from the model due to perfect Multicollinearity problem (see Appendix E). Before embarking to the main analysis, it is crucial to know if a panel model is appropriate to estimate the aforementioned relationship. Accordingly, Likelihood ratio test is conducted5 to check if the panel esti-mator is different from pooled estimator. The test results confirmed that there is no panel level effect in the model (see Appendix C). Therefore, the conclusion of this study relies on the results from the pooled Tobit model. As shown in Table 5 both the pooled Tobit model results and the panel Tobit model results are consistent. The results of both models are presented for comparison purpose. On the other hand, the robust standard error option is used to estimate robust standard errors and address the problem of Heteroscedasticity in the pooled Tobit model. All the estimated parameters are in line with the prior ex-pectations. From the study results presented in Table 5 it can be seen that level of capitalization, liquidity risk, return on assets and market share are found to have significant effect on technical efficiency score of commercial banks in Ethiopia under study in both models at 5% level of significance. The results from both models confirmed that the level of capitalization have positive effect on the technical efficiency score of the commercial banks under study which is in line with the study of Řepková (2015). That is, a higher level of capitalization tends to improve the efficiency performance of the commercial banks.
Liquidity risk is also found to have positive effect on technical efficiency of the commercial banks under study which in line with the study by Řepková (2015). The relationship between return on as-set and technical efficiency score of banks is inconclusive. That is, Řepková (2015) found that return on asset is negatively and significantly related to technical efficiency score, while Alrafadi et al. (2014) and Adusei (2016) confirmed that return on assets is positively and significantly affects the technical efficiency score of banks which is in line with the result of this study. Literature on the ef-fect of market share has found that the variable has negative and significant effect on technical ef-ficiency score of banks (Seelanatha, 2012) which is not the case in this study. That is, it is found that market share is positively and significantly related to technical efficiency score of commercial banks in Ethiopia. Overall, in the GTP I period level of capitalization, liquidity risk, return on assets and mar-ket share are the main factors behind the Ethiopian banks efficiency performance.
Table 5. Tobit model estimation result (for detail see Appendices C and D)
Source: Author’s computation based on data collected from the banks` annual report (2011–2014).*p < 0.05.**p < 0.01.
Pooled Tobit model Panel Tobit modelLC 0.905 (0.327)** LC 0.955 (0.460)*
LR 0.862 (0.177)** LR 0.862 (0.305)**
RA 6.175 (1.542)** RA 6.148 (1.515)**
BS 0.010 (0.023) BS 0.011 (0.020)
CR −0.213 (0.286) CR −0.224 (0.381)
OS −0.023 (0.042) OS −0.022 (0.054)
MS 0.003 (0.001)* MS 0.003 (0.001)*
MC −0.000 (0.000) MC −0.000 (0.000)
Constant 0.270 (0.527) Constant 0.254 (0.451)
σ Constant 0.065 (0.008)** σu Constant 0.013 (0.035)
N 60 σe Constant 0.064 (0.012)**
Page 10 of 13
Zenebe Lema, Cogent Business & Management (2017), 4: 1268356http://dx.doi.org/10.1080/23311975.2016.1268356
4. Conclusion and direction for future researchThis study is conducted to examine the determinants of technical efficiency of commercial banks in Ethiopia. Technical efficiency score for all banks under study is calculated both under the CRS and VRS assumption. The findings of the study indicated that despite a little difference the conclusion regarding the status of efficiency of the banks are found to be similar under both assumptions. That is, banks that are found less efficient under CRS are also less efficient under the VRS assumption. Under the CRS assumption Abay bank, Construction and Business bank and Cooperative bank of Oromia are found to be less efficient, while under the VRS assumption Construction and Business bank, Abay bank and Cooperative bank of Oromia are found to be less efficient. On the other hand, Nib international bank and Oromia international bank are found to be more efficient under the CRS assumption, while Oromia international bank, Awash international bank and Wegagen bank are found to be more efficient under the VRS assumption. It is also confirmed that Oromia international bank and Nib international bank are the most scale efficient commercial banks in Ethiopia compared to the commercial banks incorporated in the study, while Berhan international bank and Awash in-ternational bank are the least scale efficient banks. Given the fact that the main aim of this study is examining the technical efficiency score of the commercial banks in Ethiopia, a Tobit model is esti-mated. As it is presented in Appendix C there is no panel level effect in the Tobit model. Accordingly, this study relied on the pooled Tobit model result to explain the relationship between technical ef-ficiency score and its covariates. The results showed that level of capitalization, liquidity risk, return on assets and market share have positive and significant effect on the technical efficiency score of the commercial banks under study while banks size, credit risk, ownership structure and market concentration are found to be less significant variables. Therefore, to improve efficiency perfor-mance, the banks in Ethiopia under study should consider the following recommendations:
• The Ethiopian banks under study should improve their level of capitalization by increasing the level of equity relative to the respective total assets.
• Beside deposit mobilization, the Ethiopian banks under study should improve their lending capacity.
• The Ethiopian banks efficiency performance is positively correlated with the return on assets. Thus, efforts should be made to improve the return on assets.
4.1. Direction for future researchFuture studies could be conducted to confirm this result by incorporating the last GTP I period (i.e. the year 2015).
FundingThe author received no direct funding for this research.
Author detailsTadesse Zenebe Lema1
E-mail: [email protected] ID: http://orcid.org/0000-0002-2153-55361 Faculty of Business and Economics, Department of
Economics, Debre Tabor University, P.O. Box 272, Debre Tabor, Ethiopia.
Citation informationCite this article as: Determinants of bank technical efficiency: Evidence from commercial banks in Ethiopia, Tadesse Zenebe Lema, Cogent Business & Management (2017), 4: 1268356.
Notes1. Market concentration is determined using the Herfind-
ahl–Hirschman Index (HHI) which is calculated by squar-ing the market share of all firms in a market and then
summing the square. That is, HHI =n∑i=1
(MS)2.
2. The technical efficiency score of commercial banks in Ethiopia lies between 0 and 1 and many observation are distributed around the upper boundary indicating that Tobit model is more appealing than Ordinary least square.
3. Birr is the unit of currency in Ethiopia.4. OTE, PTE and SE refers to overall technical efficiency, pure
technical efficiency and scale efficiency, respectively.5. The null of likelihood ratio test is that there is no
panel- level effects while the alternative one is there is panel-level effects. The test result produced insignificant probability value implying that we fail to reject the null hypothesis (Appendix B).
ReferencesAdusei, M. (2016). Determinants of bank technical efficiency:
Evidence from rural and community banks in Ghana. Cogent Business & Management, 1199519.
Alemu, F. Z. (2016). Evaluating the technical efficiency of commercial banks in Ethiopia: A data envelopment analysis. European Journal of Business and Management, 8, 37–45.
Page 11 of 13
Zenebe Lema, Cogent Business & Management (2017), 4: 1268356http://dx.doi.org/10.1080/23311975.2016.1268356
Alrafadi, K. M., Kamaruddin, B. H., & Yusuf, M. (2014). Efficiency and determinants in Libyan banking. International Journal of Business and Social Science, 5, 156–168.
Banker, R. D., Charnes, A., & Cooper, W. W. (1984). Some models for estimating technical and scale inefficiencies in data envelopment analysis. Management Science, 30, 1078–1092.
Charnes, A., Cooper, W. W., & Rhodes, E. (1978). Measuring the efficiency of decision making units. European Journal of Operational Research, 2, 429–444.
Coelli, T. J., & Rao, D. S. (2005). Total factor productivity growth in agriculture: A Malmquist index analysis of 93 countries, 1980–2000. Agricultural Economics, 32, 115–134. http://dx.doi.org/10.1111/agec.2005.32.issue-s1
Delis, M. D., & Papanikolaou, N. I. (2009). Determinants of bank efficiency: Evidence from a semi parametric methodology. Managerial Finance, 35, 260–275. http://dx.doi.org/10.1108/03074350910931771
GoE. (2010). ‘Growth and transformation plan (GTP) 2010/11 2014/15’, draft. Addis Ababa: Ministry of Finance and Economic Development, Government of Ethiopia.
Henningsen, A. (2010). Estimating censored regression models in R using the censReg Package. København: University of Copenhagen.
Karimzadeh, M. (2012). Efficiency analysis by using data envelop analysis model: Evidence from Indian banks. International Journal of Latest Trends in Finance and Economic Sciences, 2, 228–237.
Keatinge, T. (2014). The role of public and private sector banking in ethiopia’s future economic growth. Policy brief. Global Center on Cooperative Security: Building Strong Partnerships for a more secure world.
Ncube, M. (2009). Efficiency of the banking sector in South Africa (pp. 1–44). Johannesburg: University of the Witwatersrand.
Omankhanlen, A. E. (2012). The role of banks in capital formation and economic growth: The case of Nigeria. Economy Transdisciplinarity Cognition, 15, 103–112.
Peek, J., & Rosengren, E. S. (2010). The role of banks in the transmission of monetary policy. Oxford: Oxford University Press.
Raphael, G. (2012). Commercial banks efficiency in Tanzania: A non-parametric approach. European Journal of Business and Management, 55–67.
Raphael, G. (2013). Efficiency of commercial banks in east Africa: A non-parametric approach. International Journal of Business and Management, 8, 50–64.
Řepková, I. (2015). Banking efficiency determinants in the Czech banking sector. Procedia Economics and Finance, 23, 191–196.
Rozzani, N., & Rahman, R. A. (2013). Determinants of bank efficiency: Conventional versus Islamic. International Journal of Business and Management, 8, 98–109.
Seelanatha, S. L. (2012). Drivers of technical efficiency of Sri Lankan commercial banks‟. International Journal of Applied Economics, 9, 41–58.
Sergeant, K. A. (2001). The role of commercial banks in financing growth and economic development in Trinidad and Tobago and the Caribbean: A perspective from the royal bank of Trinidad and Tobago. Belize: Central Bank of Belize.
Sharma, P., Gounder, N., & Xiang, D. (2015). Level and determinants of foreign bank efficiency in a pacific island country. Review of Pacific Basin Financial Markets and Policies, 18(1), 1–25. http://dx.doi.org/10.1142/S0219091515500058
Singh, D., & Fida, B. A. (2015). Technical efficiency and its determinants: An empirical study on banking sector of Oman. Problems and Perspectives in Management, 13, 168–175.
Sufian, F. (2009). Determinants of bank efficiency during unstable macroeconomic environment: Empirical evidence from Malaysia. Research in International Business and Finance, 23, 54–77. http://dx.doi.org/10.1016/j.ribaf.2008.07.002
Tahir, I. M., & Bakar, N. M. A. (2009). Evaluating efficiency of Malaysian banks using data envelopment analysis. International Journal of Business and Management, 4, 96–106.
Tesfay, T. (2016). Determinants of commercial banks efficiency: Evidence from selected commercial banks of Ethiopia. International Journal of Scientific and Research Publications, 6, 551–556.
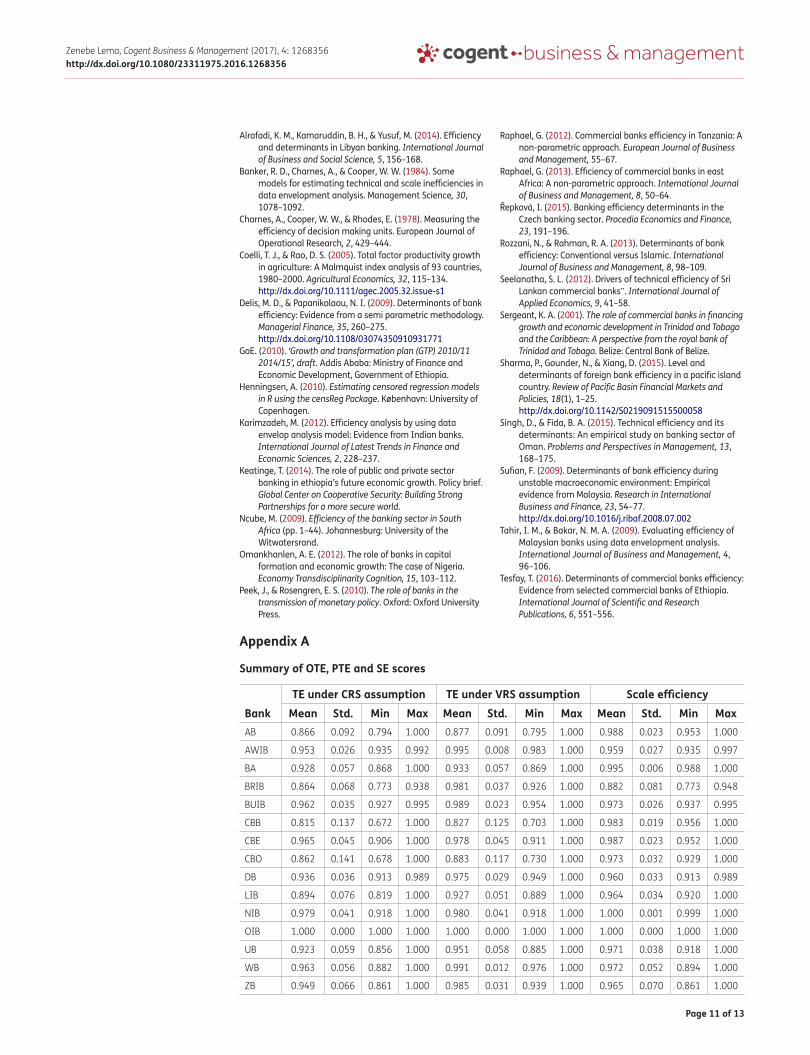
Appendix A
Summary of OTE, PTE and SE scores
Bank TE under CRS assumption TE under VRS assumption Scale efficiency
Mean Std. Min Max Mean Std. Min Max Mean Std. Min MaxAB 0.866 0.092 0.794 1.000 0.877 0.091 0.795 1.000 0.988 0.023 0.953 1.000
AWIB 0.953 0.026 0.935 0.992 0.995 0.008 0.983 1.000 0.959 0.027 0.935 0.997
BA 0.928 0.057 0.868 1.000 0.933 0.057 0.869 1.000 0.995 0.006 0.988 1.000
BRIB 0.864 0.068 0.773 0.938 0.981 0.037 0.926 1.000 0.882 0.081 0.773 0.948
BUIB 0.962 0.035 0.927 0.995 0.989 0.023 0.954 1.000 0.973 0.026 0.937 0.995
CBB 0.815 0.137 0.672 1.000 0.827 0.125 0.703 1.000 0.983 0.019 0.956 1.000
CBE 0.965 0.045 0.906 1.000 0.978 0.045 0.911 1.000 0.987 0.023 0.952 1.000
CBO 0.862 0.141 0.678 1.000 0.883 0.117 0.730 1.000 0.973 0.032 0.929 1.000
DB 0.936 0.036 0.913 0.989 0.975 0.029 0.949 1.000 0.960 0.033 0.913 0.989
LIB 0.894 0.076 0.819 1.000 0.927 0.051 0.889 1.000 0.964 0.034 0.920 1.000
NIB 0.979 0.041 0.918 1.000 0.980 0.041 0.918 1.000 1.000 0.001 0.999 1.000
OIB 1.000 0.000 1.000 1.000 1.000 0.000 1.000 1.000 1.000 0.000 1.000 1.000
UB 0.923 0.059 0.856 1.000 0.951 0.058 0.885 1.000 0.971 0.038 0.918 1.000
WB 0.963 0.056 0.882 1.000 0.991 0.012 0.976 1.000 0.972 0.052 0.894 1.000
ZB 0.949 0.066 0.861 1.000 0.985 0.031 0.939 1.000 0.965 0.070 0.861 1.000
Page 12 of 13
Zenebe Lema, Cogent Business & Management (2017), 4: 1268356http://dx.doi.org/10.1080/23311975.2016.1268356
Appendix B
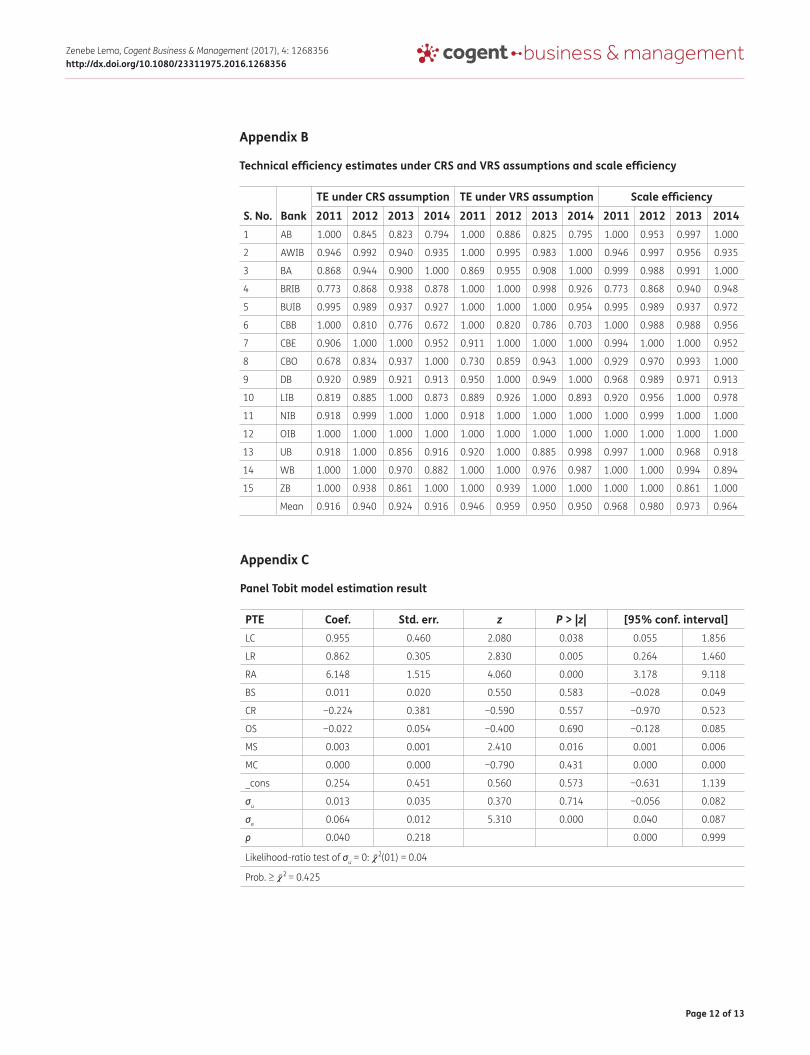
Technical efficiency estimates under CRS and VRS assumptions and scale efficiency
S. No. BankTE under CRS assumption TE under VRS assumption Scale efficiency2011 2012 2013 2014 2011 2012 2013 2014 2011 2012 2013 2014
1 AB 1.000 0.845 0.823 0.794 1.000 0.886 0.825 0.795 1.000 0.953 0.997 1.000
2 AWIB 0.946 0.992 0.940 0.935 1.000 0.995 0.983 1.000 0.946 0.997 0.956 0.935
3 BA 0.868 0.944 0.900 1.000 0.869 0.955 0.908 1.000 0.999 0.988 0.991 1.000
4 BRIB 0.773 0.868 0.938 0.878 1.000 1.000 0.998 0.926 0.773 0.868 0.940 0.948
5 BUIB 0.995 0.989 0.937 0.927 1.000 1.000 1.000 0.954 0.995 0.989 0.937 0.972
6 CBB 1.000 0.810 0.776 0.672 1.000 0.820 0.786 0.703 1.000 0.988 0.988 0.956
7 CBE 0.906 1.000 1.000 0.952 0.911 1.000 1.000 1.000 0.994 1.000 1.000 0.952
8 CBO 0.678 0.834 0.937 1.000 0.730 0.859 0.943 1.000 0.929 0.970 0.993 1.000
9 DB 0.920 0.989 0.921 0.913 0.950 1.000 0.949 1.000 0.968 0.989 0.971 0.913
10 LIB 0.819 0.885 1.000 0.873 0.889 0.926 1.000 0.893 0.920 0.956 1.000 0.978
11 NIB 0.918 0.999 1.000 1.000 0.918 1.000 1.000 1.000 1.000 0.999 1.000 1.000
12 OIB 1.000 1.000 1.000 1.000 1.000 1.000 1.000 1.000 1.000 1.000 1.000 1.000
13 UB 0.918 1.000 0.856 0.916 0.920 1.000 0.885 0.998 0.997 1.000 0.968 0.918
14 WB 1.000 1.000 0.970 0.882 1.000 1.000 0.976 0.987 1.000 1.000 0.994 0.894
15 ZB 1.000 0.938 0.861 1.000 1.000 0.939 1.000 1.000 1.000 1.000 0.861 1.000
Mean 0.916 0.940 0.924 0.916 0.946 0.959 0.950 0.950 0.968 0.980 0.973 0.964
Appendix C
Panel Tobit model estimation result
PTE Coef. Std. err. z P > |z| [95% conf. interval]LC 0.955 0.460 2.080 0.038 0.055 1.856
LR 0.862 0.305 2.830 0.005 0.264 1.460
RA 6.148 1.515 4.060 0.000 3.178 9.118
BS 0.011 0.020 0.550 0.583 −0.028 0.049
CR −0.224 0.381 −0.590 0.557 −0.970 0.523
OS −0.022 0.054 −0.400 0.690 −0.128 0.085
MS 0.003 0.001 2.410 0.016 0.001 0.006
MC 0.000 0.000 −0.790 0.431 0.000 0.000
_cons 0.254 0.451 0.560 0.573 −0.631 1.139
σu 0.013 0.035 0.370 0.714 −0.056 0.082
σe 0.064 0.012 5.310 0.000 0.040 0.087
ρ 0.040 0.218 0.000 0.999
Likelihood-ratio test of σu = 0: �̄�2(01) = 0.04
Prob. ≥ �̄�2 = 0.425
Page 13 of 13
Zenebe Lema, Cogent Business & Management (2017), 4: 1268356http://dx.doi.org/10.1080/23311975.2016.1268356
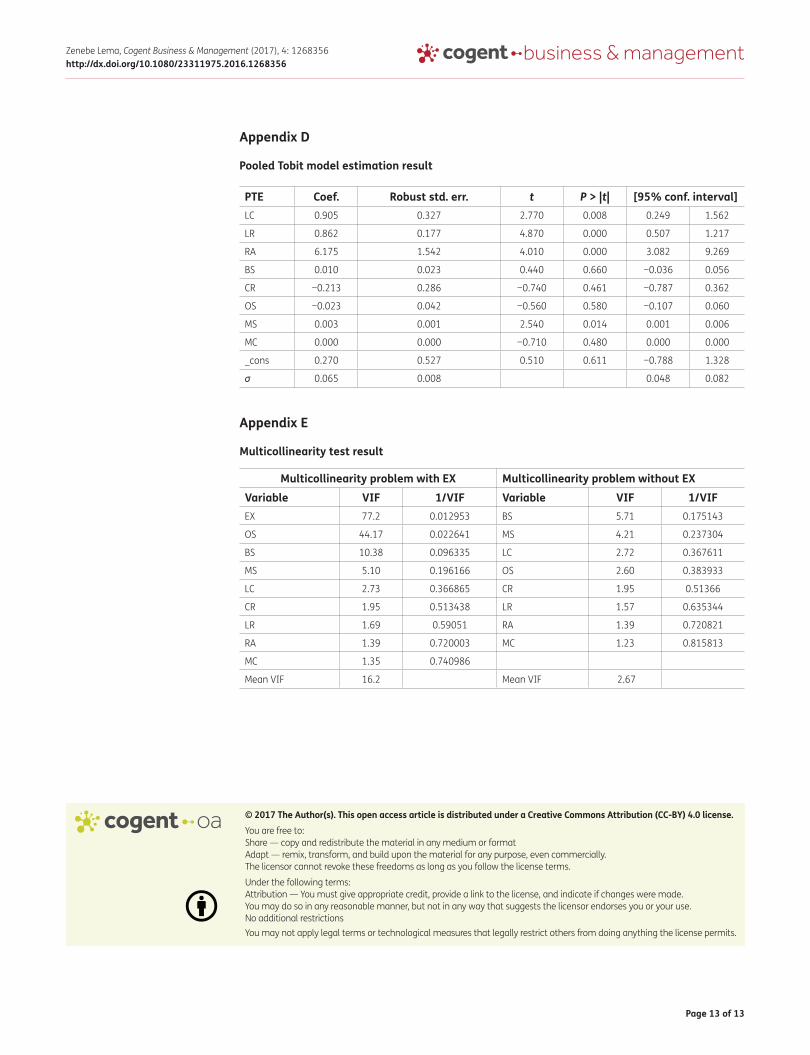
Appendix D
Pooled Tobit model estimation result
PTE Coef. Robust std. err. t P > |t| [95% conf. interval]LC 0.905 0.327 2.770 0.008 0.249 1.562
LR 0.862 0.177 4.870 0.000 0.507 1.217
RA 6.175 1.542 4.010 0.000 3.082 9.269
BS 0.010 0.023 0.440 0.660 −0.036 0.056
CR −0.213 0.286 −0.740 0.461 −0.787 0.362
OS −0.023 0.042 −0.560 0.580 −0.107 0.060
MS 0.003 0.001 2.540 0.014 0.001 0.006
MC 0.000 0.000 −0.710 0.480 0.000 0.000
_cons 0.270 0.527 0.510 0.611 −0.788 1.328
σ 0.065 0.008 0.048 0.082
Appendix E
Multicollinearity test result
Multicollinearity problem with EX Multicollinearity problem without EXVariable VIF 1/VIF Variable VIF 1/VIFEX 77.2 0.012953 BS 5.71 0.175143
OS 44.17 0.022641 MS 4.21 0.237304
BS 10.38 0.096335 LC 2.72 0.367611
MS 5.10 0.196166 OS 2.60 0.383933
LC 2.73 0.366865 CR 1.95 0.51366
CR 1.95 0.513438 LR 1.57 0.635344
LR 1.69 0.59051 RA 1.39 0.720821
RA 1.39 0.720003 MC 1.23 0.815813
MC 1.35 0.740986
Mean VIF 16.2 Mean VIF 2.67
© 2017 The Author(s). This open access article is distributed under a Creative Commons Attribution (CC-BY) 4.0 license.You are free to: Share — copy and redistribute the material in any medium or format Adapt — remix, transform, and build upon the material for any purpose, even commercially.The licensor cannot revoke these freedoms as long as you follow the license terms.
Under the following terms:Attribution — You must give appropriate credit, provide a link to the license, and indicate if changes were made. You may do so in any reasonable manner, but not in any way that suggests the licensor endorses you or your use. No additional restrictions You may not apply legal terms or technological measures that legally restrict others from doing anything the license permits.