determinants of business companies’ economic performance
TRANSCRIPT

Vol. 14(1), pp. 35-52, January, 2020
DOI: 10.5897/AJBM2018.8740
Article Number: 451594562745
ISSN: 1993-8233
Copyright© 2020
Author(s) retain the copyright of this article
http://www.academicjournals.org/AJBM
African Journal of Business Management
Full Length Research Paper
Determinants of business companies’ economic performance in Burkina Faso
Zakaya Ramde
Chamber of Commerce and Industry, Burkina Faso.
Received 31 December, 2018 ; Accepted 11 April, 2019
This study examines the determinants of entreprises economic performance in trade, industry and services sectors in Burkina Faso. Based on data from a sample of 179 companies of 2013 financial statements, various analyzes highlight effects of economic, financial, environmental and managements variables on company performance. The results of econometric estimations using the logit model show the significance of investments, seniority or companies ages, debt ratio, employee salaries and geographical location on companies economic performance in the three sectors. In addition, manager gender and nationality are decisive in industrial sector while employee total wages and productivity are in services. It therefore appears the necessity to develop general economic policies that are appropriate for companies but also specific to the different sectors of activity in the country. Key words: Economic performance, sector of activities, logit model.
INTRODUCTION The economic performance of companies is a problem for both developed and developing countries. Indeed, efficient companies participate in the development of a nation by achieving growth goals which generally deal with employability, collection of tax revenues, promotion of innovation, etc. (Lazare, 2016). Thus, they can be considered as levers of economic growth necessary for development and combating poverty.
Burkina Faso, along with other developing countries, in its ongoing pursuit of development, is continuously implementing structural policies to support growth and address the social and economic shortcomings that cause long-term problems.
In this sense, it has drawn up a economic policy reference document for achieving growth objectives, named National Plan for Economic and Social Development (Pndes). One of its main focuses is: private sector is an important lever for growth through promotion of trade sector and development of industrial sector, putting the company at the heart of social and economic development system. Thus, many reforms have been undertaken in the promotion of entrepreneurship and have helped to accelerate creation of businesses. On an annual average, more than 5000 companies were created over the period 2011 to 2015.
The mobilization of domestic resources, mostly done by
E-mail: [email protected]. Tel: (+226)70077881.
JEL Classification: C25, D21, H32.
Author(s) agree that this article remain permanently open access under the terms of the Creative Commons Attribution
License 4.0 International License

36 Afr. J. Bus. Manage. formal enterprises, is essential to achieve economic development goals. The more effective they are, the more they will participate in the overall economic growth effort. This raises the question of economic performance of companies given their prominent place in the economic development system.
What are the business performance criteria at the national level? Are they the same for all sectors of activity? Do they depend on specific characteristics of enterprises as mentioned by Nwachukwu et al. (2010)? For example, Jibao and Kai (2010) showed that economic performance in some industrial sectors in China depends on industrial factors, while for others, it depends on firms factors.
This raises the question of companies economic performance determinants regarding their prominent place in the economic development system.
This work highlights the factors of companies economic performance. It will lead to a better understanding of factors influencing performance in order to make appropriate recommendations for better business profitability.
LITERATURE REVIEW
Theoretical aspects revolve essentially around the existential relationship between three (3) elements that are the structural behaviors of the market, the behavioral response of the company and its performance. This relationship is still called structure-behavior-performance paradigm or SCP paradigm.
SCP states that structural characteristics of the market orient the behavior of companies, which has an impact on their performance. It is described as the basic scheme of the American industrial economy. Bourke (1989), on a sample of 17 French banks in a comparative study of the profits of European banks use the SCP paradigm to explain the performance factors of these.
Looking empirical approaches, Nwachukwu and Oseghale (2010) found that the determinants of business performance could be divided into three (3) components. It would therefore depend on company individual characteristics, its economic characteristics and the environment in which it operates.
Concerning enterprise size, Vettori and Jarillo (2000) shows the existence of an optimal size and a decrease of company unit costs which could influence its profitability. Indeed, the size of the company allows practice of economies of scale by lowering costs and then increase profitability.
However Staikouras and Wood (2004) find, out of a sample of 690 banks (138 major banks and 547 small banks) that average profits decline with the size of the firm.
This support thesis of a negative relationship between firm size and its growth as stipulated by Davidsson et al. (2002), Almus and Nelinger (1999), Denis (1954)
Woywode and Lessat (2001).
About employee productivity, Steindl (1947) considered twenty-one (21) American industries in which the amount of electrical energy consumed per hour of human labor increases considerably with the number of workers employed in each establishment. Enke (1950) in the Journal Intermediate Economy Theory explains that "too much productivity may not pay if it is bought too expensive and if the rate of interest is too high". "But for Osborn (1951) "the law of the reduction of the cost according to the increase of the volume of production can not be verified if the establishments concerned use to a very variable extent their production capacity".
Looking to investments, Chowdhury and Wolf (2003), in a study of small and medium-sized enterprises in East Africa (Kenya, Tanzania, Uganda) found a non-significant impact of Information and communication technologies (ICT) investments on business profitability.
Concerning company age, Davidsson et al. (2002) found that age was the most influential variable on firm growth rate among twenty-one (21) explanatory variables.
Indeed, there is a number of activity year at which owners' incentives to grow their business diminish. They are reluctant about new expenses like staff recruitment for example, Storey (2016).
Company location can have an impact on its activity. Steil and Wolf (1997) linked one of the causes of a firm's growth to its geographic location.
For example, if the enterprise is located in a rural place, it develops a proximity strategy by operating in a low uncertainty market. This would have less impact on innovation capabilities and best business practices (Julien, 2000).
Company activity can also have an impact on its performance. Samuelson et al. (1989) show that "business growth rates vary significantly across different industries".
This is confirmed by Harhoff et al. (1998) who showed, on a sample of ten thousand (10000) West German companies covering all sectors of the economy find that service sector firms are characterized by above average employment growth rates. Hincheley et al. (1997) determine a relationship between development dynamics within a branch and the growth rate of the firm. Almus and Nelinger (1999) show that there is a strong correlation between the firm's specificity and its growth rate. For Woywode and Lessat (2001), firms in the transportation, finance, insurance and services sectors are more likely to grow than firms in the processing industry.
Company manager’s age could have an impact on its performance. For Hambrick and Mason (1984), the young owner-manager is more adapt to develop a growth strategy based on new ideas and a propensity to develop innovative behavior than an older one. The senior manager's age or the average age of the executive team have a negative effect on the growth according to

Table 1. Average profitability in each sector.
Sector Average profitability (%)
Trade 28
Industry 27
Services 27
Source: Study construction.
Woywode and Lessat (2001). Otherwise, Mathieu et al. (2003) show that manufacturing firms with the highest growth and innovation rates are led by employers with technical training.
Concerning gender, Robert and Berhe (1999) showed on a sample of SME from southern New Jersey that women entrepreneurs who made up 16% of their sample were relatively young (70% of them were under 50 years old), worked for fewer hours and took fewer risks, which is characteristic of low performance as stipulated by Fasci and Valdez (1998).
However, one aspect of the study has been successful in showing that women who are highly motivated at work and strive to find a balance between their work and their family produce better financial outcomes, while for men, these same conditions reduce the financial performance of the institutions they run. This result was found by Ekpinda (2010) on a sample of about one hundred Beninese firms showing through a quantile regression model, that women-run businesses were achieving better economic performance. So human capital, has a positive correlation with enterprise economic performance. Bates (1990), Brüderl and Preisendöffer (2000).
In some lectures, companies’ juridical forms has an effect on performance. Woywode and Lessat (2001) on a sample of 8436 companies shows that the effects of legal juridical form on probability of rapid growth are significant. Indeed, rapid growth is the affair of limited liability company (LLCs) and societies in general rather than individual companies.
Some studies have evoked the absence of a link between performance and capital. For Demsetz and Lehn (1985) and Charreaux (1991), capital performance is indifferent to organizational training, while other authors mentioned a non-neutrality (Shleifer et al., 1988; Djelassi, 1996).
Myers and Majluf (1984), through the pecking-order theory, establish a decreasing preference for the financing means of a company. Its respectively self-financing, debt and stocks issues.
Modigliani and Miller (1985) establish two periods in which the impact of financial debt on performance is different.
Wanda (2001), on a sample of 39 companies found over a period of 3 years that the long-term financial debt is neutral in explaining the performance of the company because shareholders prefer own funding financing.
Ramde 37 MATERIALS AND METHODS
Data
2013 companies physical financial statements were collected by Chamber of commerce and industry of Burkina Faso and the study variables were extracted for the analysis. The database was build and the variables were subdivided into four categories. These are the economic, environment financial and managements variables. And then: (1) Economic variables include number of employee, turnover, investments in 2013, productivity of business equal to ratio value added/number of employee; (2) Environment variables include geographical location (Ouagadougou or others towns), sub-category of company activity. Thus, there are four sub-categories of activity for trade sector, seven for industry and also seven services3; the legal juridical form adopted by the company to conduct its business. A company is either of a legal form as a sole proprietorship or a limited liability company ; (3) Management variables include age of the manager, nationality of the company, employees wages, companies age and sex of manager; (4) Financial variables include company capital and its debt ratio. Descriptive analysis
Average profitability in each sector
Trade, industry and services are the three sectors considered for the analysis. Table 1 shows the average profitability on each sector.
Principal component analysis ACP and multiple component analysis ACM approach ACP or Principal component analysis Principal component analysis is a technique for summarizing the information contained in a vast array of quantitative data from graphical representations. It provides a map of variables based on their linear correlation.
For the analysis, all the quantitative variables of the model are used namely the financial profitability of the company, its seniority (age), the realized turnover, the shareholders' equity, the number of employee, employee salaries, investments, age of manager, productivity4.
We will comment a factorial plan. Indeed, the first factorial axis gives nearly 42% of the information while the two axes combined alone give more than 60% information5. The quantitative variables such as turnover, capital, number of employee, employee wages and investments are shown on axis 1 with a fairly good correlation.
Financial profitability and debt ratios are best represented on the axis 2 with a pretty good correlation. To a lesser extent, we find company age or seniority.
According to Axis 1, we see that companies that generate significant turnover are those with largest capital. They are also ones who have a high number of employees and a high level of employee wages with strong investments made. Thus Axis
3 See Annex 1 for the subcategories of the trade, industry and services sectors. 3 The variables geographical location, productivity, nationality, sex of the manager as well as his age were put in illustrative in the ACP method, in order
to increase the level of information of the chosen factorial plan. 5 See annex 2

38 Afr. J. Bus. Manage. contrasts this business profile with companies that have the lowest values for these variables that we just mentioned.
Axis 2 shows that companies that are more profitable are those that are most heavily indebted. They are ones that are the least old too. On the other hand, the companies that are the oldest are those which are unprofitable with low debt ratios6.
ACM or multiple correspondence analysis
The multiple correspondence analysis (ACM) is a factorial method adapted to tables in which a set of individuals is described by a set of qualitative variables (in columns). A typical example of this data issue on opinion surveys.
Variables were categorized according to modalities in order to search through an ACM, reconciliations between them7.
Thus, five distinct groups can be determined: (1) There is a group of limited liability companies located in Bobo-Dioulasso. They have a workforce of less than 25 employees and a turnover less than 200 million. They seem to be run by women and are nationals companies as nationality. These are mainly semi-wholesale businesses, hotels and restaurants, study services that are best represented on axis 2. (2) The second group, which is the opposite of the first group, represents limited companies. They are generally located in Ouagadougou. They realize more than one billion of turnover and have more than 200 employees. They are usually for foreign nationality. They work in the wholesale trade, chemical industries, extractive industries or mining, insurance, wood industries. Also, they realize the most important investments and have the highest productivities. (3) A third relevant group represents firms with low investment and low productivity, who are Burkinabe in origin and generally run by men aged 40 to 59 years or less. A well-represented sector for this group is other commercial services. (4) A fourth group consist of sole companies, making average investments with a turnover between 200 million and one billion CFA8 francs and led by seniors. A well-represented sector could be the agro-food industries. (5) A fifth group would be companies with between 25 and 200 employees located in the capital Ouagadougou and practicing in the sectors of Buildings and public works and Retail. It was noticed that, in addition to the ACP conclusions, the most profitable sectors of activity seem to be industries like wood metal and miscellaneous and mining9, and the least profitable sectors seem to be the buildings and public works and the agro-food industries as well as the retail trade. Also the foreign companies of our sample seem to be the most profitable as well as those located in Ouagadougou which are essentially of limited companies.
The model used is logistic method. Logistic regression is used for modeling of binary variables. It is applied in various fields such as medicine (healing or not of a patient), marketing (purchase or not of products or services following an action), etc. In the present case, the dependant variable which is financial profitability of companies take only 2 values explained by other variables. Such suits the present analysis to a logistic modelling approach.
Let consider Yi be our interest variable, the financial profitability of companies. Yi takes two values (0, 1) depending to each sector. It takes 1 if the company is profitable (0.28 for trade and
6 See Annex 3 7 See Annex 4 8 The local money. 1 dollar US is around 500 F CFA 9 Sectors having the best coordinates on the axis
respectively 0.27 for industry and services) and 0 otherwise (Table 2). Xi is the set of exogenous variables of the model such as size, productivity, geographical location, age of the company, manager gender, shareholders' capital, debt ratio, investments, sub-category of activity, company nationality, manager age or years, productivity and employee wages.
We consider with estimation errors.
Then have therefore the following equations:
with
The probability that company is profitable means that is:
With F the distribution function of the logistic law. The model is then estimated by the maximum likelihood method.
RESULTS The estimation of the logit model by taking into consideration, all activity sector simultaneously gives non conclusive and insignificant results. This is the reason why the method has been applied in each sector of activity individually (trade, industry and services). Trade
Model validation
The hypothesis of nullity of the coefficients is tested through the interpretation of the ratio of log likelihood LR, the statistic follows under H0 a law of Chi
2 with 15
degrees of freedom (dof). Thus, for a threshold of 5%, the LR statistic is 29.89, which is greater than the Chi
2 value
at 15 dof read in the table which is 24.996. Then we reject the hypothesis H0 of nullity of coefficients. The estimated model has at least one explanatory variable of significance. In addition, the pseudo R
2 is 38.5%.
In addition, the analysis of the prediction table shows that the investments as well as the company’s age have a significant impact at the 5% threshold on the financial profitability in the trade sector while the impact of the sub-category (semi-wholesale) is significant at 10%.
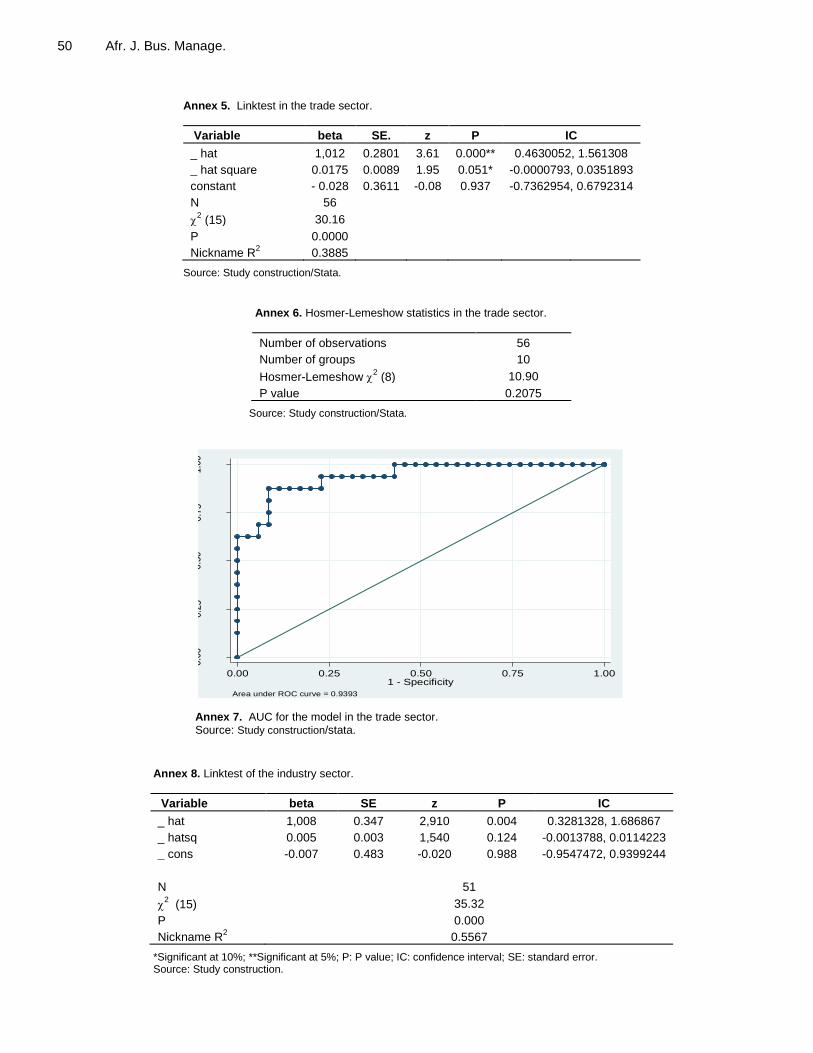
Quality of the regression LinkTest: The linktest regression in this first case shows that the hat variable is significant at the 5% threshold while the _ hatsq variable is not significant. Our model is not badly specified (Annex 5).
Hosmer Lemeshow: In addition, the p-value associated

Ramde 39
Table 2. Logistic regression of financial profitability in the trade sector.
Independent variable beta SE z P IC
Nationality -2.797 2,175 -1.290 0.198 (-7.060008, 1.46485)
Sub-category
Retail trade (reference)
Semi-wholesale 2.94 1,571 1,870 0.061 * (-1385761, 6.019377)
Wholesale 2,175 1,575 1,380 0.167 (-9121059, 5.263016)
Small business 3,071 2,696 1,140 0.255 (-2.213143, 8.356885)
Legal form
Sole proprietorship (reference)
limited company (LC) -2.288 1,947 -1.180 0.240 (-6.105249, 1.527256)
limited liability company (LLC) -0.62 1,329 -0.470 0.641 (-3.22449, 1.983764)
Geographical location 0.302 1,041 0.290 0.771 (-1.737327, 2.34254)
Sex 0.001 1,019 0.000 0.999 (-1.996553, 1.998493)
Manager's age 0.031 0.047 0.670 0,505 (-060625, 1230393)
Debt ratio -0.323 0.293 -1.110 0.269 (-8979891, 2503731)
Shareholders capital -0.102 0.121 -0.840 0.398 (-3392818, 1349454)
Investments 0.74 0.293 2,520 0.012 ** (0.165527, 1.315377)
Productivity 6.951 5,035 1,380 0.167 (-2.917112, 16.81979)
Employees wages 0.018 0.014 1,320 0.186 (-0089329, 0460206)
Compagny’s age -0.166 0.077 -2.150 0.032 ** (-0.318212, -0144972)
Constant 1,232 3,348 0.370 0.713 (-5.328519, 7.794204)
N 56
2 (15) 29.89
P 0.0123
Nickname R2 0.385
*Significant at 10%; **significant at 5%; P: Pvalue; IC: confidence interval; SE: standard error.
Table 3. Prediction table in the trade sector.
Classified Predicted value
Total Profitable Unprofitable
Profitable 25 11 36
Unprofitable 3 17 20
Total 28 28 56
Source: Study construction/stata.
with the Hosmer-Lemeshow statistic is 0.20. Which suggests that there is no evidence of a poor representation of the model. In conclusion the model is well specified (Annex 6). Quality of the prediction: In our modeling of the determinants of financial profitability in the retail sector, x is the average value of financial profitability in the sector, which is 27%. The prediction table (Table 3) shows that for profitable commercial firms, 25 out of 36 cases were well predicted while for unprofitable firms, 17 out of 20 cases were well predicted. The prediction rate of the
model is equal to the sum of the cases correctly predicted relative to the total number of observations, that is, [(25 + 17) / 56] × 100 = 75%.
This explains why the variables used in the model explain to a good extent the probability that a company will be profitable. ROC Curve
10: The calculation of the area under curve
(AUC) under stata shows that the value of the area under the ROC curve is about 88%. This demonstrates
10 The receiver operating characteristic (ROC) curve

40 Afr. J. Bus. Manage.
Table 4. Marginal effects in the trade sector.
Independent variable dy/dx SE Z P IC
Nationality -0.389 0.285 -1.36 0.173 -0.9476528, 0.1702596
Sub-category
Retail trade (reference)
Semi-wholesale 0.402 0.159 2.53 0.011 0.0902257, 0.7130341
Wholesale 0.286 0.186 1.54 0.124 -0.0785448, 0.6498081
Small business 0.421 0.359 1.17 0.241 -0.2827409, 1.124204
Legal form
Sole proprietorship (reference)
limited company (LC) -0.309 0.228 -1.36 0.175 -0.7553375, 0.1373981
limited liabilitycompany (LLC) -0.084 0.173 -0.49 0.627 -0.4240836, 0.2556807
Geographical location 0.042 0.144 0.29 0.771 -0.2408871, 0.3249756
Sex 0.000 0.142 0 0.999 -0.277402, 0.2776716
Rate of endettement -0.045 0.039 -1.15 0.249 -0.1214965, 0.0315165
Employees 0.003 0.002 1.42 0.156 -0.0009865, 0.0061395
Company’s age -0.023 0.009 -2.54 0.011 -0.0409289, -0.0052979
Productivity 0.966 0.656 1.47 0.141 -0.3206087, 2.252252
Equity -0.014 0.016 -0.86 0.388 -0.0464024, 0.0180118
Manager's age 0.004 0.006 0.68 0.498 -0.0082089, 0.0168808
Investments 0.103 0.031 3.28 0.001 0.0413357, 0.1644216
Source: Study construction/stata.
excellent discrimination of the model in trade sector (Annex 7).
Marginal effects in the trade sector: The marginal effects make it possible to study the impact of each exogenous variable on the explained variable (Table 4). The analysis of marginal effects of the model at 5 and 10% of significance, in the trade sector gives the following comments. (1) The probability for a semi-wholesale company to be profitable increases by 40% compared to a company in retail trade; (2) Compared to a company operating in retail trade, the probability of a company in trade to be profitable increase by about 10% when investments made are up to 1%; (3) The probability of a trade company to be profitable decrease by around 2% when its age or seniority increase by one year.
Industry sector
The estimation results for industry sector data are shown in Table 5.
Validation of the model
The hypothesis of nullity of the coefficients is tested
through the interpretation of the ratio of log likelihood LR. The statistic follows under H0 a Chi
2 law with 16
degrees of freedom. Thus for a threshold of 5%, the LR statistic is 35.28, which is greater than the value of Chi
2
at 16 dof read in the Chi2 table which is 26.296. Then we
reject the hypothesis H0 of nullity of the coefficients. The estimated model has at least one explanatory variable of significance. The pseudo R
2 is about 56%.
In addition, the analysis of the prediction table shows that the personnel expense, investment and debt ratio variables are significant at the 5% threshold while nationality, sex of the manager and geographical location are significant at 10%.
Quality of the regression
LinkTest: The linktest regression for the industry sector gives the results table (Table 6). As in the trade sector, we note that the variable hat is significant at the 5% threshold while the variable _ hatsq is not significant. This shows that our model does not suffer from a bad specification and does not omit important explanatory variables (Annex 8).
Hosmer Lemeshow: The p-value associated with the Hosmer-Lemeshow statistic is 0.59. Which suggests that there is no evidence of a poor representation of the

Ramde 41
Table 5. Logistic regression in the industry sector.
rf 1 beta SE z P IC
Independent variable
Nationality 3,932 2,226 1.770 0.07* (-0.4304825, 8.293968)
Sub-category
Agrifoods industries 2,044 2,637 0.780 0.438 (-3.124744, 7.21277)
Chemical Industries 0.800 2,963 0.270 0.787 (-5.006811, 6.606706)
Textile Industries 1,551 2,405 0.650 0.519 (-3.162429, 6.265319)
Wood Industries 2,572 2,596 0.990 0.322 (-2.516055, 7.660595)
Extractive industries -1.360 3,445 -0.390 0.693 (-8.112589, 5.392505)
Geographical location 3,403 1,761 1,930 0.053* (-0.048857, 6.854688)
Sex of the manager (man) 4,135 2,408 1,720 0.086* (-0.5845775, 8.854781)
Manager's age -0.028 0.139 -0.210 0.837 (-0.3000892, 0.243092)
Debt ratio 1,351 0.659 2,050 0.040** (0.0593693, 2.64268)
Shareholder’s capital -0.293 0.193 -1.510 0.130 (-0.6713025, 0.0860198)
Investments -1.438 0.694 -2.070 0.038** (-2.797817, -0.0772436)
Productivity -0.091 0.999 -0.090 0.927 (-2.049407, 1.866856)
Number of employees -1.324 1,183 -1.120 0.263 (-3.642261, 0.993925)
Company’s age -0.071 0.095 -0.740 0.457 (-0.2571611, 0.1157827)
Employees wages 1,834 0.882 2,080 0.038** (0.1051549, 3.56209)
Constant -9.064 5,590 -1.620 0.105 (-20.02027, 1.892588)
N 51
2 (16) 35.28
P 0.0036
Nickname R2 0.5561
*Significant at 10% ; **Significant at 5%; P: P value; IC: confidence interval; SE: standard error.
Table 6. Prediction table in the industry sector.
Classified Predicted values
Profitable Unprofitable Total
Profitable 14 7 21
Unprofitable 2 28 30
Total 16 35 51
Source: Study construction/stata.
model. In conclusion the model is well specified (Annex 9). Quality of the prediction: The analysis of the prediction quality of our model will be done through the prediction table (Table 6). It is question of comparing, like in the commercial sector, the predictions of the occurrence of the event, that is, the cases where the dependent variable is equal to 1 to the true values taken by the dependent variable at the 27% threshold corresponding to the average value of financial profitability in the industrial sector. Using the lstat command under stata, we obtain the following results:
The prediction table shows that 14 out of 16 profitable
industrial enterprises have been well predicted while 28 out of 35 unprofitable companies have been well predicted. The prediction rate of the model isequal to the sum of cases correctly predicted relative to the total number of observations that is, [(14 + 28) / 51] × 100 =82.35%.
This explains that variables used in the model largely explain the probability of an industrial company profitability. ROC Curve: The calculation of the AUC under stata shows that the value of the area under the ROC curve is about 88%. This demonstrates an exceptional discrimination of the model in the indisrual sector

42 Afr. J. Bus. Manage.
Table 7. Marginal effects in the industry sector.
Independent variable dy / dx SE z P IC
Nationality 0.350 0.169 2.07 0.038 0.0190686, 0.6810087
Sub categories
Agri-food industries 0.165 0.194 0.85 0.394 -0.2151284, 0.545959
Chemical Industries 0.056 0.206 0.27 0.784 -0.3481499, 0.4610835
Textile Industries 0.120 0.169 0.71 0.478 -0.2109484, 0.4502618
Wood Industries 0.216 0.204 1.06 0.289 -0.1833399, 0.6158377
Extractive industries -0.073 0.179 -0.41 0.683 -0.4237223, 0.277682
Geographical location 0.303 0.124 2.44 0,015 0.0597503, 0.5461651
Sex of the manager (man) 0.368 0.180 2.05 0.041 0.0157312, 0.7205558
Manager's age -0.003 0.012 -0.21 0.837 -0.0266426, 0.0215682
Rate of endettement 0.120 0.045 2.69 0.007 0.0325969, 0.2079635
Shareholders capital -0.026 0.015 -1.72 0.085 -0.0556749, 0.0035678
Investments -0.128 0.047 -2.7 0.007 -0.2207189, -0.0352445
Productivity -0.008 0.089 -0.09 0.927 -0.1822681, 0.1660158
Numberof employees -0.118 0.099 -1.19 0.234 -0.3119394, 0.076161
Comapny’s age -0.006 0.008 -0.75 0.451 -0.0226579, 0.0100712
Employee wages 0.163 0.060 2.71 0.007 0.0449644, 0.2815264
Source: Study construction/stata.
(Annex 10). Marginal effects in the industry sector: Marginal effects estimation results are shown in Table 7. Thus the analysis of the marginal effects of the significant variables shows that: (1) Compared to foreign companies, the probability for an industrial company to be profitable increase by 35% if it’s nationality is Burkinabe ; (2) Compared to a company located in Bobo Dioulasso, the probability for an industrial company to be profitable increase by more than 30% when it is located in Ouagadougou; (3) Compared to companies led by woman, the probability for an industrial company led by man to be profitable increase of nearly 37%; (4) The probability for an industrial company to be profitable decrease by almost 13% if its investments rise by one unit; (5) The probability for an industrial enterprise to be profitable increase by about 12% if its debt ratio increases by one unit; (6) The probability for an industrial company to be profitable increase by more than 16% if its employee global wages rise by one unit. Service sector The estimation results for the services sector data are shown in Table 8.
Validation of the model The hypothesis of nullity of the coefficients is tested through the interpretation of the ratio of log likelihood LR. The statistic follows under H0 a law of Chi
2 with 15
degrees of freedom. Thus for a threshold of 5%, the LR statistic is 26.84. Which is greater than the value of the Chi
2 at 15 ddl read in the table which is 24,996. Then we
reject the hypothesis H0 of nullity of the coefficients. The estimated model has at least one explanatory variable of significance. The pseudo R
2 is about 38%.
Also, the subcategories «Computer and at the 5 and 10% thresholds, respectively.
The geographic location, equity, productivity and seniority of the company are all significant at the 5% level. As for personnel expenses, they are significant at the 10% level. Quality of the regression LinkTest: The linktest regression for the service sector gives the results table (Table 9). As in the trade and industry sectors, we note the significance of the _ hat variable at the 5% threshold and the non-significance of the _ hatsq variable at the same threshold. This shows that our model does not suffer from a bad specification and does not omit important variables (Annex 11). Hosmer Lemeshow: The p-value associated with the Hosmer-Lemeshow statistic is 0.66. Which suggests
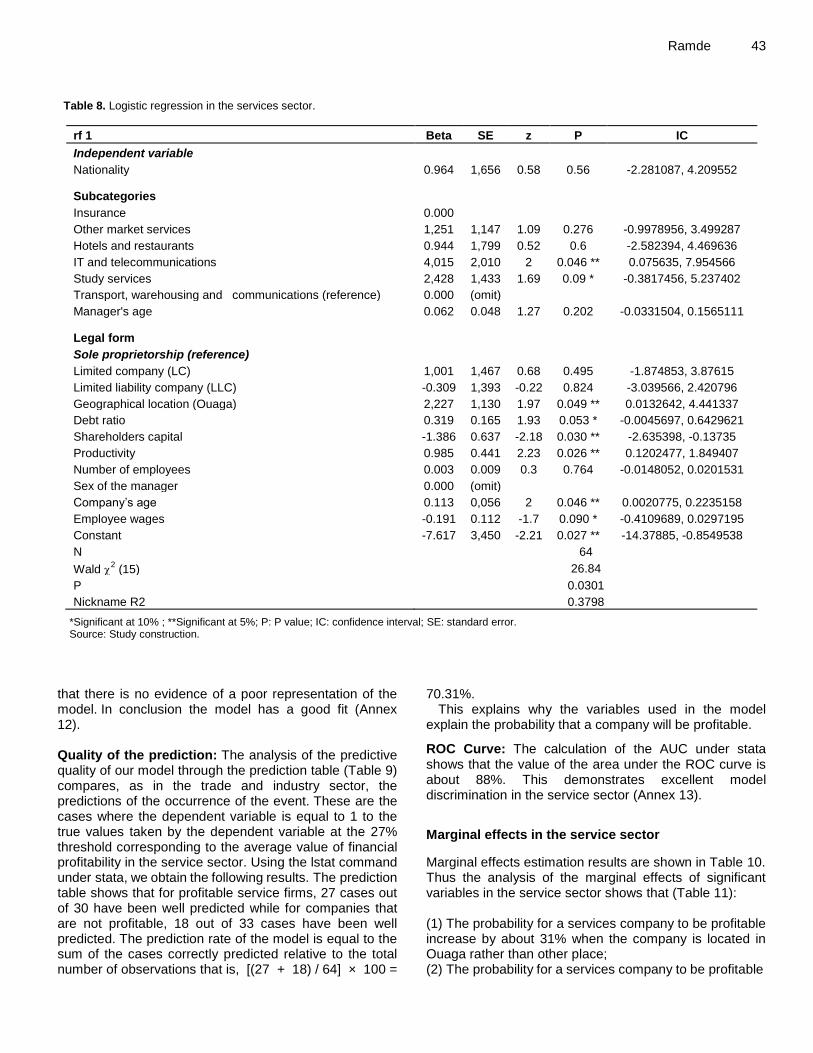
Ramde 43 Table 8. Logistic regression in the services sector.
rf 1 Beta SE z P IC
Independent variable
Nationality 0.964 1,656 0.58 0.56 -2.281087, 4.209552
Subcategories
Insurance 0.000
Other market services 1,251 1,147 1.09 0.276 -0.9978956, 3.499287
Hotels and restaurants 0.944 1,799 0.52 0.6 -2.582394, 4.469636
IT and telecommunications 4,015 2,010 2 0.046 ** 0.075635, 7.954566
Study services 2,428 1,433 1.69 0.09 * -0.3817456, 5.237402
Transport, warehousing and communications (reference) 0.000 (omit)
Manager's age 0.062 0.048 1.27 0.202 -0.0331504, 0.1565111
Legal form
Sole proprietorship (reference)
Limited company (LC) 1,001 1,467 0.68 0.495 -1.874853, 3.87615
Limited liability company (LLC) -0.309 1,393 -0.22 0.824 -3.039566, 2.420796
Geographical location (Ouaga) 2,227 1,130 1.97 0.049 ** 0.0132642, 4.441337
Debt ratio 0.319 0.165 1.93 0.053 * -0.0045697, 0.6429621
Shareholders capital -1.386 0.637 -2.18 0.030 ** -2.635398, -0.13735
Productivity 0.985 0.441 2.23 0.026 ** 0.1202477, 1.849407
Number of employees 0.003 0.009 0.3 0.764 -0.0148052, 0.0201531
Sex of the manager 0.000 (omit)
Company’s age 0.113 0,056 2 0.046 ** 0.0020775, 0.2235158
Employee wages -0.191 0.112 -1.7 0.090 * -0.4109689, 0.0297195
Constant -7.617 3,450 -2.21 0.027 ** -14.37885, -0.8549538
N 64
Wald 2 (15) 26.84
P 0.0301
Nickname R2 0.3798
*Significant at 10% ; **Significant at 5%; P: P value; IC: confidence interval; SE: standard error. Source: Study construction.
that there is no evidence of a poor representation of the model. In conclusion the model has a good fit (Annex 12). Quality of the prediction: The analysis of the predictive quality of our model through the prediction table (Table 9) compares, as in the trade and industry sector, the predictions of the occurrence of the event. These are the cases where the dependent variable is equal to 1 to the true values taken by the dependent variable at the 27% threshold corresponding to the average value of financial profitability in the service sector. Using the lstat command under stata, we obtain the following results. The prediction table shows that for profitable service firms, 27 cases out of 30 have been well predicted while for companies that are not profitable, 18 out of 33 cases have been well predicted. The prediction rate of the model is equal to the sum of the cases correctly predicted relative to the total number of observations that is, [(27 + 18) / 64] × 100 =
70.31%. This explains why the variables used in the model
explain the probability that a company will be profitable.
ROC Curve: The calculation of the AUC under stata shows that the value of the area under the ROC curve is about 88%. This demonstrates excellent model discrimination in the service sector (Annex 13).
Marginal effects in the service sector
Marginal effects estimation results are shown in Table 10. Thus the analysis of the marginal effects of significant variables in the service sector shows that (Table 11): (1) The probability for a services company to be profitable increase by about 31% when the company is located in Ouaga rather than other place; (2) The probability for a services company to be profitable

44 Afr. J. Bus. Manage.
Table 9. Prediction table in the service sector.
Classified Predicted values
Profitable Unprofitable Total
Profitable 27 16 43
Unprofitable 3 18 21
Total 30 34 64
Source: Study construction/stata.
Table 10. Estimated marginal effects in the services sector.
Variable dy / dx SE Z P IC
Marginal effects
Nationality 0.136 0.233 0.58 0.561 -0.3218385, 0.5930117
Manager's age 0.009 0.006 1.34 0.179 -0.0039785, 0.021325
Legal form
Sole proprietorship (reference)
Limited company (LC) 0.132 0.189 0.70 0.484 -0.2382829, 0.502526
Limited liability company (LLC) -0.042 0.188 -0.22 0.823 -0.4107077, 0.3266142
Geographical location (Ouaga) 0.313 0.140 2.23 0,026 0.0379929, 0.5883955
Debt ratio 0.045 0.021 2.12 0,034 0.0033474, 0.0864209
Shareholders capital -0.195 0.071 -2.76 0.006 -0.3333206, -0.0565722
Productivity 0.138 0.064 2.18 0,029 0.0138907, 0.2630744
Number of employee 0.000 0.001 0.30 0.764 -0.0020798, 0.0028318
Manager sex 0.000 (omitted)
Company’s age 0.016 0.007 2.20 0,027 0.0017586, 0.0299635
Employee wages -0.027 0.016 -1.63 0,103 -0.0590432, 0.0054334
P: Pvalue; IC: confidence interval; SE: standard error.
Table 11. Resume of sign and significance of financial profitability and the explanatory variables.
Variable Financial profitability
Trade Industry Services
Nationality - * + +
Limited liability company (LLC) - n.e. +
Limited company (LC) - n.e. -
Geographical location (Ouaga) + * + ** +
Sex (Male) + * + n.e.
Manager's age + - +
Debt ratio - ** + * +
Shareholders capital - - - **
Investments ** + - ** n.e.
Productivity + - ** +
Number of employee + - +
Company’s age - ** - ** +
Employee wages n.e. ** + - *
- = negative link; + = positive link; - * = significant negative link at 10%; + ** = significant positive link at 5% ; n.e. = not estimated. Source: Study construction.

decrease by about 19% when its shareholders capital is increased by one unit; (3) The probability for a services company to be profitable increase by about 14% when employee productivity increases by one unit; (4) The probability for a services company to be profitable increase by only 1.5% if it’s seniority increases by one unit; (5) The probability for a services company to be profitable decreases by 2.6% if employee total wages increase by one unit. DISCUSSION Trade sector
Investments are an important part of the growth of an enterprise. It contributes to companies performance in the global market by making new acquisitions, improving production capacities and so on.
In the commercial sector, investments and company’s age are significant to explain commercials units economic performance at the 5% level. The sub-sector semi wholesale trade is significant at 10% level.
However, the role of investments in the financial performance of companies has not always been elucidated and the expected impact is often variable as shown by Chowdhury and Wolf (2003). They found that this impact on ICT companies was not significant. Thus, in the trade sector in Burkina Faso, it appear the necessity for a company to invest because of its role in financial profitability.
In addition, the company’s age of the company came out significant in the explanation of the economic performance of the company. Moreover, this impact is negative, as suggested by Davidsson et al. (2002) and Storey (2016) on the link between age and performance.
So the older a business is, the lower the profitability become over time. This could be explained by a decrease in motivation of promoters specially when, for a given level of growth, expenses become more and reach high proportion. These expenses are encouraging by the thoughts of managers / owners whom starting believing theirs business become "immortal" and will never die. So, it appear a let to go in the expenses of personal consumption, which contribute to increase vulnerability of the company, which generally evolves in an uncertain environment.
Also the sub-category of semi-wholesale trade activities is significant compared to other sectors in the explanation of the financial performance of the trading companies. As suggested by Samuelson et al. (1989), the growth rates of firms depend on their nature. Thus the sub- sector "semi-wholesale trade" has a comparative advantage that would allow it to make good financial performance. Moreover, the fact that the activity is between the wholesale and retail sub categories, this
Ramde 45 subsector has the benefits of them.
Industry sector In the industry sector, investments, employees wages and debt ratio were significant in explaining the financial performance of companies at 5% level. While, manager’s nationality and gender and geographical location of the industrial unit are significant at 10% level.
As in the commercial sector, investments play a major role in explaining company's financial performance. However, this impact is negative for industries. Some expalnations could be give by the fact that, industries does all required and necessary acquisitions before starting their business. And then, any new investments (equipment changes, new acquisitions, etc.) generate costs and appear as expenses for hem without inducing a significant growth. So, the impact could be low and decrease the financial profitability of industries.
Another result is the positive significance impact of debt ratio on industries profitability, unlike commercial sector where it is not. This is mentioned by Wanda (2001) as being the process of long-term debt neutrality. Thus, in Burkina Faso, manufacturers prefer debt to self-financement instead of use of pecking order theory of Myers and Majluf (1984). However, indebtedness can allow companies, below a given threshold, to finance their expansion capacities and use their own funds to develop certain aspects of their companies, which create a positive effect on industry value, Modigliani and Miller (1985). So debt influence the probability of industries in the country.
As result, employees wages have positive and significant impact on industries for being financially profitable. In fact, better wages have the effect of boosting the productivity of workers by making them more efficient and more innovative, which is known to lead positive results for the company even if Enke (1950) thinks that «too much productivity may not pay if it is bought too expensive and if the rate of interest is too high».
Moreover, as the literature shows, the location of the company could give it a significant comparative advantage that would influence its growth and profitability. Thus, in the explanatory model of the financial profitability of industries, the location is significant at 10% level. The fact that the industrial units are located in Ouagadougou, the economic capital of the country, significantly impact their financial profitability. They not only benefit from economies of scale and agglomeration, but also from the availability of support infrastructure and administrative services essential for their activities (Steil and Wolf, 1997). These factors prove to be important to achieve good financial results for the industrial sector. However, units located elsewhere operate in a market with low uncertainty, which is a limitation of their capacity for innovation and a source of

46 Afr. J. Bus. Manage. less impact on profitability (Julien, 2000).
One more result in the industrial sector founded is the nationality of the industry also has a significant positive impact on the probability at 10% of level. Indeed, the fact that the company operates on its territory confers itbenefits related to this status, which is different for a foreign company. These can be related to tax reduction, to the knowledge of economic environment, etc. Thus, the knowledge of national market, the establishment of long-lasting and solid distribution networks, constitute major elements of influence on the financial profitability.
Another result is gender which is the subject of more attention of countries decision-makers. Increasingly, women's entrepreneurship is an integral part of development pillar use by governments to attain nationals objectives. Particularly, in Africa countries and many others of the world, the important role of women in society is critical to achieving sustained and inclusive growth.
From the explanatory model in the industry sector, it appears that gender has an impact on financial performance of industrials companies. Thus, the fact that the entrepreneur is male increase the probability that an industrial enterprise will become profitable compared to the fact that the entrepreneur is female. This can be explained by the nature and specifities of industrial activity base on time-consuming managemnt, and exposition of various risks to ensure performance of the unit. However, this is not always close to the role gives to women in our society, a role in which they are frowned upon if they are not socially involved, Fasci and Valdez (1998) and Robert and Berhe ( 1999).
Service sector In the services sector, the econometric analysis shows the significance of geographical location, shareholders capital, productivity and seniority to determine financial performance of companies in Burkina at the 5% threshold. In addition, debt ratio and employees wages have a significant impact at the 10% level.
The geographical location of services in the economic capital Ouagadougou give them comparative advantages. Indeed, country capital contains the most opportunities for services such as transport activity, other market services, hotels and restaurants, research services, etc. This is mainly due to the proximity with a large population, so an available costumers, better infrastructure compared to elsewhere in the country (Steil and Wolf, 1997).
Shareholders capital has a significant and negative impact on the probability for a business service to be financially efficient as Tarek (2001) points it. There is a relationship of non-neutrality between these two quantities as denote by Shleifer et al. (1988). This negative effect can be explained by "lower financial income that does not cover workloads".
Productivity is a variable that plays a significant and
positive role in the business services profitability. Unlike other sectors where this finding does not emerge as Steindl (1947) states, there is an important role between productivity level and business performance.
The service companies ages have a significant and positive impact on their probability. The fact that a service enterprise is older allows it to build a strong network of partnerships and maintain it. This gives it comparative advantages related to it reputation, it experience gained in the field, etc. The seniority of the firm is therefore an influential variable in the explanatory model of Davidsson et al. (2002), in the service sector.
The debt ratio has an impact on the probability that a service company will perform financially as shown in the industry sector. Indeed, indebtedness is often used for capital expenditures related to the installation and operation of the service unit. This is often the case of research and training firms. Also some service activities such as transport, sells services require significant investments that can be made by the debt. This reduce the pression on the company cash flow and rentabilize the money invested.
In addition, employees wages have a significant impact on the probability for a service activity to be profitable.
However, this impact is negative. Thus, the fact that personnel costs are much higher can lead to a decrease in performance. Conclusion
Thus the study reveals the existence of relevant explanatory factors on the financial profitability of companies in Burkina. However, from one sector to another, these elements differ and provide a better understanding of the strategic choices made by these entities in their growth process.
As recommendations, it is essential for Burkina Faso government to encourage initiatives that support businesses with high growth potential through appropriate policies. This could allow them to have more flexibility in the investments they make and greater flexibility in the restructuring of companies if they begin to face some difficulties related to significance factors showned.
CONFLICT OF INTERESTS
The authors have not declared any conflict of interests.
ACKNOWLEDGEMENTS The extend his thank his institution, Chamber of Commerce and Industry of Burkina Faso and the General Manager, Mr. Issaka Kargougou for their support in allowing access data for the paper.

REFERENCES
Alla J (1974). Age et évolution de l'entreprise (Age and evolution of the
enterprise). Revue Economique 25(6):985-1003. Almus M, Nerlinger EA (1999). Growth of new technology-based firms
which factors matter?. Small Business Economics 13(2):141-154. Bates T (1990). Entrepreneur human capital inputs and small business
longevity. MIT Press, pp. 551-559. Bourke P (1989). Concentration and other determinants of bank
profitability in Europe, North America and Australia. Journal of Banking and Finance 13(1):65-79.
Brüderl J, Preisendörfer P (2000). Fast-growing businesses: empirical evidence from a German study. International Journal of Sociology 30(3):45-70.
Charreaux G (1991). Ownership Structures, Agency Relationship and Financial Performance. Revue Economique 42(3):521-552.
Chowdhury SK, Wolf S (2003). Use of ICTs and the economic performance of SMEs in East Africa (No. 2003/06). WIDER Discussion Papers//World Institute for Development Economics (UNU-WIDER).
Rutherford MW, Oswald SL (2000). Antecedents of small business performance. New England Journal of Entrepreneurship 3(2):21.
Davidsson P, Kirchhoff B, Hatemi J, Gustavsson A (2002). Empirical Analysis of Business Growth Factors Using Swedish Data. Journal of Small Business Management 40(4):332-349.
Demsetz H, Lehn K (1985). The structure of corporate ownership: Causes and consequences. Journal of Political Economy 93(6):1155-1177.
Denis H (1954). Economic Review Productivity and Profitability (Productivite et rentabilite). pp. 50-66. Available at: https://www.jstor.org/stable/3497924?seq=1
Djelassi M (1996). Structure de propriété relation d’agence et performance des firmes francaises cotées en bourse. Journal de la société de statistique de Paris. Tome 137(3):51-77.
Ekpinda E (2010). Determinants of the economic performance of formal enterprises in Benin Internship memory. Unpublished .
Enke S (1950). Intermediate Economic Theory. New York P 146. Fasci M, Valdez J (1998). A performance contrast of male-and female-
owned small accounting practices. Journal of Small Business Management 36(3):1.
Hambrick DC, Mason PA (1984). Upper echelons: The organization as a reflection of its top managers. Academy of Management Review 9(2):193-206.
Harhoff D, Stahl K, Woywode M (1998). Legal form, growth and exit of West German firms-empirical results for manufacturing, construction, trade and service industries. The Journal of Industrial Economics 46(4):453-488.
Julien PA (2000). High growth SMEs: explanatory factors. Investigaciones Europeas de Dirección y Economía de la Empresa 6(2):39-56.
Jibao G, Kai G (2010). The Determinants of Firm Performance: the Industry Factors or the Firm Factors? ―An Empirical Research on the Listed Companies in China. Available at: https://pdfs.semanticscholar.org/ea1d/d5b4602e87ab5968ef7c8dc6384d625f0e39.pdf
Lazare S (2016). Determinants of firm performance: evidence from Romanian listed companies. Review of Economic and Business Studies 9(1):53-69.
Ramde 47 Modigliani F, Miller MH (1958). The cost of capital, corporation finance
and the theory of investment. The American 1:3. Myers S, Majluf N (1984). Corporate Financing and Investment decision
when companies do not have. Journal of Financial Economics 13:187-221.
Nomenclature of activities of states members of Afristat (Naema) Product Nomenclature of member states of Afristat (NOPEMA) (2000) Series Methods # 3. Available at:
http://www.afristat.org/contenu/pdf/rsc/naema.pdf Nwachukwu OC, Oseghale B (2010). Determinants of small business
performance: A Meta-Analysis. Economics y Business Journal: Inquiries y Perspectives 3(1):65-76.
Osborn RC (1951). Efficiency and profitability in relation to size. Harvard Business Review 29(2):82-94.
Robert DL, Berhe HG (1999). Characteristics of successful small businesses in Southern New Jersey.
Samuelson L, Dunne T, Roberts M (1989). ‘’Patterns of firm entry and exit in U.S. manufacturing industries. Rand Journal of Economics 19(4):495-515.
Shleifer A, Vishny WR, Morck R (1988). ‘’Management Ownership and Market Valuation’’, Journal of Financial Economics 20:293-315.
Steil F, Wolf E (1997). Welche Bedeutung haben Unternehmenscharakteristika und regionales Umfeld fuer die Beschaeftigungsdynamik? Eine mikrooekonometrische Analyse fuer das ostdeutsche verarbeitende Gewerbe (No. 97-22). ZEW Discussion Papers.
Steindl J (1947). Small and big business: Economic problems of the size of firms (No. 1). B. Blackwell.
Staikouras CK, Wood GE (2004). The determinants of European bank profitability. International Business and Economics Research Journal 3:57-68.
Storey DJ (2016). Understanding the small business sector. Routledge. Tarek M (2001). Structure financière et performance économique des
PME: Étude empirique sur les entreprises belges (Financial Structure and Economic Performance of SMEs: An Empirical Study of Belgian Enterprises), pp. 1-36.
Vettori GAF, Jarillo JC (2000). Economies d'échelle - Les résultats de la recherche sur le secteur bancaire suisse (Economies of Scale: From concept to application, the Swiss banking sector). Available at: https://archive-ouverte.unige.ch/unige:5848
Wanda R (2001). Structure financière et performance des entreprises dans un contexte sans marché financier: le cas du Cameroun (Financial Structure and Business Performance in a Context without a Financial Market: The Case of Cameroon). Revue du Financier , pp. 1-16.
Woywode M, Lessat V (2001). The success factors of fast growing companies in Germany. International Journal of SMEs: Economics and Management of Small and Medium Enterprises 14(3-4):17-43.

48 Afr. J. Bus. Manage. ANNEX
Annex 1. List of categories and sub-categories of activities
Trade
Semi-wholesale
Retail business
Wholesale
Small business
Industry
Buildings and public works
Agrofoods industries
Chemical Industries
Mineral Products Industries and Basic Metallurgical Industries
Textile and paper industries
Wood, Metal and Miscellaneous Industries
Extractive industries
Services
Insurance
Other commercial services
Banks and financial institutions
Hotels and restaurants
IT and telecommunications
Study services
Transport, Warehouses and Communications
Annex 2. Histogram of eigenvalues. Source: Study construction on SPAD.

Ramde 49
Annex 3. Factorial representation of study variables. Age = Age of company; CA = turnover; ES = number of employee; CP = capital; Charges Pers = employee wages; Invest = investments; RE = debt ratio; RF = financial profitability. Source: Study construction on SPAD.
Annex 4. Multiple correspondence analysis representation. Source: Study construction on SPAD.
50 Afr. J. Bus. Manage.
Annex 5. Linktest in the trade sector.
Variable beta SE. z P IC
_ hat 1,012 0.2801 3.61 0.000** 0.4630052, 1.561308
_ hat square 0.0175 0.0089 1.95 0.051* -0.0000793, 0.0351893
constant - 0.028 0.3611 -0.08 0.937 -0.7362954, 0.6792314
N 56
2 (15) 30.16
P 0.0000
Nickname R
2 0.3885
Source: Study construction/Stata.
Annex 6. Hosmer-Lemeshow statistics in the trade sector.
Number of observations 56
Number of groups 10
Hosmer-Lemeshow 2 (8) 10.90
P value 0.2075
Source: Study construction/Stata.
0.00
0.25
0.50
0.75
1.00
Sen
sitiv
ity
0.00 0.25 0.50 0.75 1.001 - Specificity
Area under ROC curve = 0.9393
Annex 7. AUC for the model in the trade sector. Source: Study construction/stata.
Annex 8. Linktest of the industry sector.
Variable beta SE z P IC
_ hat 1,008 0.347 2,910 0.004 0.3281328, 1.686867
_ hatsq 0.005 0.003 1,540 0.124 -0.0013788, 0.0114223
_ cons -0.007 0.483 -0.020 0.988 -0.9547472, 0.9399244
N 51
2 (15) 35.32
P 0.000
Nickname R2 0.5567
*Significant at 10%; **Significant at 5%; P: P value; IC: confidence interval; SE: standard error. Source: Study construction.

Ramde 51
Annex 9. Hosmer-Lemeshow Statistics in the Industry Sector.
Number of observations 51
Number of groups 10
Hosmer-Lemeshow 2 6.47
pvalue 0.5953
Source: Study construction / stata.
0.0
00.2
50.5
00.7
51.0
0
Sen
sitiv
ity
0.00 0.25 0.50 0.75 1.001 - Specificity
Area under ROC curve = 0.9393
Annex 10. AUC in the industry sector. Source: Study construction on stata.
Annex 11. Linktest in the service sector.
rf 1 beta SE z P IC
_ hat 1,014 0.266 3.82 0.000 0.4931945 1.534832
_ hatsq 0.016 0.008 1.94 0.053 -0.0001852 0.0322439
_ cons -0.026 0.335 -0.08 0.939 -0.6820239 0.6305759
N 64
2 (2) 33.83
Prob> chi2 0.0000
Nickname R2 0.3824
*Significant at 10%; **Significant at 5%; P: P value; IC: confidence interval; SE: standard error. Source: Study construction.
Annex 12. Statistics of Hosmer Lemeshow in the services sector.
Number of observations 64
Number of groups 10
Hosmer-Lemeshow 2 5.85
P value 0.6635
Source: Study construction /Stata.

52 Afr. J. Bus. Manage.
0.0
00.2
50.5
00.7
51.0
0
Sen
sitiv
ity
0.00 0.25 0.50 0.75 1.001 - Specificity
Area under ROC curve = 0.8804
Annex 13. AUC in the services sector. Source: Study construction on stata.