determinants of corporate anti-takeover provisions … · determinants of corporate anti-takeover...
TRANSCRIPT

DETERMINANTS OF CORPORATE ANTI-TAKEOVER PROVISIONS
Juan Santaló
IE Working Paper WP04-28 15-10-2004
Department of Strategic Management Instituto de Empresa
Serrano 89, 2º 28006, Madrid
Spain [email protected]
Abstract In this paper I study empirically the industry and firm characteristics thatdetermine the level of corporate antitakeover protection. I find that thelevel of antitakeover protection is negatively associated with the level offirm-specific organizational capital and with stock market volatility. On theother hand, firms that allow a larger degree of antitakeover protection totheir managers do indeed invest more in long term projects and operate inmore concentrated industries. All these findings are consistent with a managerial entrenchment interpretation of corporate antitakeoverprovisions. JEL Classification: G30, G34 Keywords Takeover defenses, organizational capital, product market competition, managerial compensation, managerial myopia.


IE Working Paper WP04/28 15/10/2004
INTRODUCTION Corporate anti-takeover provisions (CAP) are used extensively and can be found in public companies worldwide1. Corporations restrict shareholder rights to obstruct potential hostile take-over attempts that in case of success could overthrow the firm management team. Firm managers might defend their self-interest when introducing these types of provisions in the corporate statutes. Yet, it is still the case that shareholders need to approve these statute changes. Why do shareholders vote in favor of CAP? Or assuming that these statutes are already in place, what refrain shareholders not to eliminate them? One possible explanation comes from a managerial entrenchment view of the corporation: Ownership of public companies is dispersed and small shareholders free ride on the effort of others to obtain costly information needed to monitor the managerial team. As a consequence of this free rider problem, shareholders do not properly control managerial actions and managers enjoy considerable discretion whether in running the corporation, appointing the members of board of directors or even in approving these anti-takeover statutes.
Yet, an alternative explanation could be that these antitakeover statutes increase firm value by encouraging an efficient allocation of resources and therefore shareholders are rationally willing to vote for them. Previous work has pointed out a number of different arguments that go in this direction that I summarize below. Our goal in this paper is to explore the empirical content and plausibility of some of these alternative value-enhancing mechanisms in contrast to the empirical implications derived from managerial entrenchment types of explanation.
Note that the outcome of this line of research is relevant to a much wider audience than the one exclusively composed by the subset of the academic community always willing to increase their stock of knowledge about these issues. The conclusions of this research could have policy implications regarding how corporate governance should be regulated. In particular, if I can not find any empirical support for efficiency reasons to establish CAP, if all empirical evidence points out that the only purpose of these provisions is to allow managers to expropriate shareholder rents; should not the authorities limit their use or even prohibit its presence in corporate statutes?2
Recent research has found strong empirical evidence in favor of the managerial view type of explanation. A low level of shareholder�s rights seems to decrease firm market value3. However, CAP could still have value-enhancing effects in some concrete situations even if on average these positive effects do not compensate the value reduction consequences due to managerial entrenchment. In this paper, I investigate further the empirical implications of different proposed efficiency reasons behind CAP versus the implications of a managerial entrenchment point of view of CAP.
1 See for example Gompers, Ishii and Metrick (2003) for US and Santana and Aguiar (2004) for European corporations. 2 Easterbrook and Fischel (1981) advocate rules that would prevent managers from reacting to takeover bids. 3

IE Working Paper WP04/28 15/10/2004
2
In particular, I investigate the nature of the relationship between CAP and three variables: organizational capital, product market competition and long run corporate investment policies. For each one of these variables, I utilize previous literature to find contradictory empirical implications depending if CAP have been installed because efficiency or managerial entrenchment considerations.
First, CAP could be a device to promote managerial firm-specific investments. Managers may lack the incentives to invest time and effort in firm specific human capital unless they know ex-ante that shareholders are not going to appropriate ex-post the returns of this type of investments. Provisions that make harder for shareholders to fire the manager might increase ex-post managerial bargaining power and therefore give incentives to increase managerial firm-specific investments. If I assume that those firms with more organizational capital require more firm specific managerial investment, an empirical content of this argument would be that those firms with more organizational capital are more likely to present a high level of CAP.
On the contrary, from a managerial entrenchment perspective, CAP would allow more managerial slack through the isolation from the discipline of the market for corporate control. More managerial slack would translate in less development of firm specific organizational capital. Therefore, from a managerial entrenchment point of view, I would predict a non-positive relation between en organizational capital and CAP.
We try to measure organizational capital with different proxies. Simple measures are market to book ratio or R&D to sales ratio. More complicated measures require the complete estimation of a firm production function to identify organizational capital as the time-invariant Slow-type residual. For all measures I try without exception, I find that those firms with more organizational capital provide less instead of more take-over defense provisions. I conclude that there is no evidence that firms that decrease shareholder rights to provide the incentives for firm-specific managerial investments. Second, if I adopt a managerial entrenchment perspective, I should take into consideration those variables that could make managerial entrenchment especially costly for the corporation and its shareholders. Competition in the product market might increase the cost of managerial slack since marginal managerial productivity would be larger in competitive markets. Therefore, companies in competitive industries will be less likely to pass CAP that allow its managers to become entrenched and as a consequence less productive. This is a clear empirical implication for the managerial entrenchment perspective whereas up to our knowledge there are no pure efficiency considerations that could link CAP and product market competition. In our empirical analysis, I do indeed find a negative association between product market competition and the importance of CAP. This also supports a managerial entrenchment interpretation of CAP. The last4 efficiency argument departs from the usual assumption of perfect capital markets. Managers could have better information than capital markets to evaluate
4 There is an additional interesting relation that we do not investigate in this paper. CAP could provide more managerial on the job security in return for lower total managerial compensation. These restrictions of shareholder rights might imply a lower total price for the managerial input. From a managerial entrenchment point of view the empirical prediction would again be the opposite, more entrenched managers will tend to increase their own compensation. Fahlenbrach (2003) explore this possibility and

IE Working Paper WP04/28 15/10/2004
3
different investment decisions. This asymmetric information problem could be more pronounced for investments whose potential profitability depends on a long run horizon since in this case uncertainty is larger (Stein (1988)). If markets systematically under-price long term projects, managers subject to the discipline of the market for corporate control have an incentive to behave myopically and focus too much in short term earnings in detriment of the overall profit maximizing allocation of resources. However, if managers are protected from short-term pressures, the stock market under-valuation of long-term projects may have little effect on manager ´s behavior and managerial myopia might no longer exist. Taking this reasoning into account, CAP could be a device to solve an inefficiency and promote an optimal long-term investment policy and therefore a positive relation between long-term investment and CAP would be consistent with a value-enhancing justification for CAP.
From a managerial entrenchment perspective, managers could use its strong position to engage in building empire policies that might induce them to over-invest in long-live assets. Therefore the empirical implication from the entrenchment perspective also predicts a positive relation between CAP and investment in long-lived assets.
We show how in our sample firms that allow a larger degree of protection invest in assets with a larger useful life. This finding is consistent both with efficiency and managerial entrenchment justifications for CAP and therefore I proceed a step further. I investigate how the stock market values corporations that invest in longer-lived versus short-lived assets both contemporaneously and in the future. If stock market values myopically long run investment, I should observe that companies that follow this investment policy should have a market penalization in the time period they indeed invest but a market premium some years after the investment has been made. I show how companies that invest in long-lived assets have a penalty the period they commit the investment but also many years after. This finding contradicts the hypothesis of myopic stock market and therefore supports once more a managerial entrenchment interpretation of CAP.
The rest of the paper is structured as follows. In Section 2 I briefly review the literature about the topic. Section 3 describes our data and the process I have used to construct our variables. I show our results in section 4, while Section 5 concludes and discusses the limitations of the study.
1. Literature Review
What is the effect of corporate antitakeover provisions? We can easily identify two broad opposite views in the literature. On one hand these provisions could worsen the principal agent problem between managers and shareholders through isolating the managerial function from the discipline provided by the market for corporate control. According to this view, these provisions clearly destroy shareholders´ value. As I explain below, the proponents of this negative opinion have accumulated a substantial body of evidence in support of this assertion. On the other hand, other subset of the literature defends the value-enhancing characteristic of antitakeover provisions. I review them in detail below.
again his findings support CAP as a managerial entrenchment devices. Those companies with larger managerial compensation have more instead of fewer4 takeover defenses.

IE Working Paper WP04/28 15/10/2004
4
Up to our knowledge, the literature has found consistent evidence that corporate antitakeover measures is consistent with practices that destroy shareholder�s value with the exception of Linn and McConnell (1983) that report an increase in stock prices when antitakeover amendments are approved.
Bertrand and Mullinathan (1999a) report that the adoption of antitakeover statutes weakened managers´ incentives to minimize labor costs. Garvey and Hanka (1999) conclude that antitakeover statutes �allow managers to pursue goals other than maximizing shareholder wealth� while Borokhovich, Brunarski and Parrino (1997) find a positive association between antitakeover corporate protection provisions and total managerial compensation.
Bebchuk, Coates and Subramania (2003) report a first order negative effect of takeover defenses on shareholders wealth. They find that those targets of a hostile takeover attempt with larger corporate defense provisions are more likely to remain independent. As a consequence, their shareholders lose significant abnormal returns from the acquisition premium. Bebchuk (2002) surveys the literature to make a strong case against the board veto in corporate takeovers.
More related to this paper, Gomper, Ishii and Metrick (2003) construct an index of corporate antitakeover protection -which I will later use- that summarizes information from corporate statutes and state antitakeover arrangements. They find that a larger level of corporate antitakeover protection is related to lower equity returns, lower profit margins and lower sales growth. Moreover, they find that managers that enjoy a larger level of antitakeover protection are more likely to engage in empire-building activities like capital expenditures and corporate acquisitions. On the opposite side of this debate5, Lipton and Rowe (2002) argue that managers have better information than shareholders about the real long run value of the company. In light of this, managers can add value to the shareholders by rejecting takeover attempts whose offer is inferior to the real long run value of the company. However, Bebchuk, Coates 4 and Subramanian (2003) do find substantial superior long run shareholder returns for those companies that accept rather than reject a hostile takeover attempt. Alternatively, these antitakeover provisions could enlarge shareholders´ joint bargaining power and thus increase the premium paid in acquisitions. Shareholders could be dispersed and these antitakeover provisions would allow managers to act as a single agent in behalf of shareholders and therefore obtain better financial conditions6. Yet, Bebchuk, Coates and Subramanian (2003) find no statistically significant premium for those acquired targets with staggered boards. We can conclude from this literature review that there is a strong body of evidence that find that antitakeover provisions destroy shareholder�s value. At the same time, some value-enhancing arguments in favor of antitakeover provisions are not supported by the data. In section 2 I discuss other potential efficiency reasons to introduce anti-takeover provisions and I test its empirical validity in section 3. 5 Bebchuk (2002) surveys all efficiency arguments in favor of the existence of board veto. This section has relied on this Survey extensively. 6 See for example Stultz (1988).
IE Working Paper WP04/28 15/10/2004
5
2. Analytical Framework In this section I discuss distinct implications of a managerial entrenchment versus a value-enhancing device interpretation of CAP. As I detail below, both views have different predictions regarding the relationship of CAP with three different variables: organizational capital, product market competition and long run investment policies. I explore and state these empirical implications in the form of contradictory hypothesis that will be tested in section 3.
2.1. Organizational capital and Corporate Antitakeover Provisions (CAP)
Organizational capital and CAP as a corporate value-enhancing device
Economists have been studying extensively the different implications of the existence of firm-specific human capital since Becker (1962) introduced the analysis of on the job specific investments. These investments are those whose marginal productivity is lower outside rather than inside the firm. In the extreme case, if these investments are entirely firm specific, they have no effect on productivity that would be useful in other firms. Given this characteristic, no rational employee would be willing to invest in firm specific human capital unless the firms incur in all the burden of these investments7.
For the particular case of the managerial function, these firm specific investments could consist in a wide variety of concepts like investments in better knowledge of the coordination and production processes particular to the corporation8; investments in better knowledge of the different organization individuals9 and / or corporate business units; and more generally speaking, they could consist in any investment in the development of managerial resources and capabilities whose productivity outside the firm is lower than inside.
We can see the same idea from a different perspective considering a multi-task managerial job in which managers have to allocate their time between two possible tasks. Both managerial tasks create value for the corporation but while one task generates firm-specific skills or capabilities the other produces a more general type of managerial skills. Under mild conditions, it is straightforward to see that managers will have an incentive to invest more time or effort in the task that is not firm specific because it increases more the value of the managerial outside option and therefore increases more total managerial wealth.
For example, consider a situation in which managers have to decide the allocation of a fixed amount of time between two managerial tasks. In one of them, managers spend time talking and interacting directly to the firm employees and these conversations allow the managers to acquire a better knowledge of their employees� skills and capabilities. As a result they can make a better allocation of employees at the different company jobs and/or hierarchy levels. Alternatively, managers can spend time and effort in representing the firm interests in different events favorable to build a network
7 For a detailed analysis see Becker (1964) pp 40-50. 8 See for example the organizational routines described in Nelson and Winter (1982). 9 For example in Prescott and Visscher (1982) the firm �naturally �learns about the different skills of its employees when employee tenure increases. If managers need to spend time and exert some effort to observe and infer the different skill of its employees this would be an example of firm-specific investment since this managerial knowledge is useless outside the firm.

IE Working Paper WP04/28 15/10/2004
6
of contacts that create value for the company but that additionally improve the potential of a future managerial career outside the organization. Firm owners cannot observe nor monitor the allocation of managerial time between tasks10. In this framework, managers will have an incentive to devote more time to the second task to the detriment of the amount of time dedicated to the firm-specific task since the more general task increases the value assigned to the manager in the external labor market while the firm-specific task does not. For this reason, the general task increases the managerial bargaining power more than what the firm-specific task does.
As a consequence of the previous argument, managers will have an incentive to over-invest/under-invest in managerial tasks that produce general / firm-specific skills or capabilities. One possible way to mitigate this problem could be to introduce CAP. By construction, these provisions make less likely that managers will have to depart from their current company. Therefore, managers will have fewer incentives to neglect those managerial tasks that generate firm-specific capabilities. For this reason, CAP could increase total firm profits.
Under a value-enhancing interpretation of CAP, those corporations in which firm specific organizational capital play a larger role will be more likely to introduce CAP in their statutes. The key implicit assumption is that the marginal productivity of managerial firm-specific capabilities is larger in those organizations with more organizational capital.
Organizational capital and CAP as a managerial entrenchment device
Shleifer and Vishny (1989) present an argument that could yield the exactly opposite prediction to the one above: According to their paper, managers could invest in managerial projects that are specific to their human capital. Proceeding in this way, firm-specific organizational capital is also going to be manager-specific and managers will be more entrenched precisely in those firms with more organizational capital. As a consequence, corporate anti-takeover provisions could be less necessary in those firms with more firm-specific capital since managers already enjoy some degree of on-the-job security.
Also, I could argue from a managerial entrenchment point of view that CAP allows a larger degree of managerial slack and as a consequence managers neglect the construction or maintenance of organizational capital. Therefore in the data I should observe larger CAP associated with a lower level of organizational capital. Following a different argument derived from a managerial entrenchment interpretation, the implication is a negative relation between organization capital and CAP:
Summarizing the last paragraphs, I have two opposite predictions regarding the relationship between firm specific organizational capital and CAP depending which view about CAP I use. Which interpretation describes reality more accurately is an empirical matter that I examine below: A positive relationship would support an efficiency reason behind corporate anti-takeover provisions while a negative one would support CAP as a managerial entrenchment device. 10 Alternatively we could assume that firm owners imperfectly observe managerial behavior.

IE Working Paper WP04/28 15/10/2004
7
2.2. Product Market Competition and CAP Product market competition and CAP as a corporate value-enhancing device
Up to our knowledge, there does not exist in the literature reasons that consider CAP as a value-enhancing device and at the same time predict some type of relation of either sign between CAP and product market competition.
Product market competition and CAP as a managerial entrenchment device
Competition in the product market might increase the cost of managerial slackness since marginal managerial productivity would be larger in competitive markets (See Raith (2003)). Therefore, companies in competitive industries will be less likely to pass CAP that allow its managers to become entrenched. If not, the combination of managerial slack and competitive markets could have strong negative effects for the corporation. From this point of view, I would expect a negative relation between CAP and product market competition.
2.3. Long-term investment policies and CAP Long-term investment policies CAP as a corporate value-enhancing mechanism
device
Managers could have better information than capital markets to evaluate different investment projects. Additionally, this information could be hard to transmit to analysts either because processing this information requires firm specific knowledge that it is costly to obtain or because the total disclosure of information could put into risk the success of the investment due to strategic considerations. This asymmetric information problem could be more severe for long-term investments where the uncertainty surrounding the projects is larger and the strategic considerations more important.
As a consequence of the previous argument capital markets might have more problems to correctly evaluate long term rather than short-term projects. If this is the case, long run projects might depress share prices even if they are good investment decisions that maximize shareholder ´s wealth. As a result, managers that engage corporate resources in projects whose profitability require a long run horizon could be more likely to lose their job.
Depressed stock prices might provoke hostile takeovers attempts that might be successful resulting in the paradox of managers losing control of the company even if managerial actions were entirely aligned with shareholders long-term interests. The equilibrium result of this effect would be a natural reluctance of managers to long-term investments. Therefore, unprotected managers might have an incentive to allocate less than optimal amount of resources to long-term investments11. Under this perspective, anti-takeover corporate provisions could be a device to solve this inefficiency and promote an optimal long-term investment policy. Firms that invest more in long-term projects will allow a larger degree of anti-takeover protection to their managers Long-term investment policies and CAP as a managerial entrenchment device
11 This argument is developed in Stein (1988)

IE Working Paper WP04/28 15/10/2004
8
Managers isolated from the discipline of the market for corporate control might be more likely to engage in empire building activities (Jensen (1986)). Gompers, Ishii and Metrick (2003) indeed find that corporations with substantial antitakeover protection present a larger level of capital expenditures. In this context, one more dimension of managerial empire building could be over-investment in longer-lived assets. Note that this line of reasoning implies the same prediction as the one I derived when considering CAP a value-enhancing mechanism that serves the purpose of providing the �right� managerial incentives for the efficient long-term investment policy. As a result, up to this point, both views of long-term investments are observationally equivalent. Yet, I can still differentiate between both hypotheses if the stock market over or undervalues long term investments. For this purpose, I design a test that measures how the stock market reacts to long-term investment both when the investment is made and some years after. The strategy is straightforward: if the stock market is myopic, a portfolio of companies that invest in longer-lived assets more than the average company would present negative abnormal returns when the investment is made but instead it would earn positive abnormal returns some years after; once the payoffs of this type of long term investment increase the cash flow of the company at apparently no cost. I explain in detail the construction of these portfolios as well as the results in Section 3. 3. Data and Variable Description
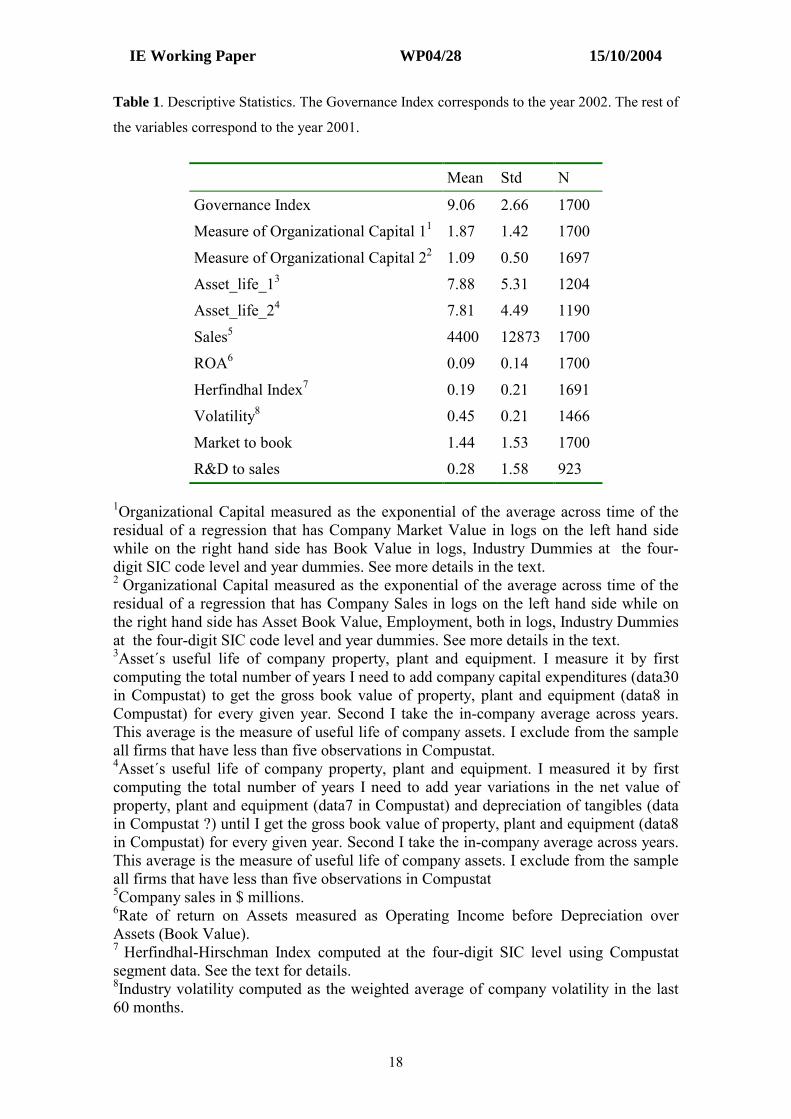
We combine data from four different sources. From Compustat Industrial (1982-2001), I take corporate information for all US public companies; from Compustat Segment (1982-2001) I get business segment data. Finally, I incorporate the Corporate Governance Index from the Investor Responsibility Research Center (IRRC). I cross the information from the three data sets using the company ticker. Table I show the descriptive statistics of the variables I will use later in the analysis
Most variables I use in the next section do not deserve further explanation since they come directly from the above-mentioned sources without further manipulation. However, some of them require a construction process that I explain in detail below. Governance Index We use as a measure of shareholder rights the index constructed by Gompers, Ishii and Metrick (2003), from now on GIM. This Corporate Governance Index summarizes information of 24 distinct corporate-governance provisions for approximately 1700 firms. GIM identify five different groups of rules: tactics for delaying hostile bidders; shareholders rights in elections or charter/bylaw amendments; director/officer protection, other takeover defenses and state laws. The index is constructed by adding one point for every provision that restricts shareholder rights/increases managerial power. Examples of these corporate provisions are: poison pills, indemnification contracts to the managers or supermajority rules to approve a hostile takeover. For more and detailed information of the construction of this Corporate Governance Index see the original GIM article.

IE Working Paper WP04/28 15/10/2004
9
Industry Concentration Index
For operational purposes, I define industry as a four-digit SIC code. I compute total industry sales in a given year by adding all sales of all business units that operate in that particular industry that given year according to how public corporations report it. Note that this measure of industry sales includes sales from all public companies that report operations exclusively in a single four digit SIC code and segment sales corresponding to those divisions of diversified firms that report operations in the same four-digit SIC code. Once I have constructed this measure of total industry sales I compute the Herfindhal-Hirschman Index (HFI) of market concentration:
HFI = Σn
i=1 si2
Where si represents the company (or individual segment) market share and is equal to individual company (or individual segment) sales over total industry sales. For example, if in a given four digit SIC code XXXX in the year 2001 there is one non-diversified company with total sales equal to 300 million and two divisions of diversified companies one division that reports 300 millions in sales and the other division reporting 100 millions in sales. In this case, the HFI would be equal to (200/600)2 + (100/600)2 + (300/600)2 = 0.38.
Industry Volatility
We measure industry volatility by the weighted average of firm volatility. The corporations I use for constructing this measure only operate in one industry, this is, they report operations just in a single segment. The weights I use are the market share of each segment as I have described just above. The measure of individual firm volatility is monthly stock market volatility in the past 60 months. Organizational Capital The task of measuring organizational capital represents a considerable challenge. I use up to three different proxies to try to capture this elusive concept. Each particular proxy taken in isolation arises some suspicious about what it is really measuring. However, as I will show later, our empirical results do not change with the proxies of organizational capital I use and therefore I feel confident that I are capturing the main effect of organizational capital on the restriction of shareholder rights.
The first proxy I use is simply the market value to book value ratio. This ratio has already been widely used in the literature for this purpose. The assumption is that the excess value of the company over the value of its assets captures the firm organizational capital. However, it is widely accepted that this ratio also captures other variables like future expectation of firm growth or profitability. Furthermore, this ratio varies systematically across industries and I need to have this in mind if I want to use it to identify firm specific organization capital. Our second proxy for firm organizational capital also uses the market to book ratio but modified in a certain way that tries to overcome the above-mentioned drawbacks. I propose the following specification for a given company i:

IE Working Paper WP04/28 15/10/2004
10
log(MV)it = Ii + Tt + αlogBVit + logOi + eit (1) Where MV represents firm market value, I captures industry fixed effects, T stands for year fixed effects, α is a coefficient to be estimated, BV is the book value of firm assets, O is organization capital and e represents other unobservable variables that I assume has expected value of zero and that they are statistically independent of the explanatory variables. We estimate (1) running a regression with market value as dependent variable and book value, industry dummies and year dummies as independent variables. I obtain O by computing the average across time of the residual of the regression. This is our second proxy of organization capital. I use Compustat Annual information for the 21-year period 1982-2002. Since not all firms are present the whole 21 year-period, I restrict the sample to take into account only those companies that have at least five annual observations. I display the estimation of this preliminary regression in Table II. Our third proxy of organization capital assumes the following specification that assumes a Cobb-Douglas firm production function:
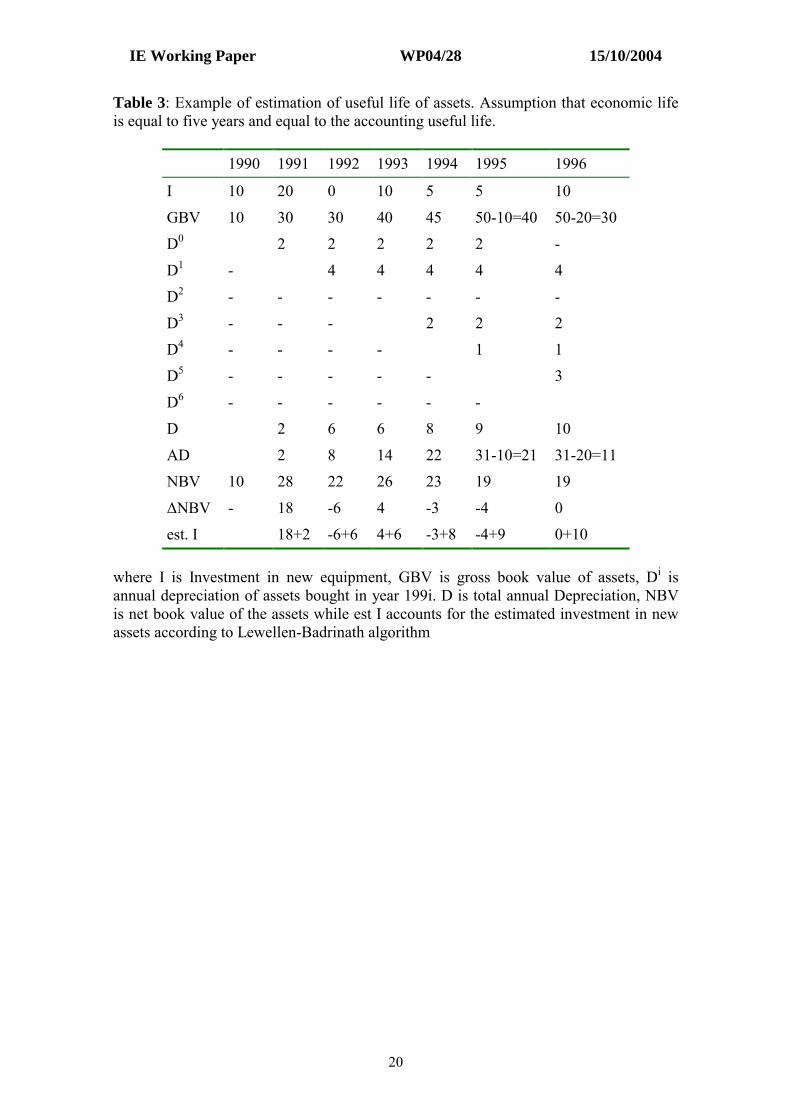
log(Sales)it = Ii + Tt + αlogKit +β logLit + logOi + eit (2) where Sales represents total firm sales, K is firm total capital, α and β are coefficients to be estimated, L is total number of firm employees while I, T and e keep the same terminology as immediately above. I estimate (2) and find the estimate of firm organization capital following exactly the same steps as I did above. This is, I run a regression with log sales as dependent variable and firm employees, firm assets, industry and year dummies as independent variables. The results of this preliminary regression can be found in Table 2. Firm specific organizational capital is computed as the time-invariant part of e. Estimated average useful life of company assets Lewellen-Badrinath (1997), from now on LB, propose an algorithm that estimates the replacement value of company assets used when computing the denominator of Tobin�s Q. As the first steps of their algorithm, they find endogenously an estimation of the economic12 useful life of company assets. I will use this first step as our measure of estimated average useful life of company assets. Although the LB procedure relies just in general accounting rules, the whole process can be quite cumbersome to follow. Therefore, I will first explain its logic with a simple example whose main features are detailed in Table 3. Assume a new company is created the thirty first of December of 1990 with new capital investment whose value is equal to 10. All capital equipment has a homogeneous asset life of five years. Assume for simplicity that all investment in capital equipment is actually done the last day of each year. Table 3 depicts the series of investments in capital equipment until 1996 and the corresponding accounting of different items: gross book value, depreciation, accumulated depreciation and net book value of the capital equipment. Note that in reality I may not observe the investment in new capital equipment but I do observe gross and net book value, annual depreciation and accumulated depreciation. From this
12 As opposed to accounting useful life of the assets.

IE Working Paper WP04/28 15/10/2004
11
data I want to infer the estimated useful life of the asset. First I reconstruct the series of company capital investments, note that in Table 3 the following relation is satisfied:
It = ∆NBVt + Dt (3)
where I is investment in new capital equipment, ∆NBVt is increase in net book value while Dt is annual depreciation. Once I have the series of It then note that I can recover the useful life of the asset by finding the N that satisfies:
Σi=0
N-1 (IT-i ) = GBVT (4)
where GBV represents gross book value of the assets. For example in Table 3 if I want to recover the estimated useful life of the capital equipment in use in 1995 I have just to add back the series of investments until I get the gross book value of the assets equal to 40. In this case I need to add five years of investments (40 = 5+5+10+0+20) and therefore I will correctly infer the economic useful life of the assets. This procedure has a number of problems, one can be immediately observed in Table III. If I want to compute the estimated useful life of the assets starting in 1996, I will add the investments until I get the gross book value of the assets in this year equal to 30. Note that in this way I will add 10+5+5+10 to get an incorrect asset useful life equal to 4 years. The reason for this error is that in 1992 the company did not make any investment in capital equipment. Generally speaking, this procedure incorrectly estimates (N-x) instead of N as the useful life of the assets in place at time t whenever investment in capital equipment is zero at t- (N-1), t-(N-2),�,t-(x-1). However, I believe that this is not going to constitute a serious problem in our data since most observations have investment different than zero. Another problem in this procedure is that (3) is only satisfied when the net book value of the retired assets is equal to zero. As I show below, (3) is satisfied if and only if the gross book value of the retired assets is equal to the accumulated depreciation. However if the corporation sells capital equipment before it has been totally depreciated I are going to under-estimate It and as a consequence over-estimate N. To see this I follow LB and consider the following accounting identities:
GBVt = GBVt-1 + It �RBV t (5)
ADt = ADt-1 �Rt +Dt (6)
Where AD accounts for accumulated depreciation, I investment, D annual depreciation, R accumulated depreciation of retired assets and RBV acquisition cost of retired assets. Note that RBV =R+bv where bv is the net accounting value of the retired assets. Note also NBV = GBV-AD. Combining (5) and (6) I can get
It = NBVt � NBVt-1 + Dt + bvt (7)
Thus, (3) is satisfied if and only if bv =0.
Note that this last problem could be avoided if I could observe indeed the real series of investments made by the company. Indeed, Compustat reports this information in the

IE Working Paper WP04/28 15/10/2004
12
item Property, Plant and Equipment Capital Expenditures13. This item �represents the funds used for addition to property, plant and equipment, excluding amounts arising from acquisitions for an operating segment�14. I compute the estimated useful life of the assets using both procedures to compute the series of investments. One deducting investment as in BL above and the other taking as investments the amount reported by the company in Property, Plant and Equipment Capital Expenditures. Summary of the procedure:
1. We have computed the series of company investment It using two different mechanisms. In the first one I take directly investment in Property, Plant and Equipment as reported by the company in the item Property, Plant and Equipment Capital Expenditures15. This item �represents the funds used for addition to property, plant and equipment, excluding amounts arising from acquisitions for an operating segment�16. As a second approach I compute the series of company investments by finding the year increase in the book value of Property, Plant and Equipment net of depreciation17
2. We estimate the useful life of the asset of a given company at time T as the N that satisfies:
Σt=1
N (IT-t ) ≥ GBVt (8)
3. From procedures 1 and 2 I have an estimation of the useful life of the assets NT for all years in which the company is in Compustat. I exclude from the sample those companies from which I have less than five-year observations. I compute the average of NT across years. This average is our estimation of the useful life of company assets. For both procedures I use information extracted from Compustat for the period 1960-2002. Note that I are unable to find an estimate of the useful life of assets for those companies that the sum of investments never adds to the total gross book value of property, plant and equipment. In this way I cannot assign an estimated useful life of assets among others of those companies that have gone public in relatively recent years. Both ways of computing the historical series of company investments give similar results in terms of descriptive statistics and number of missing observations. Table 1 shows the descriptive statistics of the estimated useful life of the assets using the two different methods. The average estimated useful life of company property, plant and equipment using any of the two series of investment is around eight years.
4. Results Sample and Controls
We control for firm size since in large companies moral hazard and the monitoring problem is potentially worse (Demsetz and Lehn (1985)). Additionally, I control for industry volatility because it may affect managerial productivity increasing the cost of managerial slack (Prendergast (2002)). Finally, I control by firm rate of return on assets (ROA) since I want to differentiate the effect of organizational capital on CAP from the effect of performance.
13 Data30 in Compustat. 14 See Compustat Manual page 216. 15 Data30 in Compustat. 16 See Compustat Manual page 216. 17 Data7 in Compustat.

IE Working Paper WP04/28 15/10/2004
13
Since the Corporate Governance Index constructed by GIM has a small time variation (see GIM (2003)) I just use the cross section corresponding to the year 2002 while the rest of the variables correspond to the values of the year 2001. Table 1 shows the descriptive statistics of the variables I use in the regressions.
Regressions
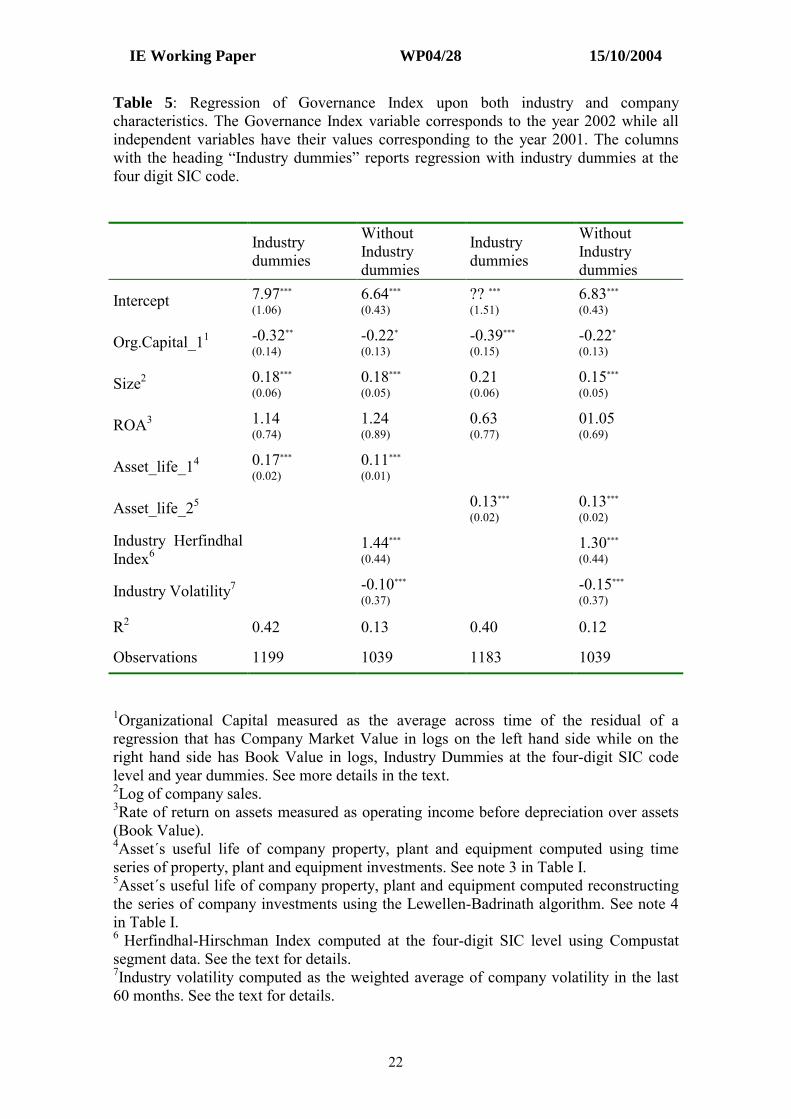
Table 4 displays the results of a ordinary least square regression of governance index over different measures of in-company organizational capital, firm volatility, industry concentration and two controls: firm size, and firm ROA. I show the regressions both with and without industry dummies corresponding to four digit SIC code but the results are qualitatively the same. Without exception, all measures of organizational capital are strongly negatively correlated with the corporate governance index. Firms with more organizational capital protect less their executives. This contradicts an efficiency reason of antitakeover reasons to promote firm-specific managerial investment and supports a managerial entrenchment point of view. This result would support indirectly Shleifer and Vishny (1989). Firms with more organizational capital are less attractive targets and thus their managers do not need corporate provisions that protect them from hostile takeover attempts. Table 4 displays how industry volatility is negatively correlated with defensive take-over provisions. In non-reported results firm volatility is similarly negatively correlated with the corporate governance index18. Additionally, note that the industry concentration measure is positively and significantly related to the managerial protection index. When product market competition is weaker, companies allow a larger degree of takeover defenses to their managers. More competitive markets protect less their managers from the discipline of the market for corporate control. The regressions in Table 4 have a potential technical problem. Since the industry concentration ratio variable is the same for all those firms operating in the same industry, the standard error of the ordinary least squares estimator are potentially biased upwards and as a consequence I can not trust the statistical significance of the coefficient. Because of this problem, I run industry-level regressions of average firm CAP on the industry concentration ratio whose results I show in Table 6. I see that the previous results do not change and that more concentrated industries present more average takeover defenses. This relation is both economically and statistically significant. Overall, up to now all our empirical results are remarkably consistent. I have found that there are no efficiency reasons behind corporate anti-take over provisions. On the contrary, all the evidence I find is consistent with an agency view in which the only purpose of these provisions is defending the managerial selfish interest. Summarizing, firms that operate in highly volatile environments allow higher protection to its managers; anti-take over corporate provisions is not associated with a higher presence of firm-specific organizational capital and therefore the purpose of these provisions can not be motivating firm-specific managerial investment; significantly, more anti-take over defenses are found in those firms more isolated from the discipline of product market competition. Our next results investigate if CAP provide managers the right incentives to avoid under investment in long term projects. As a first step I study the relation between long-term investments and anti-takeover protection. Table 5 shows how there is a robust and statistically significant positive
18 These results are available upon request to the authors.

IE Working Paper WP04/28 15/10/2004
14
relation between the estimated useful life of company assets and the index of corporate governance protection. Companies that allow a larger level of anti-takeover protection do indeed have more long run investments. This relationship exists using any of our two estimates of useful asset life with and without industry dummies. Economically the estimated relation is strikingly strong: An increase of 10 years in average useful life of company assets is associated with an increase of around one point in the corporate governance index. According to the way GIM constructed the index, this increase is equivalent to have one more corporate provision that protects from hostile takeovers. More takeover defenses are associated with a larger level of long-term investment. Yet this is consistent both with managerial entrenchment and CAP as a value-enhancing mechanism as I have discussed in Section 2. Next I investigate how the stock market values those companies that invest in long-term assets both in the short and in the long run. If stock market is indeed myopic, I should observe a two-part phenomenon. First, a penalization for those companies that do invest in longer-lived assets when they report the investment. Second, a premium for the same companies in the long run corresponding to the extra returns that these companies achieve that the stock market did not foresee when the investment was made. With this in mind, I follow the following procedure. I take from Compustat information of public companies for the period 1950-2002. For those corporations that have been public at least five years I compute the estimated useful life of property, plant and equipment as it has been explained above. With this I order the sample by year and by the current estimated useful life of company assets. From CRSP I take monthly corporate stock market returns. Then, I construct a value weighted19 portfolio of those companies belonging to the first quartile with smallest asset useful life and another value weighted portfolio of those companies belonging to the fourth quartile with largest estimated useful life of the assets. Once I have the returns of both portfolios for the twenty-one year period 1982-2002 I find their risk-adjusted excess returns. Using the Fama-French (1993) factors20 I estimate the following regression:
ttttft MomentumHMLSMBMKTrR 4321 ββββα ++++=− (9) where Rt is the monthly return of the portfolio, rf is the one month Treasury rate, MKT is the excess return on the market, SMB is the average return on the three small portfolios minus the average return on the three big portfolios, HML is the average return on the two value portfolios minus the average return on the two growth portfolios measured using book to market ratios while Momentum is the average return on the two high prior return portfolios minus the average return on the two low prior return portfolios, for more details on the construction of these four factor see Fama-French (1993). In the expression depicted in (9) I are exclusively interested in α that measures the risk-adjusted excess returns of the portfolio. In the first two rows of Table 7 I can see that the portfolio of those firms that invest in shorter-lived assets has monthly excess returns of around 1.5% while the portfolio of those companies that invest in longer-lived assets has neither a premium nor a discount. I interpret these findings as evidence that the stock market indeed rewards shorter-term investments.
19 The weights used are the market value at the beginning of the year. 20 We download the four factors from the Kenneth French web page.

IE Working Paper WP04/28 15/10/2004
15
Next I investigate the second implication of a myopic stock market. For this goal, I study if corporations that invest in longer-lived assets indeed have unexpected risk-adjusted excess returns later in the future. I construct portfolios in a similar way as I have described in the paragraph above but now using the quantiles of the distribution of the useful life of the company assets three and five years before. For example, at the beginning of the year 1995 I construct a portfolio of those corporations that invested in longer-lived assets in 1990 and compute their monthly performance in the year 1995. For the year 1996 I construct a portfolio of those companies that invested in longer term assets in the year 1991 and so on. Again, I build portfolios for those companies that invested in longer and also shorter lived assets both three and five years before and compute the α in expression (9). The results are shown in the last four rows of Table 7. The important result is that corporations that invested in longer-lived assets in the past do not present unexpected risk-adjusted excess returns21in the future. Therefore, I reject the myopic stock market hypothesis and I conclude that the positive relation between estimated useful life of company assets and CAP that I have reported in Table 5 is due to managerial entrenchment and empire building corporate policies rather than value-enhancing devices to maximize long-term shareholder�s wealth.
CONCLUSIONS AND LIMITATIONS OF THE STUDY We have tested and rejected two possible efficiency reasons that could explain why firms introduce corporate anti-takeover provisions: a) To promote firm-specific managerial investments b) to provide managers the right incentives to maximize long term shareholder�s wealth by isolating them from the pressures of a myopic stock market. In addition Fahlenbrach (2003) reports that CAP is not associated with lower but higher total managerial compensation. Furthermore, I have shown that competition in the product market limits significatively the degree of takeover defenses that corporations can allow to their management team. Overall, all the evidence points out to interpret CAP as a managerial entrenchment device and not as a corporate-value-enhancing mechanism. This result is consistent with the findings of previous literature. The main limitation of this empirical study, as in many others, is the issue of causality. For instance, do corporate anti-takeover provisions induce managers to invest less in organizational capital or companies with lower organizational capital are more likely to adopt takeover defenses? Given the nature of the data I cannot address this problem properly. For example I cannot introduce firm fixed effects since the variability of corporate anti-takeover provisions through time is small. Future work should try to correct this problem searching for the right instruments to control for this endogeneity problem.
21 In non-reported results we find that a stock market premium does not exist either if we study the stock market performance of those companies that invested in longer-lived assets even ten years before.
IE Working Paper WP04/28 15/10/2004
16
REFERENCES Aguion, P., Tirole, J., 1997. Formal and real authority in organizations, Journal of Political Economy 105, 1-29. Barney, J.B., 1991. Firm resources and sustained competitive advantage. Journal of Management 17, 99-120. Bebchuk, L.A., 2002. The Case Against Board Veto in Corporate Takeovers. University of Chicago Law Review 69, 973-1035. Bebchuk, L.A., Coates IV J.C., Subramanian G., 2002. The powerful antitakeover force of staggered boards: theory, evidence & policy. Stanford Law Review 54, 887-951. Becker, G. ,1962. Investment in Human Beings. NBER Special Conference 15, suplement to Journal of Political Economy, 9-49. Becker, G., 1964. Human Capital. The University of Chicago Press. Chicago. Bertrand, M., Mullinathan, S., 1999. Is there discretion in wage setting? A test using takeover legislation, Rand Journal of Economics 30, 535-554. Bertrand, M., Mullinathan, S., 1999. Executive compensation and incentives: The impact of takeover legislation. NBER Working Paper No 6830. Borokhovich, K. A., Brunarski, K.R., and Parrino, R., 1997. CEO contracting and antitakeover amendment. Journal of Finance 52, 1495-1515. Demsetz H. and Lehn K., 1985. The structure of corporate ownership: Causes and consequences, Journal of Political Economy 93, 1155-1177. Easterbrook, F., Fischel, D., 1981. The proper role of a target�s management in responding to a tender offer. Harvard Law Review 94, 1161-1204. Fama, E. F., and French, K. R. (1993). Industry costs of equity. Journal of Financial Economics 43, 153-194. Fahlenbrach, R. (2003). Shareholder�s Rights and CEO Compensation. Unpublished manuscript, The Wharton School of Business, University of Pennsylvania. Garvey G., Hank, G. , 1999. Capital Structure and Corporate Control: The Effect of Antitakeover Statutes on Firm Leverage. Journal of Finance 54, 519-520. Gompers, P., Ishii, J., Metrick, A., 2003. Corporate governance and equity prices. The Quarterly Journal Of Economics 118, 107-155. Jensen, M., 1986. Agency Costs of Free Cash Flows, Corporate Finance and Takeovers. American Economic Review 76, 289-343. Lev B. Suresh R., 2003. The measurement of firm specific organizational capital, NBER Working Paper.

IE Working Paper WP04/28 15/10/2004
17
Lewellen W. G., Badrinath S. G., 1997. On the measurement of Tobin�s Q. Journal of Financial Economics 44 , 77-122. Linn, S.C., McConnell, J.J. 1983. An empirical investigation of the impact of antitakeover amendments on common stock prices. Journal of Financial Economics 11, 361-399. Lipton, M., Rowe, P.K., 2002. Pills, polls and professors: A reply to professor Gilson. The Delaware Journal of Corporate Law 27, 1-55. Nelson, R. R., Winter S.G., 1982. An evolutionary theory of economic change. Harvard University Press. Cambridge Massachusetts. Prendergast C., 2002. The tenuous trade-off between risk and incentives. Journal of Political Economy 110, 1071-1102. Prescott, E. C., Visscher, M., 1980. Organization Capital. Journal of Political Economy 88, 446-61 Raith, M., (2003) Competition, Risk and Managerial Incentives. American Economic Review 93, 1425-1436. Santana D.J., Aguiar I., 2004. Propiedad y blindaje de las empresas cotizadas españolas. Comisión Nacional del Mercado de Valores, Monografía número 5. Shleifer, A., Vishny, R. W. , 1989. Management entrenchment: The case of manager-specific investments. Journal of Financial Economics 25 123-140. Stein J. C., 1988. Takeover threats and managerial myopia. Journal of Political Economy 96, 61-80. Stultz R., 1988. Managerial control of voting rights, financing policies and the market for corporate control. Journal of Financial Economics 20, 25-54.
IE Working Paper WP04/28 15/10/2004
18
Table 1. Descriptive Statistics. The Governance Index corresponds to the year 2002. The rest of
the variables correspond to the year 2001.
Mean Std N
Governance Index 9.06 2.66 1700
Measure of Organizational Capital 11 1.87 1.42 1700
Measure of Organizational Capital 22 1.09 0.50 1697
Asset_life_13 7.88 5.31 1204
Asset_life_24 7.81 4.49 1190
Sales5 4400 12873 1700
ROA6 0.09 0.14 1700
Herfindhal Index7 0.19 0.21 1691
Volatility8 0.45 0.21 1466
Market to book 1.44 1.53 1700
R&D to sales 0.28 1.58 923 1Organizational Capital measured as the exponential of the average across time of the residual of a regression that has Company Market Value in logs on the left hand side while on the right hand side has Book Value in logs, Industry Dummies at the four-digit SIC code level and year dummies. See more details in the text. 2 Organizational Capital measured as the exponential of the average across time of the residual of a regression that has Company Sales in logs on the left hand side while on the right hand side has Asset Book Value, Employment, both in logs, Industry Dummies at the four-digit SIC code level and year dummies. See more details in the text. 3Asset´s useful life of company property, plant and equipment. I measure it by first computing the total number of years I need to add company capital expenditures (data30 in Compustat) to get the gross book value of property, plant and equipment (data8 in Compustat) for every given year. Second I take the in-company average across years. This average is the measure of useful life of company assets. I exclude from the sample all firms that have less than five observations in Compustat. 4Asset´s useful life of company property, plant and equipment. I measured it by first computing the total number of years I need to add year variations in the net value of property, plant and equipment (data7 in Compustat) and depreciation of tangibles (data in Compustat ?) until I get the gross book value of property, plant and equipment (data8 in Compustat) for every given year. Second I take the in-company average across years. This average is the measure of useful life of company assets. I exclude from the sample all firms that have less than five observations in Compustat 5Company sales in $ millions. 6Rate of return on Assets measured as Operating Income before Depreciation over Assets (Book Value). 7 Herfindhal-Hirschman Index computed at the four-digit SIC level using Compustat segment data. See the text for details. 8Industry volatility computed as the weighted average of company volatility in the last 60 months.

IE Working Paper WP04/28 15/10/2004
19
Table 2: Preliminary regressions needed to find proxy measures of organizational capital. The total sample includes all active and inactive Companies in Compustat for the 20-year period of 1982-2002. I exclude all firms that do not have at least five years of information. Both regressions include Year Dummies as well as Industry Dummies at the four-digit SIC industry level.
Dependent Variable = Market Value1 Dependent Variable = Sales2
Asset Book Value3 0.91*** (0.000)
0.55***
(0.0002)
Employees4 0.49**
(0.002)
R2 0.80 0.92
Observations 135,463 136,911
1Price of the stock at the end of the year (data24 in Compustat Annual File) multiplied by the Number of Common Shares Outstanding (data25) 2 Log of Data12 in Compustat Annual File. 3Log of Data 6 in Compustat Annual File 4Log of Total Number of Firm Employees. .
IE Working Paper WP04/28 15/10/2004
20
Table 3: Example of estimation of useful life of assets. Assumption that economic life is equal to five years and equal to the accounting useful life.
1990 1991 1992 1993 1994 1995 1996
I 10 20 0 10 5 5 10
GBV 10 30 30 40 45 50-10=40 50-20=30
D0 2 2 2 2 2 -
D1 - 4 4 4 4 4
D2 - - - - - - -
D3 - - - 2 2 2
D4 - - - - 1 1
D5 - - - - - 3
D6 - - - - - -
D 2 6 6 8 9 10
AD 2 8 14 22 31-10=21 31-20=11
NBV 10 28 22 26 23 19 19
∆NBV - 18 -6 4 -3 -4 0
est. I 18+2 -6+6 4+6 -3+8 -4+9 0+10 where I is Investment in new equipment, GBV is gross book value of assets, Di is annual depreciation of assets bought in year 199i. D is total annual Depreciation, NBV is net book value of the assets while est I accounts for the estimated investment in new assets according to Lewellen-Badrinath algorithm

IE Working Paper WP04/28 15/10/2004
21
Table 4: Regression of Governance Index upon both industry and company characteristics. The Governance Index variable corresponds to the year 2002 while all independent variables have their values corresponding to the year 2001.
Industry dummies
Without Industry dummies
Industry dummies
Without Industry dummies
Industry dummies
Without Industry dummies
Intercept 7.53***
(1.01) 7.09***
(0.36) 7.46***
(1.00) 6.84***
(0.36) 7.70***
(1.00) 7.33***
(0.37)
Market to book -0.10** (0.05)
-0.13***
(0.04)
Org.Capital_11 -0.34*** (0.12)
-0.35***
(0.11)
Org.Capital_22 -0.40*** (0.17)
-0.32** (0.16)
Size3 0.33***
(0.04) 0.30***
(0.04) 0.34***
(0.05) 0.32***
(0.04) 0.32***
(0.05) 0.27***
(0.04)
ROA4 0.51 (0.52)
0.99**
(0.49) 0.62 (0.54)
0.98**
(0.50) 0.60 (0.55)
1.15**
(0.50)
Industry Herfindhal Index5 1.12***
(0.38) 1.10***
(0.38) 0.98**
(0.38)
Industry Volatility6 -0.86***
(0.31) -0.93***
(0.31) -0.82***
(0.31)
R2 0.31 0.08 0.31 0.08 0.31 0.07
Observations 1700 1466 1698 1466 1700 1480
1Organizational Capital measured as the average across time of the residual of a regression that has Company Market Value in logs on the left hand side while on the right hand side has Book Value in logs, Industry Dummies at the four-digit SIC code level and year dummies. See more details in the text. 2 Organizational Capital measured as the average across time of the residual of a regression that has Company Sales in logs on the left hand side while on the right hand side has Asset Book Value, Employment, both in logs, Industry Dummies at the four-digit SIC code level and year dummies. See more details in the text. 3Log of company sales. 4Rate of return on Assets measured as Operating Income before Depreciation over Assets (Book Value). 5 Herfindhal-Hirschman Index computed at the four-digit SIC level using Compustat segment data. See the text for details. 6Industry volatility computed as the weighted average of company volatility in the last 60 months. See the text for details.
IE Working Paper WP04/28 15/10/2004
22
Table 5: Regression of Governance Index upon both industry and company characteristics. The Governance Index variable corresponds to the year 2002 while all independent variables have their values corresponding to the year 2001. The columns with the heading �Industry dummies� reports regression with industry dummies at the four digit SIC code.
Industry dummies
Without Industry dummies
Industry dummies
Without Industry dummies
Intercept 7.97***
(1.06) 6.64***
(0.43) ?? ***
(1.51) 6.83***
(0.43)
Org.Capital_11 -0.32** (0.14)
-0.22*
(0.13) -0.39***
(0.15) -0.22*
(0.13)
Size2 0.18***
(0.06) 0.18***
(0.05) 0.21 (0.06)
0.15***
(0.05)
ROA3 1.14 (0.74)
1.24
(0.89) 0.63 (0.77)
01.05
(0.69)
Asset_life_14 0.17***
(0.02) 0.11***
(0.01)
Asset_life_25 0.13***
(0.02) 0.13***
(0.02)
Industry Herfindhal Index6 1.44***
(0.44) 1.30***
(0.44)
Industry Volatility7 -0.10***
(0.37) -0.15***
(0.37)
R2 0.42 0.13 0.40 0.12
Observations 1199 1039 1183 1039
1Organizational Capital measured as the average across time of the residual of a regression that has Company Market Value in logs on the left hand side while on the right hand side has Book Value in logs, Industry Dummies at the four-digit SIC code level and year dummies. See more details in the text. 2Log of company sales. 3Rate of return on assets measured as operating income before depreciation over assets (Book Value). 4Asset´s useful life of company property, plant and equipment computed using time series of property, plant and equipment investments. See note 3 in Table I. 5Asset´s useful life of company property, plant and equipment computed reconstructing the series of company investments using the Lewellen-Badrinath algorithm. See note 4 in Table I. 6 Herfindhal-Hirschman Index computed at the four-digit SIC level using Compustat segment data. See the text for details. 7Industry volatility computed as the weighted average of company volatility in the last 60 months. See the text for details.

IE Working Paper WP04/28 15/10/2004
23
Table 6: Industry level regressions of the mean industry Governance index on Concentration ratio for the year 2001. Intercept 8.92
(0.21) 8.91 (0.76)
Herfindahl Index 1.68***
(0.61) 1.68**
(0.71) Log of Industry Size 0.00
(0.07) R2 0.03 0.03 Obs 246 246

IE Working Paper WP04/28 15/10/2004
24
Table 7: Stock market evaluation of long term versus short-term investment
Each row shows the result of a regression with monthly returns of different portfolios minus the risk free rate (one month Treasury bill rate) as dependent variable and the Fama-French factors as independent variables. The period studied is 1982-2002 and therefore each regression has 252 observations. α represents the abnormal excess returns
1 MKT is the excess return on the market. It is calculated as the value-weight return on all NYSE, AMEX, and NASDAQ stocks (from CRSP) minus the one-month Treasury bill rate. See Fama-French (1993). 2 Small stock returns minus big stock returns, SMB, is the average return on the three small portfolios minus the average return on the three big portfolios. See Fama-French (1993). 3 HML (High Minus Low) is the average return on the two value portfolios minus the average return on the two growth portfolios measured using book to market ratios. See Fama-French (1993). 4 Up Minus Down) is the average return on the two high prior return portfolios minus the average return on the two low prior return portfolios, for more details see Fama-French (1993).
Α MKT1 SMB2 HML3 Momentum4 R2 Portfolio of firms with contemporaneous short-term investment
0.015***
(0.003) 1.25*** (0.07)
0.30***
(0.009) -1.24 (0.11)
-0.34***
(0.07) 0.79
Portfolio of firms with contemporaneous long-term investment
0.001 (0.001)
0.96***
(0.02) -0.08**
(0.03) 0.279***
(0.04) -0.047*
(0.024) 0.85
Portfolio of firms with short-term investment three years ago
0.013***
(0.003) 1.24***
(0.07) 0.32***
(0.09) -1.21***
(0.11) -0.37***
(0.06) 0.79
Portfolio of firms with long-term investment three years ago
0.001 (0.001)
0.97***
(0.03) -0.18***
(0.03) 0.35***
(0.04) -0.07***
(0.02) 0.82
Portfolio of firms with short-term investment five years ago
0.013***
(0.002) 1.26***
(0.07) 0.34***
(0.08) -1.07***
(0.10) -0.36***
(0.06) 0.81
Portfolio of firms with long-term investment five years ago
0.000 (0.001)
0.94***
(0.03) -0.21***
(0.03) 0.28***
(0.04) 0.000
(0.02) 0.82

NOTAS

Dep
ósito
Leg
al: M
-200
73
I.S.S
.N.:
1579
-487
3
NOTAS