determinants of dietary diversity and the potential role
TRANSCRIPT

RESEARCH ARTICLE
Determinants of dietary diversity and the
potential role of men in improving household
nutrition in Tanzania
Justus Ochieng1*, Victor Afari-Sefa2, Philipo Joseph Lukumay3, Thomas Dubois1
1 World Vegetable Center, Eastern and Southern Africa, Arusha, Tanzania, 2 World Vegetable Center, West
and Central Africa–Coastal and Humid Regions, IITA-Benin Campus, Cotonou, Benin, 3 Department of
Applied Economics and Statistics, University of Delaware, Newark, Delaware, United States of America
Abstract
Good nutrition is a prerequisite for a healthy and active life, especially for agriculture-depen-
dent households. However, diets in most households in Tanzania lack diversity because the
intake of meat, poultry, fish, and vegetables and fruits is low. This study estimates factors
influencing dietary diversity of the household, children under five years, and women using
primary survey data. It qualitatively assesses male dietary patterns and men’s potential role
in improving the nutritional status of the entire household. The findings show that the most
consumed foods within the household are cereals, vegetables, oils and fats, spices, condi-
ments and beverages. Children (d = 0.4; p<0.05) and women (d = 0.5; p<0.01) in female-
headed households have low dietary diversity compared to those in male-headed house-
holds. Women and children access less diverse diets since 46% and 26%, achieved mini-
mum dietary diversity respectively. Production of vegetables (coef. 0.34; p<0.05) play an
important role in improving the dietary diversity of women. Gender (coef. 0.05; p<0.10) and
education of the household head (coef. 0.02; p<0.01), food preparation and nutrition training
(coef. 0.10; p<0.05) are important factors influencing dietary diversity of the members of a
household. Results suggest that there is a need to support community-based programs to
provide information on food and the importance of vegetables, their preparation, consump-
tion and utilization to address food and nutrition challenges. Men can contribute towards
improving household nutrition security by reducing consumption of food away from the
home, especially during periods of food shortages. We recommend the use of complemen-
tary quantitative research to determine the patterns and dynamics of men’s dietary diversity
and compare it with that of other household members.
Introduction
Malnutrition is a problem affecting all countries and one in every three persons worldwide[1].
Consequently, ending all forms of malnutrition and providing access to safe, sufficient and
nutritious food for all people year-round by 2030 is one of the targets of the United Nation’s’
Sustainable Development Goals (SDGs). Nutritional deficiencies are responsible for lower
PLOS ONE | https://doi.org/10.1371/journal.pone.0189022 December 12, 2017 1 / 18
a1111111111
a1111111111
a1111111111
a1111111111
a1111111111
OPENACCESS
Citation: Ochieng J, Afari-Sefa V, Lukumay PJ,
Dubois T (2017) Determinants of dietary diversity
and the potential role of men in improving
household nutrition in Tanzania. PLoS ONE 12(12):
e0189022. https://doi.org/10.1371/journal.
pone.0189022
Editor: Jacobus P. van Wouwe, TNO,
NETHERLANDS
Received: September 14, 2016
Accepted: November 15, 2017
Published: December 12, 2017
Copyright: © 2017 Ochieng et al. This is an open
access article distributed under the terms of the
Creative Commons Attribution License, which
permits unrestricted use, distribution, and
reproduction in any medium, provided the original
author and source are credited.
Data Availability Statement: The data underlying
this study has been uploaded to Harvard
Dataverse. The data can be accessed at http://dx.
doi.org/10.7910/DVN/INRWQA or doi:10.7910/
DVN/INRWQA.
Funding: Funding for this research was provided
by the German Federal Ministry for Economic
Cooperation and Development (GIZ) – Tanzania,
Dar es Salaam, Grant Number 83219278. The
funders had no role in study design, data collection

adult work productivity, impaired physical and mental development, susceptibility to various
diseases, premature deaths in children and poor pregnancy outcome in women[2, 3]. Despite
the fact that great progress has been made in improving food and nutrition security over the
past decades, undernutrition causes 45% of child deaths globally [4] and the prevalence
remains high, especially in sub-Saharan Africa (SSA) and South Asia [5] with its estimated
average adult cost on these continents being equivalent to 8–11% of the gross domestic prod-
uct (GDP)[1].
Undernutrition persists in SSA, where limited dietary diversity is a major challenge and the
cause of malnutrition in rural and urban poor households [6,7]. Savy et al., [8]found that die-
tary diversity adequately represents the overall dietary quality of women in Burkina Faso and
is positively associated with their nutritional status. Most households rely heavily on carbohy-
drate-rich staple crops and consume few animal products, fruits or vegetables, partially leading
to increasing numbers of population experiencing malnutrition[6,7]. Although undernutrition
affects both the urban and rural poor, those residing in rural areas face additional challenges
such as social isolation, intermittent drought, limited participation of women in major eco-
nomic activities, limited market access, poor rural health services [9], poor roads and over reli-
ance on rain fed agriculture.
In Tanzania, undernutrition affects infants, children under five and women of child bearing
age[10]. Currently, stunting (short of their age) affects about 34% of children under five in
Tanzania, 5% are wasted (thin for their weight) and 14% are underweight (thin for their age)
while about 5.5% of women aged 15–49 years are underweight[10]. Additionally, the burden
of chronic undernutrition in Tanzania ranks third in SSA, after Ethiopia and the Democratic
Republic of Congo[1]. For children, diversified diet is important because they need energy and
nutrient rich foods for growth and a healthy life.
Research shows that undernutrition is particularly high among low income Tanzanian
households, mainly because they consume carbohydrate-rich staple-based diets low in miner-
als and vitamins[11]. Consumption of staple foods provide more energy to households, but
they are unable to adequately improve nutritional outcomes if not consumed together with
micronutrient-rich foods such as beef, fish, poultry, fruits and vegetables. Besides, provision of
energy-rich supplements to women during pregnancy leads to increased birth weight [12] but
availability and affordability of these supplements is quite a challenge in rural areas of Tanza-
nia. Households should not only consume adequate food quantities, but also safe and diversi-
fied foods. Most households in Tanzania depend on agriculture (more than 80% of the
population) and can produce more fruits and vegetables for consumption to increase dietary
diversity[13,14]. Vegetables, particularly the traditional types such as amaranths, African egg-
plant (Solanum aethiopicum), African nightshade (S. nigrum), okra (Abelmoschus esculentus),sweet potato leaves (Ipomoea batatas), pumpkin leaves (Cucurbita maxima) and jute mallow
(Corchorus olitorius) are important sources of micronutrients, fiber, vitamins and minerals.
Starchy staples provide more than 70% of the calorie intake of rural households in Tanzania
[15] and 40% of the calories come from maize [16] indicating that important micronutrient
rich foods such as meat, fish, dairy, eggs, fruits and vegetables are not being consumed in suffi-
cient amounts by the households [10].
Dodoma and Mbeya are among the regions with the highest prevalence and number of
stunted children in Tanzania. Overall about 45.2% of the children under 5 years in Dodoma
and 36% in Mbeya region are stunted[10]. Yet the dietary diversity of rural households, chil-
dren under five and women (15–35 years) and its determinants has not yet been established in
these areas and similar agro-ecological settings in Tanzania that this study seeks to address.
There are efforts to improve nutrition practices at household level and one way that has
not been widely exploited is to encourage greater men’s participation in household food
Dietary diversity and the potential role of men in improving household nutrition in Tanzania
PLOS ONE | https://doi.org/10.1371/journal.pone.0189022 December 12, 2017 2 / 18
and analysis, decision to publish, or preparation of
the manuscript.
Competing interests: The authors have declared
that no competing interests exist.

consumption decisions. To the best of our knowledge, the only empirical literature available is
on how to involve men in chronic disease management in Mexico [17], maternal and newborn
health[18] with limited studies on nutrition especially in SSA. One related study in Kenya
found that men benefit more than women and children in terms of diet diversity because they
often eat lunch and sometimes dinner away from home, thus increasing their chances of con-
suming other food items not usually available in their household [19]. Other project based
observations show that men rarely participate in household nutrition decisions leaving this
task to their wives, thereby leaving most women and children with smaller food portions and
less nutritious meals compared to men[20]. Many interventions still focus on women neglect-
ing the role of men in improving the household nutrition status. In this regard, this study con-
tributes to this debate by empirically assessing men dietary patterns and their potential role in
improving the nutritional status of all household members. The findings from this study initi-
ates the policy dialogue on involving men in household consumption and nutrition decisions
in order to develop innovative approaches to reduce undernutrition with an aim of increasing
participation by men. The rest of the paper is organized as follows. In the next section, we
describe the study area and sampling design, data collection and dietary diversity measure-
ments. This is followed by the results and discussions while the last section is a summary of
key findings and policy implications.
Materials and methods
Study area and sampling design
The study used cross-sectional survey data collected from Bahi District in Dodoma region and
Mbarali District in Mbeya region of Tanzania. These districts are predominantly semi-arid in
nature and experience low and erratic rainfall of about 500–650 mm per annum with most
households relying on subsistence rain-fed agriculture. Introduction of irrigated agriculture is
currently undertaken by the Tanzanian government, in collaboration with Competitive Afri-
can Rice Initiative (CARI) program funded by Deutsche Gesellschaft fur Internationale
Zusammenarbeit (GIZ) and implemented in Mbarali and Bahi for growing paddy rice, maize
and beans. In Tanzania, CARI began in 2015 with the aim of increasing rice productivity and
complementary crops such as vegetables by enhancing farmers’ business skills and access to
financial services while ensuring adoption of good agricultural practices. A baseline survey to
understand the dietary diversity of the target households was conducted from December, 2015
to January, 2016. Field interviews were however avoided during the Christmas and the New
Year festive periods of the survey to avoid biases, given high likelihood that household food
consumption often does not reflect a typical diet. The study followed a multi-stage sampling
procedure. In the first stage, Bahi and Mbarali districts were purposively selected due to their
high levels of poverty and high malnutrition. In the second step, 20 villages were randomly
selected from the list compiled by the District Agriculture Irrigation and Cooperatives Officers
(DAICOs) and Competitive African Rice Initiative (CARI) program officials. Village is the
lowest administrative unit in Tanzania. The lists of households in each village were obtained
from DAICOs of the two survey districts and CARI. The third step involved a random sam-
pling of the targeted households proportional to the number of the households participating in
CARI program in the village, generating a total of 204 respondents. The response rate for the
survey was 97 percent. From the total sample, 101 respondents were from Bahi and 103
respondents were from Mbarali District. As a complement, focus group discussions (FGDs)
were conducted with men to qualitatively assess their dietary diversity and potential roles in
combating micronutrient malnutrition challenges. The Critical Appraisal Skills Program
(CASP) qualitative research checklist was used to ensure that the objectives of the research
Dietary diversity and the potential role of men in improving household nutrition in Tanzania
PLOS ONE | https://doi.org/10.1371/journal.pone.0189022 December 12, 2017 3 / 18

were appropriately addressed. The interview guide with questions were asked to the participants
in a group and they were requested to answer together after collating thoughts. The village agri-
cultural extension officers prepared a list of men participating in CARI program in the four vil-
lages (two per district) and from the list, a random sample of 10–15 men per village was drawn.
In total, four FGDs were conducted prior to the main quantitative survey, two in each district
and each lasted 60–90 minutes. A total of 50 men from Mbarali and Bahi District were covered
during the focus group discussions. Respondents who participated in FGDs were not allowed to
participate in the main household survey so as to prevent them from influencing the responses.
The men who participated in the FGDs aged 29 to 58 years and were married with at least two
dependents. The focus group discussions were conducted in two parallel sessions per district,
covering different subject domains such as types of foods men consumed at home, types of
foods men consumed away from home (breakfast, snack, lunch, snack, dinner and snack before
bed time), men’s frequency of eating away from home, nutritional calendar of men and what
types of foods are preferred by household members at different times and the frequency at
which male respondents ate different food items per day etc (see more descriptions in S1 File).
Data collection and measurement of dietary diversity
The dietary diversity score, developed by the Food and Agriculture Organization (FAO) of the
United Nations, is a qualitative 24-hour recall of all the food and drinks consumed by the
respondent (if measured at individual level) or any other household member (if measured at
household level) [21]. The 24-hour recall period is subject to less recall error, less cumbersome
for the respondents than seven or thirty day recall period, and also conforms to the recall time
period used in many dietary diversity studies [22]. This was adopted given that Savy et al.,[23]
suggested that a dietary diversity score calculated from a 24 hour recall is sufficient to describe
households’, women’s and children’s nutritional status. Therefore, we computed household
dietary diversity score (HDDS), children under five dietary diversity score (CDDS) [21, 24]
and minimum dietary diversity for women (MDD-W)[25]. HDDS provides a snapshot of the
economic ability of a household to access a variety of foods while CDDS and MDD-W reflects
nutrient adequacy for the children and women respectively. A study conducted in Bangladesh,
Mali, Mozambique, and the Philippines using standard dietary scores shows that an increase
in dietary diversity in different age groups is related to increased nutrient adequacy of the diet
for non-breastfed children [22], adolescents [26] and adults[7]. For the purposes of this study,
women of child bearing age are defined as those between 15–35 years of age; also falling within
the definition of a youth according to the Tanzanian government[27].
The previous women dietary diversity score did not propose a cut-off point for a dichoto-
mous indicator, but we use MDD-W, which calculates the percentage of women achieving the
minimum dietary diversity[25]. The minimum diverse diet for women has been defined as five
food groups out of ten. World Health Organization (WHO) proposed a threshold of 4 foods
out of seven for children between 6–23 months [28] but no consensus has so far been reached
for situation related to the children under five. We therefore, adopt a cut-off of 4 or more food
groups out of nine for children between 1–5 years old and have been used by Styn et al., [24]in
South Africa. There are no cut-offs defined for the household diversity score [21].
To estimate dietary diversity, the questionnaire was administered to the person responsible
for the household’s food preparation on the previous day. This person, in most cases, the
mother responded to the questions about food consumed by children under 5 years old and a
woman aged 15–35 years in the household recorded the food consumed to measure MDD-W.
All the respondents gave their consent prior to participating in the study. The questionnaire
used elicited information on the respondents’ dietary history in addition to being asked to
Dietary diversity and the potential role of men in improving household nutrition in Tanzania
PLOS ONE | https://doi.org/10.1371/journal.pone.0189022 December 12, 2017 4 / 18

recall all the different foods eaten and beverages taken in the previous 24 hours prior to the
survey. A set of 12 food groups was used to estimate HDDS[21] and 10 food groups for MDD-
W [25] and 9 food groups for CDDS[21, 24]. Previous research has shown that the food
groups; ‘fats and oils, sugar/honey’ and ‘spices, condiments and beverages’ do not contribute
to the micronutrient density of the diet and thus these food groups were not part of the
MDD-W and CDDS[21, 25]. The food groups that were used in computing MDD-W indicator
include (1) grains, white roots tubers, and plantains (2) Pulses (beans, peas and lentils) (3)
Nuts and seeds (4) Dairy (5) Meat, poultry and fish (6) Eggs (7) Dark green leafy vegetables (8)
Other vitamin A-rich fruits and vegetables (9) Other vegetables (10) Other fruits.
In order to accurately capture all the food groups consumed by children under five, addi-
tional probing was done for snacks eaten between main meals and special foods given to them
by the mother or the person responsible for food preparation in the household. Responses
relating to socio-economic characteristics of the households were also captured: gender of the
household head, vegetable production, land size, access to credit and extension services, train-
ing received on food preparation and human nutrition among others. The information about
men’s food consumption patterns were collected in the FGD sessions. The FGD were con-
ducted by one moderator and three research assistants who recorded all the responses on
paper. We prevented social desirability bias in the FGDs by clearly asking the questions and
sometimes repeating more than once for the purposes of triangulation, asking the participants
what they do (or would do) and not necessarily what they think should be done in relation to
improving their dietary diversity.
Data analysis
The DDS was calculated by summing the number of different food groups consumed by an
individual or household over the 24-hour recall period. A score of 1 was given to each food
group consumed. Maximum values of 12 points for HDDS, 10 points for MDD-W and 9
points for CDDS were obtained. Differences in household characteristics and dietary diversity
scores between the two regions were assessed using independent t-test and chi-square (χ2) test.
Factors influencing HDDS, MDD-W and CDDS was modelled using Poisson regression
model. Cluster robust standard error adjustments were done in order to obtain robust results.
Poisson regression is an appropriate tool to model count data (in this case dietary diversity
score, which ranges from 0–12 for HDDS, 0–9 for CDDS and 0–10 for MDD-W)[29]. The
explanatory variables included in the model are presented in Table 1. In addition, ordinary
least squares (OLS) regression was also estimated to validate the study findings (S2 Table).
OLS assumes that the outcome of interest (HDDS, MDD-W and CDDS) is normally distrib-
uted while poisson regression assumes that the outcome is Poisson distributed. Comparing
results from the two models is important because originally linear regression model (OLS) was
used when modelling count data [30]. The coefficient estimates of both models can be inter-
preted as semi-elasticities which represents percentage change in the dietary diversity score
when the explanatory variable changes by one unit. STATA version 14 was used to analyse
quantitative data. Content analysis method was used to manually analyse qualitative data and
triangulated with key stakeholders’ reflection and learning workshop that was held in Septem-
ber, 2016. Data saturation point was reached upon conducting the fourth FGD and sampling
more data could not lead to more information related to the research questions.
Ethical considerations
The households involved in this survey were drawn from the CARI project participants and
thoroughly informed about the objectives of the survey. The respondents were explicitly asked
Dietary diversity and the potential role of men in improving household nutrition in Tanzania
PLOS ONE | https://doi.org/10.1371/journal.pone.0189022 December 12, 2017 5 / 18

for their verbal informed consent to voluntarily participate in the study and recorded in the
questionnaire. Prior to starting each interview, the study objectives were explained to the
respondents. It was also clarified to them that the data collected would be kept strictly confi-
dential, analysed anonymously and used for research purposes only. As a general requirement,
we also obtained permission from District executive office to conduct the survey. This study
was approved by the World Vegetable Centre’s Institutional Bio-safety and Research Ethics
Committee (IBREC).
Results
Descriptive results
Descriptive statistics are presented in Table 1. Average household size was 4.6 persons in Bahi
and 6.3 in Mbarali District. The average age of the household head was 42 years in Bahi and 45
years in Mbarali. Across both districts, 18% of households were female-headed, showing that
the vast majority of households were led by males. On average, the household heads had six
years of education. Moreover, only 11% of the households had been trained on food prepara-
tion and nutrition. Households in Bahi significantly owned more agricultural land (p<0.05)
than those in Mbarali. About 20% of sampled households were growing vegetables in the past
year (22% in Bahi, 18% in Mbarali). About 89% of the sampled households were active mem-
bers of recognized farmers’ associations where knowledge about nutrition can be shared with
other community members.
The diet of the children and women mainly comprised cereals, vegetables, legumes, seeds
and nuts (30–91 percent) (Figs 1 and 2). Meat-based products (beef, poultry and fish), milk
and eggs were rarely consumed by children and women. Cereals and white roots and tubers
were consumed by 86% of the women.
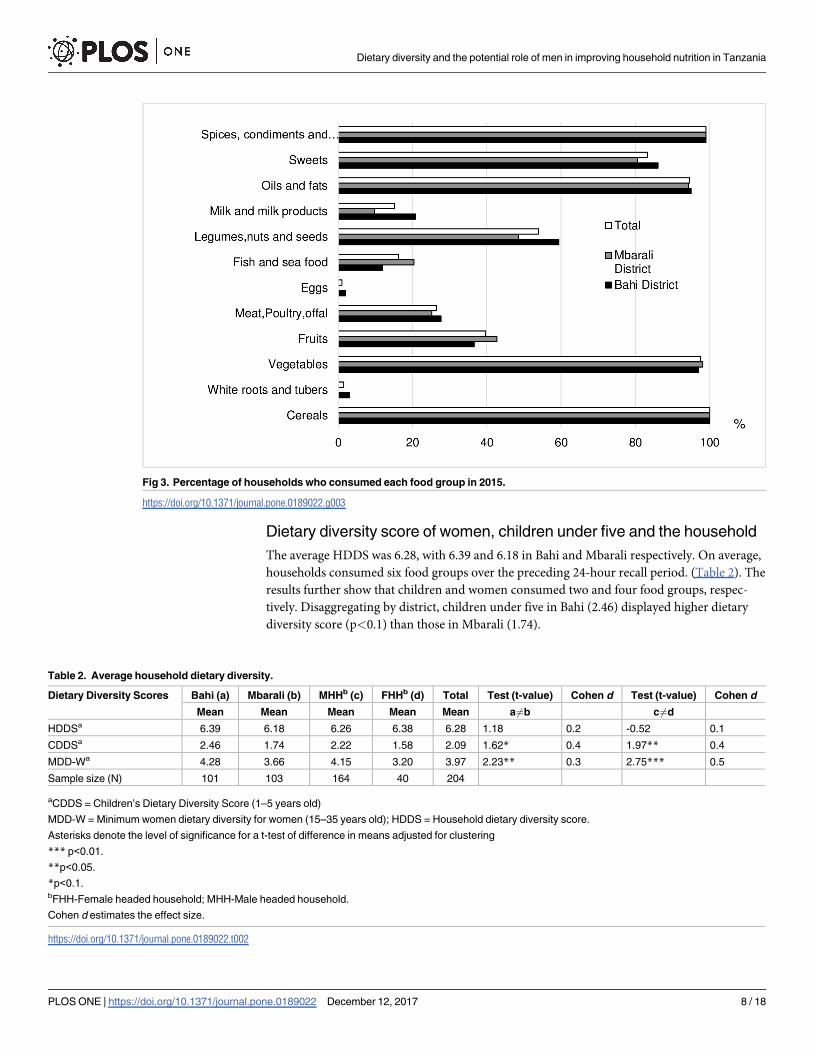
The food groups commonly consumed by the households were cereals (100%); spices, con-
diments and beverages (99%); vegetables (98%); oils and fats (95%); sweets (83%); legumes,
nuts and seeds (54%); and fruits (39%) (Fig 3). Meat-based products (i.e. poultry, offal, fish,
etc.), eggs, milk, and milk products were rarely consumed by many households. For example,
less than one percent of the households consumed eggs, while less than 16% consumed fish/
seafood milk and milk products (Fig 3).
Table 1. Characteristics of sampled households in Bahi and Mbarali districts, Tanzania.
(a) (b)
Bahi District Mbarali District Total Testa
Variable Mean SDb Mean SDb Mean SDb a6¼b
Household size (persons) 4.63 1.78 6.27 2.59 5.46 2.36 ***
Years of education of household head 7.00 3.03 6.58 2.63 6.80 2.85
Age of household head (years) 42.08 13.68 45.46 13.57 44.0 13.70 *
Female household head(percentage) 0.19 0.40 0.19 0.40 0.19 0.39
Participated in training on food preparation and nutrition (proportion) 0.14 0.34 0.06 0.24 0.09 0.29 **
Agricultural land area (hectares) 1.99 2.27 1.39 1.66 1.69 2.00 **
Household grows vegetables (proportion) 1.00 0.00 0.19 0.39 0.59 0.49 ***
Access to off-farm income (percentage) 0.78 0.42 0.15 0.35 0.46 0.50 ***
Number of observations 101 103 204
Categorical and continuous variables were tested using χ2 and t-tests adjusted for clustering, respectively.aAsterisks denote the level of significance for a t-test/χ2-test of difference in means between the Districts, with *** p<0.01, ** p<0.05 and* p<0.10.bSD = Standard deviation.
https://doi.org/10.1371/journal.pone.0189022.t001
Dietary diversity and the potential role of men in improving household nutrition in Tanzania
PLOS ONE | https://doi.org/10.1371/journal.pone.0189022 December 12, 2017 6 / 18

Fig 1. Percentage of children under 5 years who consumed each food group in 2015.
https://doi.org/10.1371/journal.pone.0189022.g001
Fig 2. Percentage of women aged 15–35 years who consumed each food group in 2015.
https://doi.org/10.1371/journal.pone.0189022.g002
Dietary diversity and the potential role of men in improving household nutrition in Tanzania
PLOS ONE | https://doi.org/10.1371/journal.pone.0189022 December 12, 2017 7 / 18
Dietary diversity score of women, children under five and the household
The average HDDS was 6.28, with 6.39 and 6.18 in Bahi and Mbarali respectively. On average,
households consumed six food groups over the preceding 24-hour recall period. (Table 2). The
results further show that children and women consumed two and four food groups, respec-
tively. Disaggregating by district, children under five in Bahi (2.46) displayed higher dietary
diversity score (p<0.1) than those in Mbarali (1.74).
Fig 3. Percentage of households who consumed each food group in 2015.
https://doi.org/10.1371/journal.pone.0189022.g003
Table 2. Average household dietary diversity.
Dietary Diversity Scores Bahi (a) Mbarali (b) MHHb (c) FHHb (d) Total Test (t-value) Cohen d Test (t-value) Cohen d
Mean Mean Mean Mean Mean a6¼b c6¼d
HDDSa 6.39 6.18 6.26 6.38 6.28 1.18 0.2 -0.52 0.1
CDDSa 2.46 1.74 2.22 1.58 2.09 1.62* 0.4 1.97** 0.4
MDD-Wa 4.28 3.66 4.15 3.20 3.97 2.23** 0.3 2.75*** 0.5
Sample size (N) 101 103 164 40 204
aCDDS = Children’s Dietary Diversity Score (1–5 years old)
MDD-W = Minimum women dietary diversity for women (15–35 years old); HDDS = Household dietary diversity score.
Asterisks denote the level of significance for a t-test of difference in means adjusted for clustering
*** p<0.01.
**p<0.05.
*p<0.1.bFHH-Female headed household; MHH-Male headed household.
Cohen d estimates the effect size.
https://doi.org/10.1371/journal.pone.0189022.t002
Dietary diversity and the potential role of men in improving household nutrition in Tanzania
PLOS ONE | https://doi.org/10.1371/journal.pone.0189022 December 12, 2017 8 / 18

Dietary diversity scores for children (1.6) and minimum dietary diversity score for women
(3.2) were lower in female-headed households compared to male-headed households. How-
ever, HDDS is similar in both types of households with them consuming foods from six food
groups. The percentage of children and women achieving minimum dietary diversity is pre-
sented in Fig 4. Averagely, 46% of women achieved minimum dietary diversity, thus are more
likely to have higher micronutrient intake than the 54% of women who did not. Similarly 26%
of the children achieved minimum dietary diversity; four food groups out of nine.
In order to further assess dietary diversity, their categories were formulated namely; low
dietary diversity category (�3 food groups); medium diversity category (4 to 5 food groups)
and high diversity category (�6 food groups) for household, children and women. On average,
31% of the women were in the lowest dietary diversity category (consuming less than or equal
to three food groups) while 73% of children consumed three food groups or less (S1 Table).
When considering the whole household, about 80% (78% in Bahi and 82% in Mbarali) had
high dietary diversity (at least one person consumed six or more food groups) (S1 Table).
Determinants of dietary diversity
Gender and education level of the household head and size of agricultural land influenced
HDDS (p<0.01) (Table 3). Education of the household head was positive and significantly
influenced the household’s, children’s and women’s dietary diversity. CDDS and MDD-W
decreased with the increase in the age of the household head. Households headed by women
had significantly higher household dietary diversity (p<0.05).
Land is an important factor for diet diversity and households owning larger areas of agricul-
tural land had higher HDDS and MDD-W (Table 3). Most of the households in Bahi and
Mbarali districts derived more than 90% of their incomes from agriculture, thus land is
important for food production and dietary diversity. Households growing vegetables had
Fig 4. Percentage of women (15–35 years) and children (1–5 years) achieving minimum dietary diversity in 2015.
https://doi.org/10.1371/journal.pone.0189022.g004
Dietary diversity and the potential role of men in improving household nutrition in Tanzania
PLOS ONE | https://doi.org/10.1371/journal.pone.0189022 December 12, 2017 9 / 18

significantly higher MDD-W, yet in Mbarali only 19% of the households grew vegetables
(Table 1). To test the robustness of the results, we re-estimated the determinants of dietary
diversity using OLS regressions (also explained in the method) and the significant factors did
not change (S2 Table) giving confidence in the Poisson results.
Men’s dietary patterns and their potential role in household nutrition
security
This section presents FGD results. The food consumption among men varied depending on
the season, and differed between the seasons when food is in surplus (April-August) and in
shortage (September-March). During the season when food is in surplus, households could
easily access all food categories by selling their harvested produce (i.e., rice, maize, and beans)
to purchase other food items such as meat, milk, sugar, and fish, among others. Households
with income obtained from selling produce were able consume black or milk tea with either
Table 3. Determinants of dietary diversity scores.
Variables (1) (2) (3)
HDDSa CDDSa MDDWa
Coefficient P>|z| Coefficient P>|z| Coefficient P>|z|
Household size (persons) -0.002 0.775 0.047 0.172 0.033 0.121
(0.006) (0.034) (0.021)
Years of education of household head 0.016*** 0.002 0.061** 0.012 0.022* 0.080
(0.005) (0.024) (0.013)
Age of household head (years) -0.001 0.457 -0.016*** 0.001 -0.007** 0.018
(0.001) (0.005) (0.003)
Gender of the household head (= 1 if female) 0.051** 0.019 -0.243 0.148 -0.162 0.245
(0.023) (0.168) (0.140)
Participated food and nutrition training (= 1 if yes) 0.099** 0.016 0.099 0.617 0.082 0.457
(0.041) (0.198) (0.110)
Agricultural land area (hectares) 0.016*** 0.000 -0.013 0.377 0.030*** 0.000
(0.004) (0.016) (0.008)
Whether household grows vegetables (= 1 if yes) 0.044 0.280 -0.074 0.858 0.339** 0.020
(0.041) (0.417) (0.146)
Access to off-farm income (= 1 if yes) 0.004 0.941 0.129 0.171 0.054 0.573
(0.052) (0.095) (0.096)
District (= 1 if Mbarali) 0.036 0.484 -0.345 0.369 0.137 0.270
(0.052) (0.384) (0.125)
Constant 1.670*** 0.000 0.927* 0.089 1.003*** 0.000
(0.072) (0.545) (0.234)
Variance inflation factor (VIF)b 1.84 1.84 1.84
Observations 204 204 204
aRobust standard errors in parentheses. Cluster adjusted by villages.
Asterisks denote the level of significance at
*** p<0.01.
** p<0.05.
* p<0.1.
CDDS = Children’s Dietary Diversity Score (1–5 years old); MDD-W = Minimum Dietary Diversity Score for women (15–35 years old); HDDS = Household
Dietary Diversity Score.bVIF obtained after regress since collinearity is a property of the independent variables only. Similar results are reported in S2 Table.
https://doi.org/10.1371/journal.pone.0189022.t003
Dietary diversity and the potential role of men in improving household nutrition in Tanzania
PLOS ONE | https://doi.org/10.1371/journal.pone.0189022 December 12, 2017 10 / 18

rice, ugali boiled tubers or nuts as breakfast and occasionally served either rice, ugali with fish
or meat for lunch and dinner. Ugali is stiff porridge made from either maize flour, sorghum or
millet flour. There were long periods of food shortage in Bahi and Mbarali beginning from
mid-November to March, to the extent that some households had only one meal a day, mainly
carbohydrate-based foods such as ugali, cassava and rice.
From the FGD it emerged that men also dominantly took black or milk tea with rice or
mandazi and chapati for breakfast and rice or ugali with fish or meat for lunch and dinner
from food vendors during food shortages, while rice or ugali with vegetables were served at
home (Table 4). Chapati and mandazi are wheat based doughnuts usually not made at home
because they take a long time to prepare. These products are an example of frequently con-
sumed affordable foods prepared outside of the home with a high fat content. This situation
has resulted in a gap between food consumed at home and food eaten away from home. Most
men (more than half of participants) consumed food outside the home. Foods commonly con-
sumed from outside included meat or fish, chips made from tubers plus eggs or roasted meat,
milk tea and chapati. Majority of men have access to food twice: at home, and outside in a res-
taurant or hotel before going home, as indicated by all participants. One participant from Bahi
said, “If I can only afford a half kilogram of meat in the bar; will it be enough for a household of 6members? You will agree with me that it will be my option to consume it myself so that I getenough energy to feed my family.” In addition, men do not take food home because of cultural
beliefs. For example, one participant from Mbarali said, “It is a custom in our area to be per-ceived as if you are controlled by your wife if you take home food items such as vegetables ormeat.”
Most households ate ugali or rice with leafy vegetables or beans throughout the year without
access to protein rich foods such as fish which men accessed outside the household. Most par-
ticipants opined that the risk of inadequate nutrition increases with increased frequency of
food consumption away from home by the male household members particularly in times of
food shortages. During food surplus seasons, men often sold produce to get cash for purchas-
ing food prepared outside the home mostly in restaurants and hotels instead of purchasing
food for the whole household. The participants pointed out that cash received by women was
mainly spent on food and wellbeing of the children.
Consumption of important food items such as vegetables, fruits, meat, fish and eggs was
low, yet lack of consumption contributes to malnutrition (S3 Table). For example, meat prod-
ucts were either not consumed at all or consumed once per day, particularly during the food
Table 4. Male dietary patterns during food shortages in Mbarali and Bahi districts.
Mbarali Bahi
Eat at home Eat from outside Eat at home Eat from outside
Breakfast aMilk or black tea or porridge
+kiporobMilk tea+ chapati Porridge or black tea +kiporob Milk tea+chapati
Lunch Rice+vegetables +legumes Rice +meat/fish+fruit Ugali+vegetables+legumes Rice +meat/fish+ vegetables
Dinner Ugali+vegetables+legumes Ugali+meat/fish+fruit Rice+vegetables+legumes Ugali+meat or fish+vegetables
Snacks (a) Fruits (mangoes) (b) Roasted
groundnuts
(a) Chips +roasted meat/eggs
(b) Local beer (made from
bamboo juice)
(c) Soft drinks like soda/juice
&bread/biscuits
(a) Boiled groundnuts or
bambara nuts
(b) Fruits (dates, mangoes &
baobab fruits)
(a) Chips + roasted meat/fish/fried
eggs
(b) Local beer (made from maize/
sorghum flour)
(c) Soft drinks like soda/juice
&bread/biscuits
aIn Mbarali, livestock keepers inhabit the area in search of pastures and farmers often buy milk from them.bKiporo is the left-over food from dinner such as ugali, rice etc.
https://doi.org/10.1371/journal.pone.0189022.t004
Dietary diversity and the potential role of men in improving household nutrition in Tanzania
PLOS ONE | https://doi.org/10.1371/journal.pone.0189022 December 12, 2017 11 / 18

shortage period compared to starchy foods (i.e., consumed 3–5 times per day). It emerged that
alcohol was mainly consumed during food shortage periods as a way of dealing with stress.
Discussion
This paper estimated factors influencing dietary diversity of the household, children under five
years, and women; and qualitatively assessed male dietary patterns and their potential role in
improving their household nutritional status in Tanzania. Findings show that the diet of
households lacked diversity, and the intake of foods from animal sources (i.e., meat, poultry
and offal, fish) was low, especially among children under five years and women of child bear-
ing age (15–35 years). Most children consumed foods from 3 or fewer food groups on the day
prior to the survey. On average, 46% and 26% of women and children respectively, achieved
minimum dietary diversity. Vegetable production emerged as an important activity for im-
proving dietary diversity, particularly for women. In addition, gender and education of the
household head, food and nutrition training, education and farm size were important determi-
nants of dietary diversity. From FGD results, men can contribute to improved food and nutri-
tion security by reducing their consumption of food away from home particularly, during food
shortages and using savings to purchase nutritious food for the entire household. These sum-
marized results are discussed in detail below.
Dietary diversity and its determinants
Our study confirms that the diet of the children and women mainly comprised cereals, roots
and tubers, vegetables, legumes, nuts, seeds and fruits. These results are similar to findings
reported in rural areas of Ethiopia, Burkina Faso and Tanzania [8, 31, 32]. These findings
equally supports the notion that women and children under five years are more likely to be dis-
advantaged than men and are at risk of poor health [33] due to high consumption of carbohy-
drate-rich staple crops with few animal products, fruits, and vegetables. Women of child
bearing age often require energy, protein and micronutrients such as iron, particularly when
they are expectant and breast feeding [1, 34, 35]. Few households consumed eggs, milk and
milk products due to inability to purchase animal products which are often sold in the local
market and rarely consumed at home. Several studies indicate that increasing dietary diversity
is crucial for increasing women’s and adolescents’ ability to perform well at school and to be
ready to take up economic opportunities [1, 36] thus it requires much more focus by all stake-
holders implementing food and nutrition security programs.
Dietary diversity scores for children and minimum dietary diversity scores for women are
lower in female-headed households compared to male-headed ones. The relatively low diver-
sity scores for children (CDDS) and for women (MDD-W) can be attributed to the high pov-
erty levels among women-headed households, since in most rural households, women are
responsible for family nutrition. However, the current findings does not show that poor house-
holds have low dietary diversity. A previous study using 14 food groups reported that women
who are household heads had higher women dietary diversity scores than those from the male
heads in Kongwa, Muheza and Singida Districts in Tanzania [32]. However, our study adopted
new method of measuring women dietary diversity (MDD-W) by using 10 food groups as
opposed to usual 9 food groups. Most children and women consumed three or fewer food
groups characterized with limited consumption of foods from animal sources confirming find-
ings from Burkina Faso[8]. Traditionally in several parts of Tanzania children are mainly
weaned on starch based foods and few of them are given meat and vegetables at this stage. For
example, the most common weaning foods observed in rural areas of Tanzania are either
Dietary diversity and the potential role of men in improving household nutrition in Tanzania
PLOS ONE | https://doi.org/10.1371/journal.pone.0189022 December 12, 2017 12 / 18

maize porridge mixed with milk or cow’s milk which has led to persistent high rate of child
malnutrition [37].
In terms of socio-economic characteristics presented in Table 1, Bahi compared to Mbarali
District had more household members, majority participated in nutrition and food prepara-
tion training, larger land sizes, accessed more off-farm income sources and grew vegetables.
The plausible reason for this is because Bahi is closer to Dodoma city–Tanzania’s capital city
which provides the population with the market for their products and are able to access more
off-farm jobs to supplement farm income. Low dietary diets observed in Mbarali District,
could be due to the general low agricultural diversity in the district where rice growing is the
main economic activity dominated by large scale farmers. Small-scale farmers targeted in the
present study are less involved in paddy rice production in Mbarali District.
We estimated the factors influencing dietary diversity by comparing Poisson and Ordinary
least squares (OLS) regressions estimates to ensure robustness of the results. Findings show
that education of the household head contributed to household dietary diversity. Education is
likely to have an impact on the household’s nutritional knowledge and skills to conceptualize
and use nutritional promotional messages, which consequently contribute to better dietary
diversity[38]. A previous study in Morogoro in Tanzania reported that households who were
provided with nutritional education improved the quality of their household diets[39]. House-
holds headed by women significantly had higher household dietary diversity scores. This could
be because in SSA, women- controlled income often has greater benefits for the nutrition,
health and well-being of all household member, especially children, than men-controlled
income [40–43]. Rural women’s income tend to come frequently from petty trades though
in smaller amounts thus is readily spent on household daily subsistence needs than men’s
lumpier seasonal income which is likely to be spent on more expensive items [41]. Land is
important for both household and women dietary diversity implying that it would be more
beneficial to promote equitable land distribution and provide women with land for food pro-
duction, as a measure to increase food and nutrition security among rural communities. Size
of the land owned does not predict the children dietary diversity probably because, adults con-
sume lots of food products directly from the farm compared to children below five who are
sometimes provided with special purchased foods such as infant cereals (e.g., Weetabix andCerelac). Vegetable production influences dietary diversity particularly that of women. Vegeta-
bles are major sources of micronutrients, vitamins and minerals, yet few households (less than
20% in Mbarali district) grew them (see Table 1). Kending et al., [32], also reported in rural
Tanzania that women who cultivated or collected vegetables in all seasons had higher dietary
diversity compared to those who did not. This clearly shows that vegetables form part of bal-
anced diet and could also be purchased from the local market in addition to what is produced
by the household.
Men’s dietary patterns and their potential role in household nutrition
security
Foods commonly consumed from outside by men in the area of study include meat or fish,
potato chips, eggs and roasted meat, milk tea and chapati during food shortage while at home
rice or ugali with vegetables are usually served for dinner (Table 4). These findings confirm
those from Kenya that food consumed outside the home contributes more to the diets of men
[19]. Therefore, male dietary patterns depend on what is consumed outside the home, which
contributes to the gap in dietary diversity of the members of the same household. This is likely
to affect some household members negatively, particularly children under five and women,
who are more susceptible to undernutrition. Our study contributes to the claims that not only
Dietary diversity and the potential role of men in improving household nutrition in Tanzania
PLOS ONE | https://doi.org/10.1371/journal.pone.0189022 December 12, 2017 13 / 18

are women in developing countries more likely to be malnourished than men, but also have
less access to nutritious food than men. It is worth noting that sociocultural traditions and dif-
ferences in household work patterns can potentially increase women’s chances of being more
malnourished. Thus, men should work together with women to plan how the farm can pro-
duce healthy food for the family and provide nutritious food that benefits the entire household.
From the FGDs, it was evident that ensuring household food security requires men to be ade-
quately sensitized to avoid selling all their farm produce during surplus periods. This requires
thoughtful planning and consultation with local leaders, men and women to identify the most
appropriate method to implement community-based sensitization programs. A study by
Ochieng et al., [44] found that such community-based sensitization programs were useful in
increasing consumption of traditional African vegetables and impacted positively on dietary
diversity of children and women in the Arusha region of Tanzania. Furthermore, agricultural
development programs should encourage both husband and wife in most nutritionally vulner-
able households to collectively participate in resource allocation for its production and con-
sumption decisions[45], thereby helping to improve the nutritional status of the household.
Discussions with men concluded that women were more likely than men to spend their
income on food and child welfare leading to better household nutritional outcomes. However,
women’s efforts in SSA are often thwarted by constraints such as access to production
resources, limited access to credit as well as doubling as mothers and farm managers [41].
Men’s propensity to excessively consume food (e.g. meat products that may have not been pre-
pared at home) away from home, contributes to the decline of food and nutrition security of
other household members. This suggests that the challenges of malnutrition can be reduced if
men would join hands with their women counterparts to provide food for the family especially
during food shortages.
Study limitations
The present study was conducted in two districts in Tanzania thus the results cannot be gener-
alized at the national level because the sample size is not representative of the whole country.
Further research work with larger sample sizes is recommended. Additionally, the cross-sec-
tional nature of the data does not allow examining causality in the relationship between dietary
diversity and socio-economic factors. The study qualitatively measured dietary patterns of
men thus, there is need to quantitatively measure the men’s dietary diversity and compare it
with those of other household members. Despite the limitations outlined, the methods adopted
in this study had a number of advantages as follows. First, the sampling process was done
together with the local and CARI program administrators and survey administered by quali-
fied researchers from World Vegetable Center, Eastern and Southern Africa in Tanzania. Sec-
ondly, two modelling approaches: Poisson and multiple regression (OLS) have been used
making the results robust and reliable. Thirdly, it provides a useful base for further research on
how to involve men in nutrition matters. Finally, the findings contribute to the limited body of
knowledge on dietary diversity and the potential role of men in improving household nutrition
in Tanzania and beyond.
Conclusions
Food and nutrition insecurity remains a complex problem, mainly in rural areas in less devel-
oped countries such as Tanzania. Our study revealed that the diet among households lacked
diversity, and that the intake of foods from animal sources (meat, poultry and offal, fish and
seafood) was low, especially among the children and women. Women and children access a
less diverse diet, since 46% and 26% achieved minimum dietary diversity respectively.
Dietary diversity and the potential role of men in improving household nutrition in Tanzania
PLOS ONE | https://doi.org/10.1371/journal.pone.0189022 December 12, 2017 14 / 18

Children under five and women in female-headed households had significantly low dietary
diversity scores compared to those in the male-headed households. Vegetable production
emerged as an important subsector in improving household dietary diversity, particularly for
women. Additionally, gender and education of the household head, training on food and
nutrition and size of land owned contribute to improved dietary diversity.
Men can contribute towards improving household nutrition security by reducing their con-
sumption of food away from home, particularly during food shortages, and using the money
saved to purchase nutritious food for the household. Male farmers also could set aside a part of
the produce harvested for household consumption rather than market sale. These actions
could potentially reduce any form of malnutrition among children and women. Because most
households depend on agriculture, awareness creation should focus on improving the produc-
tion of vegetables and consumption of foods with superior micronutrient density for improved
nutrition. Thus, there is a need to support community-based sensitization programs to provide
information on food preparation, human nutrition, and the importance of growing vegetables
for household consumption. Such programs should focus on encouraging men to actively par-
ticipate in providing diversified diet to their households.
Supporting information
S1 Table. Percentage of households, children and women in different dietary diversity cat-
egories.
(DOCX)
S2 Table. OLS regression results for determinants of dietary diversity.
(DOCX)
S3 Table. Men’s frequency of consuming different food categories.
(DOCX)
S1 File. Focus group discussions (FGD) interview guide.
(DOCX)
Acknowledgments
Funding for this research was provided by the German Federal Ministry for Economic Coop-
eration and Development/Deutsche Gesellschaft fur Internationale Zusammenarbeit (GIZ)–
Tanzania, Dar es Salaam, Grant Number 83219278. We are also very thankful to the individual
household members for their time and cooperation in participating in the field survey and
focus group discussions in Tanzania. We are grateful to two anonymous reviewers of this jour-
nal for their constructive comments. We also appreciate core donors to the World Vegetable
Center: Republic of China (Taiwan), UK- Department for International Development (DFID),
Australian Centre for International Agricultural Research (ACIAR), Germany, Thailand, Phil-
ippines, Korea, and Japan.
Author Contributions
Conceptualization: Victor Afari-Sefa, Philipo Joseph Lukumay.
Data curation: Philipo Joseph Lukumay.
Formal analysis: Justus Ochieng.
Funding acquisition: Thomas Dubois.
Dietary diversity and the potential role of men in improving household nutrition in Tanzania
PLOS ONE | https://doi.org/10.1371/journal.pone.0189022 December 12, 2017 15 / 18

Methodology: Justus Ochieng.
Supervision: Victor Afari-Sefa.
Validation: Justus Ochieng.
Writing – original draft: Justus Ochieng.
Writing – review & editing: Justus Ochieng, Victor Afari-Sefa, Thomas Dubois.
References1. IFPRI. Actions and Accountability to Advance Nutrition & Sustainable Development Washington, DC:
International Food Policy Research Institute; 2015 [27/4/2016]. Available from: http://www.fao.org/
fileadmin/user_upload/raf/uploads/files/129654.pdf
2. Lim SS, Vos T, Flaxman AD, Danaei G, Shibuya K, Adair-Rohani H, et al. A comparative risk assess-
ment of burden of disease and injury attributable to 67 risk factors and risk factor clusters in 21 regions,
1990–2010: a systematic analysis for the Global Burden of Disease Study 2010. The Lancet. 2012;
380(9859):2224–60. https://doi.org/10.1016/S0140-6736(12)61766-8.
3. WHO (World Health Organization). Micronutrient Deficiencies. Accessed June 15, 2016. www.who.int/
nutrition/topics/ida/en/. 2015.
4. Black RE, Victora CG, Walker SP, Bhutta ZA, Christian P, de Onis M, et al. Maternal and child undernu-
trition and overweight in low-income and middle-income countries. The Lancet. 2013; 382(9890):427–
51. https://doi.org/10.1016/S0140-6736(13)60937-X
5. IFPRI. Global Nutrition Report 2014: Actions and Accountability to Accelerate the World’s Progress on
Nutrition: International Food Policy Research Institute, Washington, DC; 2014 [27/4/2016]. Available
from: http://ebrary.ifpri.org/cdm/ref/collection/p15738coll2/id/128484.
6. Arimond M, Ruel M.T. Dietary diversity is associated with child nutritional status: evidence from 11
demographic and health surveys. Journal of Nutrition 134 (10), 2579–2585. 2004. PMID: 15465751
7. Arimond M, Wiesmann D, Becquey E, Carriquiry A, Daniels MC, Deitchler M, et al. Simple food group
diversity indicators predict micronutrient adequacy of women’s diets in 5 diverse, resource-poor set-
tings. The Journal of Nutrition. 2010; 140(11):2059–69.
8. Savy M, Martin-Prevel Y, Sawadogo P, Kameli Y, Delpeuch F. Use of variety/diversity scores for diet
quality measurement: relation with nutritional status of women in a rural area in Burkina Faso. European
Journal of Clinical Nutrition. 2005; 59(3):703–16.
9. URT. Rural Development Strategy Report: United Republic of Tanzania; 2001 [27/4/2016]. Available
from: http://www.tzonline.org/pdf/ruraldevelopmentstrategy1.pdf.
10. TNNS. Tanzania National Nutrition Survey, 2014. 2014 [updated 22/1/2016]. Available from: http://
www.unicef.org/esaro/Tanzania_National_Nutrition_Survey_2014_Final_Report_18012015.pdf.
11. Leach V, Kilama B. Institutional Analysis of Nutrition in Tanzania. Special Paper 0931. 2009. Dar es
Salaam: Research on Poverty Alleviation (REPOA).
12. Ota E. Tobe-Gai R MRFD. Antena-tal dietary advice and supplementation to increase energy and pro-
tein intake. Cochrane Database of Sys-tematic Reviews 2012;(9), CD000032.
13. Afari-Sefa V, Tenkouano A, Ojiewo CO, Keatinge JDH, d’ A. Hughes J. Vegetable breeding in Africa:
constraints, complexity and contributions toward achieving food and nutritional security. Food Security.
2011; 4(1):115–27. https://doi.org/10.1007/s12571-011-0158-8
14. Keatinge JDH, Yang R-Y, Hughes dAJ, Easdown WJ, Holmer R. The importance of vegetables in
ensuring both food and nutritional security in attainment of the Millennium Development Goals. Food
Security. 2011; 3(4):491–501. https://doi.org/10.1007/s12571-011-0150-3
15. Ecker O, Weinberger K, Qaim M. Patterns and determinants of dietary micronutrient deficiencies in
rural areas of East Africa. African Journal of Agricultural and Resource Economics. 2010; 4(1):175–94.
16. Cochrane N aDS, A. Measuring Access to Food in Tanzania: A Food Basket Approach. EIB-135, US
Department of Agriculture, Economic Research Service, Accessed on 5th October, 2016.
17. Fort MP, Castro M, Peña L, Hernandez SHL, Camacho GA, Ramırez-Zea M, et al. Opportunities for
involving men and families in chronic disease management: a qualitative study from Chiapas, Mexico.
BMC Public Health. 2015; 15(1):1019. https://doi.org/10.1186/s12889-015-2361-6 PMID: 26438195
18. Ampt F, Mon MM, Than KK, Khin MM, Agius PA, Morgan C, et al. Correlates of male involvement in
maternal and newborn health: a cross-sectional study of men in a peri-urban region of Myanmar. BMC
Pregnancy and Childbirth. 2015; 15(1):122. https://doi.org/10.1186/s12884-015-0561-9 PMID:
26013564
Dietary diversity and the potential role of men in improving household nutrition in Tanzania
PLOS ONE | https://doi.org/10.1371/journal.pone.0189022 December 12, 2017 16 / 18

19. van’t Riet H, den Hartog AP, van Staveren WA. Non-home prepared foods: contribution to energy and
nutrient intake of consumers living in two low-income areas in Nairobi. Public Health Nutrition. 2002; 5
(04):515–22 M3–10.1079/PHN2001324.
20. Otieno PE, Farnworth, C.R. and Banda, N. Involving Men in Nutrition. Note 26. GFRAS Good Practice
Notes for Extension and Advisory Services GFRAS: Lausanne, Switzerland. 2016.
21. Kennedy G, Ballard T, Dop M. Guidelines for measuring household and individual dietary diversity
Rome: Nutrition and Consumer Protection Division, Food and Agriculture Organization of the United
Nations; 2010. Available from: http://www.fao.org/3/a-i1983e.pdf.
22. Kennedy G, Pedro MR, Seghieri C, Nantel G, Brouwer I. Dietary Diversity Score Is a Useful Indicator of
Micronutrient Intake in Non-Breast-Feeding Filipino Children. The Journal of Nutrition. 2007; 137
(2):472–7. PMID: 17237329
23. Savy M M-P, Y., Traissac P., & Delpeuch F. Measuring dietary diversity in rural Burkina Faso: compari-
son of a 1-day and a 3-day dietary recall. Public Health Nutrition. 2007; 10(1):71–8. https://doi.org/10.
1017/S1368980007219627 PMID: 17212836
24. Steyn NP, Nel J, Labadarios D, Maunder EMW, Kruger HS. Which dietary diversity indicator is best to
assess micronutrient adequacy in children 1 to 9 y? Nutrition. 2014; 30(1):55–60. https://doi.org/10.
1016/j.nut.2013.06.002 PMID: 24290599
25. FAO. Minimum Dietary Diversity for Women: A Guide for Measurement. Rome: FAO. 2016.
26. Mirmiran P, Azadbakht L, Esmaillzadeh A, Azizi F. Dietary diversity score in adolescents- a good indica-
tor of the nutritional adequacy of diets: Tehran lipid and glucose study. Asia Pacific Journal of Clinical
Nutrition. 2004; 13(1):56–60. PMID: 15003915
27. URT. National Policy of Youth Development Policy. Ministry of Labour, Employment and Youth Devel-
opment. The United Republic of Tanzania. 2007.
28. WHO. Indicators for Assessing Infant and Young Child Feeding Practices. Part II: Measurement; World
Health Organization. Department of Child and Adolescent Health and Development, Geneva, Switzer-
land. 2010.
29. Gujarati D. Basic econometrics. 4th edition. New Delhi, India: Tata McGraw-Hill.2004.
30. Frees EW. Regression Modeling with Actuarial and Financial Applications. Cambridge University
Press. 2010.
31. Herrador Z, Jesus P, Sordo L, Gadisa E, Moreno J, Benito A, et al. Low Dietary Diversity and Intake of
Animal Source Foods among School Aged Children in Libo Kemkem and Fogera Districts, Ethiopia.
Plos ONE. 2015; 10(7):e0133435. https://doi.org/10.1371/journal.pone.0133435 PMID: 26203904
32. Keding GB, Msuya JM, Maass BL, Krawinkel MB. Relating dietary diversity and food variety scores to
vegetable production and socio-economic status of women in rural Tanzania. Food Security. 2012; 4
(1):129–40. https://doi.org/10.1007/s12571-011-0163-y
33. Ivers LC, Cullen KA. Food insecurity: special considerations for women. The American Journal of Clini-
cal Nutrition. 2011; 94:1740–4. https://doi.org/10.3945/ajcn.111.012617 PMID: 22089447
34. Ransom E, Elder L. Nutrition of women and adolescent girls: why it matters. [ Washington, D.C.]: Popu-
lation Reference Bureau; 2003.
35. Hytten FE, Cheyne GA, Klopper AI. Iron loss at menstruation. BJOG: An International Journal of Obstet-
rics & Gynaecology. 1964; 71(2):255–9. https://doi.org/10.1111/j.1471-0528.1964.tb04275.x
36. Yimer F T, F. Women’s empowerment in agriculture and dietary diversity in Ethiopia. ESSP II Working
Paper 80. International Food Policy Research Institute (IFPRI) and and Ethiopian Development
Research Institute (EDRI). 2015. https://doi.org/http://ebrary.ifpri.org/cdm/ref/collection/p15738coll2/id/
129781
37. Nyaruhucha CNM M J. M., Mamiro P. S., & Kerengi A. J. Nutritional status and feeding practices of
under-five children in Simanjiro District, Tanzania. Tanzania Health Research Bulletin. 2007; 8
(3):162–7. http://dx.doi.org/10.4314/thrb.v8i3.45114
38. Rajendran S, Afari-Sefa V, Shee A, Bocher T, Bekunda M, dominick I, et al. Does crop diversity contrib-
ute to dietary diversity? Evidence from integration of vegetables into maize-based farming systems.
Agriculture & Food Security. 2017; 6(1):50. https://doi.org/10.1186/s40066-017-0127-3
39. Pillai A, Kinabo J, Krawinkel MB. Effect of nutrition education on the knowledge scores of urban house-
holds with home gardens in Morogoro, Tanzania. Agriculture & Food Security. 2016; 5(1):22. https://
doi.org/10.1186/s40066-016-0069-1
40. FAO. Agriculture, food and nutrition for Africa. A resource book for teachers of agriculture. Food and
Nutrition Division, Food and Agriculture Organization (FAO) Rome, Italy.1997.
41. Quisumbing AR, Brown LR, Feldstein HS, Haddad L, Peña C. Women: The key to food security. Inter-
national Food Policy Research Institute, Washington, DC, USA. 1995.
Dietary diversity and the potential role of men in improving household nutrition in Tanzania
PLOS ONE | https://doi.org/10.1371/journal.pone.0189022 December 12, 2017 17 / 18

42. Van den Bold M Q, A. R., & Gillespie, S. Women’s empowerment and nutrition: an evidence review.
IFPRI Discussion Paper 01294. 2013.
43. Handa S. Expenditure behavior and children’s welfare: An analysis of female headed households in
Jamaica. Journal of Development Economics. 1996; 50(1):165–87. https://doi.org/https://doi.org/10.
1016/0304-3878(96)00008-9 PMID: 12349491
44. Ochieng J, Afari-Sefa V., Karanja D., Kessy R., Rajendran S., Samali S. How promoting consumption of
traditional African vegetables affects household nutrition security in Tanzania. Renewable Agriculture
and Food Systems. 2017; 1–11. https://doi.org/10.1017/S1742170516000508
45. Anderson CL, Reynolds TW, Gugerty MK. Husband and Wife Perspectives on Farm Household Deci-
sion-making Authority and Evidence on Intra-household Accord in Rural Tanzania. World Development.
2017; 90(Supplement C):169–83. https://doi.org/https://doi.org/10.1016/j.worlddev.2016.09.005
Dietary diversity and the potential role of men in improving household nutrition in Tanzania
PLOS ONE | https://doi.org/10.1371/journal.pone.0189022 December 12, 2017 18 / 18