determinants of fdoreign direct investment in five …
TRANSCRIPT

DETERMINANTS OF FDOREIGN DIRECT INVESTMENT IN FIVE
WEST AFRICAN COUNTRIES
BY
ISHAQ AUWALU MUHAMMAD
A dissertation submitted to
Othman Yeop Abdullah Graduate School of Business
Universiti Utara Malaysia
In Fulfillment of the Requirements for the Award of Master’s Degree in
Economics
ii
iii
PERMISSION TO USE
In presenting this project paper in partial fulfilment of the requirements for the
postgraduate degree from Universiti Utara Malaysia, I agree that the Universiti
Library may make it freely available for inspection. I further agree that permission
for copying of this project paper in any manner, in whole or in part, for scholarly
purposes may be granted by my supervisor(s), or in their absence by the Dean of the
College of Business or the Dean of Research and Innovation. It is understood that
any copying or publication or use of this project paper or parts thereof for financial
gain shall not be allowed without my written permission. It is also understood that
due recognition shall be given to me and Universiti Utara Malaysia for any scholarly
use which may be made of any material from my project paper. Request for
permission to copy or to make other use of materials in this project paper in whole or
in part should be addressed to:
Dean of Othman Yeop Abdullah Graduate School of Business
Universiti Utara Malaysia
06010 UUM Sintok
Kedah Darul Aman

iv
ABSTRAK
Kajian ini menguji penentu-penentu aliran pelaburan langsung asing (FDI) di
negara-negara Afrika Barat (WACs) bagi tempo 1998 - 2013. Analisisi kajian
menggunakan data sekunder yang diperolehi daripada Bank Pembangunan Dunia,
Petunjuk Gabenor Bank Dunia, Persidangan Bangsa-Bangsa Bersatu Menganai
Perdagangan dan Pembangunan, Transparency International, dan Heritage
Foundation. Dalam kajian ini, Dunings’s (1980) electic paradigm telah digunakan
dengan ubahsuai beberapa pemboleh ubah tambahan. Secara emperik, Model Kesan
Tetap (FEM) telah dicadankan oleh keputusan ujian spesifikasi Hausman sebangai
model pilihan dalam penganggaran. Dapatan kajian menunjukkan rasuah tidak
menpengaruhi aliran FDI ke dalam WACs. Secara khusus, rasuah dan kelemahan
institusi pembuat dasar tidak mengalakkan pelabur-pelabur asing. Faktor-faktor lain
seperti saiz pasaran, inflasi dan keterbukaan perdagangan juga didapati
mempengaruhi aliran FDI secara positif dan signifikan. Dapatan kajian juga
mencadangkan bahawa WACs perlu melaksanakan pengubahsuaian institusi bagi
menarik lebih banyak alian FDI dan faedah kasan limpahan positif yang oleh aliran
FDI kedalam sesebuah Negara dan sebuah kelestarian pembangunan ekonomi yang
umum. Berkaitan dengan penentu-penentu FDI, keputusan empirik menunjukkan
bahawa potensi permintaan pasaran domestik sesebuah negara dan keterbukaan
perdagangan adalah penentu utama aliran FDI di WACs.
v
ABSTRACT
This study examines the determinants of foreign direct investment inflows (FDI) in
West African Countries (WACs) for the period 1998 - 2013.Analysis of the study used
secondary data which obtained from World Bank Development indicators, World
Bank Governors Indicators, United Nations Conference on Trade and Development,
Transparency International, and Heritage Foundation. In this study, Dunning’s
(1980) eclectic paradigm was used but with modification to include some additional
variables. Empirically, Fixed Effects Model (FEM) was suggested by the results of
Hausman’s specification test as a preferable model in the estimation. The finding
shows that corruption does not influenced the level of FDI inflows into WACs.
Specifically, foreign investors were rather discouraged by both corruption and poor
regulatory institutions. Other factors like market size, inflation and trade openness of
the economy were also found to be positively significant. The findings suggests that
governments in WAC need to reform their institutions in order to attract more FDI
and benefited from the positive spill overs that accompany FDI inflow into a country.
With regards to FDI determinants, the empirical result indicates that the domestic
country potential market demand and trade openness are the main determinants of
FDI inflows in WACs.

vi
ACKNOWLEDGEMENT
In the name of Allah, Most Gracious, Most Merciful. All praise to Allah the
Owner of the Worlds, and blessings and prayers is upon the Great Prophet (Peace be
Upon Him), his family members, friends and those who follow them sincerely till the
Day of Judgement. Thanks be to Allah because of Taufiq and Hidayah, has allowed
me to complete this thesis.
I owe a deepest gratitude to my abled supervisor, Assoc. Prof. Dr.
Sallahuddin Hassan, who has been extremely generous with his time, concern,
valuable suggestion and hospitality throughout my study. His academic support, his
guidance but most of all his patience even in the most difficult times were the most
precious support for me.
I am very grateful to the lecturers of School of Economics, Finance &
Banking especially who taught me Dr. Nor Azam Abdul Razak, Assoc. Prof. Dr.
Russayani Ismail and Dr. Soon Jan Jan for allowing me to share from their bounties
of knowledge to become a matured person and a useful student who can contribute to
Islam, race and nation, every time and everywhere.
I am also registered my sincere gratitude to Sheik Umar Sani Fagge and
Mallam Alkasim Zakariyya for the care, guidance and valuable suggestions always
giving to us. My sincere gratitude also go to my Father who concerned about me in
all the time, my gratitude also go to my brothers and sisters like Ishaq (Baffa),
Zulaihat, etc. who always are support in me as well as my friend Sulaiman
Muhammad Zubair, Mansur Farouq Sa’ad, Idris Wada Adamu and Ibrahim
Abubakar who gives continuous encouragement and impressive ideas in completing
this study successfully. I will not also forget my special thanks to the teachers and
students in both Tarbiyya Islamiyya and Darikunnajati Islamiyya Yankaba for their
prayers and concern.
My special thanks go to His Excellency Engr. DR. Rabi’u Musa Kwankwaso
Governor of Kano State, Nigeria for the full sponsorship of my Master Degree at
Universiti Utara Malaysia for his sacrifice and dedication for the actualization of this
wonderful programme. In addition, I have to express my gratitude to my colleagues
Universiti Utara, Malaysia.
Ishaq Auwalu Muhammad
(815008)

vii
TABLE OF CONTENTS
Page
TITLE PAGE i
CERTIFICATION ii
PERMISSION TO USE iii
ABSTRAK iv
ABSTRACT v
ACKNOWLEDGEMENT vi
TABLE OF CONTENTS vii
LIST OF TABLES x
LIST OF FIGURES xi
LIST OF ABBREVIATIONS xii
CHAPTER ONE: INTRODUCTION
1.1 INTRODUCTION 1
1.2 BACKGROUND OF THE STUDY 1
1.2.1 Foreign Direct Investment Inflows and Corruption Level in Gambia 7
1.2.2 Foreign Direct Investment Inflows and Corruption Level in Ghana 8
1.2.3 Foreign Direct Investment Inflows and Corruption Level in Liberia 10
1.2.4 Foreign Direct Investment Inflows and Corruption Level in Nigeria 12
1.2.5 Foreign Direct Investment Inflows and Corruption Level in Sierra
Leone 13
1.2.6 West Africa Region 15
1.3 PROBLEM STATEMENT 16
1.4 OBJECTIVE OF THE STUDY 20
1.5 SCOPE OF THE STUDY 20
1.6 SIGNIFICANCE OF THE STUDY 21
1.7 ORGANIZATION OF THE STUDY 21
1.8 CONCLUSION 22
CHAPTER TWO: LITRATURE REVIEW
2.1 INTRODUCTION 23
2.2 DEFINITION AND TYPES OF FOREIGN DIRECT INVESTMENT 23
2.2.1 Definition of Foreign Direct Investment 23
2.2.2 Types of Foreign Direct Investment 24
2.3 DEFINITIONS AND TYPES OF CORRUPTION 25
2.4 TYPES AND OF CORRUPTION 27
2.4.1 Grand Corruption 27
2.4.2 Petty Corruption 27
2.5 NATURE OF CORRUPTION 28
2.6 THEORIES OF FOREIGN DIRECT INVESTMENT 29
2.6.1 Neoclassical Trade Theory 29
2.6.2 Monopolistic Advantage Theory 31
2.6.3 Eclectic Theory 32
viii
2.6.4 Product Life Cycle Advantage 33
2.6.5 Gravity Model Approach 35
2.7 THEORETICAL REVIEW ON DETERMINANTS OF FOREIGN
DIRECT INVESTMENT 36
2.7.1 Market Size 37
2.7.2 Trade Openness 38
2.7.3 Infrastructure 38
2.7.4 Macroeconomic Stability 38
2.7.5 Corruption Level 39
2.7.6 Labour 39
2.7.7 Economic Freedom 39
2.7.8 Government Effectiveness 40
2.8 EMPIRICAL REVIEW ON DETERMINANTS OF FOREIGN DIRECT
INVESTMENT 40
2.9 EFFECTS OF CORRUPTION ON FOREIGN DIRECT INVESTMENT
INFLOWS 47
2.9.1 Negative Effects of Corruption on FDI Inflows 48
2.9.2 Positive Effects of Corruption on FDI Inflows 58
2.10 CONCLUSION 61
CHAPTER THREE: METHODOLOGY
3.1 INTRODUCTION 63
3.2 THEORETICAL FRAMEWORK 63
3.3 SPECIFICATION OF THE MODEL 66
3.4 JUSTIFICATION OF VARIABLES 67
3.4.1 Foreign Direct Investment 67
3.4.2 Corruption Level 67
3.4.3 Market Size 68
3.4.4 Trade Openness 69
3.4.5 Infrastructure 69
3.4.6 Government Effectiveness Index 70
3.4.7 Economic Freedom Index 71
3.4.8 Labour Force 71
3.4.9 Inflation 71
3.5 DATA 73
3.6 SAMPLE OF THE STUDY 74
3.6 METHOD OF DATA ANALYSIS 75
3.6.1 POOLED OLS REGRESSION 75
3.6.2 FIXED EFFECTS MODEL 76
3.6.2 RANDOM EFFECTS MODEL 77
3.7 CONCLUSION 78
ix
CHAPTER FOUR: DISCUSSION OF RESULTS
4.1 INTRODUCTION 80
4.2 DISCRIPTIVE STATISTICS 80
4.3 CORRELATION ANALYSIS 81
4.4 APPROPRIATE MODEL SELECTION 82
4.5 ANALYSIS RESULTS ON THE DETERMINANTS OF FOREIGN
DIRECT INVESTMENT 83
4.5.1 Model 1 83
4.5.2 Model 2 90
4.5.3 Model 3 93
4.6 DIAGNOSTIC TESTS 95
4.6.1 Variance Inflation Factor 96
4.6.2 Wald Test 96
4.6.3 Wooldridge test 96
4.6.4 Robust standard error test 97
4.7 ESTIMATES THE FDI INFLOWS FOR THE SPCIFIC COUNTRY 97
4.7.1 Model 4 97
4.9.2 Model 5 98
4.9.3 Model 6 100
4.10 DIAGNOSTIC TEST FOR SPECIFIC COUNTRY AND TIME
EFFECTS 101
4.11 CONCLUSION 102
CHAPTER FIVE: CONCLUSION AND POLICY IMPLICATION
5.1 INTRODUCTION 103
5.2 SUMMARY OF THE FINDINGS 103
5.3 LIMITATION OF THE STUDY 106
5.4 POLICY IMPLICATION 106
5.5 SUGGESTION FOR FUTURE STUDY 108
5.6 CONCLUSION 109
REFERENCES 111

x
LIST OF TABLES
Table 3.1: Summary of the Tested Hypotheses 78
Table 4.1: Descriptive Statistics 80
Table 4.2: Correlation Analysis 81
Table 4.3: The Results Probability tests 82
Table 4.4: Estimations Results of Model 1 90
Table 4.5: Estimations Results of Model 2 93
Table 4.6: Estimations Results of Model 3 95
Table 4.7: Estimations Results of Model 4 98
Table 4.8: Estimations Results of Model 5 99
Table 4.9: Estimations Results of Model 6 101
Table 4.10: Hypothesis Result of Countries Specific Effect 101
xi
LIST OF FIGURES
Page
Figure 1.1: FDI Inflows and Corruption Perception Index of Gambia
1998-2013 8
Figure 1.2: FDI inflows and Corruption Perception Index of Ghana
1998-2013 10
Figure 1.3: FDI inflows and Corruption Perception Index of Liberia
1998-2013 11
Figure 1.4: FDI inflows and Corruption Perception Index of Nigeria
1998-2013 13
Figure 1.5: FDI inflows and Corruption Perception Index of Sierra Leone
1998-2013 14
Figure 1.6: African Map 16
Figure 3.1: Theoretical Framework 65
xii
LIST OF ABBREVIATIONS
COC: Control of Corruption
CPI: Corruption Perception Index
ECOWAS: Economic Community of West African States
FDI: Foreign Direct Investment
FEM: Fixed Effects Model
FFC: Freedom from Corruption
GDP: Gross Domestic Product
GMM: Generalized Moment of Method
LM: Lagrange Multiplier
IMF: International Monetary Funds
MNC: Multinational Companies
OLI: Ownership Location Internalization
OLS: Ordinary Least Square
REM: Random Effects Model
TI: Transparency International
UN: United Nations
UNCTAD: United Nations Conference on Trade and Development
US: United States
SSA: Sub-Sahara Africa
VAR: Vector Autoregressive
vif: Variance Inflation Factor
VECM: Vector Error Correction Model
WACs: West African Countries
WDI: World Development Indicators
WGI: World Governance Indicators

CHAPTER ONE
INTRODUCTION
1.1 INTRODUCTION
This chapter consists introduction, background of the study, problem statement
which followed by research questions. The discussion of this chapter also comprises
objectives of the study, and then scope of the study.
1.2 BACKGROUND OF THE STUDY
Foreign direct investment (FDI) is a forum through which transfers of new
technology, global markets, increase in competition, human resources formation,
employment, economic growth and development could be achieved (Anyanwu,
2006). This is especially for the developing economies. During the 1990s, FDI
became the major external source of financing for the most economies (Alemu
2013). Ultimately, FDI is viewed as an essential fuelling channel for raising required
capital at a critical time as an assets or a means of financing during deficit. FDI is
defined as an investment made to get an ownership interest of 10 per cent in the
voting stock in a business undertaking operating in a country other than that of
investor (World Bank, 2014).
FDI is perceived to have valuable impacts on local firms and economy as a
whole by encouraging technological and managerial skills, international export and
import by developing economies and creating opportunities for jobs (Javorcik 2004;
Liu, 2008 & Kinda 2014). It has been noted that FDI has helped several countries
when they faced economic hardship. For instance, during the Asian financial crisis in

2
1997 the volume of FDI was held steady in these countries while the other parts of
cash inflows suffered by facing very serious setbacks in the economic transitions.
Similarly, the same observations had been made for Latin America and Mexico in
1994 and 1995. In the African society, the outlook of economic growth in sub-
Saharan African (SSA) has worsen in 2009, as projected by International Monetary
Fund (IMF) SSA economic growth slowed from just five per cent in 2008 and three
quarter per cent in 2009 over three per cent points less than forecast in a year ago,
there is a declined in fiscal balance by about six per cent of Gross Domestic Product
(GDP) (IMF 2009).
However, progress in the technological advancement and globalization
continuous to keep trade very easy among countries. Developing countries for
example are considered as the remarkable players by undertaking several financial
and structural changes in which African countries are structured to be the biggest
square of the worldwide economies. Moreover, countries selected are the role model
in terms of FDI in SSA in general and West Africa in particular. Among others,
Nigeria is considered as the “giant of Africa,” and “most populous” nation. Also, it
has the biggest economy in Africa that attracted more FDI inflows and the most
corrupt country in the region (Ernst & Youg, 2012). However, prior to investing in a
particular economy, several factors should take into consideration such as the size of
domestic market, infrastructural facilities, viability of investment, quantity of labour,
stability of microeconomic environment and the power of regulatory institutions in
the decision making process. Therefore, the inflow of FDI to an economy is
determined and restricted by many factors, one among which is corruption.
Furthermore, corruption is considered as a bottleneck and undesirable element that
prevents foreign investors from investing into a particular economy due to the fear of
3
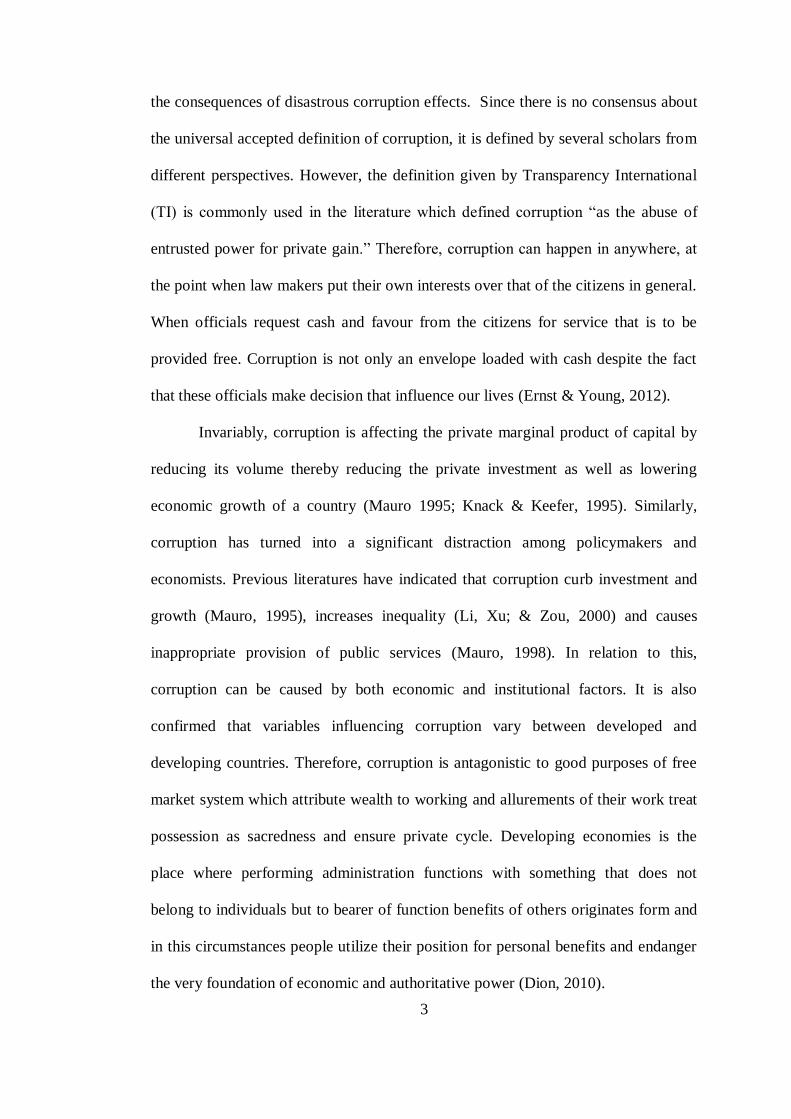
the consequences of disastrous corruption effects. Since there is no consensus about
the universal accepted definition of corruption, it is defined by several scholars from
different perspectives. However, the definition given by Transparency International
(TI) is commonly used in the literature which defined corruption “as the abuse of
entrusted power for private gain.” Therefore, corruption can happen in anywhere, at
the point when law makers put their own interests over that of the citizens in general.
When officials request cash and favour from the citizens for service that is to be
provided free. Corruption is not only an envelope loaded with cash despite the fact
that these officials make decision that influence our lives (Ernst & Young, 2012).
Invariably, corruption is affecting the private marginal product of capital by
reducing its volume thereby reducing the private investment as well as lowering
economic growth of a country (Mauro 1995; Knack & Keefer, 1995). Similarly,
corruption has turned into a significant distraction among policymakers and
economists. Previous literatures have indicated that corruption curb investment and
growth (Mauro, 1995), increases inequality (Li, Xu; & Zou, 2000) and causes
inappropriate provision of public services (Mauro, 1998). In relation to this,
corruption can be caused by both economic and institutional factors. It is also
confirmed that variables influencing corruption vary between developed and
developing countries. Therefore, corruption is antagonistic to good purposes of free
market system which attribute wealth to working and allurements of their work treat
possession as sacredness and ensure private cycle. Developing economies is the
place where performing administration functions with something that does not
belong to individuals but to bearer of function benefits of others originates form and
in this circumstances people utilize their position for personal benefits and endanger
the very foundation of economic and authoritative power (Dion, 2010).

4
However, it is very difficult to measure corruption level of particular country
but several studies employed several measures of corruption among which are
corruption perception index (CPI), freedom from corruption (FFC) and control of
corruption (COC) as the measure of corruption level of a particular country.
Therefore, with regard to these measures of corruption for a clear understanding and
a reference could be made much more to CPI in this research. Moreover, CPI is an
index which is complex by nature and it is based on the other survey which measures
the level of public sector corruption perception among 177 countries in the globe (TI
2013). The score result of corruption indicates that a country’s level in terms of the
corruption in that country and its rank, the list indicates position for each country that
covered during the survey period. Similarly, there is the need of complimentary
analysis to explain the reasons for a country certain level of CPI. Based on the expert
opinion the score of CPI, FFC and COC are categorized from 0 to 10, 0 to 100, and
-2.5 to 2.5, where zero or -2.5 score indicates high corruption level while 10 or 2.5 or
100 score means the cleanest from corruption level. Therefore, a country that scored
zero or an index closer to zero is consider as the most corrupt country and a country
that score 100 or an index closer to 100 is consider as the cleanest country in terms of
the level of corruption. Consequently, two third of 177 countries covered in 2013
CPI survey scored less than 50, this indicates the need for transparency and
accountability in most of the institutions (TI, 2013).
Nevertheless, corruption varies across the globe some regions are
characterized with high corruption levels which leads to attract low FDI inflows
while regions that characterized with low levels of corruption attracts more FDI
inflows. Therefore, results of the global CPI ranking of corruption shows that about
70 per cent of the countries scored below 50 out of 100 score with the average of 43

5
score and this remain a growing problem which must be rectified for the sanity in the
international transactions (TI, 2013). Similarly, the level of corruption varies across
the globe (regions) in which regions as well as the countries are classified base on
their rank of CPI score. Afterwards, most of countries in the East and Western
Europe are considered clean from corruption with about 80 per cent of countries
scored more than 50 of the total corruption score, Asia Pacific countries are
characterized with relative score of corruption in relation to other regions where 64
per cent of countries scored less than 50. While 66 and 84 per cent of countries in the
Americas and Middle East and North African regions scored less than 50
respectively. Lastly, 90 and 95 per cent for countries in the Eastern Europe and SSA
scored less than 50 and this indicates the regions as the most corrupt in the world (TI,
2013). But surprisingly, despite their high levels of corruption but they still attract
more FDI inflows.
Corruption exists in the world and there is no any country both developed and
developing countries that will claim a zero score of corruption level. However, in
recent time greater attention have been paid to corruption on how to resolve it,
several conferences and summits have been organized to find the solutions. Among
which are Berlin conferences in Germany and recently a summit organized by US
government on the problem of corruption and insecurity in Africa in 2014.
Furthermore, in Africa corruption has become a preoccupation topic of discussion
among scholars and public officials. It also becomes a developmental issue, countries
in Africa cannot bear the burden of corruption which distort their growth and
development and then it makes regulatory agencies inability to reduce poverty
(Lawal, 2007). TI identified Africa as among the most corrupt region in the world
6
where SSA identified as the most corrupt region. However, among the listed 10
most corrupt countries in the world six are from SSA (TI, 2013).
Notwithstanding, there are two schools of thought with the regards to the
effects of corruption on FDI inflows namely; “grabbing hand” theory of corruption
or “sandy the wheels” corruption hypothesis and “helping hand” theory of corruption
or “greasing the wheels” corruption hypothesis. Researchers whose their findings are
in support of the “grabbing hand” theory of corruption concluded that corruption
impedes FDI inflows, it increases the cost of doing business, it discourages
competition, it creates poverty and inequality and it is also reduces productivity. On
the other hands, there are scholars whose their research findings are supporting the
view of corruption as “helping hands” theory of corruption, they concludes that
corruption encourages FDI inflows and trade that would not have occurred because
of the rigidity of economic policy and lumbering bureaucratic procedure as such
promote efficiency by permitting private entities to go around the regulations (Leff
1964 & Wei, 2000).
However, by considering FDI inflows as an essential engine that facilitates
international transactions and the driver for growth and development which is also
considered as a source of financing for many economies especially developing
countries. The global FDI inflows fluctuated over years where it is deteriorating from
2000 ($1.4 trillion) up to $604 billion in 2003 and $738 in 2004 to $738. It reached
peak in 2007 which also accounts for $2.0 trillion, after then due to global financial
crisis in 2008 the inflows in FDI faced a setback which it deteriorates from $1.8
trillion in 2008 to $1.7 trillion in 2011 to $1.3 trillion in 2012. But after it slumped in
2012, FDI inflows return to growth and it increases by nine per cent which
contributed $1.6 trillion in 2013 (UNCTAD, 2014). Similarly, it is not only global

7
crisis that led the fluctuations in FDI inflows but also factors like corruption,
government efficiency, political stability, etc. the deviations in FDI inflows was also
caused by the changes in the global corruption perception index over the sample
periods. Equally, with regard to the selected countries for this research work, FDI
inflows still play a vital role as a source of finance to these economies. Based on the
World Investment Report from UNCTAD (2014) stated that Nigeria appeared as the
biggest receiver of FDI inflows which is followed by Ghana and then Liberia, then
Sierra Leone while Gambia becomes the fifth economy in attracting more FDI
inflows, this can be explain as follows:
1.2.1 Foreign Direct Investment Inflows and Corruption Level in Gambia
Gambian economy is an economy which relied on Agricultural products for its
revenue. Recently, the economy has run into a substantial trade and deficits in
current account due to macroeconomic instability (reflected from the rise in the
inflation rate) that largely is financed by loans and increasingly FDI inflows.
However, among these economies, Gambia has the worst and minimum amount of
FDI inflows and it is highly corrupted which reflected from the country’s
transparency level than can be observed in Figure 1.1. It can be seen that the inflows
in FDI is characterised by random shocks in relation to the level of CPI, which
around 1998 FDI inflows rise from $23.7 million to $49.5 million in 1999 but it start
fluctuating downward which is drastically decreased to $14.9 million in 2003, in
these periods the FDI inflows decreased due to decline in the macroeconomic
performance reflected from the loose impact of fiscal policy and likewise, its
transparency level decreased to 2.5 in 2003. Since then, the CPI continuous
deteriorating and became worst in 2008 by scoring only 1.9. But despite the fall in

8
transparency level, FDI inflows continuous to increase where it reached peak in 2007
by contributing $76.5 million. Because of the effects of financial crisis in 2008,
inflows in FDI continuous declining up to 2013 with the inflows in FDI as $25.3
million despite the improvement in the country’s level of CPI from 1.9 score in 2008
to 2.8 score in 2013. Therefore, the CPI for Gambia is also presented in Figure 1.1.
Figure1.1: FDI Inflows and Corruption Perception Index of Gambia, 1998-2013
1.2.2 Foreign Direct Investment Inflows and Corruption Level in Ghana
In Ghana, corruption continuous to widespread where most of the businesses
consider corruption as a vital obstacles that hinders their business advancement, a
request for corruption in Ghana become a common phenomenon to both public and
0.0
0.5
1.0
1.5
2.0
2.5
3.0
3.5
4.0
0.0
10.0
20.0
30.0
40.0
50.0
60.0
70.0
80.0
90.0
FD
I In
flow
s (m
illi
on
)
Year C
PI

9
private sectors. However, with discovery of oil in Ghana, foreign investors focused
their attention to invest in the Ghanaian economy and this led to increase in FDI
inflows over the years. Similarly, the country enjoys stable increase in FDI inflows at
the time when its regional tight neighbouring countries like Nigeria, Liberia and
Sierra Leone are in constant stage of conflict, insecurity and instability. However, the
increase in the Ghanaian FDI inflows and CPI trend can be depicted in Figure 1.2.
This figure indicates the FDI inflows of Ghana from 1998 to 2013. The inflows of
FDI into remain almost stable with slight fluctuation from 1998 to 2005 with a
dwindling corruption level unless between 2001 and 2002 when it increases from 3.4
to 3.9 leading to fall in the level of FDI inflows from $89.3 million to $58.9 million.
Despite the increase in the level of corruption over years, FDI inflows continuous to
increase especially from 2007 when the offshore oil is discovered in commercial
quantity which led inflows in FDI to increase from $8554 million in 2007 to $2897
million in 2009 while corruption fluctuated from 3.7 to 3.9 in both 2008 and 2009.
But due to the effects of global financial crisis, the inflows in FDI shocked to 2527.4
million in 2010 and in the subsequent years continuous to fluctuate upward where it
reached $3226.3 million in 2013 despite the improvement in CPI from 3.9 in 2009 to
4.6 in 2013.

10
Figure 1.2: FDI inflows and Corruption Perception Index of Ghana 1998-2013
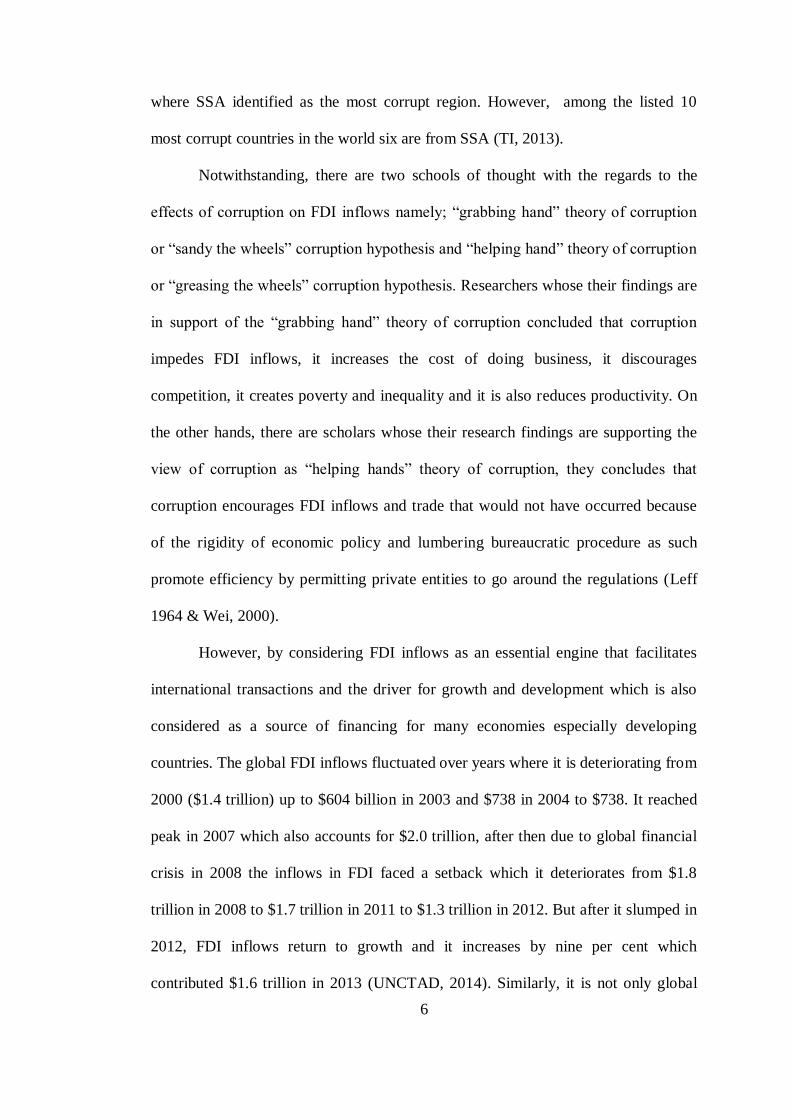
1.2.3 Foreign Direct Investment Inflows and Corruption Level in Liberia
Liberian economy faced a serious setback during eight years of civil war, high level
of political and economic instability, and international sanctions that mainly
destroyed large businesses and pooled out several foreign investors and this derived
down the level of FDI inflows over years. Liberia is also a country that characterized
with the weak regulatory authorities and lack of transparency as well as
accountability, unfortunately FDI of the several sectors have restricted by the
government therefore financial sectors remain vulnerable and this destructed the
development of FDI inflows. Therefore, the trends of the inflows of Liberian FDI
together with CPI are shown in Figure 1.3. The trend of Liberian FDI inflows
fluctuate upward with the improvement in the corruption level in some years, then
FDI inflows increase from $190.3 million in 2008 to $256.3 million in 1999 but it
0
0.5
1
1.5
2
2.5
3
3.5
4
4.5
5
0.0
500.0
1000.0
1500.0
2000.0
2500.0
3000.0
3500.0
FD
I In
flow
s (M
illi
on
)
Year
CP
I
11
falls drastically to $20.8 million, $8.3 million and $2.8 million in 2000 to 2002. In
2003 increases to $372.2 million but suddenly fall to $75.4 million and these are the
periods when country is in civil war but after the war periods the Liberian FDI
inflows continuous to fluctuating upward from 2004 up to 2013 though corruption
levels also continuous deteriorating from 2005 to 2007 but it improves up to 4.1
score 2012 which fall to 3.8 score in 2013. Similarly, FDI inflows increased from
$508.0 million in 2011 to $ 1061.3 million accounted for oil extraction (World Bank,
2014).
Figure 1.3: FDI inflows and Corruption Perception Index of Liberia 1998-2013
0
0.5
1
1.5
2
2.5
3
3.5
4
4.5
0.0
200.0
400.0
600.0
800.0
1000.0
1200.0
FD
I In
flow
s (M
illi
on
)
Year
CP
I

12
1.2.4 Foreign Direct Investment Inflows and Corruption Level in Nigeria
One of the major obstacles to the growth rate of FDI inflows to Nigeria is corruption.
Nigeria is overrun by corruption and it becomes chronic which continues to impede
growth and development. In Nigeria, corruption is endemic in both public and
private sectors and the country has been consistently ranked low (highly corrupt) in
the TI corruption annual survey. Therefore, fortunately for the country as its CPI
continuous fluctuating upward while keeping its FDI inflows also continuous moving
upward over years and this can be shown in Figure 1.4 and CPI can also be depicted
in Figure 1.4. Similarly, Figure 1.4 shows the trend that depicts behaviour of
Nigeria’s FDI inflows in relation to CPI from 1998 to 2013. Initially, FDI inflows
fluctuated in almost constant rate from 1998 to 2000 where the CPI is also stable but
after 2001 when regulatory authorities start becoming unstable corruption starts
increasing but despite the increased in corruption level FDI still continuous to
contribute significantly to the percentage share of GDP from $1.27 million in 2001 to
$8.65 million in 2009. Around these periods (2010 & 2011) the level of corruption
remain stable but the level of FDI inflows continuous to deteriorate from $8.91
million in 2011 to $5.61 million in 2013 and the corruption level improves 2.7 in
2012 though it falls to 2.5 in 2013 this is not because of only level of CPI but the
country is faced with serious political, economic and social instability ranging from
emergence of crisis in Niger Delta, boko haram insurgents etc. However, according
TI (2014), Nigeria give rooms for the activities of terrorists organizations to flourish.

13
Figure 1.4: FDI inflows and Corruption Perception Index of Nigeria 1998-2013
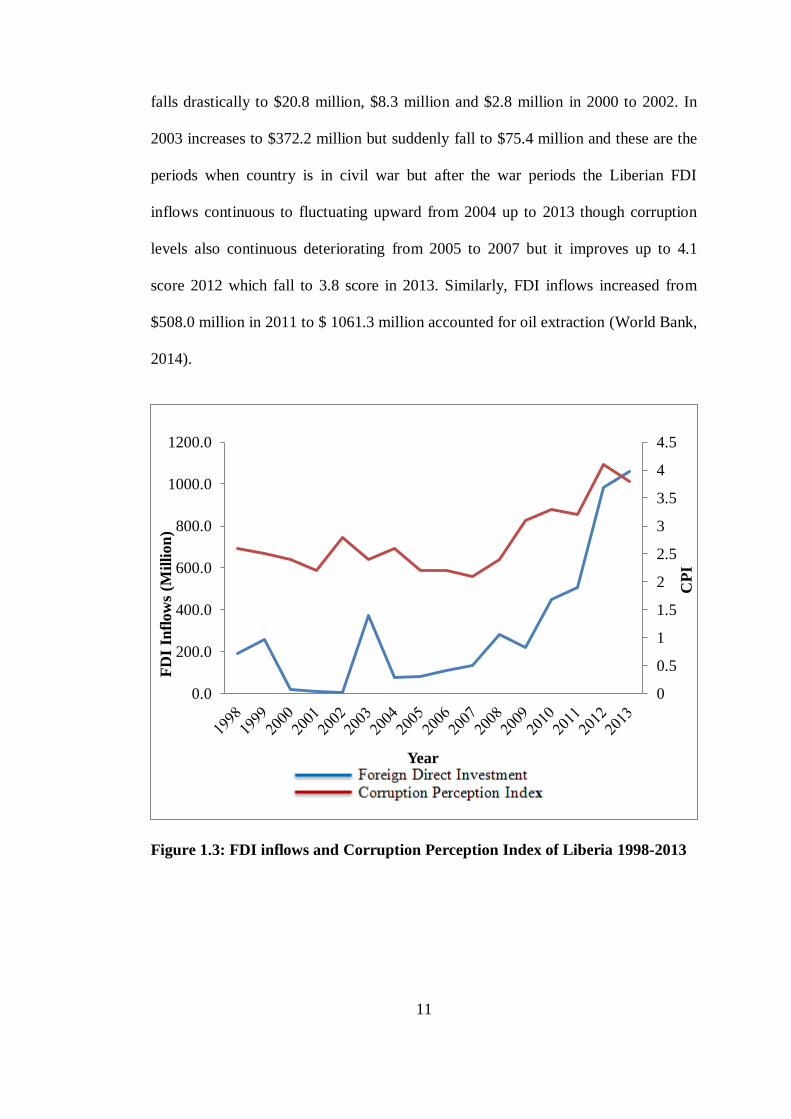
1.2.5 Foreign Direct Investment Inflows and Corruption Level in Sierra Leone
Sierra Leone like Liberia experienced economic disaster caused by the civil war that
lasted for at least 11 years which bring down almost all economic transactions at
local and international levels and this resulted to a very minimum amount of FDI
inflows over the years. However, during the post-war periods, government moves
from post-war reconstruction to a long term strategic development. Sierra Leone
economy which heavily depends on agriculture and the government made it a
priority as part of the overall strategy to attract a sustainable amount of FDI inflows
from agriculture. This led to the design of several agricultural policies such as
National Sustainable Agriculture Development Plan (NSADP) in 2010, Smallholder
Commercialization Programme (SCP) in 2012. But the country has a very high level
0
0.5
1
1.5
2
2.5
3
0.0
1000.0
2000.0
3000.0
4000.0
5000.0
6000.0
7000.0
8000.0
9000.0
10000.0
FD
I In
flow
s
Year
CP
I
14
of corruption perception that also contributed to the fewer amounts of FDI inflows
into the country. Therefore, trend of inflows in FDI is shown in Figure 1.5. Based on
this figure one can observed that FDI inflows in 1998 and 1999 is almost $0.1 billion
but increased in 2000 to $38.9 billion then declined in 2001, 2002 and 2003 with
highly corruption level but from 2004 which is $61.2 million continuous fluctuating
up to $110.8 million in 2009 therefore, this low level of FDI inflows resulted during
the civil war which ended around 2002. But during the post-war periods together
with commitment by the government to improve the inflows in FDI with the
introduction of NSADP and SCP, FDI inflows rose from $238.4 billion in 2010 to
$950.5 billion in 2011. But despite the improvement in the CPI level inflows in FDI
fluctuate and deteriorate to $579.1 billion in 2013. CPI for Sierra Leone can also be
shown in Figure 1.5.
Figure 1.5: FDI inflows and Corruption Perception Index of Sierra Leone
0
0.5
1
1.5
2
2.5
3
3.5
0.0
100.0
200.0
300.0
400.0
500.0
600.0
700.0
800.0
900.0
1000.0
FD
I In
flow
s (M
illi
on
)
Year
CP
I
15
1.2.6 West Africa Region
West Africa is also called Western Africa, is the westernmost subregion of African
continent that comprise 15 countries namely; Burkina Faso, Cape Verde, Cote
D'ivore, Gambia, Ghana , Guinea, Guinea Bissau, Liberia, Mali, Niger, Nigeria,
Senegal, Sierra Leone and Togo. The region characterized with agricultural
activities, started with sedentary farming as well as the domestication of cattle.
However, the ironworking technology allowed for the expansion of agricultural
productivity which then inter-regional trade began to appear. The domestication of
camel allowed for the development of trade across the regions, the major export
includes gold, cotton cloth, mental ornament and leather goods which were exchange
for horse, salt, textiles and other materials. Nowadays, several countries in the region
where attracting a huge amount of FDI inflows into their economy. For instance,
Nigeria and Ghana attracted large amount of FDI inflows into the mining sector
while Gambia, Liberia and Sierra Leone attracted large share of the inflows of FDI
into agriculture. Below it is the African map that could be help to easily locate West
African subregion.

16
Source: http://wereghanatalkaboutafrica.weebly.com/geography-and-
imperialism.html
Figure 1.6: African Map
1.3 PROBLEM STATEMENT
FDI and corruption are conflicting variables that affect global business activities,
FDI inflows as a source for financing that enables transfer of new technology and
generating employment. But corruption as a distortive factor destruct the activities
and smooth running of FDI inflows in many economies, most especially in the
context of developing economies in which they are characterized by weak regulatory
authorities. However, for foreign investor to invest in an economy, should consider

17
the level of corruption, the institutional power, macroeconomic stability as well as
the size of the market of such an economy.
Corruption as a complex phenomenon was profound in private and public
institutions (World Bank, 1997). Empirical evidence indicates that corruption have
several adverse economic effects such as slowing growth in FDI inflows and
economic growth (Habin & Zurawicki 2002; Mauro 1997, 2004; Shera et al., 2014).
It causes decrease in both productivity and amount of investment (Mauro 1995,
1997; Tanzi & Devoodi, 1997), discourages investment (Wei, 2000; Al-Sadiq, 2009)
and it weakens the government efficiency and infrastructure (Bellos & Subasat,
2011). In many cases, corruption does not only depressed educational quality but
also creates worsen income inequality via the scarcity of resources to student from
the high income families (TI, 1997). While others consider corruption as a lubricated
instance that slacked the rigidity of regulatory institutions. Therefore, corruption
compensated bad governance and encourage more FDI inflows (Wei, 2000). This
suggests that as low quality of government coincides with corruption, corruption can
lower the problems emanated from government inefficiency.
Therefore, because of the above issues raised due to the critical role of FDI
inflows in relation to many countries, only few studies were conducted around the
world and particularly with regard to developing economies by some few researchers
such as Wei (2000), Al-Sadiq (2009), Porters (2010), Alemu (2012), Tosun Yurdakul
and İyidoğan (2014), Leff (1964) Bellos and Subasat (2012), Quazi, Vemuri, and
Soliman, (2014), Tosun, Yurdakul and Varol (2014). However, most of these studies
present inconclusive and contradictory results over the effects of corruption on FDI
inflows and as such more studies are needed in this area and this justify the need for

18
this research. Additionally, there is the need also to re-examine the domestic
governments in terms of its role into the business environment.
Currently, there is an increasing attention paid to corruption as a major factor
that distorts or impedes FDI flows, economic growth and development of any
economy. A series of cases of corruption have been identified in many countries
including selected countries. In recent years most of the developing countries have
registered as countries with the highest rate of corruption. The World Bank asserted
that corruption is among the most problematic variable that impedes economic and
social development. That is, it has significant effects on economic activities of a
country which in turns distort FDI inflows. United Nation Development Programme
(UNDP) in 2013 reports that corruption undermines human development and rule
system of the country, it lessens access to public services by redirecting public asserts
for private ownership. Corruption is overall sensation and it is widely perceived as
the one of the world most prominent challenge, it is major hindrance to sustainable
growth and development and excessively affects the poor community also in burning
on the extreme fabric of society. The impact of corruption of private sector is
likewise critical; it obstructs financial economic growth, distorts competition and
includes serious and legal reputational risks. Corruption is also increase the cost of
doing business in most parts of the world (World Bank 2014).
In the same way, due to adverse effects of corruption which always
escalating, world leaders where take part in the discussion of the causes, effects and
how to resolve it for the prospect of economic growth and development brought
about by the FDI inflows into their regions. According to Anne Gearan the US Vice
President Joe Biden on August 6, 2014 while addressing the African leaders during a
summit organised by US government, on the issue of corruption and insecurity in
19
Africa that “Corruption is a ‘cancer’ that blocks opportunities for African nations
seeking international investment”(Washington D.C. 2014). Likewise, in October 9,
2014 former president of Malawi Joyce Banda in her statement during Global
Women Forum in August, 2014 said that “corruption is just impediments which need
to be tackle for economic growth and development”(Nyasa Times Malawi 2014).
Therefore in Daily trust Newspaper, former military Nigerian Head of States Gen.
Muhammadu Buhari on 16 October, 2014 decleared that Nigerian government is the
most corrupt government in Africa. According to him “The economy continues to
deteriorate while government continues to announce fantastic growth figures but
manufacturing is down, agriculture is down, commerce is down simply because you
sell oil and steal part of the money. That does not entitle you to cook figures and
announce phantom economic growth when all the major indices namely,
employment, manufacturing, farming, trading are demonstrably on the decline”.
In addition, most of the African economies especially SSA economies are
bedevilling with the problem of corruption as it causes deterioration in their FDI
inflows among which are Gambia, Ghana, Liberia, Nigeria and Sierra Leon.
Likewise, the report of TI indicates that these countries in one way or the other are
facing with the serious challenges of corruption that caused adverse impacts of FDI
inflows. Ultimately, According to TI ranking in 2013 Nigeria scored 25 of the
corruption score that indicates Nigeria as the most corrupt country among these
economies which ranks it as 144 in the world, Gambia also scored 28 which
classified also as the most corrupt country that ranked 127 in the world corruption
ranking, it was followed by Sierra Leone which is ranked as 119 in the global
ranking with corruption score as 30, Liberia has been ranked as 83 in the world with
corruption score as 38. Ghana among these countries appeared as the cleanest
20
country with corruption score as 46 and it was ranked as 63 country in the globally.
Nevertheless, referring to discussion above, this study will attempt to answer the
following questions:
i. What are the impacts of corruption on FDI inflows in some selected WACs?
ii. Does government effectiveness have any significant effects on FDI inflows in
the selected WACs?
iii. Which factors that determined of FDI inflows in some selected WACs?
1.4 OBJECTIVE OF THE STUDY
Generally, the objective of this study is to assess the effects of corruption as well as
other determinants of FDI inflows in some selected WACs namely; Gambia, Ghana,
Liberia, Nigeria and Sierra Leone. Specifically, this study has the following specific
objectives as:
i. to examines the impacts of corruption on FDI inflows in some selected WACs,
ii. to evaluate the effect of government effectiveness on FDI inflows in some
selected WACs,
iii. to identify the determinants of FDI inflows in some selected WACs.
1.5 SCOPE OF THE STUDY
The scope of this study limit itself to investigate the determinants of FDI inflows into
five selected WAC. Precisely, this study examines countries such as Gambia, Ghana,
Liberia, Nigeria and Sierra Leone. The study also covers the period from 1998 to
2013 due to the availability of the data. Equally, the study would investigate the
variables that could influence the decision to invest by MNCs.
21
Based on this study, it is believed that the selected sample might represent the
entire WACs and it is also believed that data will be very much accurate by
providing sufficient and reliable information that can be useful when taking decisions
by both local and foreign investors as well as the government at large.
1.6 SIGNIFICANCE OF THE STUDY
Essentially, the research evaluates the impacts of corruption on FDI inflows thereby
given important information to policy makers. Policy makers need information on
how corruption level affects the inflow of FDI into their economy in order to take
appropriate measures to ameliorate the situation. Equally, it is also important to other
stakeholders such as foreign and domestic investors because it will help them to
determine the risks associated with their investment. The study will also contribute to
the existing literature, because unlike previous studies that rely on cross country
cross sectional data, it will employ panel data technique which takes the
heterogeneity nature of the countries into consideration to estimate effects of
corruption on FDI inflows.
1.7 ORGANIZATION OF THE STUDY
The study consist five chapters, Chapter One comprises the background of the study,
the problem statement, research questions, objectives of the study, scope of the study
and organization of the study. Chapter Two includes reviews of the related and
relevant conceptual and empirical literature concerning the determinants of FDI
inflows in Africa and effects of corruption on FDI inflows. Chapter Three contain the
theoretical framework, methodology use to achieve research objectives. Chapter Four
is concern about data analysis of the empirical results. Lastly, Chapter Five which

22
include summary, conclusion, recommendations as well as the implication for further
research.
1.8 CONCLUSION
The background of this study discussed extensively FDI as a channel of transferring
technology and employment into the target countries. This chapter predominantly
described the contributions of FDI inflows in WACs and how corruption level and
other deterministic factors are influencing the inflows of FDI over the periods of
time. In addition, the problem statement highlights the effects of corruption on FDI
which was conducted in respect to developing economies. But few or no study has
conducted with the regard to the effects of corruption on FDI inflows in WAC. It
also identified the research questions that the study would try to answer and
objectives with which this study try to achieve. The scope of which this study would
cover as well as significance and organization of the study have also presented in this
chapter.
23
CHAPTER TWO
LITRATURE REVIEW
2.1 INTRODUCTION
This chapter includes the explanation of definition of the key concepts which
comprise meaning of FDI, meaning and types of corruption, theoretical and empirical
review of FDI and determinants of FDI inflows with regard to African countries. The
literature on the role of corruption either as “grabbing-hand” or as “helping-hand”
theories of corruption are also discussed and then finally concluded by summarizing
the reviewed literature.
2.2 DEFINITION AND TYPES OF FOREIGN DIRECT INVESTMENT
This section comprised the definitions of FDI and then followed by different types of
FDI by some scholars.
2.2.1 Definition of Foreign Direct Investment
World Bank (2014) defined foreign direct investment as the net inflows of venture
made to obtain a lasting 10 per cent interest or voting stock in an operating enterprise
in a country outside that of investors. According to IMF (2004) FDI “refers to an
investment made to acquire lasting or long-term interest in enterprises operating
outside of the economy of the investor.” The investment is said to be direct due to
fact that the investor is seeking to manage or to influence managerial decisions over
the foreign enterprise by acquiring voting interest.
24
2.2.2 Types of Foreign Direct Investment
Generally, with Regard to the different types of FDI, there are three types that can be
categorised based on their distinctive and basic characteristics such as based on
motive, direction and targets (Bellos, 2010).
Based on the motive, Sichei and Kinyondo (2012) identified three types of FDI
namely; market-seeking FDI, resource-seeking FDI and efficiency-seeking FDI.
While Dunning (1993) classified types of FDI into market-seeking FDI, resource-
seeking FDI, efficiency-seeking FDI and strategic-seeking FDI. Market-seeking FDI
this occurs when the primary purpose of a company is to serves the local market as to
take advantage of new markets. Meanwhile, resource-seeking FDI occurs when a
company’s primary aim is to gain access to resources in the host country which are
not available in their home country resources such as raw materials, low cost of
labour and natural resource because some countries are strategically endowed with
natural resources than others. Similarly, efficiency-seeking FDI this happens when
the foreign firm could gain when the government in the host are efficient and
presence of large economic scale. However, Okurut Narayana and Chidozie (2012)
argued that the efficiency-seeking company also needs to take advantage of
efficiency and quality of infrastructure, skilled and cheap labour force. Strategic-
Asset Seeking FDI is consistently realized as a result of the presence of strategic
alliance with some firms or activities that could force barriers to the competitors and
to ensure their market position is protected.
Furthermore, in terms of directional type of FDI, it classified as inward and
outward FDI. By inward, it is where the foreign capital is invested in the domestic or
local market. While outward FDI is that investment in which the local capital is
invested in the foreign markets.
25
Meanwhile, the following are the types of FDI based on target as. Greenfield
investment, these are the direct investment which intends to establish new facilities
or expand existing ones, for instance, the building of new plant for production, the
launch of new production line in an operating factor or they are concerned with the
imitating of a totally new firm in the host nation. While horizontal investments are
those investments that take place in the sector or industry that is the same as the one
in which the investing firm operates in its home country. Lastly, there is vertical type
of FDI, that further divided into two namely; forward vertical FDI and backward
vertical FDI. Forward vertical FDI are those investment that is provides products to
another firm abroad in order to sold in foreign markets. Whereas backward FDI are
those investments that provide inputs to the foreign firm that could be used in the
production process.
2.3 DEFINITIONS AND TYPES OF CORRUPTION
There is no unified single definition of corruption due to its complexity and
problematic. Several scholars define the concept of corruption from different point of
views so it is no easy to come up with either single meaning of corruption or how to
measure it. Though the act of corruption can easily be recognized when it observed
and the lack of consensus on the universal definition of corruption has led to the
several definitions. United Nations (2001) defines corruption as:
‘Abuse of public power for private gain that hampers the public
interest. This may be indirect or direct ∙ ∙ ∙ corruption entails a
confusion of the private with public sphere or an illicit exchange
among the spheres, corrupt practices involves public officials acting
in the best interest of private concern regardless of, of against the
public interest’ (P.7).

26
However, TI defines corruption in a way which gives more details than that of
United Nation because it covers many areas by reference of ‘civil servants,’ as
political power and ‘politicians’. Therefore, TI defines corruption as
“Behaviour on the part of officials in public sector whether
politicians or civil servant in which they improperly and unlawfully
enrich themselves or those closer to them by abuse of public power
entrusted to them. This as well as corrupt practices such as bribery,
extortion or influence peddling” (P.37).
Moreover, Asian Development Bank (2009) defines corruption which
includes private sector as
“Abuse of public power to promote private benefits. Thus, a public
employee who abuses his/her public position to derive benefits for
one self or friends, relatives or political associates is engaging in an
act of corruption.” (P.4)
Based on the definitions above whether it encompasses the public or private
sectors or it includes public officials or private official does not matter. In terms of
corruption the public and private, they are almost the same both their actions has an
impact on economic activities and it has to take into account.
Additionally, Tanzi (2006) defines corruption as “international act of non-
compliance with the purpose to deceive for deriving advantage to one self-base on
the arm’s length principle”. Moreover, Budima (2006) defines corruption as “a
private gain at the public expense”. Primorac Primorka and Smoljic, (2011) argued
that corruption is a social defect that exhibits lack of social norms and values that are
inevitable for normal function of a free market economy. Aidit (2014) defines
corruption as act of using power of public office for private gain in a procedure that
contradict rule of the game. Therefore, corruption manifests in many ways as bribery,
nepotism, extortion, fraud, influencing peddling or speed money. In summary,
27
corruption is the manifestation of poor esthetical standard, institutional weakness,
skewed incentives and inefficient enforcement.
2.4 TYPES AND OF CORRUPTION
Susan (2006) summarized the following common types of corruption which are
identified in the literatures, namely; grand corruption and petty corruption.
2.4.1 Grand Corruption
This is the type of corruption in which frequently is found where high public officials
who are responsible for taking decision in favour for their personal benefits. It is also
an integrated section of the political, economic and social system of any economy
which involves a large amount of money. It is also consider as when a highly placed
person deviate by exploiting his position for the selfish interest in which he
embezzled a huge amount of money from public treasury into private account bank.
For example, this happens when MNCs pay a high government officials or
politicians millions of dollar to get a business contract. Therefore, sometime this is
also termed as political corruption.
2.4.2 Petty Corruption
This is corruption in which the lower government official whom was underpaid
depends upon public funds to paid their pockets and to take care of their families. It
involves relatively small amount of money. However, despite the amount a minimal
but pretty corruption can be added up to make a huge amount. Therefore, little grand
28
corruption with huge amount of pretty could outset and squandered whatever a
project a government embarked on.
2.5 NATURE OF CORRUPTION
Corruption it is not only happed particularly in developing countries like Ghana,
Nigeria, India, China and Malaysia, but it is also generally happened in the
developed countries like United States of America (U.S.), United Kingdom,
Germany and France. Corruption has long been bedevilling factor which distorts FDI
inflows in many economies. Corruption is connected with the misuse of resources by
public officials for personal gain, late liquidation cases, for instance, WorldCom and
Waste management displayed that corruption is not only limit to public officials.
There are numerous distinctive types of corrupt practices in the private sector and
this increment in worldwide literature and organizations that manage this corrupt
practices, it has reveals corruption engineered a lot of economic distortion and keeps
on drawing attention of the public. For instance, corruption impedes the
improvement in business sector, heads out investment and undermines the principle
of law. Additionally, corruption is wide spreading in the present economic activities
in the most of developing economies; therefore we have private-to-private and
private-to-public corruption.
Socially, corruption demoralizes people to work together for the benefit of
everyone it causes social vices. In Nigeria, specifically requesting and paying bribes
has turn to be tradition which in nowadays becomes social inequality by creating
disparity among the rich and poor. It increases poverty and insecurity between the
citizens and foreigners. Finally, with this in mind, present literatures on the effects of
corruption on FDI inflows still provides mixing results which means there is no any
29
unified base for making a general conclusion (Asiedu 2006; Asiedu Jin & Nandwa,
2009). This however, implies that there is more need to conduct more investigations
in this area.
2.6 THEORIES OF FOREIGN DIRECT INVESTMENT
Primarily, this section is aimed to presents the theoretical basis behind FDI. Also
secondarily to highlight the basic stages of the factors that determine the FDI inflows
according to the theoretical approaches presented. Therefore, this theoretical review
would provide an insight into the nature and the ways through FDI is operated.
Generally, this section would provide the categories of FDI determinants that could
enhance the effectiveness of the empirical analysis presented in the following
chapters. The following are the theories of FDI in which the researchers usually
adopted in their studies such as Neoclassical Trade Theory, Monopolistic Advantage
Trade Theory, Eclectic Theory, Product Life Cycle Theory and Gravity Model
Approach.
2.6.1 Neoclassical Trade Theory
This theory is built under the assumption of a perfect competitive market in which
the MNCs will locate a business in foreign economies where the investment return is
very high. This assumption is not realistic in actual sense because the market is
imperfect by its nature. This theory is developed from the work of Heckschers-Ohlin
where FDI was seen as of international capital market based on a general
equilibrium framework and this implies that there are only two countries (foreign and
home), two factors of production (labour and capital) and there are only two
30
competitive goods in a perfectly competitive goods and factor markets. The theory
also assumes constant return to scale. The theory is also argued that a country’s trade
is determined primarily by its own endowment of factors and that output of each
good is primarily determine by the production functions and the production function
for the whole countries are the same. Mundell (1957) investigated the effects of
factor movement in two countries, two countries and two sectors (2 x 2 x 2)
Heckscher-Ohlin model. His findings shows that inflow of capital decreases import
(i.e. capital movement and trade are found to be substitute). Therefore, his argument
can be concise as “trade in factors is substitute for trade in goods”. Moreover, Zhang
and Markusen (1999) provide a model as 2 x 2x 2 in an oligopoly framework
(Cournot) where they introduced cost of transport which is absent in the neoclassical
theory and their model predicts the positive association with the number of vertical
MNCs and host country size. This was also supported by (Brainard 1997).
In contrast, instead of examining factor movement like in Mundell (1957) and
MacDougall (1960) investigate the simplest case of the inflow of capital into the one
sector economy and he found that FDI inflows is lower than capital rent in the
domestic economy, though it increases labour productivity. Therefore, FDI is thought
best as movement of firms instead of simple capital movement (Navaretti &
Castellani, 2004; Freenstra & Kee, 2004). In addition, Hymer (1976) argued that
MMNCs could be benefited by locating their investment in an economy where there
is high comparative advantages, such as cheap labour, technological know-how,
productive assets and economies of scale over the domestic firms. Hymer disposition
neoclassical theory of not been able to explained the FDI because in his view the
structural market imperfection needed to flourish.
31
2.6.2 Monopolistic Advantage Theory
This is an approach in international transactions that explained the reasons for MNCs
to enter into competition with local firms in foreign settings. According to this theory
MNCs has advantage in the foreign markets over its local counterpart competitors by
earning more profits than local firms. According to Hymer (1966), MNCs has
comparative advantage of ownership over strategic resources by producing and sell
at lower price than local firms. He also dispositioned the assumption of neoclassical
theory of perfect competitive market that cannot explain FDI. He also argued that the
foreign markets are imperfect and this market imperfection results in comparative
advantage for MNCs in a specific market (Dunning & Rugman 1985). Therefore, it is
the market power that provided advantage, MNCs enter into foreign market because
of their size and they do have considerable competitive advantage over local firms.
Kindleberger (1969) argued that imperfection exist in the absence of perfect
competition condition, to him if there is perfect competition the domestic firms
would have advantage against the foreign firm because of the closeness of their
decision making centres to their operation. Therefore, foreign market operation could
not survive, so there has to be market imperfection in terms of goods and services for
the FDI to flourish.
However, this theory highlight the comparative advantages of foreign firms
over local firms, in which firms that characterized with economies scale, superior in
technology, or high marketing skills will have advantage on others by producing at
lower cost and then dominate the market. Therefore, FDI take place because of the
product and imperfection of the market. Unfortunately, this approach emphasized the
centralization of capital in the hands of few individual because the theory advances
32
the emergence of monopoly power in the foreign markets. Therefore, FDI is made by
firms that possessing technical power.
2.6.3 Eclectic Theory
Dunning (1980) present a unified theory of MNCs as Eclectic Theory or Ownership,
Location and Internalization Advantage Theory (OLI) in 1980 and it is the most
widely accepted theory of FDI. He suggests that firms have three advantages as;
ownership (specific) advantage, location advantage and internalization advantage.
Therefore, decision of FDI depends on the combination of three factors. These three
factors of Eclectic Theory each has an important in investment with the regard to the
decisions of MNCs (Williams 1997). Therefore, this comprises the following
advantages as:
Ownership specific advantages are basically the immediate assets that firm
have privilege to access. According to Dunning "any kind of income generating
assets which make it possible for firms to engage in foreign production" Ownership
advantage address the reasons why some firms move abroad due to facts that a
successful MNCs have specific advantages that allowed it to operate and then to
overcome the operating costs in the foreign countries. Advantages include copyright,
trademarks, patent right, trade secrete also it comprise market control, superiority
marketing skills, information and technology, entrepreneurship skills and economies
of scale. Similarly, location advantages relate to both source country of MNCs and
host country for which to invest. It allowed the foreign firm to locate its firm in the
foreign market where it will gain the influence by country’s locational advantages
such as government policies, institutional arrangements, and political, legal, and
cultural environment. Moreover, Dunning (1988) explained the reason for MNCs
33
chooses to operate in a specific home country for direct investment. While in the
internalization advantages the firm that inherent capacity and flexibility to produce
and market via its internal subsidiaries and theory originated from the market failure.
There are three reasons for internalization. Firstly, risk and uncertainty, emanating
from risk management process firm internalizing risk. Secondly, firm in an imperfect
market with economies of scale. Thirdly, absence of transaction pricing externalities
in the market (Williams, 1997).
Moreover, the works of Corner (1991), Wernerfelt, (1995), Sethi and
Guisinger (2002) all their arguments are consisted with Dunning Eclectic Theory and
argued that Dunning Eclectic Theory in the combines theories such as location
advantages of Vernon (1966), Ownership advantages of Hymer (1976) and
internalization advantages of Buckley and Casson (1998).
2.6.4 Product Life Cycle Advantage
This theory was developed by Vernon (1966), Vernon developed trade and FDI
theory of product life cycle as a gradual process of a sequential development use by
MNC to perforate into foreign markets. He asserted that decision to invest is a
decision between exporting and investing as a product move in a gradual process via
life cycle which gives a cost based reason to move from exporting to investing (i.e.
FDI). According to Vernon, the first stage is the new product base which firm
produce by skilled labour at a relative high cost. Therefore, investors enjoy
monopoly power. The second stage according to Vernon is the phase of mature
product in which certain level of standardization is achieved, demand for a product
increases as the production knowledge spread and becomes large-scale. Barriers to

34
entry remain the source of market power. The last stage is the standardised product
stage where the product become highly standardized, the process of production
become common and price is the main factor of determining the competitive
outcome.
Vernon, (1979) tested empirically the dispersal of innovations from firms in
America. The finding is consistent with the product life cycle hypothesis.
Technology is first transferred to the countries in which their per capita income is
high and extensive manufacturing industries. Moreover, barriers to trade really
accelerate transfer of technology to host countries, while restrictions on FDI slow
them down due to screening. Davidson (1980) observationally test the dispersal of
innovations from U.S. firms and their results are consistently in line with product life
cycle theory.
Contrarily, Vernon (1979) himself recognizes the weakness of his model as it
loses predictive power of firm in terms of the condition of trade. Hirsch (1976) for
instance, investigated the circumstances that may influenced firm decisions in
deciding whether to engage using FDI or export for serving foreign markets where
Hirsch in his model takes the cognisance of managing costs of producing abroad. In
addition, Dunning (1979, 2000) used the analysis of Hymer (1976) put an existing
element in a unified framework in a coherent manner. Dunning proposed three
conditions before firm engaged in FDI rather than the export as ownership, location
and internalization advantages and these constituted the basic condition of Eclectic
Theory.
35
2.6.5 Gravity Model Approach
The gravity model has been used for decades in international trade, its origin date
back to 1687 which was based on the universal law of gravitation in Physics that
developed by Isaac Newton in 1687 and its applicability in the field of international
trade also date back to 1962. The popularity of the model in terms of modelling has
been over the years and it is commonly applied in the today’s modelling trade flows
in international economies. The law explain the force that exists between the two
masses regarding the distance that lies among them Newton (1687).
, the
gravitational force is the percentage to the product of the two masses Mi and Mj
which are inversely proportional to the square distance dij that holds the masses apart
from each other. G is the gravitational constant is an empirically determined value.
International economics modifies the universal law of gravitation to suit applicability
into economic context.
Furthermore, assuming that the trade volume exist between two economics
say i and j is Yij therefore economic masses is defined as
. This simplified the
version of gravity equation into the context of international trade. However, Yij
consider as the export volume from country i to j whereby the economical masses are
heavily represented by each country’s GDP and geographical distance between the
two economies is regarded as distance (Head 2003). Gravity has been widely used by
many scholars in the field of international trade and FDI due its extraordinary high
goodness of the fit which account for empirical success (Mccallum, 1995; Anderson
2011). A relatively adaptation of gravity equations has a diverse scope of flow
modelling and it accounts for the reason why researchers often use gravity equations
in their analyses most especially in relation to FDI like in work of Linden and

36
Ledyaeva (2006), Rahman (2006), Paniagua (2011), Anderson (2011), Bellos (2011),
Subasat and Bellos (2013) and Salvatici (2013). Deardorff (1998) argued that gravity
model has been considered as a “fact of life” in the field of research. Equally, there
are several methods used for estimation under gravity theory among which is
Ordinary Least Square (OLS). OLS is normally used to estimate the parameters of
the gravitational relationship among the variables. In the original version of the
equation by Tinbergen (1962), the model was expressed in the form of log to
measure the elasticity of the parameters of the trade flows with the respect to
explanatory variables.
2.7 THEORETICAL REVIEW ON DETERMINANTS OF FOREIGN
DIRECT INVESTMENT
There has been several literatures discussed on the determinants of FDI but
ambiguously there is no consensus among the factors that explained the determinants
of FDI are limited. Few scholars have presumed that abundant of natural resources,
market size, cheap labour cost, developed infrastructures, and nearest of the host
country to the source are the critical variables that influenced FDI inflows decision.
Different researchers are of the view that fiscal policy, trade openness, inflation,
political stability are also the important factors that influenced FDI inflows.
However, the variables identified as the determinants of FDI inflows vary from one
study to another and from one economy to other. Therefore, it is very difficult to
compile a single list as determinants of FDI inflows because some of the variables in
the literature reviewed gained or lost important over time. However, following are
the theoretical and empirical literatures of the determinants of FDI

37
The theoretical literature on the determinants of FDI can be traced from the
doctoral dissertation Hymer (1976) which was followed by Dunning and Rugman
(1985). Dunning (1980, 1988) where they provides a comprehensive analytical
framework for the determinants of FDI as Ownership, Location and Internalization.
He examines the driver of FDI as market size, labour cost as well as location
advantages. Moreover, gravity model theory also offers greater theoretical
contributions in the determinants of FDI where he considers market size and
geographical distance as the major components. Several researches like Onyeiwu and
Shrestha (2004), Bartels Kratzsch and Eiccher (2008), Suliman and Mollick (2009),
Anyanwu (2011), Sichei and Kinyondo (2012), Asiedu (2013), Rogmans and Ebbers
(2013) and Yusuf et al. (2013) identified other factors as theoretical dominants of
FDI such as market size, trade openness, infrastructure, economic stability,
corruption level, labour productivity, economic freedom and government
effectiveness.
2.7.1 Market Size
The argument about market size as the determinant of FDI is straight forward due to
the facts that the purpose of the most of the foreign firms is to get markets for their
products. Market size represents the potential domestic demand of goods and
services and economic conditions of the domestic country which is critical for FDI.
GDP per capita, real GDP and real GDP growth are used as a proxy for measuring
market size and it is expected to have a direct association with FDI (Alemu, 2012).
38
2.7.2 Trade Openness
The degree of openness to trade with other countries is considered as key element of
attracting more FDI into the domestic country. Therefore, countries with restrictive
trade policies and resources control tends to attract less FDI. Sum of export and
import as ratio of GDP, trade as ratio of GDP or percentage of GDP are used as a
proxy of openness and it is expected to have a direct relationship with FDI. Most of
the studies in the developing economies openness exhibits positive relation with FDI
(Morisset 2000).
2.7.3 Infrastructure
This is considered as the bedrock of attracting FDI by the domestic country. In
particular, telecommunications influences FDI which it increases economic growth
Canning and Bennathan (2000). Infrastructure is expected to contribute to FDI
directly. It is peroxided by telecommunications, military expenditure, water,
transportation and electricity (Sichei & Kinyondo, 2012).
2.7.4 Macroeconomic Stability
Countries that have favourable and conducive economic environment tend to attract
more FDI than a volatile economy. Inflation rates, exchange rates and interest were
used to proxy or measure economic stability. For instance, inflation increases cost of
production/user cost of production thereby affecting the profitability of FDI negative
(DE Mello, 1997).
39
2.7.5 Corruption Level
Corruption level in the targeted country usually influences the decisions to invest in
the domestic country by foreign investors, because corruption impedes profitability
of any investment thereby discouraging the investors. The following measures are
usually used as a proxy while measuring corruption level of a particular economy
such as CPI (Transparency International), control of corruption indicator (Worldwide
Governance Indicator) and Freedom from Corruption (Heritage Foundation & World
Street).
2.7.6 Labour
The argument between labour and FDI is straightforward, before deciding whether to
undertake or to invest MNCs would consider the labour availability in the domestic
country. The more productive, the more abundant and costless labour is, the more
that location would attract more FDI. Therefore, labour availability is another
important factor that determines the level of FDI inflows. However, Labour is
expected to have positive association with FDI (Mathur Singh, 2013). Therefore, a
country with higher labour productivity tends to attract more FDI.
2.7.7 Economic Freedom
This is an estimate by the Heritage Foundation and the Wall Street Journal since
1995 usually used to measure economic freedom in the studied area (i.e. to measure
investment climate in the area of interest by the researcher) and it can be defined as
“the fundamental right of every human to control his or her own labour and
property”. In an economically free society, individuals are free to work, produce,
consume, and invest in any way they please, with that freedom both protected by the
40
state and unconstrained by the state” (www.heritage.org). The index is usually
measured by using ten economic freedom components like trade freedom, labour
freedom, fiscal freedom, business freedom, monetary freedom, financial freedom,
investment freedom, property right and government spending. The index is based on
the scale from 0 to 100, where zero index mean less freedom and 100 maximum
freedom and it is expected that more freedom high investment. Therefore, by
restricting economic freedom means less competition and then it discourage FDI.
2.7.8 Government Effectiveness
Government effectiveness in the targeted country usually influenced the decisions
taking by foreign investors where they should consider the decisions taking by the
government in the targeted economy that may influenced their activities. Therefore,
efficient government is likely to attract more FDI inflows. However, “effectiveness
captures perceptions of the quality of public services, the quality of the civil service
and the degree of its independence from political pressures, the quality of policy
formulation and implementation, and the credibility of the government's commitment
to such policies” (WGI, 2014). This is normally used as a proxy of quality of
regulatory environment and it is expect to have a positive sign.
2.8 EMPIRICAL REVIEW ON DETERMINANTS OF FOREIGN DIRECT
INVESTMENT
In addition to the above discussion, the following is the empirical literature on the
determinants of FDI inflows. Sichei and Kinyondo (2012) conducted a research on
the determinants of FDI inflows using panel data of about 45 African countries, they
found that the African wide environment have been conducive and favourable for to
41
FDI inflows since 2000. They consider agglomeration economies, real GDP growth,
natural resources as also the determinants of FDI to Africa.
Asiedu (2005, 2006) used panel data regression to examine the role of market
size, natural resources, government policies, institutions, and political instability to
determine FDI in African countries. The author uses fixed data model on a panel data
of 22 SSA and the results shows that market size, natural resources stock and quality
of infrastructures are the most important variables in determining foreign investment
to African markets. However, Onyeiwu (2004) conducted an empirical study for 29
African countries between the period 1975-1999 which assessed the factors that
invariably and significantly affecting the MNCs decisions about the FDI inflows to
SSA and its determinants. The result provides that availability of natural resources,
openness, and low rate of inflation, economic growth and reserve found to be
significant for FDI inflows in Africa.
Naude and Krugell (2007) conducted an investigation on whether
geographical distance and institutions play role in determining FDI inflows to Africa
using cross-country econometrics approach and dynamic one step generalize method
of moment (GMM). The findings indicated that geographical factors do not have a
direct influence on FDI inflows to Africa because to the author re-exporting motives
will dominate while suggesting different specifications are significant with different
policy instruments which support the importance of best polices made by good
institutions. Frank and Bartels (2008) investigates location decisions and
determinants of FDI inflows in SSA the result of the findings show that energy
endowment has inversely influenced FDI inflows to SSA while GDP per capita and
fuel prices have a direct influence over the FDI inflows.
42
Moreover, Okurut et al. (2012) they conducted a study over the determinants
of FDI inflows into Economic Community of West Africa States (ECOWAS) using
panel data and dynamic OLS model for the member countries which covers the
periods between 1975-2007. They also consider development in financial sector,
investment returns, openness and infrastructures as key players in determining FDI
inflows into ECOWAS member countries. The result suggests that the variables have
a positive and significant influence over the FDI inflows and they concludes that in
general most investors of FDI inflow in ECOWAS countries are natural resources
seeking investors. However, this result is applicable to the area investigation as the
panel data normally captured the individual characteristics of the variable under
study as most of West African countries have been endowed with abundant natural
resources like Ghana, Nigeria, Sierra Leone and among others. Therefore,
availability of natural resources is considered the major determinant of FDI inflows
and the result is in line with area of the study.
Rogmans and Ebbers (2013) aimed to test the appropriate determinants of
FDI inflows in some regions in Africa using “Dutch diseases” concept. Base on their
analysis they found that FDI inflows was impeded by the abundance of energy
endowment while GDP per capita, and trade openness are encouraging FDI inflows
to Africa and environment risk management are not differentiating factor from
between countries in the region.
In contrast, this result is contrary to the results of Okurut et al. (2012) and
Asiedu (2006). Dutch disease concept as an evident that shows the relationship
between the increment in the financial development of natural resources and a
decrease in the manufacturing sector cannot capture the specific characteristics of the
economies unlike panel data. Therefore, Dutch disease is an inappropriate method
43
adopted for this investigation. There are extensive literatures both theoretical and
empirical that identified the impact of FDI on economic growth and development of
any economy either negatively or positively (Asiedu & Lien 2011).
Umoh, Jacob and Chuku (2012) conducted an empirical study about the
relationship between economic growth and FDI in Nigeria in the period of 1970-
2008. They employed simultaneous equation model to integrate on whether there is
any feedback relationship among economic growth and FDI in Nigeria. Therefore,
the result indicates that FDI and economic are determined jointly in Nigeria and the
feedback is positive form growth to FDI and from growth to FDI. Authors suggest
that as a policy implication there is the need to pursue and reinforce policies that will
attract more foreign investment to the economy like greater openness of the economy
and to more private participation. Contrarily, this method of estimation was
inappropriate in measuring the impact of economic growth on FDI inflows or FDI
inflows on economic growth and to make generalisation about the results. However,
Granger causality is more applicable in this kind of situation because one has to
know that is that an impact goes from economic growth to FDI or from FDI to
economic growth (Gujarati, 2009).
Moreover, the result of Nurudeen, Wafure and Abdullah (2010) is more
robustness and reliable because the authors employed Granger causality as well as
Johansen co-integration methods to investigate the causal relationship and direction
among the variables. They result found that there is co-integration among the
variables and the granger causality is unidirectional and it is running from FDI to
economic growth. Onakoya (2012) analysed the impact of FDI on Nigeria’s
economic growth, the research come up with a macroeconomic structural equation
comprising four blocks which consist of private demand, supply, external sector and
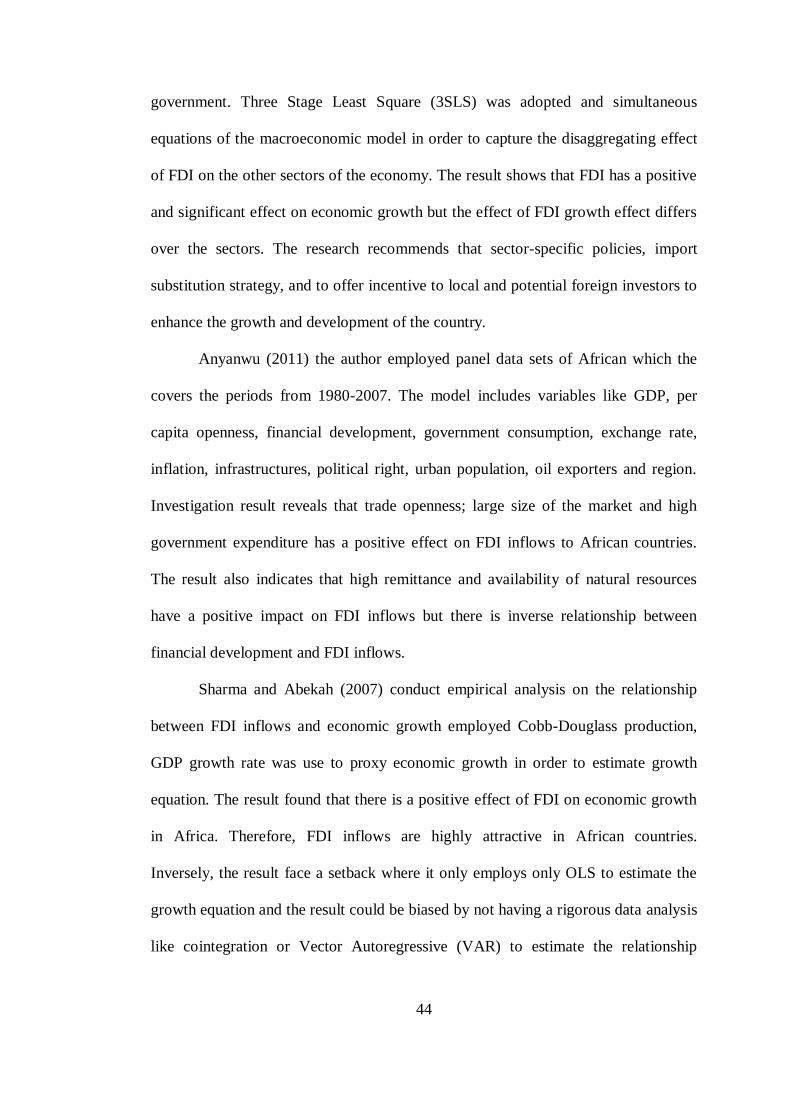
44
government. Three Stage Least Square (3SLS) was adopted and simultaneous
equations of the macroeconomic model in order to capture the disaggregating effect
of FDI on the other sectors of the economy. The result shows that FDI has a positive
and significant effect on economic growth but the effect of FDI growth effect differs
over the sectors. The research recommends that sector-specific policies, import
substitution strategy, and to offer incentive to local and potential foreign investors to
enhance the growth and development of the country.
Anyanwu (2011) the author employed panel data sets of African which the
covers the periods from 1980-2007. The model includes variables like GDP, per
capita openness, financial development, government consumption, exchange rate,
inflation, infrastructures, political right, urban population, oil exporters and region.
Investigation result reveals that trade openness; large size of the market and high
government expenditure has a positive effect on FDI inflows to African countries.
The result also indicates that high remittance and availability of natural resources
have a positive impact on FDI inflows but there is inverse relationship between
financial development and FDI inflows.
Sharma and Abekah (2007) conduct empirical analysis on the relationship
between FDI inflows and economic growth employed Cobb-Douglass production,
GDP growth rate was use to proxy economic growth in order to estimate growth
equation. The result found that there is a positive effect of FDI on economic growth
in Africa. Therefore, FDI inflows are highly attractive in African countries.
Inversely, the result face a setback where it only employs only OLS to estimate the
growth equation and the result could be biased by not having a rigorous data analysis
like cointegration or Vector Autoregressive (VAR) to estimate the relationship

45
because OLS cannot solely depends on and make generalization about the entire
results.
Michalowski (2012) the research examines the impact of FDI inflows in SSA
and its effect on economic growth. The paper found that there is a mixed result
regarding the impact of FDI inflows on economic growth into SSA because most of
the activities of FDI are taking place in the mining sector in relation to the other
sectors of the economy where backward and forward linkages are limited. Therefore,
SSA countries should focus their decision in adopting wise development strategies.
That is, it is not only to attract or encourage FDI inflows but also to reduce barriers
to FDI effectiveness. The author adopts meta-analysis approach in the study and one
of the potential pitfalls of this kind analysis is the reliance of the availability of the
published studies which might create biased about the result. However in meta-
analysis the author may include materials that are irrelevant, bad studies may be
included, summarised data might not be homogeneous, including several causal
factors that lead to meaningless estimated effects and finally the overall result to
become biased.
Hassen and Anis (2012) investigates the relationship among FDI inflows and
host country economic growth. The research covers the periods from 1975-2009 and
utilizes modern time series analysis of stationarity, co-integration and Error
Correction Models (ECM) which includes the variables as FDI, GDP, openness,
human capital, and financial development.
The empirical finding reveals that there is significance relationship between
FDI inflows and home country economic growth and the result of Hassen and Anis
(2012) suggest that FDI inflows could help to boost the process of long term
economic growth. This result however, in reliable and appropriate to make an

46
inference about growth process in terms of short run and long run because the result
first test for stationary of the variable as in the case of testing Johansen co-
integration, variables must be stationary at the same level otherwise the result could
be inappropriate.
Azman-Saini, Baharumshah and Law (2010) make their study on the
systematic linkages between FDI, economic freedom, and economic growth by using
the panel data sets of 85 countries. The research utilizes the Generalized Method of
Moment (GMM) system estimator. The empirical result indicates that FDI itself does
not have positive impact on output growth but there is a contingency effect on the
level of economic freedom in the home country. Therefore, countries encourage and
promote freedom of economic activities which will result in gaining the significance
from the MNCs. Notwithstanding, this result is more consistent and robust because
employing GMM provides a general framework of statistical inference which
encompasses many estimators while conducting econometric analysis of a data.
Finally, determinants of the FDI inflows to Africa differ from one economy
to other and from one period to another depending on the situation and the objective
of the research. Thus, it is impossible to generate a unified list of these determinants
and anticipated to be applicable to each and every country in the region. In addition
to this, in accordance with the theoretical literature and economic point of view
variables such as market size, GDP growth, openness, levels of infrastructures,
human capital, population growth, and inflation in all can said to be accepted and
considered as important determinants of FDI inflows to any country in Africa. But
there are some variable this study will employ. Moreover, it is recognizes that FDI
inflows helps in boosting economic growth and also brings flourishing to the host
economies. This is the essential motivation behind the reason why developing
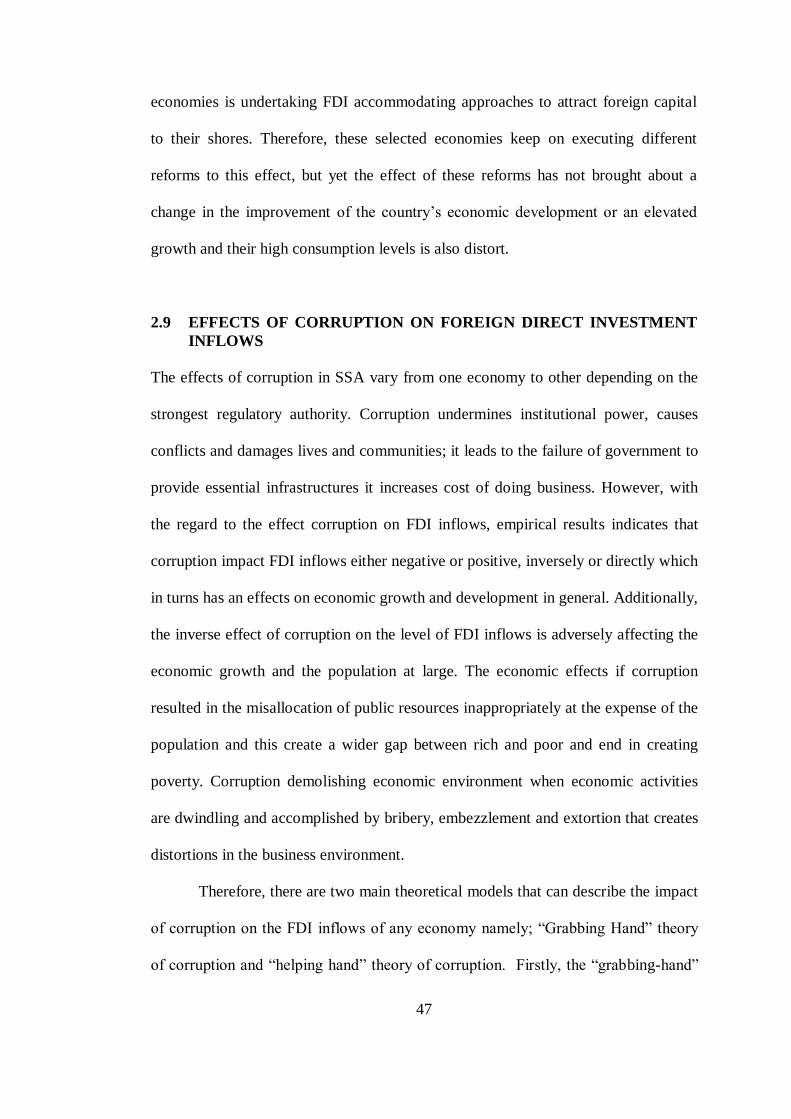
47
economies is undertaking FDI accommodating approaches to attract foreign capital
to their shores. Therefore, these selected economies keep on executing different
reforms to this effect, but yet the effect of these reforms has not brought about a
change in the improvement of the country’s economic development or an elevated
growth and their high consumption levels is also distort.
2.9 EFFECTS OF CORRUPTION ON FOREIGN DIRECT INVESTMENT
INFLOWS
The effects of corruption in SSA vary from one economy to other depending on the
strongest regulatory authority. Corruption undermines institutional power, causes
conflicts and damages lives and communities; it leads to the failure of government to
provide essential infrastructures it increases cost of doing business. However, with
the regard to the effect corruption on FDI inflows, empirical results indicates that
corruption impact FDI inflows either negative or positive, inversely or directly which
in turns has an effects on economic growth and development in general. Additionally,
the inverse effect of corruption on the level of FDI inflows is adversely affecting the
economic growth and the population at large. The economic effects if corruption
resulted in the misallocation of public resources inappropriately at the expense of the
population and this create a wider gap between rich and poor and end in creating
poverty. Corruption demolishing economic environment when economic activities
are dwindling and accomplished by bribery, embezzlement and extortion that creates
distortions in the business environment.
Therefore, there are two main theoretical models that can describe the impact
of corruption on the FDI inflows of any economy namely; “Grabbing Hand” theory
of corruption and “helping hand” theory of corruption. Firstly, the “grabbing-hand”
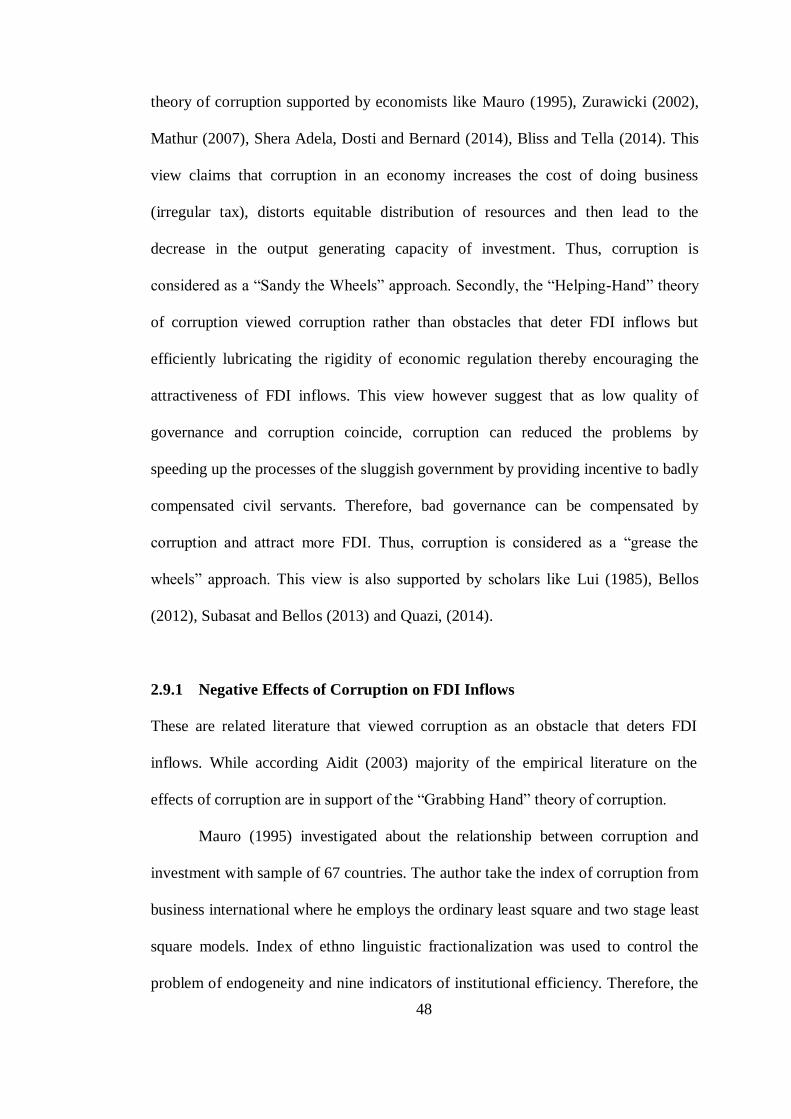
48
theory of corruption supported by economists like Mauro (1995), Zurawicki (2002),
Mathur (2007), Shera Adela, Dosti and Bernard (2014), Bliss and Tella (2014). This
view claims that corruption in an economy increases the cost of doing business
(irregular tax), distorts equitable distribution of resources and then lead to the
decrease in the output generating capacity of investment. Thus, corruption is
considered as a “Sandy the Wheels” approach. Secondly, the “Helping-Hand” theory
of corruption viewed corruption rather than obstacles that deter FDI inflows but
efficiently lubricating the rigidity of economic regulation thereby encouraging the
attractiveness of FDI inflows. This view however suggest that as low quality of
governance and corruption coincide, corruption can reduced the problems by
speeding up the processes of the sluggish government by providing incentive to badly
compensated civil servants. Therefore, bad governance can be compensated by
corruption and attract more FDI. Thus, corruption is considered as a “grease the
wheels” approach. This view is also supported by scholars like Lui (1985), Bellos
(2012), Subasat and Bellos (2013) and Quazi, (2014).
2.9.1 Negative Effects of Corruption on FDI Inflows
These are related literature that viewed corruption as an obstacle that deters FDI
inflows. While according Aidit (2003) majority of the empirical literature on the
effects of corruption are in support of the “Grabbing Hand” theory of corruption.
Mauro (1995) investigated about the relationship between corruption and
investment with sample of 67 countries. The author take the index of corruption from
business international where he employs the ordinary least square and two stage least
square models. Index of ethno linguistic fractionalization was used to control the
problem of endogeneity and nine indicators of institutional efficiency. Therefore, the
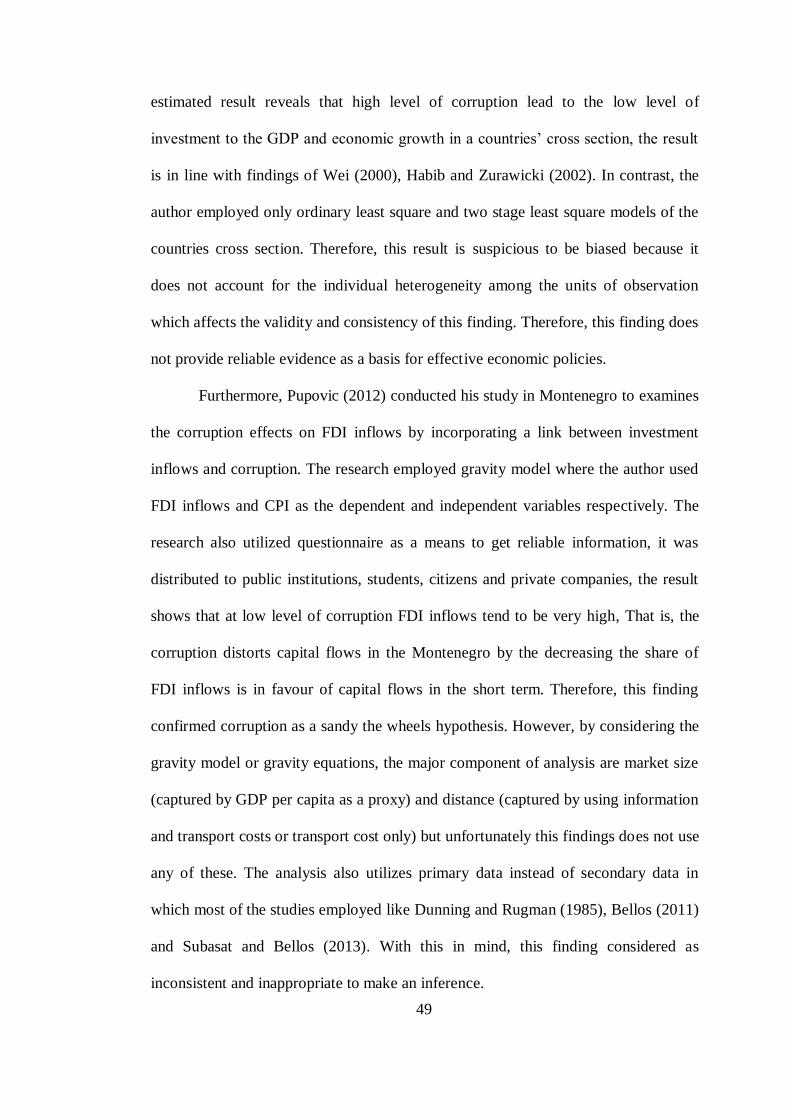
49
estimated result reveals that high level of corruption lead to the low level of
investment to the GDP and economic growth in a countries’ cross section, the result
is in line with findings of Wei (2000), Habib and Zurawicki (2002). In contrast, the
author employed only ordinary least square and two stage least square models of the
countries cross section. Therefore, this result is suspicious to be biased because it
does not account for the individual heterogeneity among the units of observation
which affects the validity and consistency of this finding. Therefore, this finding does
not provide reliable evidence as a basis for effective economic policies.
Furthermore, Pupovic (2012) conducted his study in Montenegro to examines
the corruption effects on FDI inflows by incorporating a link between investment
inflows and corruption. The research employed gravity model where the author used
FDI inflows and CPI as the dependent and independent variables respectively. The
research also utilized questionnaire as a means to get reliable information, it was
distributed to public institutions, students, citizens and private companies, the result
shows that at low level of corruption FDI inflows tend to be very high, That is, the
corruption distorts capital flows in the Montenegro by the decreasing the share of
FDI inflows is in favour of capital flows in the short term. Therefore, this finding
confirmed corruption as a sandy the wheels hypothesis. However, by considering the
gravity model or gravity equations, the major component of analysis are market size
(captured by GDP per capita as a proxy) and distance (captured by using information
and transport costs or transport cost only) but unfortunately this findings does not use
any of these. The analysis also utilizes primary data instead of secondary data in
which most of the studies employed like Dunning and Rugman (1985), Bellos (2011)
and Subasat and Bellos (2013). With this in mind, this finding considered as
inconsistent and inappropriate to make an inference.

50
Porters (2010) investigated the relationship between corruption and FDI
inflows by the panel data of countries between the periods 1995 to 2007. Corruption
perception index was used as a proxy of corruption level, variables like GDP, trade
openness (percentage of GDP), human capita and inflation rate are all employed in
the analysis to measure whether the relationship exist. The results indicate that there
is negative and significant impact of corruption upon FDI inflows. This means that
with the less corruption level FDI inflow tend to be more attractive. Invariably, this
study is suspected due to consideration of the variables included in the model where
the authors silence about the control variables which also has an influence about the
result and in addition, apart from CPI there are other indices that can use to measure
the effects corruption which will make the findings to be more reliable and
consistent.
Furthermore, Alemu (2013) conducted an investigation of 16 Asian
economies from the period 1995 to 2009 to verified an insight about the effects of
corruption on FDI inflows in the sample area of study. The author argued that one per
cent increase in the corruption level will stimulate a decrease in FDI inflows by 9.1
per cent. Therefore, despite the high level of corruption in these sampled economies,
corruption does facilitate FDI inflows and make it to be more attractive because in
most cases regulatory authorities in developing economies are considered to be weak
when carrying their activities. In contrast, the study has some kinds of limitations: in
terms of measuring corruption level and its effects on FDI inflows there are other
variables that may influence this result, variables like natural resources, inflation, and
population. The author supposed to use other indices of corruption perception for the
validity and consistency of his findings.
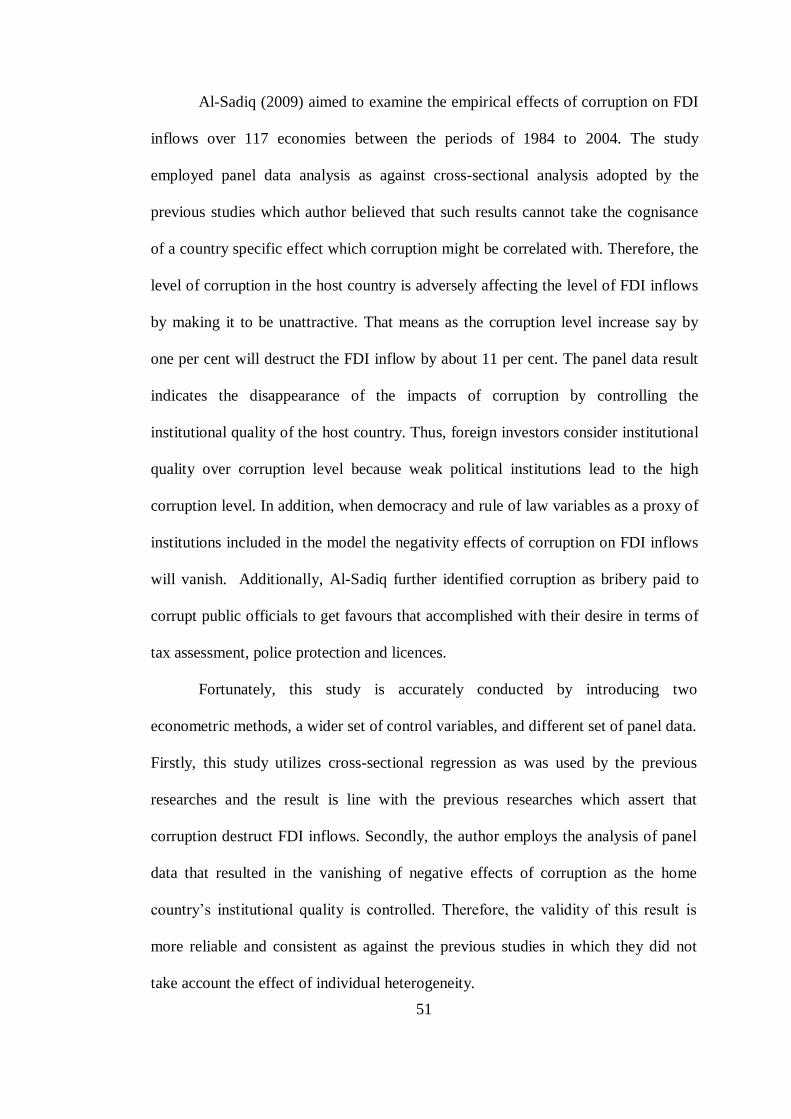
51
Al-Sadiq (2009) aimed to examine the empirical effects of corruption on FDI
inflows over 117 economies between the periods of 1984 to 2004. The study
employed panel data analysis as against cross-sectional analysis adopted by the
previous studies which author believed that such results cannot take the cognisance
of a country specific effect which corruption might be correlated with. Therefore, the
level of corruption in the host country is adversely affecting the level of FDI inflows
by making it to be unattractive. That means as the corruption level increase say by
one per cent will destruct the FDI inflow by about 11 per cent. The panel data result
indicates the disappearance of the impacts of corruption by controlling the
institutional quality of the host country. Thus, foreign investors consider institutional
quality over corruption level because weak political institutions lead to the high
corruption level. In addition, when democracy and rule of law variables as a proxy of
institutions included in the model the negativity effects of corruption on FDI inflows
will vanish. Additionally, Al-Sadiq further identified corruption as bribery paid to
corrupt public officials to get favours that accomplished with their desire in terms of
tax assessment, police protection and licences.
Fortunately, this study is accurately conducted by introducing two
econometric methods, a wider set of control variables, and different set of panel data.
Firstly, this study utilizes cross-sectional regression as was used by the previous
researches and the result is line with the previous researches which assert that
corruption destruct FDI inflows. Secondly, the author employs the analysis of panel
data that resulted in the vanishing of negative effects of corruption as the home
country’s institutional quality is controlled. Therefore, the validity of this result is
more reliable and consistent as against the previous studies in which they did not
take account the effect of individual heterogeneity.

52
Khamfula (2007) conducted a study on the role of corruption in terms of FDI
inflows and economic growth in the export promotion and import substitution
countries sand the study recognize the Bhagwati’s framework. The study employed
simultaneous equation, fixed effect model for the analysis of 17 countries between
the periods from 1994 to 2004. The result found shows that the corruption is more
dangerous in attracting FDI inflows in import substitution economies than that of
export promotion economies. This finding also reveals that as corruption level is
elevated it results a negative and significant effects on FDI inflows in both import
substitution and export promotion economies. But the result changed as the
corruption is interacted with the domestic investment which shows significant and
positive effects only for import substitution countries. Fortunately, this finding is
more accurate and sound, the result is robust as rigorously analysed by economic
tools of fixed effect regression as well as simultaneous equation models and result is
in line with the previous study of sandy the wheels corruption. But the shortcomings
of this study it does not tested the impact of corruption on FDI flows with the other
corruption perceived indices a part from CPI.
Habib and Zurawicki (2002) examines the effect of corruption on FDI
inflows by considering 89 sample countries and two different methods employed in
the analysis namely; OLS regression and PROBIT models. The data includes
variables as FDI, CPI, GDP, labour, political stability and export. Corruption in the
host countries distorts FDI inflows as foreign investors shun corruption because as
morally wrong which create operational inefficiencies. Therefore, there is negative
effect of corruption over the FDI inflows in the sample countries. However, they
picked OLS due to their use in terms of continuous variables, for example FDI and
perceived corruption index and the perfect difference in corruption measured by

53
absolute difference in corruption perception index. The study believed that there is
still an issue with the measuring of corruption due to the characteristics of
corruption; however corruption perception index is still a standout amongst the most
generally utilized estimation of corruption by researchers in general. In other words,
PROBIT was utilized to clarify the contrast between the home economy’s share of
the world FDI inflows and the economy’s share of the specific host economy’s FDI
inflows. The findings of this study are appropriate and consistent with contention that
corruption is a genuine hindrance for investment; both at the levels of corruption in
the home economy and host country have an inverse significant effect on foreign
direct investment.
However, Umur (2014) investigated the empirical result on the causal effects
among corruption, political risk and industrial production index as a proxy to GDP,
the study cover the periods from 1992 to 2010. The approach of Shin and Smith
(2001) bound co-integration and error correction models as well as Pesaran means
was employed. The result shows that corruption distorts FDI inflows in the sample
country both in the long run and short run periods. Thus, there is negative
relationship between FDI inflows and corruption in Turkey. In addition, increase in
the political risk contributes a lot to the reduction of FDI inflows in the short run
which is contrary to their expectations. Contrarily, the result of this study is
suspicious base on the following shortcomings; (a) the study employed time series
data which has only nine years observations, where in time series analysis the
minimum number of observations should at least not be less than 30 observations
(Gujarati 2009), (b) the best way to obtain a sound and reliable result is by
employing panel data model and this result is not consistent with that of (Bellos and
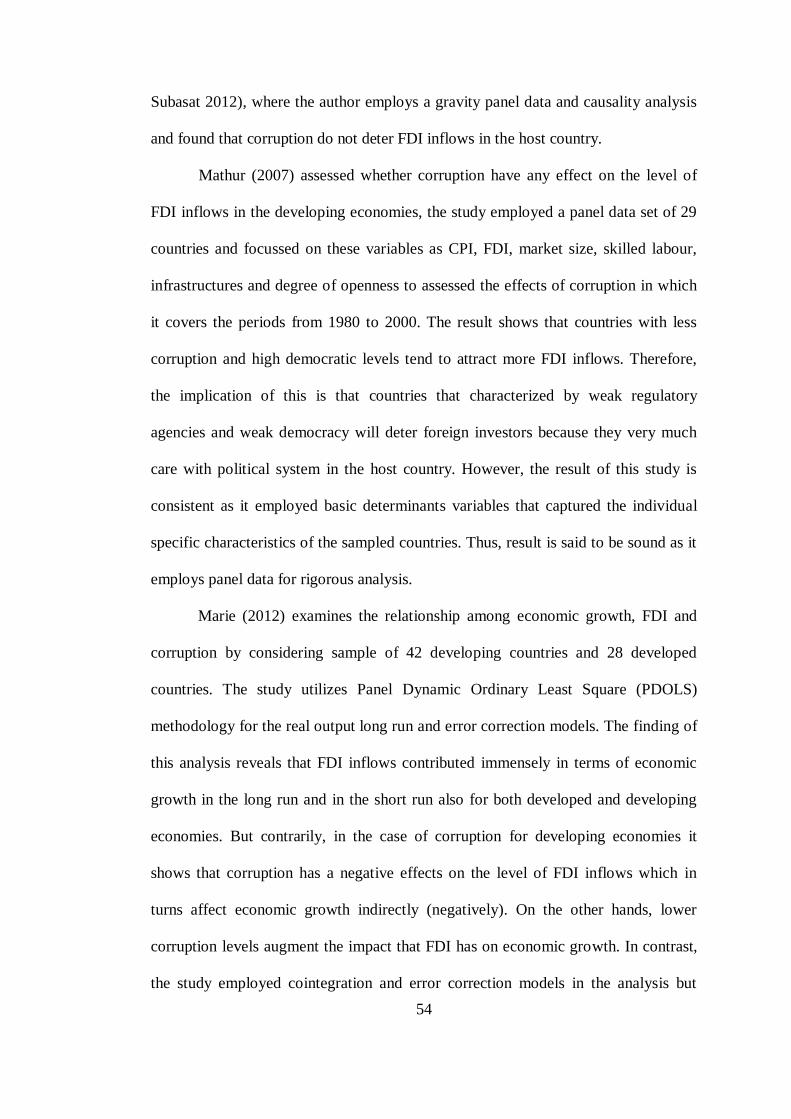
54
Subasat 2012), where the author employs a gravity panel data and causality analysis
and found that corruption do not deter FDI inflows in the host country.
Mathur (2007) assessed whether corruption have any effect on the level of
FDI inflows in the developing economies, the study employed a panel data set of 29
countries and focussed on these variables as CPI, FDI, market size, skilled labour,
infrastructures and degree of openness to assessed the effects of corruption in which
it covers the periods from 1980 to 2000. The result shows that countries with less
corruption and high democratic levels tend to attract more FDI inflows. Therefore,
the implication of this is that countries that characterized by weak regulatory
agencies and weak democracy will deter foreign investors because they very much
care with political system in the host country. However, the result of this study is
consistent as it employed basic determinants variables that captured the individual
specific characteristics of the sampled countries. Thus, result is said to be sound as it
employs panel data for rigorous analysis.
Marie (2012) examines the relationship among economic growth, FDI and
corruption by considering sample of 42 developing countries and 28 developed
countries. The study utilizes Panel Dynamic Ordinary Least Square (PDOLS)
methodology for the real output long run and error correction models. The finding of
this analysis reveals that FDI inflows contributed immensely in terms of economic
growth in the long run and in the short run also for both developed and developing
economies. But contrarily, in the case of corruption for developing economies it
shows that corruption has a negative effects on the level of FDI inflows which in
turns affect economic growth indirectly (negatively). On the other hands, lower
corruption levels augment the impact that FDI has on economic growth. In contrast,
the study employed cointegration and error correction models in the analysis but

55
these methods are inappropriate while measuring relationship like this due to fact
that these models does not consider the cognisance influence of individuals specific
effect. Therefore, the result is suspicious.
Notwithstanding, Kusum (2005) conducted analysis on the effects of
corruption upon FDI inflows and tax revenues in the 54 developing and developed
economies. The finding shows that a one point marginal improvement in the levels of
corruption would generate at least additional FDI inflows of about 0.5 per cent out of
GDP. This shows as the country becomes more corrupt it will discourage the
attractiveness of the FDI inflows into that country. Lastly, the result shows the
advantage of FDI inflows in the economy which will lead to generate additional
revenue through taxation. However, based on the models construction, the author
does not differentiate which models is employed, whether it is time series or cross
section or panel data. Secondly, the study utilizes only OLS in measuring the
relationship between variables and this make the result to be biased. Because model
like co-integration or panel data are appropriate methods in measuring relationship
among these variables.
A study conducted by Hossain, Peters and Keep (2012) on the empirical
relationship between corruption and FDI inflows by introducing moderator of
bilateral tax treaties to describe the impact of corruption in the level of country’s
FDI inflows. That is, this paper includes corruption and tax treaties to explain the
inward FDI levels of an economy. The study employed cross sectional data in the
analysis and the result indicates that there is a statistical and significant moderating
effect of bilateral tax treaties on the country’s corruption level in determining the
level of FDI inflows. This means there is negative effects of corruption on FDI
inflows which would deter FDI inflows. The result further indicates that the rule of
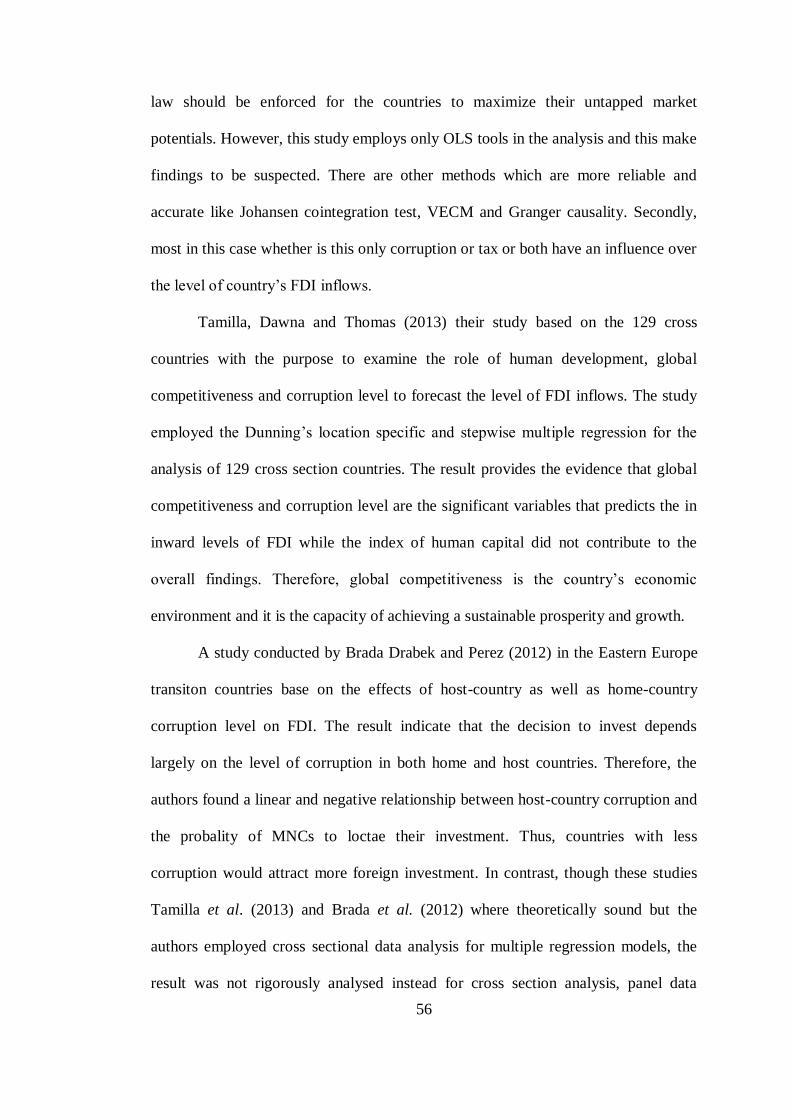
56
law should be enforced for the countries to maximize their untapped market
potentials. However, this study employs only OLS tools in the analysis and this make
findings to be suspected. There are other methods which are more reliable and
accurate like Johansen cointegration test, VECM and Granger causality. Secondly,
most in this case whether is this only corruption or tax or both have an influence over
the level of country’s FDI inflows.
Tamilla, Dawna and Thomas (2013) their study based on the 129 cross
countries with the purpose to examine the role of human development, global
competitiveness and corruption level to forecast the level of FDI inflows. The study
employed the Dunning’s location specific and stepwise multiple regression for the
analysis of 129 cross section countries. The result provides the evidence that global
competitiveness and corruption level are the significant variables that predicts the in
inward levels of FDI while the index of human capital did not contribute to the
overall findings. Therefore, global competitiveness is the country’s economic
environment and it is the capacity of achieving a sustainable prosperity and growth.
A study conducted by Brada Drabek and Perez (2012) in the Eastern Europe
transiton countries base on the effects of host-country as well as home-country
corruption level on FDI. The result indicate that the decision to invest depends
largely on the level of corruption in both home and host countries. Therefore, the
authors found a linear and negative relationship between host-country corruption and
the probality of MNCs to loctae their investment. Thus, countries with less
corruption would attract more foreign investment. In contrast, though these studies
Tamilla et al. (2013) and Brada et al. (2012) where theoretically sound but the
authors employed cross sectional data analysis for multiple regression models, the
result was not rigorously analysed instead for cross section analysis, panel data
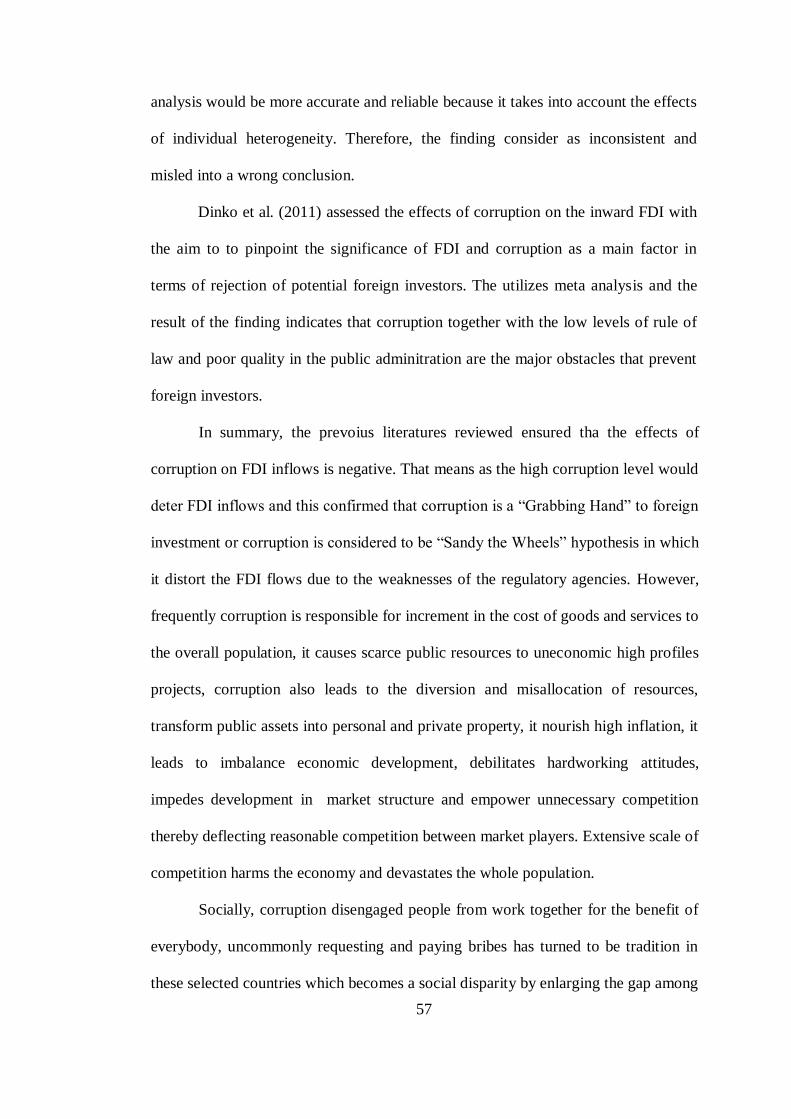
57
analysis would be more accurate and reliable because it takes into account the effects
of individual heterogeneity. Therefore, the finding consider as inconsistent and
misled into a wrong conclusion.
Dinko et al. (2011) assessed the effects of corruption on the inward FDI with
the aim to to pinpoint the significance of FDI and corruption as a main factor in
terms of rejection of potential foreign investors. The utilizes meta analysis and the
result of the finding indicates that corruption together with the low levels of rule of
law and poor quality in the public adminitration are the major obstacles that prevent
foreign investors.
In summary, the prevoius literatures reviewed ensured tha the effects of
corruption on FDI inflows is negative. That means as the high corruption level would
deter FDI inflows and this confirmed that corruption is a “Grabbing Hand” to foreign
investment or corruption is considered to be “Sandy the Wheels” hypothesis in which
it distort the FDI flows due to the weaknesses of the regulatory agencies. However,
frequently corruption is responsible for increment in the cost of goods and services to
the overall population, it causes scarce public resources to uneconomic high profiles
projects, corruption also leads to the diversion and misallocation of resources,
transform public assets into personal and private property, it nourish high inflation, it
leads to imbalance economic development, debilitates hardworking attitudes,
impedes development in market structure and empower unnecessary competition
thereby deflecting reasonable competition between market players. Extensive scale of
competition harms the economy and devastates the whole population.
Socially, corruption disengaged people from work together for the benefit of
everybody, uncommonly requesting and paying bribes has turned to be tradition in
these selected countries which becomes a social disparity by enlarging the gap among

58
the populace. This on-going research is needed in this area as the subject matter
becomes very important. How corruption does affect the well-being of economic
transaction of a country? Or how corruption level does impact the levels of FDI
inflows in the developing countries Nature of corruption?
2.9.2 Positive Effects of Corruption on FDI Inflows
Alternatively, there are some literatures which are contrary with the above opinions
in which they provides evidences where corruption is considered as “helping hand”
that encourages FDI inflows. The scholars with notation believed that corruption is a
“greasing the wheels” hypothesis where it facilitates the smooth running FDI flows.
The following are the litratures that are supporting this argument.
Egger and Winner (2005) conducted their study which covers the periods
from 1995 to 1999 using panel data sets of 73 developing countries. The result
clearly shows a positive effect among corruption and FDI in both short and long run
on FDI inflows. That is, corruption encourages FDI inflows and this study is
consisted with grease the wheels theory of corruption. However, this result is reliable
and consistent as the authors consider dynamic panel data analysis to test the
cointegration among the variables and this is more reliable than that of time series
cointegration. Equally, Christopher and Watson (2004) examine the impact of
corruption that is associated with the level change of inward FDI. The research
utilizes Ordinary Least Square (OLS). Corruption perception scores generated by
transparency international was use as proxy to the corruption level of an economy
and research covers the period only 1999 and 2000. The finding shows that
regardless the increase of corruption indices the level of FDI inflows still growing to
a higher level. Therefore, this result disproves the notion that corruption deters FDI
59
inflows because in as far as the increase in corruption no matter how foreign
investment still remains attractive. Thus, corruption is grease the wheels hypothesis.
In contrast, this study adopts only OLS to test the result which is inefficient to
capture this kind of relationship in which result becomes suspicious. Secondly, the
do not control the individual specific characteristics which may affects the final
result. Thirdly, this study covered only year period of analysis. Therefore, a finding
with nature is considered to be biased and inconsistent.
Mudambi et al. (2012) conducted their study by employing the integrated
approach to assessed the impact of corruption on FDI inflows, the integration enables
the model to link national institutional factors to magnitude of the cross country
flows of FDI. The study covered about 55 cross-countries from 1986 to 2000 which
is four distinct periods. In terms of panel nature of the data the variables are
considered as time-varying and this enables the institutional variables to vary over
time. Therefore, the authors utilized time period observations instead of annual
observations. Their empirical result shows that corruption does not have direct
influence over FDI inflows independently. Thus, it is level corruption together with
the economic regulation consider as the major determinant that influenced the level
of FDI inflows. Contrarily, in terms of the model employed, the variables in the
model rendered the result to be suspicious because it did not capture the individual
specific characteristics nature of a unit of observation. Variables like infrastructure,
natural resources endowment, institutional factors might influence this findings but
are not included in the model. Secondly, the authors complicated the procedure of
measuring corruption levels as they proposed time period observations instead of
annual observations but they proceed to use annual data of corruption perception
index computed by Transparency International. Lastly, the variable used to capture

60
economic regulation is correlated with corruption. Therefore, this findings is
suspicious and biased and it is not consisted with the findings of (Bellos and
Subasat 2012). But empirical study of Cuervo-cazurra (2008) reveals that corruption
level has a meagre negative effect on the inflows of FDI into the transition
economies in relation to the other countries. This view tries to show the reason why
foreign investors invested into the transition economies with a higher corruption
level. Assuming that these transition countries are experiencing specific similar
problems, therefore countries provides better opportunities with a high corruption
level to the foreign firms.
According to the findings of Bellos and Subasat (2011) whom they employed
a panel gravity model to examined the impact of corruption level on FDI inflows
with regard to 15 transition economies. The result shows that despite whatever the
level of corruption is, corruption does not deter FDI inflows. Subasat and Bellos
(2013) conducted their study on the impact of corruption on FDI flows in both source
country and host-country in the case of transition countries. The study adopts the
model of Bellos and Subasat (2012) but with slightly and more advance model in
which it includes corruption from both source and home countries and the study uses
the same variables in the analysis. The study covers the periods from 1985 to 2008
over 24 targeted countries and 31 source countries. The finding indicates that
corruption is considered as enhancing factor to FDI flows between the countries.
Therefore, this findings support the argument that corruption is grease the wheels
hypothesis. However, based on the findings of Bellos and Subasat (2012) and
Subasat and Bellos (2013) there is model specification error because variables such
as infrastructures, institutional factors, natural resources; most especially natural
endowment has a greater influence over FDI inflows in this area of study but where

61
omitted in the models. These render findings to be inconsistent, biased and
suspicious.
However, Quazi (2014) conducted the study to investigate the effects of
corruption and regulatory agency on FDI inflows over the panel data set of 53
African economies and the research utilizes Feasible Generalized Least Square
model in the analysis. The result reveals that corruption does not deter FDI inflows to
Africa but rather it facilitates and encourages foreign investors. The result also found
that regulatory environment is weak in Africa and this result validate the helping
hand hypothesis and finally result shows that SSA are suffering from locational
disadvantage in attracting FDI inflows in relation to other continents.
The study of Larraín and Tavares (2004) assessed the impact of openness on
corruption level by taking FDI inflows as proxy of openness. The study employed
cross sectional data of the countries under study over the periods 1970 to 1994 and
the study test the causality between the new instrumental variables set of cultural and
geographical distance among the FDI exporting and recipient economies. However,
the study found that FDI as a GDP share is relate significantly with lower levels of
corruption. Therefore, with regards to the quantitative effects both FDI and
corruption appeared to be in the same order of magnitude as far as that of GDP per
capita.
2.10 CONCLUSION
This chapter discussed in detail the related previous studies on the impacts of
corruption on FDI inflows, the chapter consists introduction, definition of the key
concepts, nature of corruption, determinants of FDI inflows in relation to sub-Sahara
Africa and the related literature on the effects of corruption on FDI inflows that

62
supports either “grabbing hand” and “helping hand” theories of corruption. However,
it is also explored theories that tried to explain various forms and reasons for MNCs
to engage in FDI. Theories give an insight about the procedure that enables firms to
invest in abroad. Therefore, it can be said that each theory has informative power to
explain international investments by firms. Based on the discussed it appears that
OLI theory gives a finer design framework for a single general theory of MNCs
which has the power of examining (a) what encourages MNCs to engage in FDI, (b)
what are the purpose behind different forms of investment in abroad and (c) what
empowers the MNCs to go another country and be successful? In this literature the
author discussed the related literatures on the effects of corruption on economic
growth as “Grabbing Hand” or “Helping Hand” theories of corruption.
63
CHAPTER THREE
METHODOLOGY
3.1 INTRODUCTION
This chapter describes the overall methodology of this study which aims to
investigate the determinants of FDI in some selected West African English speaking
countries. It consists theoretical framework, specification of the model, justification
of the variables, data, method of data analysis and conclusion.
3.2 THEORETICAL FRAMEWORK
The framework was developed based on Dunning OLI model known as eclectic
paradigm because it is considered as the most influential empirical framework to
examine the effects of FDI over the decades. OLI framework provides a holistic
framework that includes the most influential factors that determines the operations of
MNCs. Then, MNCs invest in an economy with the purpose either as market-
seeking, resource-seeking or efficiency-seeking MNCs. Market-seeking investors are
attracted by the market size in the targeted country. An economy which is
characterized with high demand would definitely require more markets for goods and
services thereby encouraging investment. Moreover, increased in investment in an
economy could attract more investors thereby engaged in competition to acquire
large market share and hence this would encourage and make FDI more attractive.
Similarly, increasing investment would increase GDP per capita which is used to
measure market size.
64
Moreover, as demand of more goods and services increased in an economy
thereby attracting more foreign investors and this will lead to open-off of the
economy by flowing more goods and services across economies hence export and
import could be increased/encouraged (openness). Therefore, as a country becomes
an open door free economy the probability of investing would increase thereby
attracting more foreign investors and perhaps FDI could also become more attractive.
Despite high demand and greater openness an economy is, macroeconomic stability
must be ensure for favourable and conducive business environment and this is
reflected through relative and stable inflation and exchange rates. But, if business
environment is not stable with high inflation or exchange rate volatility, foreign
investors could discourage and hence FDI become less attractive.
In the same way, an economy that characterized with strong and efficient
regulatory institutions which is measured by government effectiveness could attract
more foreign investors which could increase FDI. That is, an economy characterized
with strong civil service, efficient public services, high degree of independence and
efficient policy formulation could encourage more FDI and attracted most especially
efficiency-seeking investors. Dunning (2002) argued that FDI in the developing
economies has moved from resource or market-seeking FDI to efficiency-seeking
FDI. However, the level of corruption in the targeted country became a serious issue
to foreign investors, countries with high level of corruption they may likely attract or
discourage FDI inflows. Therefore, if corruption coincides with weak regulatory
institutions, corruption would compensate bad institutions and make FDI to become
more attractive. Additionally, a favourable investment climate in the target country
increase the probability of investing in such economy and this is measure by
economic freedom. Further, the more an economy become liberalized the more

65
viability of investing in that economy and hence the more FDI become more
attractive. Moreover, despite the inspired performance of investment in attracting
more FDI but it has been prerequisite with the available quantity of labour.
Availability of labour means high quantity of labour and this lead to the low cost of
labour, cheaper labour means foreign MNCs has capability of employing more
labours, employing more labour would increase investment thereby productivity
would increase and perhaps FDI could be more attractive. Lastly, the argument
between efficient and qualitative infrastructure with FDI is straightforward.
Provision adequate and efficient infrastructure such as good roads, bridges,
electricity, communications, railways, ports and all these could encourage investment
thereby stimulating productivity and hence FDI become more attractive. Indeed, for
all that can be observed in Figure 3.1.
Figure 3.1: Theoretical Framework
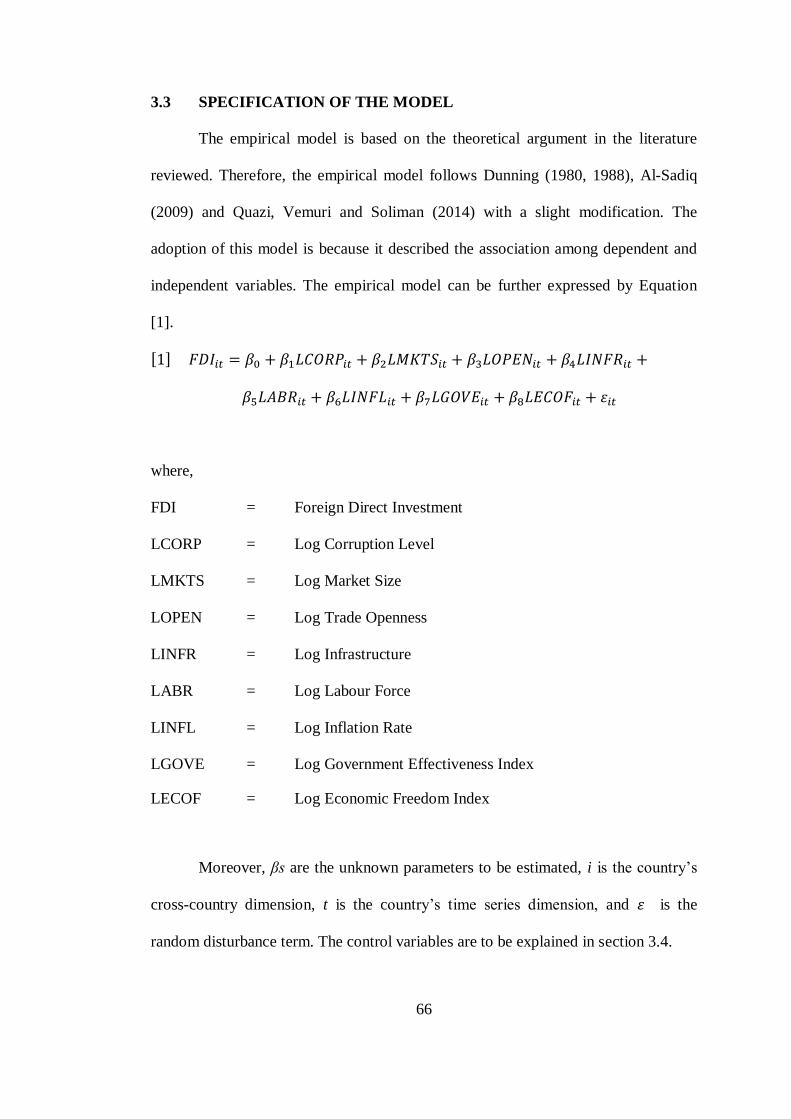
66
3.3 SPECIFICATION OF THE MODEL
The empirical model is based on the theoretical argument in the literature
reviewed. Therefore, the empirical model follows Dunning (1980, 1988), Al-Sadiq
(2009) and Quazi, Vemuri and Soliman (2014) with a slight modification. The
adoption of this model is because it described the association among dependent and
independent variables. The empirical model can be further expressed by Equation
[1].
[ ]
where,
FDI = Foreign Direct Investment
LCORP = Log Corruption Level
LMKTS = Log Market Size
LOPEN = Log Trade Openness
LINFR = Log Infrastructure
LABR = Log Labour Force
LINFL = Log Inflation Rate
LGOVE = Log Government Effectiveness Index
LECOF = Log Economic Freedom Index
Moreover, βs are the unknown parameters to be estimated, i is the country’s
cross-country dimension, t is the country’s time series dimension, and is the
random disturbance term. The control variables are to be explained in section 3.4.

67
Six separated models have been estimated based on the measures of
corruption level. That is, Model 1 could be estimated by using CPI as measure of
corruption level, the estimation of Model 2 reports the estimated results while FFC as
a measure of corruption level is used and Model 3 presents the estimated results
while COC is used as measure of corruption. Whereas Model 4 estimates FDI
inflows into specific countries while using CPI as a measure of corruption level,
Model 5 employed the use of FFC as a measure of the level of corruption for
estimation of FDI inflows into specific WACs and Model 6 presents specific results
of FDI inflows into WACs while using COC as a measure of corruption.
3.4 JUSTIFICATION OF VARIABLES
3.4.1 Foreign Direct Investment
FDI it is amount of capital invested by foreign investor in an economy. It represents
the net inflows of FDI to a country with which the investment is made. Therefore,
FDI is measured by FDI per capita, which is measured by
(
).
3.4.2 Corruption Level
Corruption level (CORP) is used as a measure of corruption in a targeted country in
order to assess the effects of corruption on FDI inflows in the home country. There is
no universal procedure of measuring corruption due to its secretive nature. Three
measures as CPI, FFC and COC employed to assess the level of corruption of a
particular economy. These measures are widely used by several researchers in their
68
studies and it is considered as the well accepted measure of corruption in the targeted
country. Likewise, it is expected to have a positive or negative sign. If it is negative,
it means corruption deter FDI inflows in the targeted country and this is in line with
the work of Mauro (1995), Wei (2000), Habib and Zurawicki (2002), Al-Sadiq
(2009) and Alemu (2012, 2013). While, if the coefficient sign appeared to be positive
it means corruption encourages more FDI inflows into the targeted countries. This is
line with the work of Christopher and Watson (2004), Samanta (2011), Bellos and
Subasat (2011), Subasat and Bellos (2013), Alemu (2012 & 2013) and Quazi et al.
(2014).
CPI is the scale between 0-10 from 1995 to 2011 but it was changed in 2012
to the scale of 0-100. Therefore, this study reversed this scale to 0-10 by dividing the
index with 10, so that it could be similar. FFC is scaled from 0-100, zero means a
country is more corrupt while 100 means less corruption. Similarly, COC is also
scaled between -2.5 to 2.5, where -2.5 indicates higher corruption level a country
characterized with while 2.5 indicates the cleanest a country is from corruption.
3.4.3 Market Size
Market size (MKTS) is the measurement of the overall volume of a given market.
The hypothesize market size argued that FDI inflows in the host country is a function
of home country market where GDP per capita is usually used to measure it.
Therefore, the domestic demand in the home country plays an important role in
attracting more FDI inflows where the basic objective of MNCs is to secure and
serve the home country markets and this means more business to MNCs and
domestic firms. GDP per capita is used as a measure to market size. Many empirical
studies such as Wei (2000), Quazi (2007, 2014), Al-Sadiq (2009), Porters (2010),
69
Freckleton, Wright and Craigwell (2011), Bellos and Subasat (2011), Baxamusa and
Jalal (2014) and Subasat and Bellos (2013) used market size of the domestic country.
They found a positive relationship between market size and FDI inflows.
Inconsistent with the studies of Mauro (1995), Tanzi (1998), Habib and Zurawicki
(2002), Anyanwu (2006), Dreher and Gassebner (2011) found a negative relationship
between market size and FDI inflows. Therefore, it is expected to have a positive
sign with the inflows of FDI.
3.4.4 Trade Openness
Trade openness (OPEN) refers to the sum of total export and import of goods and
services to the investing partner usually in a year. Openness is measured by the sum
of import and export of goods and services as a ratio of GDP. This measured the
degree at which an economy is opened to trade with the rest of world. Therefore, a
significant positive coefficient implied high degree of openness to attract more FDI
inflows. In addition, the more an economy is opened to doing business, the more
incentive for MNCs need to trade to that economy. But a negative coefficient such an
economy imposes trade barriers which may discourage FDI inflows. The study of
Habib and Zurawicki (2002), Anyanwu (2006), Al-Sadiq (2009), Porters (2010),
Alemu (2013) and Quazi et al. (2014) found a positive relationship with FDI inflows.
It is expected to have a positive sign with the FDI inflows.
3.4.5 Infrastructure
The availability in the provision of infrastructure in an economy could be an
important influential factor that determines the inflows of FDI into the targeted
countries. However, infrastructure such as provision of good roads,
70
telecommunication, electricity, seaport and railways could attract more FDI inflows
into the home countries. Provision of good infrastructural facilities would increase
productivity thereby stimulating more FDI inflows. This study uses telephone lines
and mobile subscribers to measure infrastructure. Afterwards, studies like that of
Asiedu (2002), Anyanwu (2011), Alemu (2013), Mathur and Singh (2013) and Quazi
(2014) found the relationship of infrastructure to be positive. On the other hands, the
studies of Bellos and Subasat (2011) and Quazi et al. (2014) found negative
relationship among the infrastructure and FDI inflows. It is expected to have a
positive sign with the FDI inflows.
3.4.6 Government Effectiveness Index
Effective government in the targeted country plays a critical role in attracting FDI
inflows. It influences the decisions taken by MNCs where the managers of MNCs
should take into consideration the decisions taking by the home country government
that can influence their activities. Domestic country is likely to attract more FDI
inflows if the government is strong and effective. However, government
effectiveness captures perceptions of the quality of public services, the quality of the
civil service and the degree of its independence from political pressures, the quality
of policy formulation and implementation, and the credibility of the government's
commitment to such policies (WGI 2014). This variable would be used to measure
quality of regulatory institutions (environment). Similarly, Turan and Subasat (2013),
Breen and Gillanders, (2012) and Quazi, (2014) includes this index in their analysis
to measure institutional quality. It is expected to have a positive sign with the level of
FDI inflows.
71
3.4.7 Economic Freedom Index
Growing index of economic freedom (ECOF) is considered as the unequivocally
about accomplishing greater overall prosperity that goes beyond materialistic and
monetary measurements of prosperity (Heritage Foundation 2014). This is used to
measure the quality of investment climate. This can play a vital role in attracting FDI
inflows to the home country. Studies by Subasat (2011) and Quazi (2014) found the
relationship with FDI inflows as positive. But the study by Quazi (2007) and Quazi
et al. (2014) found the relationship with the level of FDI inflows as negative. It is
expected to have a positive relationship with the level of FDI inflows.
3.4.8 Labour Force
Labour force (LABR) is measure the available quantity of labour force in the home
country for producing goods and services. This is the portion of population of labour
force participation whom their age ranges from 15-16 and they are considered as
economically active. Labour in abundance means the MNCs can expect to have
lower cost of labour inputs and it is expected to have a positive sign with FDI
inflows. Most of the previous studies used total population as a proxy to the quantity.
This is in line with the studies of Habib and Zurawicki (2002), Bennett (2005) and
Shera, Dosti and Grabova (2014).
3.4.9 Inflation
Inflation (INFL) is the persistent rise in the general price of goods and services
usually in a year. Previous empirical studies indicate that a relative lower of level of
inflation means lower macroeconomic risks, therefore higher FDI inflows is
anticipated. Inflation rate is measured by the consumer price index. This variable is
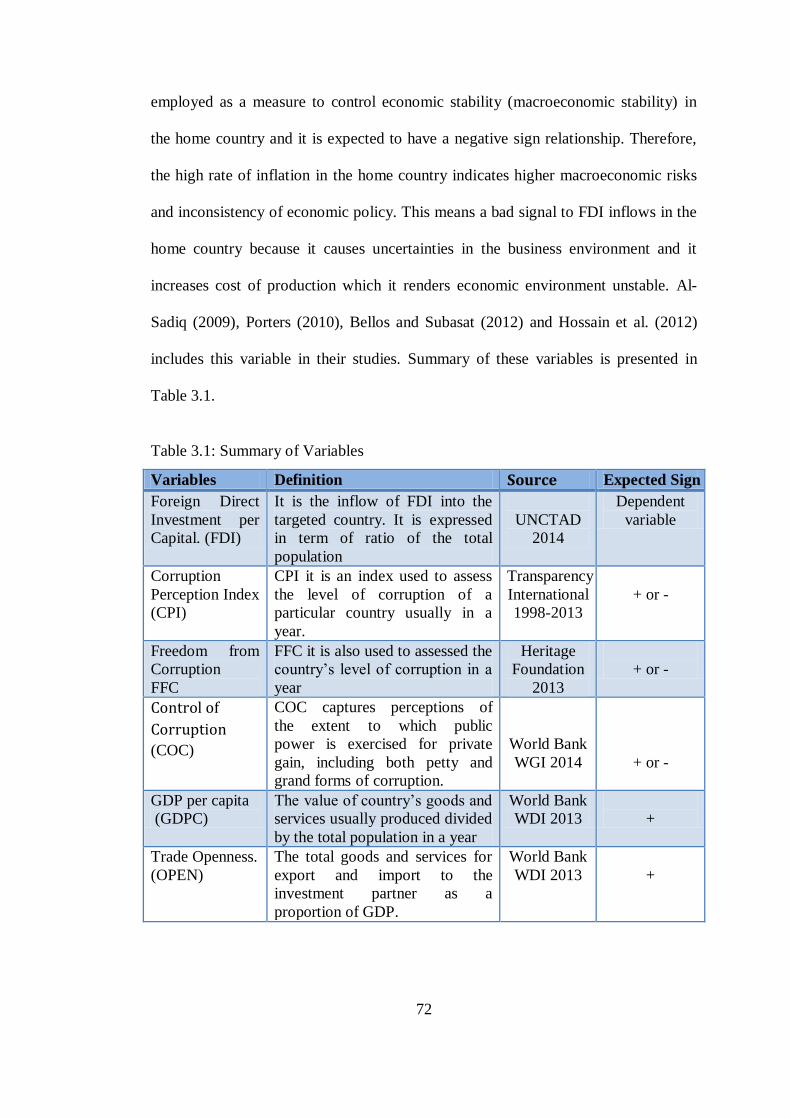
72
employed as a measure to control economic stability (macroeconomic stability) in
the home country and it is expected to have a negative sign relationship. Therefore,
the high rate of inflation in the home country indicates higher macroeconomic risks
and inconsistency of economic policy. This means a bad signal to FDI inflows in the
home country because it causes uncertainties in the business environment and it
increases cost of production which it renders economic environment unstable. Al-
Sadiq (2009), Porters (2010), Bellos and Subasat (2012) and Hossain et al. (2012)
includes this variable in their studies. Summary of these variables is presented in
Table 3.1.
Table 3.1: Summary of Variables
Variables Definition Source Expected Sign
Foreign Direct
Investment per
Capital. (FDI)
It is the inflow of FDI into the
targeted country. It is expressed
in term of ratio of the total
population
UNCTAD
2014
Dependent
variable
Corruption
Perception Index
(CPI)
CPI it is an index used to assess
the level of corruption of a
particular country usually in a
year.
Transparency
International
1998-2013
+ or -
Freedom from
Corruption
FFC
FFC it is also used to assessed the
country’s level of corruption in a
year
Heritage
Foundation
2013
+ or -
Control of
Corruption
(COC)
COC captures perceptions of
the extent to which public
power is exercised for private
gain, including both petty and
grand forms of corruption.
World Bank
WGI 2014
+ or -
GDP per capita
(GDPC)
The value of country’s goods and
services usually produced divided
by the total population in a year
World Bank
WDI 2013
+
Trade Openness.
(OPEN)
The total goods and services for
export and import to the
investment partner as a
proportion of GDP.
World Bank
WDI 2013
+

73
. . . Continue Table 3.1: Summary of Variables
Variables Definition Source Expected Sign
Infrastructure.
(INFR)
This is the provision of
infrastructure which is measured
by telephone and mobile
subscribers per 100 people.
World Bank
WDI 2013
+
Government
effectiveness
index.
(GOVE)
quality of public services, civil
service and the degree of its
independence from political
pressures, the quality of policy
formulation and implementation,
and the credibility of the
government's commitment to
such policies.
World Bank
(WGI) 2014
+
Economic
freedom index.
ECOF
This is the measure of investment
climate in the home country
Heritage
Foundation
2014
+
Labour force
(LABR)
This is the available quantity of
labour for producing goods and
services.
World Bank
WDI 2013
+
Inflation.
(INFL)
The persistent rise in the general
price level in a country usually a
year. This measures overall
macroeconomic stability
World Bank
WDI 2013
-
3.5 DATA
The study basically utilizes secondary data; mostly from World Bank (i.e. World
Development Indicators and World Governance Indicators), United Nation
Conference on Trade Development (UNCTAD) and Heritage Foundation. This is the
panel study that utilizes the secondary data of 15 years, time frame covering the
periods from 1998 to 2013.
Moreover, Baltagi (2008) identified the following importance of using panel
data as. Firstly, panel data control individual specific heterogeneity. Since the panel
data analysis is considering countries, firms, individuals, etc. these units are bound to
be heterogeneous. Therefore, the researcher has the ability to control variables for
74
time invariant and country invariant. Secondly, panel data analysis combines both
time series and cross-sectional observations. Therefore, it provides more information,
less collinearity among the variables, more efficiency, more degree of freedom and
more reliability in the result of the parameters. Thirdly, panel analysis is subject to
dynamics of adjustment. That is, by observing the repeated cross sectional dimension
which can results in eliminating biases in countries aggregation and nonstationarity.
Fourthly, panel can measure and detect the effects which cannot do so in time series
or cross section observations.
3.6 SAMPLE OF THE STUDY
A total of five West African English speaking countries were included in the study
namely; Gambia, Ghana, Liberia, Nigeria and Sierra Leone. They are members of
Economic Community of West African States (ECOWAS) with headquarter in
Nigeria at Lagos. They are part of SSA region and part of the low income countries
category. The countries are almost regional tiers with the regional proximity to trade
among each other. This is in particular the motivation and encouragement for
selecting these countries thereby analysing them for meaningful and robustness
analysis. However, the availability of data on corruption influences the choice of
time frame for this study.
However, panel data is a set of observations that consists time series for cross-
sectional series in a set of data. This consist a panel of five WACs with the 15-year
time dimension. Therefore, estimation panel data is considered as an analytical
efficient method for handling econometric data and it could be balanced or
unbalanced. Balanced panel is an observation that has the same time periods for each
variable and each individual

75
However, model design, measurement errors and data collection are
considered to be the major problems researchers are facing when using panel
analysis due to the facts researcher is estimating dependent variables on a set of
independent variables and unlike in time series analysis it suffers from short period
of observations like in annual data for a unit of observation.
3.6 METHOD OF DATA ANALYSIS
The study utilizes traditional panel data techniques that could be used to test the
relationship among FDI inflows and other selected variables included in the models.
Method of the data analysis is classified into Pooled OLS, Fixed Effects Model
(FEM) or Random Effects Model (REM).
3.6.1 POOLED OLS REGRESSION
Pooled OLS is a method of estimating the true population parameters from a given
sample in a regression analysis in which it neglect time series and cross sectional
nature of the observations. Therefore, in this study pooled OLS could be conducted
to observe the effects of independent variables over FDI inflows as the dependent
variable. Pooled OLS for instance, consider WACs as the same which has no
difference because it assumes homogeneity in terms of the observations of the cross-
country. The model can be specified below in Equation [2].
[ ]

76
Equation [2] considers all the countries as the same by ignoring individual
countries specific effects (heterogeneity) while estimating a common constant
coefficient.
3.6.2 FIXED EFFECTS MODEL
FEM is a model where individual countries among the WACs would be allowed
having their separate intercepts which is time invariant. That is, each country effects
would be held constant for a period of time. In addition, FEM examines the
association among dependent and independent variables within each country and
when running FEM each country might have impact on the dependent variable and
this is controlled for. Moreover, before examining the validity FEM an appropriate
F-test should be conducted against pooled OLS (i.e. common constant method). The
null hypothesis (H0) assumes that all WACs have a common constant (homogeneity)
and pooled OLS is more appropriate. But rejecting the H0 confirmed that FEM is
more appropriate and consistent. Then FEM is presented in Eq [3], Eq [4] and Eq [5]
[ ]
[ ] ( )
where is countries specific effect and it is time invariant. It is varies by the
individual countries but it does not change over time and is the disturbance term.
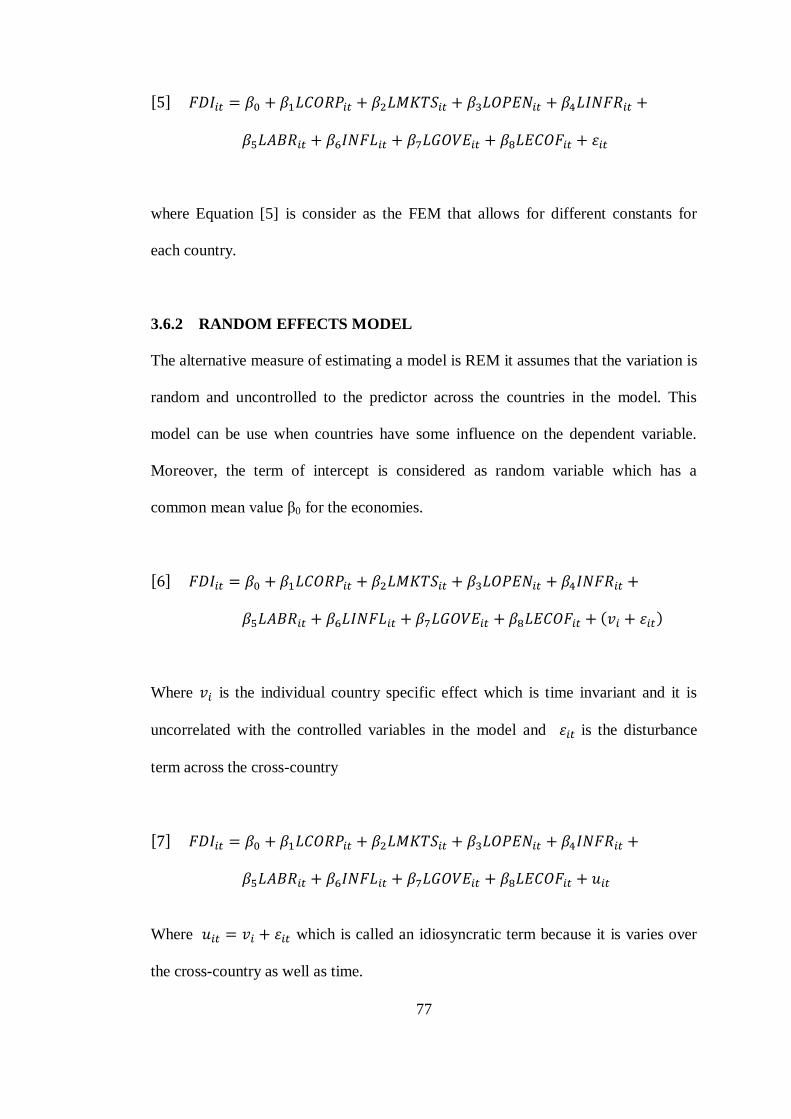
77
[ ]
where Equation [5] is consider as the FEM that allows for different constants for
each country.
3.6.2 RANDOM EFFECTS MODEL
The alternative measure of estimating a model is REM it assumes that the variation is
random and uncontrolled to the predictor across the countries in the model. This
model can be use when countries have some influence on the dependent variable.
Moreover, the term of intercept is considered as random variable which has a
common mean value β0 for the economies.
[ ]
( )
Where is the individual country specific effect which is time invariant and it is
uncorrelated with the controlled variables in the model and is the disturbance
term across the cross-country
[ ]
Where which is called an idiosyncratic term because it is varies over
the cross-country as well as time.
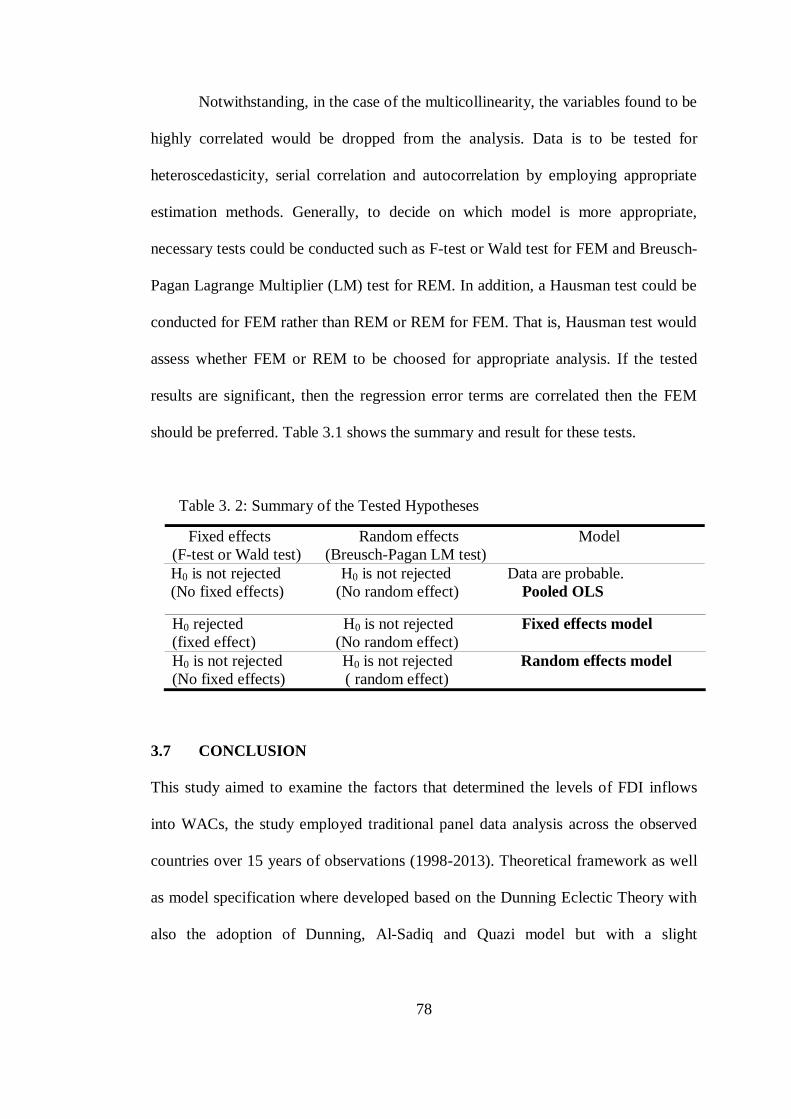
78
Notwithstanding, in the case of the multicollinearity, the variables found to be
highly correlated would be dropped from the analysis. Data is to be tested for
heteroscedasticity, serial correlation and autocorrelation by employing appropriate
estimation methods. Generally, to decide on which model is more appropriate,
necessary tests could be conducted such as F-test or Wald test for FEM and Breusch-
Pagan Lagrange Multiplier (LM) test for REM. In addition, a Hausman test could be
conducted for FEM rather than REM or REM for FEM. That is, Hausman test would
assess whether FEM or REM to be choosed for appropriate analysis. If the tested
results are significant, then the regression error terms are correlated then the FEM
should be preferred. Table 3.1 shows the summary and result for these tests.
Table 3. 2: Summary of the Tested Hypotheses
Fixed effects Random effects Model
(F-test or Wald test) (Breusch-Pagan LM test)
H0 is not rejected H0 is not rejected Data are probable.
(No fixed effects) (No random effect) Pooled OLS
H0 rejected H0 is not rejected Fixed effects model
(fixed effect) (No random effect)
H0 is not rejected H0 is not rejected Random effects model
(No fixed effects) ( random effect)
3.7 CONCLUSION
This study aimed to examine the factors that determined the levels of FDI inflows
into WACs, the study employed traditional panel data analysis across the observed
countries over 15 years of observations (1998-2013). Theoretical framework as well
as model specification where developed based on the Dunning Eclectic Theory with
also the adoption of Dunning, Al-Sadiq and Quazi model but with a slight

79
modification. Several measures of corruption could be used to assess the robustness
of the findings.

80
CHAPTER FOUR
DISCUSSION OF RESULTS
4.1 INTRODUCTION
The aim of this chapter is to discuss the empirical analysis results on the factors that
influenced the level of FDI inflows in WACs. This includes descriptive statistics,
correlation analysis, estimation results of FEM, consistency of the FEM, REM and
pooled OLS models, analysis results on the determinants of FDI, diagnostic tests,
estimates of the FDI inflows for the specific country and conclusion.
4.2 DISCRIPTIVE STATISTICS
The descriptive statistics are presented in Table 4.1. This table reports the overall
mean, standard deviation, minimum and maximum values for all the variables used
in the analysis.
Table 4.1: Descriptive Statistics
Variables Mean Standard Deviation Minimum Maximum
FDI 44.32 51.67 0.03 260.05
CPI
FFC
COC
2.71
23.78
-0.73
0.75
9.67
0.42
1.00
7.00
1.01
4.60
50.00
0.06
MKTS 608.15 421.88 173.11 1279.96
INFR 28.00 30.87 0.24 109.24
OPEN 0.22 0.19 0.03 0.99
INFL 348.96 376.37 29.56 1891.36
LABF 2.92 1.02 0.85 7.34
GOVE 0.21 0.41 0.17 0.48
ECOF 53.81 5.92 39.40 69.00

81
Table 4.1 shows that all the variables are relatively closer to their mean
values except for FDI, MKTS, INFR and INFL. For instance, the dispersion between
the mean observations of CPI is just 0.75 while the variation for FFC and COC based
on their standard deviations are 9.67 and 0.42, respectively.
4.3 CORRELATION ANALYSIS
The correlation analysis was conducted as a preliminary assessment of the
relationship among the dependent and independent variables. The result of this
analysis is presented in Table 4.2.
Table 4.2 Correlation Analysis
FDI CORP FFC COC GDPC INFR OPEN INFL LABR GOVE ECOF
FDI 1.000
CPI 0.519 1.000
FFC 0.659 0.610 1.000
COC 0.485 0.739 0.521 1.000
MKTS 0.592 0.419 0.332 0.298 1.000
INFR 0.463 0.506 0.322 0.306 0.622 1.000
OPEN 0.279 0.016 0.142 -0.027 -0.440 -0.182 1.000
INFL 0.232 0.093 -0.244 0.022 0.005 0.192 -0.117 1.000
LABR -0.065 -0.129 -0.008 -0.294 -0.286 -0.150 0.251 0.230 1.000
GOVE -0.517 -0.156 -0.244 -0.059 -0.404 -0.361 0.263 -0.077 0.216 1.000
ECOF 0.041 0.396 0.416 0.127 0.266 0.222 0.083 -0.376 0.276 -0.047 1.000
Table 4.2 presents correlation analysis among FDI and other selected
variables included in the model. FDI inflows have a positive and strong correlation
related to FFC, MKTS and CPI, but the correlation among FDI and GOVE is strong
and negative. Moreover, there is a weak and positive correlation between FDI and
COC and INFR. Also, correlation of FDI inflows with regards to OPEN and INFL is
fairly weak and positive. However, LABR and ECOF have a very weak correlation
with FDI and LABR is negatively correlated.
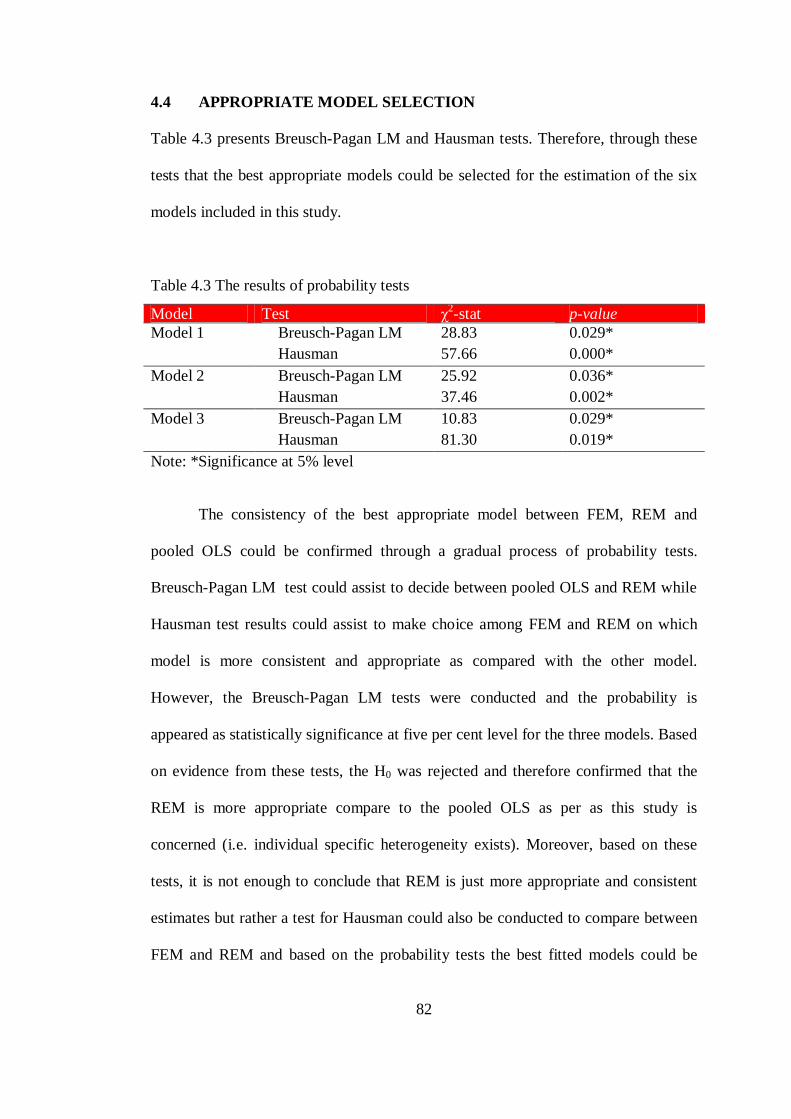
82
4.4 APPROPRIATE MODEL SELECTION
Table 4.3 presents Breusch-Pagan LM and Hausman tests. Therefore, through these
tests that the best appropriate models could be selected for the estimation of the six
models included in this study.
Table 4.3 The results of probability tests
Model Test χ2-stat p-value
Model 1 Breusch-Pagan LM 28.83 0.029*
Hausman 57.66 0.000*
Model 2 Breusch-Pagan LM 25.92 0.036*
Hausman 37.46 0.002*
Model 3 Breusch-Pagan LM 10.83 0.029*
Hausman 81.30 0.019*
Note: *Significance at 5% level
The consistency of the best appropriate model between FEM, REM and
pooled OLS could be confirmed through a gradual process of probability tests.
Breusch-Pagan LM test could assist to decide between pooled OLS and REM while
Hausman test results could assist to make choice among FEM and REM on which
model is more consistent and appropriate as compared with the other model.
However, the Breusch-Pagan LM tests were conducted and the probability is
appeared as statistically significance at five per cent level for the three models. Based
on evidence from these tests, the H0 was rejected and therefore confirmed that the
REM is more appropriate compare to the pooled OLS as per as this study is
concerned (i.e. individual specific heterogeneity exists). Moreover, based on these
tests, it is not enough to conclude that REM is just more appropriate and consistent
estimates but rather a test for Hausman could also be conducted to compare between
FEM and REM and based on the probability tests the best fitted models could be
83
choose. Therefore, a Hausman tests was further conducted and probabilities are also
statistically significance at five per cent level. Meaning that the H0 is rejected and
concludes FEM is more consistent and efficient estimates than the REM. Therefore,
based on the evidence of the tests conducted for this study, the analysis for the three
models would be based on FEM.
4.5 ANALYSIS RESULTS ON THE DETERMINANTS OF FOREIGN
DIRECT INVESTMENT
4.5.1 Model 1
The estimation results of Model 1 are presented in Table 4.4. As can be seen from
Table 4.4, coefficient of LCPI is statistically significance at five per cent with a
negative relationship to FDI per capita inflows at five per cent level. By controlling
all other independent variables included in the model, one per cent increase in the
corruption level causes a decrease in per capita FDI inflows by $65.70 million at
five. This result confirmed the previous existing literatures as corruption is a
“grabbing hand” theory of corruption, this negative association of high corruption
level with per capita FDI inflows is attributed due to the rigidity of regulatory
institutions where these countries are characterized with. Perhaps corruption
discourages foreign investors as well as attractiveness of FDI inflows into these
countries. For example, Sierra Leone, Nigeria and Gambia has very serious problem
of corruption which continuous to deteriorate over years. Among these countries, it is
only Liberia and Ghana’s corruption level is improving. Foreign investors are
discouraging with some level of corruption to continuous investing. This result is
consistent with the findings of Habib and Zurawicki (2002), Kusum and Ketkar

84
(2005), Al-Sadiq (2009) and Tosun et al. (2014). Based on their findings, it shows
that corruption deters the inflows of FDI into the targeted countries due to their
strong regulatory institutions. However, his result is inconsistent with the findings of
Larraín and Tavares (2004), Christopher and Watson (2004), Porters (2010), Bellos
and Subasat (2012), Subasat and Bellos (2013), Quazi, Vemuri and Soliman (2014)
and Quazi (2014). All of them found that despite the high level of corruption in the
domestic countries, corruption do not deter FDI inflows.
Moreover, the result shows that the coefficient of government effectiveness is
strongly and statistically significance at five per cent level with negative relationship
to FDI per capita inflows. The coefficient deviated from the expected sign. By
controlling all other independent variables, one per cent increase in the index of
government effectiveness causes a decrease in FDI inflows by $14.93 million at five
per cent level. However, this result shows that these countries are characterized with
very weak institutions. This is because institutions in these countries are not allowed
independent in formulating economic policies but rather they are influenced by
dictatorship power of the military leadership. Secondly, the reason that led to this
negative relationship of government effectiveness with per capita FDI inflows is that
most of the countries in WACs such as Liberia, Nigeria and Sierra Leone spend
several years in civil war and this led to ill functions of several economic and
political institutions in which it lead to the weak public services. Thirdly, these
countries undergo a long periods of military coup d’état as well as long military rule
in which most economic decisions are taking by the military council which is not
assigned to the appropriate institutions per se.
85
In addition, Cuervo-Cazurra (2008) argued that in the case of the transition
economies, the transition process from socialist system to capitalist system needs to
deregulate the previous institutions under socialist system and to initiate the new one
under the new system of capitalist that simultaneously take place. Therefore, in
deregulating the previous one and new one are not fully developed and implemented
this will create a high transition costs and institutional gap, in all while there would
be no institutions or clear rules or rules and regulations that would guide the
activities of investors. Similarly, this can almost be applicable with regards to WACs
in which they undergo several years of civil war and military rule with a dictatorship
leaders where transforming process of previous institutions and rebuilding of these
institutions take time which inevitably creates institutional gap or high transforming
costs and at the same time there would be no clear rules and regulations that would
guides the activities of both domestic and foreign investors. Therefore, this may
create a hinge that makes foreign investors no longer attracted and hence FDI inflows
become unattractive and been discouraged. Thus, this could result in a strongly
negative association between government effectiveness index and FDI inflows and
indeed FDI inflows is deterring by weak institutions. This result is consistent with
the results of Anghel (2005), Daude and Stein (2007), Cuervo-cazurra and Genc
(2008) and Asiedu and Lien (2011) where weaker institution does not deter the
inflows of FDI. But, it is contrary to the study of Asiedu (2006) and Quazi (2014).
Because they found that strong regulatory institutions tend to encourage more FDI
inflows into the targeted countries.
The coefficient of domestic market size, which is measured by GDP per
capita, is statistically significance at five per cent level with a correct expected sign
that shows a positive relationship with inflows of FDI per capita. Therefore, one per
86
cent increase in market size would lead to an increase in the FDI inflows by $61.41
million while controlling all other variables included in the model. Thus, market-
seeking FDI are highly attracted to these countries by the large market size with the
market potential to sell their products in WACs. Therefore, this result is similar with
the findings of Wei (2000), Al-Sadiq (2009), Bellos and Subasat (2011) and Subasat
and Bellos (2013). Their findings indicate that size of the market in the domestic
countries tend to attract more foreign investors. Therefore, relationship between
market size with the level of FDI inflows is positive.
This result shows that the coefficient of infrastructural facilities is statistically
significant at five per cent level with negative relationship to FDI inflows. The sign
is contrary to what is expected. Therefore, one per cent increases in infrastructure
causes a decrease in the level of FDI per capita inflows by $18.62 million while
controlling other variables in the model. This result justified that infrastructural
facilities in WACs are inadequate and poorly provided, facilities such as good roads,
seaports, airports, railway lines and telecommunications. Furthermore, the
efficiency-seeking MNCs are discouraged from investing since FDI inflows is not
attracted by the provision of a good qualitative infrastructural facilities. Therefore,
this findings in consistent with the result of Asiedu (2002), Aw and Tang (2010) in
which the level of infrastructure in the domestic does not enhance the FDI inflows.
But it is inconsistent with the findings of Anyanwu (2011), Asiedu and Lien (2011)
and Quazi (2014) where their findings indicates that provision of infrastructure
encourages the inflows of FDI into the targeted countries.
Notwithstanding, the estimated coefficient of trade openness is statistically
significance at five per cent level with a correct sign. Therefore, one per cent
increase in trade openness causes FDI per capita inflows to increase by $46.37

87
million at five per cent level while other variables included in the model are
controlled. This result indicates that the economy of WACs is open to trade with the
rest of the world in the international markets and this would make FDI to be more
attractive and hence FDI per capita inflows increased. Moreover, these countries are
mainly being export oriented and this result is consistent with theory of FDI; that
openness in the domestic country is indicative ease of material inputs into the world
market, so that MNCs could access to material inputs at lower cost. This finding is in
line with the findings of Al-Sadiq (2009), Anyanwu (2011) and Quazi et al. (2014).
Their findings reveals trade openness in the targeted countries encourages the
attractiveness of FDI inflows.
Inflation rate is used as a measure of macroeconomic stability in WACs. The
coefficient of this variable is statistically significance at five per cent level but with
negative relationship to FDI per capita inflows, meaning that a one per cent increase
in inflation rates would lead to a decrease in FDI per capita inflows $68.12 million
while controlling other variables included in the model. Therefore, this result
indicates that these countries characterized with macroeconomic instability.
However, due to the instability in the macroeconomic environment, MNCs will be
scared of high production costs which would affects their profits and MNCs would
be discourage from investing in to WACs, consequently FDI per capita inflows
becomes unattractive. Indeed, the result such as this is not surprising because some
of the countries in WACs faced macroeconomic problems in their economy. For
instance, from 2007 to around 2013 in almost all the countries were having the
problem of high inflation rate that leads to unfavourable macroeconomic
environment. This result is consistent with findings of Aw and Tang (2010) and
Anyanwu (2011). Aw and Tang (2010) found a positive relationship between rate of
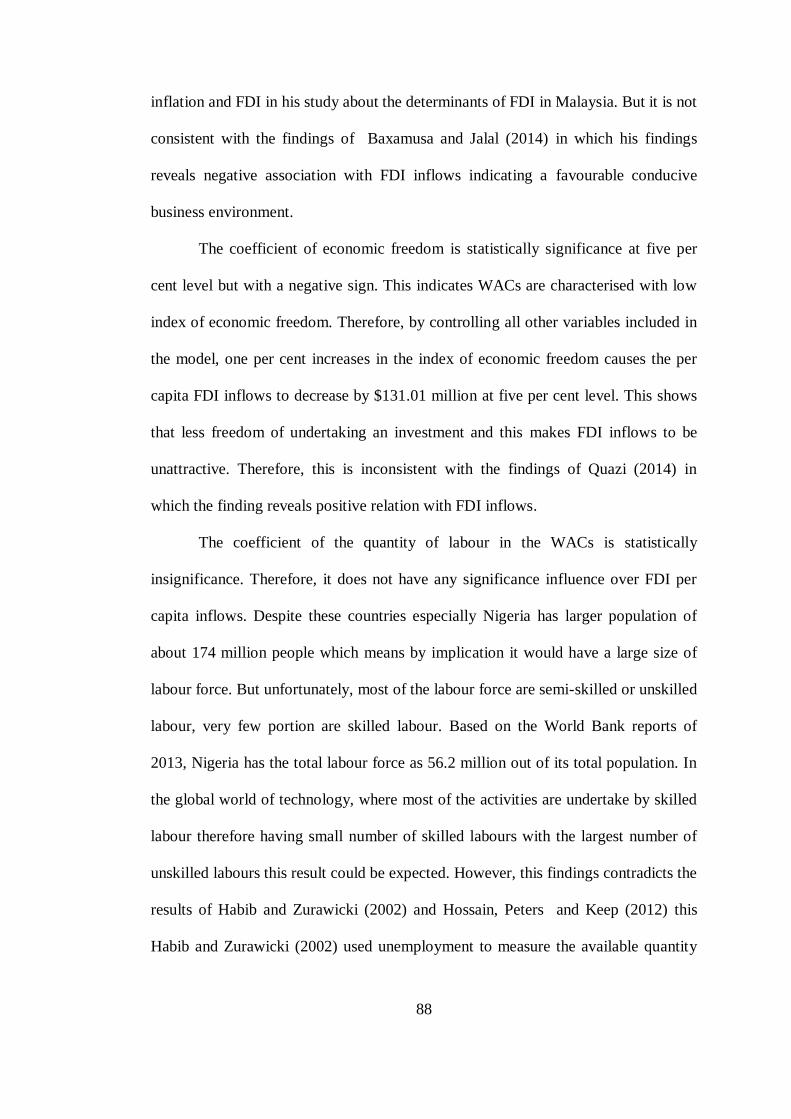
88
inflation and FDI in his study about the determinants of FDI in Malaysia. But it is not
consistent with the findings of Baxamusa and Jalal (2014) in which his findings
reveals negative association with FDI inflows indicating a favourable conducive
business environment.
The coefficient of economic freedom is statistically significance at five per
cent level but with a negative sign. This indicates WACs are characterised with low
index of economic freedom. Therefore, by controlling all other variables included in
the model, one per cent increases in the index of economic freedom causes the per
capita FDI inflows to decrease by $131.01 million at five per cent level. This shows
that less freedom of undertaking an investment and this makes FDI inflows to be
unattractive. Therefore, this is inconsistent with the findings of Quazi (2014) in
which the finding reveals positive relation with FDI inflows.
The coefficient of the quantity of labour in the WACs is statistically
insignificance. Therefore, it does not have any significance influence over FDI per
capita inflows. Despite these countries especially Nigeria has larger population of
about 174 million people which means by implication it would have a large size of
labour force. But unfortunately, most of the labour force are semi-skilled or unskilled
labour, very few portion are skilled labour. Based on the World Bank reports of
2013, Nigeria has the total labour force as 56.2 million out of its total population. In
the global world of technology, where most of the activities are undertake by skilled
labour therefore having small number of skilled labours with the largest number of
unskilled labours this result could be expected. However, this findings contradicts the
results of Habib and Zurawicki (2002) and Hossain, Peters and Keep (2012) this
Habib and Zurawicki (2002) used unemployment to measure the available quantity

89
of labour while Hossain, Peters and Keep (2012) also used labour costs to proxy the
quantity of labour availability not exact quantity of labour used by this study.
Moreover, based on the estimated result it indicates that market size,
corruption level, trade openness, inflation rate, regulatory institutions, infrastructure
and economic freedom are considered as important and significance determinants of
FDI inflows in WACs. In contrast, inflation rate, regulatory institutions,
infrastructure and economic freedom they all have an opposite effects on the level
FDI inflows in WACs. Therefore, countries in WACs are characterized as market-
seeking and efficiency-seeking in terms of the FDI. Thus, the negative estimated
coefficients are attributed due to adverse regional effects (Asiedu 2002).
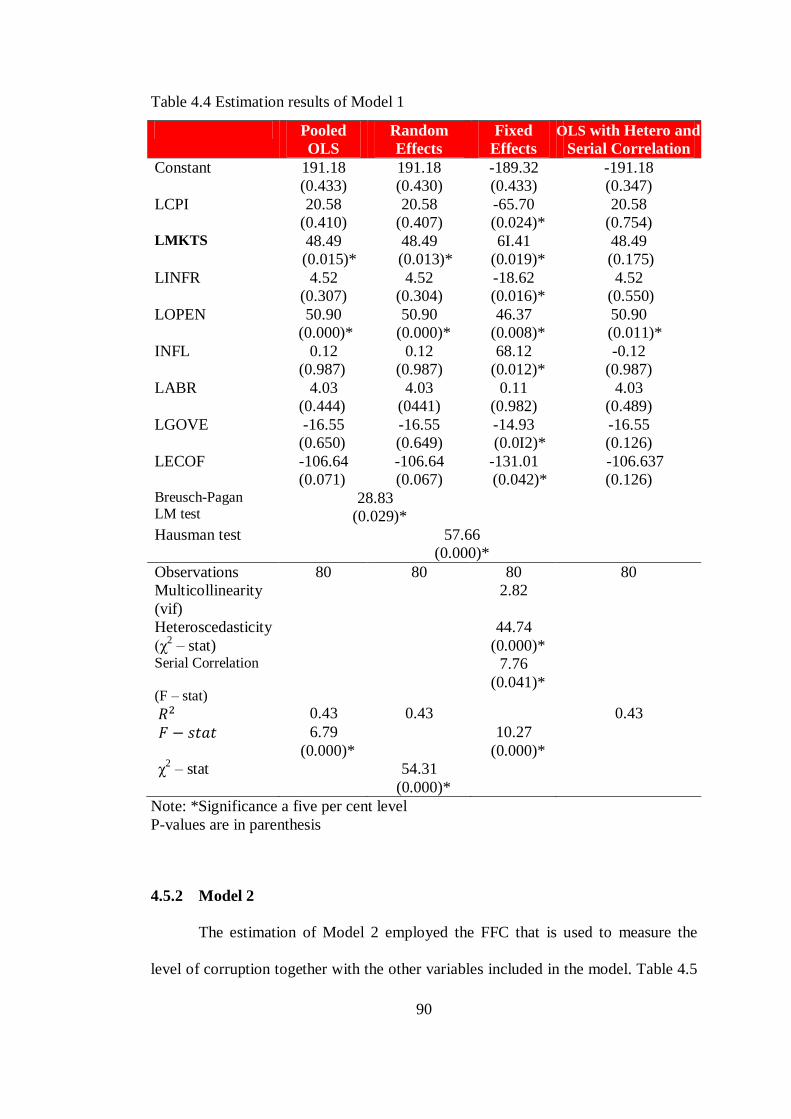
90
Table 4.4 Estimation results of Model 1
Pooled
OLS
Random
Effects
Fixed
Effects
OLS with Hetero and
Serial Correlation
Constant 191.18
(0.433)
191.18
(0.430)
-189.32
(0.433)
-191.18
(0.347)
LCPI 20.58
(0.410)
20.58
(0.407)
-65.70
(0.024)*
20.58
(0.754) LMKTS 48.49
(0.015)*
48.49
(0.013)*
6I.41
(0.019)*
48.49
(0.175)
LINFR 4.52
(0.307)
4.52
(0.304)
-18.62
(0.016)*
4.52
(0.550)
LOPEN 50.90
(0.000)*
50.90
(0.000)*
46.37
(0.008)*
50.90
(0.011)*
INFL 0.12
(0.987)
0.12
(0.987)
68.12
(0.012)*
-0.12
(0.987)
LABR 4.03
(0.444)
4.03
(0441)
0.11
(0.982)
4.03
(0.489)
LGOVE -16.55
(0.650)
-16.55
(0.649)
-14.93
(0.0I2)*
-16.55
(0.126)
LECOF -106.64
(0.071)
-106.64
(0.067)
-131.01
(0.042)*
-106.637
(0.126) Breusch-Pagan LM test
28.83
(0.029)*
Hausman test
57.66
(0.000)*
Observations 80 80 80 80
Multicollinearity
(vif)
2.82
Heteroscedasticity
(χ2 – stat)
44.74
(0.000)*
Serial Correlation
(F – stat)
7.76
(0.041)*
0.43 0.43 0.43
6.79
(0.000)*
10.27
(0.000)*
χ2 – stat 54.31
(0.000)*
Note: *Significance a five per cent level
P-values are in parenthesis
4.5.2 Model 2
The estimation of Model 2 employed the FFC that is used to measure the
level of corruption together with the other variables included in the model. Table 4.5

91
presents the estimation results of Model 2 on the effects of corruption on the inflows
of FDI while CPI was replaced by Freedom from Corruption (FFC) in this analysis.
Moreover, based on the Hausman test result in Table 4.3, it is also suggested that
FEM is more appropriate than REM (i.e. 2 is 37.46 and the probability is also
0.002).
From Table 4.5, the coefficient of FFC is statistically significant at five levels
with negative relationship to FDI inflows. Therefore, by controlling the variables
included in the model, one percent increases in the freedom from corruption causes a
decrease in the per capita FDI by $9.39 million. This estimated result confirmed the
findings of corruption as a “sandy the wheels” approach while CPI was included in
the model. In addition, it is also confirmed that these countries are characterized with
high corruption level. Moreover, this result also that corruption is increasing the cost
of doing thereby increasing uncertainty which discourage FDI inflows. Therefore,
FFC becomes a significant predictor of FDI inflows while controlling other variables
in the analysis in WACs.
Furthermore, with regard to the other independent variables included in the
model, where the coefficient of market size is statistically significant at five percent
level, signified that a one percent increase in market size causes FDI inflows to
increase by $77.72 million all things being equal. The coefficient of trade openness
also is statistically significant at percent level which shows that a one percent
increase leads to $37.11 million increase in per capita FDI into WACs while
controlling all other variables in the model. The countries are characterized with
macroeconomic instability due to the high level of inflation rate, where the
coefficient of inflation is statistically significant at five per cent level. Therefore, one
percent increase in the rate of inflation causes the inflows of FDI to decrease by

92
$60.26 million while other variables included in the model are controlled. However,
in this analysis the coefficient of government effectiveness is also statistically
significant at five per cent. But it has a negative relationship with the level of FDI
inflow per capita thereby confirming the weak institution which these countries in
WACs are characterized with. One per cent increase in the coefficient of government
effectiveness causes a decrease in FDI inflows by $54.32. In comparison between
the estimated results in Table 4.4 and Table 4.5, relatively all the results are almost
similar with the same model of analysis as FEM.

93
Table 4.5 Estimation results of model 2
Pooled
OLS
Random
Effects
Fixed
Effects
OLS with Hetero and
Serial Correlation
Constant 32.60
(0.433)
32.60
(0.433)
-219.39
(0.385)
32.60
(0.813) LFFC -19.43
(0.000)*
-19.43
(0.000)*
-9.39
(0.031)*
19.43
(0.068)
LMKTS 66.69
(0.000)*
66.69
(0.000)*
77.72
(0.003)*
66.69
(0.025)*
LINFR 2.75
(0.575)
2.75
(0.575)
-16.03
(0.510)
2.75
(0.628)
LOPEN 32.04
(0.000)*
32.04
(0.000)*
37.11
(0.036)*
32.04
(0.005)*
INFL 3.16
(0.575)
3.16
(0.575)
60.26
(0.035)*
3.16
(0.330)
LABR 4.71
(0.359)
4.71
(0.359)
-0.35
(0.945)
4.71
(0.220)
LGOVE -23.18
(0.324)
-23.18
(0.324)
-54.32
(0.024)*
-23.18
(0.743)
LECOF -76.6
(0.157)
-76.6
(0.157)
-125.08
(0.060)
-76.6
(0.082)
Breusch-Pagan
LM test
25.92
(0.036)*
Hausman test
37.46
(0.002)*
Observations 80 80 80 80
Multicollinearity
(vif)
2.58
Heteroscedasticity
(χ2 – stat)
86.56
(0.000)*
Serial Correlation (F – stat)
8.536
(0.043)*
0.45 0.45 0.43 0.45
7.21
(0.000)*
9.03
(0.000)*
χ2 – stat 57.70
(0.000)*
Note: *Significance a five per cent level
P-values are in parenthesis
4.5.3 Model 3
The results presented in Table 4.6 are the estimated results of Model 3 while
COC is used in the model instead of CPI or FFC. Based on the Breusch-Pagan LM
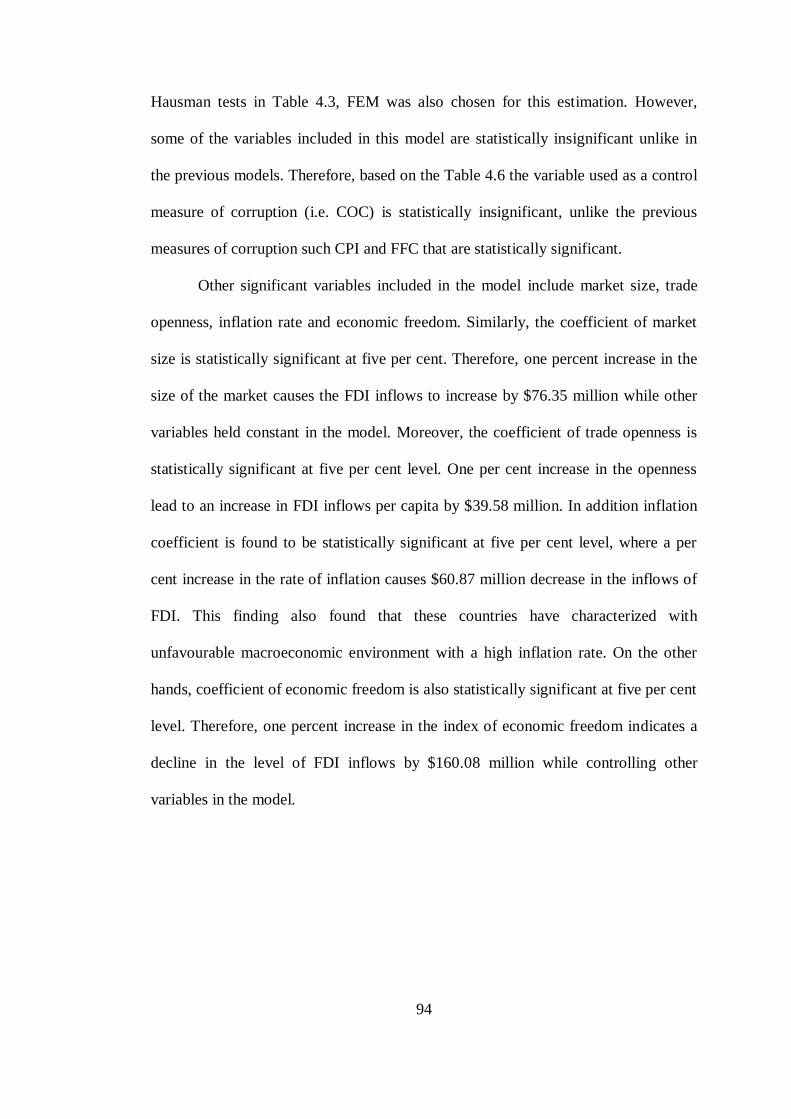
94
Hausman tests in Table 4.3, FEM was also chosen for this estimation. However,
some of the variables included in this model are statistically insignificant unlike in
the previous models. Therefore, based on the Table 4.6 the variable used as a control
measure of corruption (i.e. COC) is statistically insignificant, unlike the previous
measures of corruption such CPI and FFC that are statistically significant.
Other significant variables included in the model include market size, trade
openness, inflation rate and economic freedom. Similarly, the coefficient of market
size is statistically significant at five per cent. Therefore, one percent increase in the
size of the market causes the FDI inflows to increase by $76.35 million while other
variables held constant in the model. Moreover, the coefficient of trade openness is
statistically significant at five per cent level. One per cent increase in the openness
lead to an increase in FDI inflows per capita by $39.58 million. In addition inflation
coefficient is found to be statistically significant at five per cent level, where a per
cent increase in the rate of inflation causes $60.87 million decrease in the inflows of
FDI. This finding also found that these countries have characterized with
unfavourable macroeconomic environment with a high inflation rate. On the other
hands, coefficient of economic freedom is also statistically significant at five per cent
level. Therefore, one percent increase in the index of economic freedom indicates a
decline in the level of FDI inflows by $160.08 million while controlling other
variables in the model.
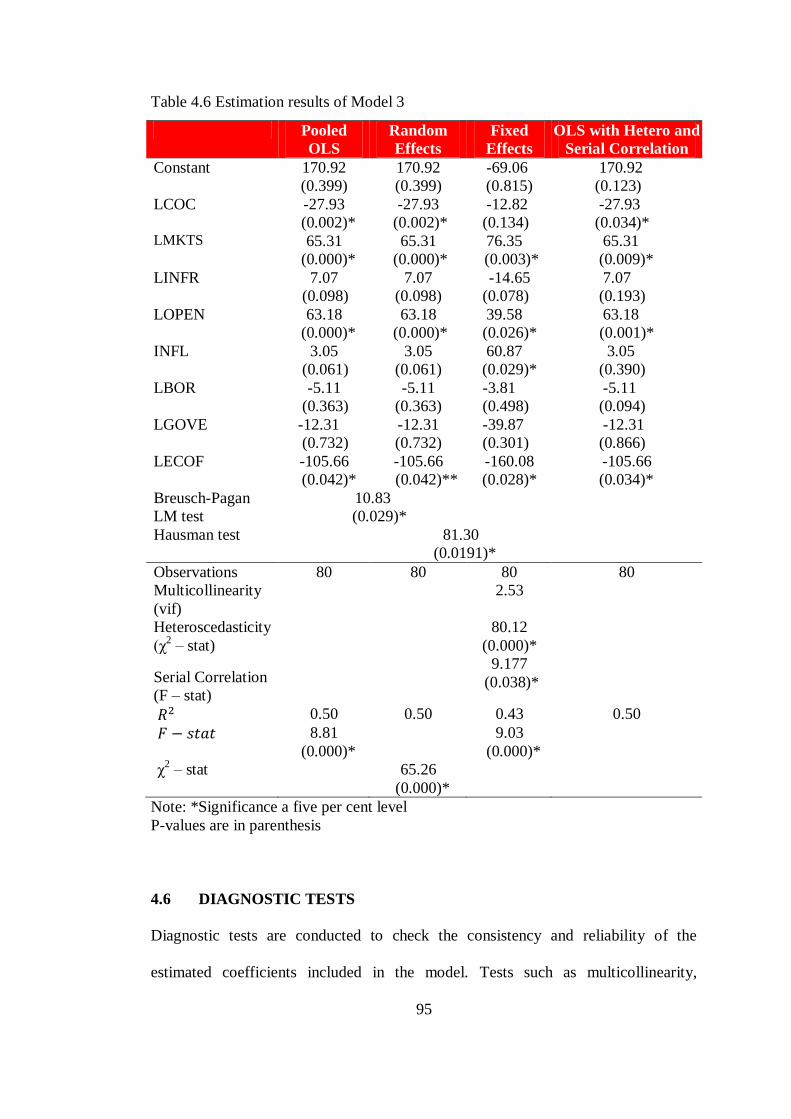
95
Table 4.6 Estimation results of Model 3
Pooled
OLS
Random
Effects
Fixed
Effects
OLS with Hetero and
Serial Correlation
Constant 170.92
(0.399)
170.92
(0.399)
-69.06
(0.815)
170.92
(0.123)
LCOC -27.93
(0.002)*
-27.93
(0.002)*
-12.82
(0.134)
-27.93
(0.034)* LMKTS 65.31
(0.000)*
65.31
(0.000)*
76.35
(0.003)*
65.31
(0.009)*
LINFR 7.07
(0.098)
7.07
(0.098)
-14.65
(0.078)
7.07
(0.193)
LOPEN 63.18
(0.000)*
63.18
(0.000)*
39.58
(0.026)*
63.18
(0.001)*
INFL 3.05
(0.061)
3.05
(0.061)
60.87
(0.029)*
3.05
(0.390)
LBOR -5.11
(0.363)
-5.11
(0.363)
-3.81
(0.498)
-5.11
(0.094)
LGOVE -12.31
(0.732)
-12.31
(0.732)
-39.87
(0.301)
-12.31
(0.866)
LECOF -105.66
(0.042)*
-105.66
(0.042)**
-160.08
(0.028)*
-105.66
(0.034)*
Breusch-Pagan
LM test
10.83
(0.029)*
Hausman test
81.30
(0.0191)*
Observations 80 80 80 80
Multicollinearity
(vif)
2.53
Heteroscedasticity
(χ2 – stat)
80.12
(0.000)*
Serial Correlation
(F – stat)
9.177
(0.038)*
0.50 0.50 0.43 0.50
8.81
(0.000)*
9.03
(0.000)*
χ2 – stat 65.26
(0.000)*
Note: *Significance a five per cent level
P-values are in parenthesis
4.6 DIAGNOSTIC TESTS
Diagnostic tests are conducted to check the consistency and reliability of the
estimated coefficients included in the model. Tests such as multicollinearity,
96
heteroscedasticity and serial or autocorrelation tests conducted and finally a robust
standard error was conducted to clear out the above mentioned problems.
4.6.1 Variance Inflation Factor
Multicollinearity problem is checked throughout the models via the evidence of
variance inflation factor (vif). Based on the results in Table 4.4, Table 4.5 and Table
4.6, vif values are below the value of 10 and this confirmed that these observations
are free multicollinearity problem.
4.6.2 Wald Test
Heteroscedasticity test is conducted using modified Wald test for heteroscedasticity
in FEM regression to check whether heteroscedasticity problem exist. The H0
indicates the observations are homoscedasticity. However, based on the result of χ2
probabilities in all the models, H0 was rejected and conclude that heteroscedasticity
problem exist among these observations.
4.6.3 Wooldridge test
A Wooldridge test was conducted to check whether there is serial or autocorrelation
problem among these observations, where H0 indicates no problem of
autocorrelation. Equally, having tested probabilities we are to reject the H0 and
concludes that these observations also has the problem of serial autocorrelation.
97
4.6.4 Robust standard error test
Having identified the above problem of heteroscedasticity and autocorrelation, robust
standard error was conducted to solve the problems of heteroscedasticity and
autocorrelation among the observations. However, results of diagnostic tests are all
presented in Table 4.3.
4.7 ESTIMATES THE FDI INFLOWS FOR THE SPCIFIC COUNTRY
Several measures of corruption have been introduced together with other
independent variables included in the model in order to examine the inflows of FDI
into the specific countries namely; Gmabia, Ghana, Liberia, Nigeria and Sierra
Leone over the sampled periods. Lastly, a joint tests for specific country effect as
well as time effect acould be conducted for the consistency of the FEM. Moreover,
for the specific country effect, null hypothesis is that countrires does not have any
effect while the null hypothesis for time effect is that there are no time effect (i.e.
time invariant). Therefore, based on this analysis, Gambia is considered as a
reference country.
4.7.1 Model 4
In this model, Gambia is regarded as a country to which reference could be made in
order to observe the inflow of FDI into specific country in relation to the measure of
corruption as CPI. This result make the pooled OLS regression in Table 4.4 to be
suspect. Therefore, the coefficieint of the FDI inflows into Ghana is statistically
significant at five per cent level. This shows the FDI inflows into Ghana is higher by
$54.74 million as compared with that for Gambia. Similarly, Liberian coefficient of

98
FDI inflows is strongly and statistically significant at five per cent level. This result
indicates that FDI inflows into Liberia is higher than that of Gambia by $26.44
million. The coefficient of FDI inflows for Nigeria is statistically at five per cent
level. In addition, Nigeria has attracted the largest amount of FDI inflows as
compared to Gambia by receiving $79.36 million. However, the coefficient of FDI
for Sierra Leone is statistcally significant at five. But Sierra Leone among these
countries is receiving lower amount of $16.01 million FDI inflows than Gambia.
Therefore, these results can be shown in Table 4.7
Table 4.7 Estimation results of Model 4
Note: Note: *Significance a five per cent level
4.9.2 Model 5
Model 5 shows the results of FDI inflows for the specific countires in relation to the
measure of corruption as FFC. In this result also Gambia is considered as a country
of reference, in terms of the inflow of FDI for a specific country. The results in Table
4.7 indicates that FDI inflows into these countries is strongly and statistically
Variables Coefficient Std. Error t-statistic P-value
CONSTANT 179.3 239.4 -0.75 0.456
LCPI -65.70 28.37 2.32 0.024*
LMKTS 61.41 25.47 2.41 0.019*
LINFR -18.62 7.554 -2.46 0.016*
LOPEN 46.37 17.10 2.71 0.008*
LINFL 68.12 26.41 2.58 0.012*
POPG 0.107 4.818 0.02 0.982*
LGOVE -41.93 16.25 2.58 0.012*
LECON -131.0 63.06 -2.08 0.042*
GHANA 54.75 23.17 2.36 0.021*
LIBERIA 26.44 11.79 2.24 0.031*
NIGERIA 79.36 36.24 2.19 0.037*
SIERRA LEONE -16.01 5.45 -2.94 0.015*
R-squared 0.624
F-statistic 9.28 0.000
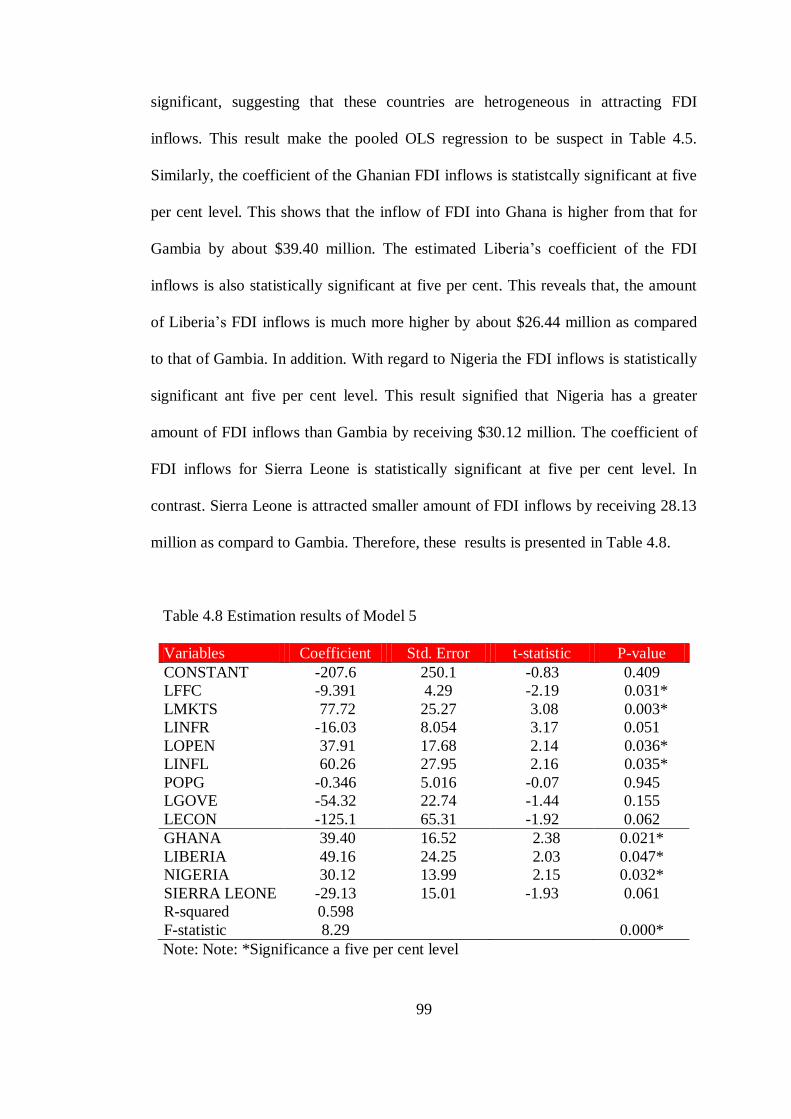
99
significant, suggesting that these countries are hetrogeneous in attracting FDI
inflows. This result make the pooled OLS regression to be suspect in Table 4.5.
Similarly, the coefficient of the Ghanian FDI inflows is statistcally significant at five
per cent level. This shows that the inflow of FDI into Ghana is higher from that for
Gambia by about $39.40 million. The estimated Liberia’s coefficient of the FDI
inflows is also statistically significant at five per cent. This reveals that, the amount
of Liberia’s FDI inflows is much more higher by about $26.44 million as compared
to that of Gambia. In addition. With regard to Nigeria the FDI inflows is statistically
significant ant five per cent level. This result signified that Nigeria has a greater
amount of FDI inflows than Gambia by receiving $30.12 million. The coefficient of
FDI inflows for Sierra Leone is statistically significant at five per cent level. In
contrast. Sierra Leone is attracted smaller amount of FDI inflows by receiving 28.13
million as compard to Gambia. Therefore, these results is presented in Table 4.8.
Table 4.8 Estimation results of Model 5
Variables Coefficient Std. Error t-statistic P-value
CONSTANT -207.6 250.1 -0.83 0.409
LFFC -9.391 4.29 -2.19 0.031*
LMKTS 77.72 25.27 3.08 0.003*
LINFR -16.03 8.054 3.17 0.051
LOPEN 37.91 17.68 2.14 0.036*
LINFL 60.26 27.95 2.16 0.035*
POPG -0.346 5.016 -0.07 0.945
LGOVE -54.32 22.74 -1.44 0.155
LECON -125.1 65.31 -1.92 0.062
GHANA 39.40 16.52 2.38 0.021*
LIBERIA 49.16 24.25 2.03 0.047*
NIGERIA 30.12 13.99 2.15 0.032*
SIERRA LEONE -29.13 15.01 -1.93 0.061
R-squared 0.598
F-statistic 8.29 0.000*
Note: Note: *Significance a five per cent level
100
4.9.3 Model 6
Like the way it has been shown in the previous models, Gambia is also consider as
a reference country which comperison could be made, in terms of the inflow of FDI
for a specific country while taking COC as a measure of corruption level. The
estimated results is presented in Table 4.9 this indicates FDI inflows for these
countries is statistically and strongly significant, suggesting that these countries
received different amount of FDI inflows into their economy. This result make the
pooled OLS regression to be suspect presented in Table 4.6. Indeed, coefficient of
FDI inflows for is statistically significant at five per cent level. Therefore, FDI
inflows into Ghana as compared with Gambia is higher by about $39.61 million.
While the coefficient of FDI inflows for Liberia is statistically significant at five per
cent level. In addition Liberia’s FDI inflows is also higher with about $37.47 million
in relation to Gambia. Similarly, Nigeria’s coefficient is statistically significant at
five level. Therefore, Nigeria’s FDI inflows with regard to Gambia in terms of
receiving FDI inflows is higher by about $25.13 million. The FDI inflows coefficient
of Sierra Leone is statistically significant at five per cent level. This indicates that,
still Sierra Leone is receiving lower amount of FDI inflows than Gambia as $11.01
million among these countries. Therefore, this result can be shown in Table 4.9.
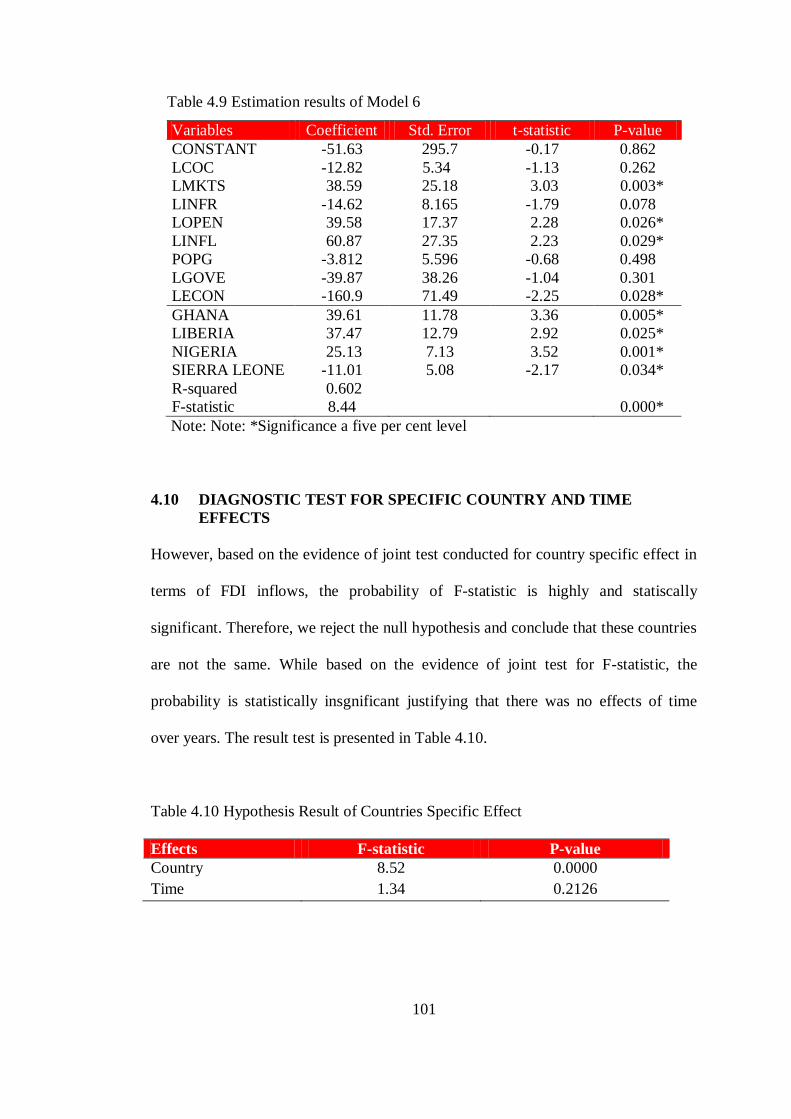
101
Table 4.9 Estimation results of Model 6
Variables Coefficient Std. Error t-statistic P-value
CONSTANT -51.63 295.7 -0.17 0.862
LCOC -12.82 5.34 -1.13 0.262
LMKTS 38.59 25.18 3.03 0.003*
LINFR -14.62 8.165 -1.79 0.078
LOPEN 39.58 17.37 2.28 0.026*
LINFL 60.87 27.35 2.23 0.029*
POPG -3.812 5.596 -0.68 0.498
LGOVE -39.87 38.26 -1.04 0.301
LECON -160.9 71.49 -2.25 0.028*
GHANA 39.61 11.78 3.36 0.005*
LIBERIA 37.47 12.79 2.92 0.025*
NIGERIA 25.13 7.13 3.52 0.001*
SIERRA LEONE -11.01 5.08 -2.17 0.034*
R-squared 0.602
F-statistic 8.44 0.000*
Note: Note: *Significance a five per cent level
4.10 DIAGNOSTIC TEST FOR SPECIFIC COUNTRY AND TIME
EFFECTS
However, based on the evidence of joint test conducted for country specific effect in
terms of FDI inflows, the probability of F-statistic is highly and statiscally
significant. Therefore, we reject the null hypothesis and conclude that these countries
are not the same. While based on the evidence of joint test for F-statistic, the
probability is statistically insgnificant justifying that there was no effects of time
over years. The result test is presented in Table 4.10.
Table 4.10 Hypothesis Result of Countries Specific Effect
Effects F-statistic P-value
Country 8.52 0.0000
Time 1.34 0.2126
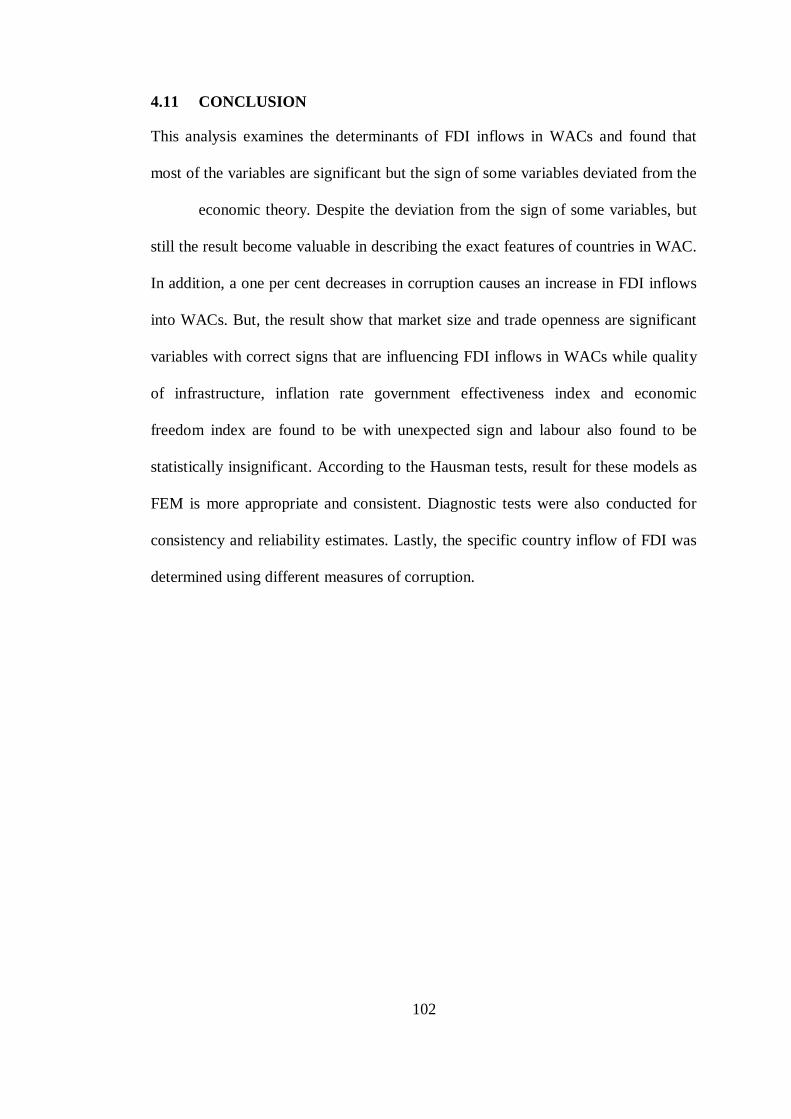
102
4.11 CONCLUSION
This analysis examines the determinants of FDI inflows in WACs and found that
most of the variables are significant but the sign of some variables deviated from the
economic theory. Despite the deviation from the sign of some variables, but
still the result become valuable in describing the exact features of countries in WAC.
In addition, a one per cent decreases in corruption causes an increase in FDI inflows
into WACs. But, the result show that market size and trade openness are significant
variables with correct signs that are influencing FDI inflows in WACs while quality
of infrastructure, inflation rate government effectiveness index and economic
freedom index are found to be with unexpected sign and labour also found to be
statistically insignificant. According to the Hausman tests, result for these models as
FEM is more appropriate and consistent. Diagnostic tests were also conducted for
consistency and reliability estimates. Lastly, the specific country inflow of FDI was
determined using different measures of corruption.

103
CHAPTER FIVE
CONCLUSION AND POLICY IMPLICATION
5.1 INTRODUCTION
This chapter consist of four sections such as the general overview of the study,
summary of the findings, policy implications, limitation of the study and then
conclusion of the chapter.
5.2 SUMMARY OF THE FINDINGS
Ultimately, there are theoretical and empirical studies conducted to examines the
factors that determine the level of FDI inflows. Therefore, one of the famous and
widely accepted theory of FDI was adopted for this study known as Eclectic theory.
The Eclectic Paradigm modelling was adopted and applied to identify the factors that
are influencing the FDI inflows in WACs. The result confirmed the validity of the
model and it is consistent with the previous studies. However, Most of the growth
and development scholars asserted that there is an adversely effects of corruption on
growth and development because it causes loss of tax revenue to the government,
inadequate productivity, economic transaction uncertainty, misallocation of resources
and overall deterioration of infrastructure. Generally, it is simple to examined
corruption ill effects on economic growth and development. Moreover, this study
examines the effect on whether corruption could be beneficial or delicious on FDI
inflows to the targeted countries of WACs. Moreover, according to many scholars
the impact of corruption can either be “grabbing hand” or “helping hand” approach
on FDI inflows. Therefore, by grabbing hand approach of corruption, corruption
104
deters FDI inflows due to the rigidity of regulatory institutions. Thus, corruption is
considered as delicious to the inflows of FDI. While helping approach of corruption
consider corruption as the lubricating element that encourage more FDI inflows by
compensating the bad government due to the weaknesses of the regulatory
institutions. Therefore, corruption is viewed as beneficial to FDI inflows.
However, the estimation of the model with the selection of the
macroeconomic variables was careful in accordance with the reviewed literature.
Obviously, the variables that are considered as the determinants of FDI inflows, such
as corruption level, market size (MKTS) in which GDP per capita was used to
measure it, infrastructure (INFR) measured by telephone lines and mobile
subscribers per 100 people. Moreover, trade openness of the country (OPEN),
inflation rate (INFL) this was used to measure the changes in the price level of goods
and services and macroeconomic stability, quantity of labour (LBOR), government
effectiveness (GOVE) which is used to measure regulatory institutions and economic
freedom (ECOF) which is used as a measure of investment climate. The benchmark
model that consistent with this analysis is FEM. All the explanatory variables are
significant at five per cent level except labour. Only corruption, market size and trade
openness are consistent with their expected signs. But variables such as
infrastructure, inflation, government effectiveness and economic freedom are found
deviated from their expected signs. Indeed, the coefficients of corruption are found to
be negative and significant. This means FEM shows that a five per cent decrease in
CPI holding all the other variables included in the model constant causes an
approximately $65.70 million increase in the level of inflows in FDI in WACs. Thus,
the more country control for corruption level, the more it can expect to attract more
FDI inflows.
105
Similarly, the result of government effectiveness confirmed that WACs are
characterized with very weak regulatory institutions which created an artificial
distortion and institutional gap in attracting more FDI inflows. Infrastructure, on the
other hand, found to be discouraging the attractiveness of more FDI inflows because
it was poorly provided, then the WACs’ economy found to be highly volatile due to
macroeconomic instability which indicates that a one per cent increase in the level of
inflation causes about $68.12 million decline in FDI inflows. Therefore, high
inflation rate lead to a high cost of production which resulted to low in investment
and hence the FDI inflows decrease. Moreover, as a result of macroeconomic
instability the investment climate which is measured by economic freedom causes a
much decline in FDI inflows, because as one per cent increase in economic freedom
index leads to a fall in FDI inflows approximately by $131.01 million. However, the
economy in WACs characterized with highly potential demand for goods and
services that measure by market size, which despite the vulnerability of the
macroeconomic environment but still the economy is attracting more FDI inflows to
the regions. The economy is also found to be opened to trade with the rest of world.
For all that, level of corruption, market size, trade openness, government
effectiveness and economic freedom are strongly influenced FDI inflows in WACs
and they are considered as the main determinant of FDI inflows in WACs.
The argument of corruption as a “helping hand” of business can disappear if
the governments in WACs have very strong and efficient policies. Though it may be
possible for well-established foreign company to offer a bribe when awarded with a
high-priced contract, where this can only be good if they are not caught, but once
caught the benefits would disappear and then the cost would kick in and then make it
106
a curse for those who involved. Accountability and transparency, good governance,
can resolve in highly remarkable inflows of FDI.
5.3 LIMITATION OF THE STUDY
A significant limitation for this study was inaccessibility of genuinely quantitative
data of the variables recommended in the theoretical models and based on the
impacts of some relevant variables in WACs. Therefore, the study was able to focus
on only five countries within the periods of 15 years-time frame. The research, still
having the problem of dealing with missing data that lead to be imputed for keeping
reasonable important observations for the robust analysis. But equally, this problem
is not fundamentally that could influence the present result in this study. The
research on the other hand, utilizes the perceived corruption index from TI, freedom
from corruption from WGI and control of corruption from Heritage foundation, as
measures of corruption level. The index is basically on the perception level not in
term of the actual level of corruption, according to Mauro (1995) one of the major
problem while dealing with corruption data is to find the actual quantifiable figure
for corruption level. Though, these measures make the corruption to be quantifiable
but it has been criticized by many scholars as unreliable and ambiguity index
(Primorac, Primorka, & Smoljic, 2011).
5.4 POLICY IMPLICATION
The theoretical and empirical literature both ascertain that there are remarkable
benefits that could be derived from FDI inflows, if per se these countries could adopt
a policy which can reduce and maintain the level of corruption in their economy as
well as enhancing favourable macroeconomic environment. Because in terms of

107
corruption, decrease in the corruption level would lower the cost of undertaking
business and reduce uncertainty in investment and perhaps this could facilitate more
inflows of FDI. Theoretically, paying bribes to the corrupt bureaucrats (i.e.
government bureaucrats) and domestic business elites by the foreign investors, for a
favour like issuance of investment licenses, police protection, permits, reduce and tax
assessment, it can definitely add more costs of doing business which impedes more
FDI inflows. Therefore, policy recommendation should be based on the empirical
result of this study. The following are the policy recommendation of this study.
i. The result found that corruption level is the very important determinant factor
in explaining the changes of FDI inflows. Therefore, governments in WACs
should put in place a considerable reforms that can ginger the anti-corruption
commissions and then initiate the new once in support for fighting against
corruption and to organize public awareness and enlightenment about the
effects and disastrous consequences on their life and the economy at large.
The government should enact a strict laws that would deal whoever happens
to convict with corruption case.
ii. The stakeholders need to understand the role of institutions and put more
emphasis on the public service awareness by organizing workshops,
seminars, based on the role played by regulatory institutions in the local and
international business environment. Therefore, there is also the need for
frequent institutional reforms with the prevailing condition in an attempt to
facilitate the functions and activities of these institutions thereby strengthen
the regulatory institutions that could lead to get strong institutions as well as
more FDI inflows.
108
iii. The respective governments should put in place very sound liberalization
trade policies that would facilitate the activities of foreign investors due to the
crucial benefits that could be generated from larger amount of FDI inflows.
Such policies that would ensure removing trade restrictions that should ease
foreign investors to move capital in and out from country for the purpose of
trading activities. The respective government also should adopt policies that
would ensure banking standard and international accounting.
iv. The respective should initiate policies that could curb the high rate of
inflation to sustain the macroeconomic environment stability which would
keep investment profitable and then attract more foreign investors into such
an economy. Because high inflation rate is a sign of macroenonmic instability
that would increase the uncertainty and user cost of capital which could
influence the profitability of foreign investor adversely.
v. It is recommended for the governments in WACs to ensure law and order
enforcement that will bring peaceful coexistence among the populace and
which could not advances into future civil war that could culminate the
economic activities that would affects FDI inflows adversely.
5.5 SUGGESTION FOR FUTURE STUDY
This study has many potential for the extension of future research. Therefore, this
research utilizes the traditional panel data analysis to evaluate the impacts of
corruption on FDI inflows in WACs. Similarly, it is suggested for the purpose of
future research to utilize the panel dynamic ordinary least square to examines
whether short run or long run relationship exist between corruption and FDI inflows

109
into WACs. Likewise, to investigate where there is causation from corruption to FDI
or FDI to corruption (i.e. unidirectional or bidirectional causation).
Furthermore, this study was able to examine the determinants of FDI inflows
only on the five targeted WACs. Therefore, it is suggested for the future study to
cooperate both the targeted as well as source countries effects of these factors, to
examine whether there significance influence over FDI inflows from both targeted
and source countries. Also the future study can focus to evaluate the effects of
corruption on inflows of FDI on at least many countries from the WACs for
robustness of the findings.
5.6 CONCLUSION
Previously, the effects of corruption and other variables included in this study on
economic transactions have received greater attention. The effects of corruption in
the targeted countries is considered as the most influential and deterministic factor of
FDI inflows in terms of location. Several empirical studies have able to provide a
negative evidence of the relationship between FDI inflows and corruption, but others
were unable to find such relationship. However, most of the previous studies where
based on the cross-country analysis while neglecting the individual specific effects of
individual countries with which corruption level is correlated. Therefore, empirical
analysis of this study is consistent with the previous studies and was able to utilized
individual countries’ specific effect and concludes that the corruption in the targeted
countries (WACs) does not reduce the amount of FDI inflows and hence corruption
is considered as greasing the wheels approach of FDI inflows in WACs. Moreover,
greater market size for the potential market that measured by GDP per capita as well
110
as trade openness are found to be more important in attracting more FDI inflows. But
variables like inflation, infrastructure, government effectiveness, and economic
freedom are negatively related to FDI. This suggests WACs are characterized with
the problem of poor infrastructural facilities, weak regulatory institutions and
unstable macroeconomic business environment.

111
REFERENCES
Abu Nurudeen, O. Wafure. G. and Abdulla. U. (2010). On the causal links between
foreign direct investment and economic growth in Nigeria, 1970-2008: An
application of granger causlity and co-integration techniques. Romanian
Statistic Review Nr., (3), 1 − 10.
Aidit, T. S. (2014). Review by : toke s . aidt economic analysis of corruption: A
survey. The Economic Journal, 113(3), 632 – 652.
Alemu, A. M. (2012). Effects of corruption on FDI inflow in Asian economies. Seoul
Journal of Economics, 25(4), 387 – 412.
Alemu, A. M. (2013). The effect of corruption on FDI inflow: Emperical evidence
from Asian economies. Global Conference on Business and Finance
Proceedings, 8(1), 280–289.
Al-Sadiq, A. (2009). The effects of corruption on FDI Inflows. Cato Journal, 29(2),
267 – 294.
Anderson, J. E. (2011). The gravity model. Annual Review of Economics, 3, 1–45.
Anghel, B. (2005). Do institutions affect foreign direct investment? International
Doctorate in Economic Analysis University Autonoma DE Barcerlona, (10), 1–
40.
Anyanwu, J. C. (2006). Promoting of investment in Africa. African Development
Review, 18(4), 42–72.
Anyanwu, J. C. (2011). Determinants of foreign direct investment inflows to Africa
1980-2007. African Development Bank Group Working Paper, 136(9), 1–32.
Asiedu, E. (2002). On the Determinants of Foreign Direct Investment to Developing
Countries : Is Africa Different ? World Development, 30(1), 107–119.
Asiedu, E. (2005). Foreign direct investment in africa: The role of natural resources,
market size, government policy, institutions and political instability. Social
Science Research Network, (5), 1–24.
Asiedu, E. (2006). Foreign Direct Investment in Africa: The Role of Natural
Resources, Market Size, Government Policy, Institutions and Political
Instability. World Economy, 29(1), 63 – 77.
Asiedu, E. (2013). Foreign direct investment, natural resources and institutions.
Working Paper International Growth Center, (3), 1 – 38.
Asiedu, E., Jin, Y., & Nandwa, B. (2009). Does foreign aid mitigate the adverse
effect of expropriation risk on foreign direct investment? Journal of
International Economics, 78(2), 268–275.

112
Asiedu, E., & Lien, D. (2011). Democracy, foreign direct investment and natural
resources. Journal of International Economics, 84(1), 99–111.
Asterious, D., & Hall, S. G. (2011). Applied econometrics (2nd ed.). Palgrave
Macmillan.
Aw, T., & Tang, T.-C. (2010). The Determinats of inward foreign direct investment:
The case of Malaysia. International Journal of Business and Society, 11(1), 59–
76.
Azman-Saini, W. N. W., Baharumshah, A. Z., & Law, S. H. (2010). Foreign direct
investment, economic freedom and economic growth: International evidence.
Economic Modelling, 27(5), 1079–1089.
Baltagi, B. H. (2008). Econometric analysis of panel data. (4th ed.). New York: John
Wiley & Sons, Ltd.
Bartels, F. L., Kratzsch, S., & Eiccher, M. (2008). Foreign direct investment in sub-
saharan africa: Determinants and location decisions. UNIDO, 1–46.
Baxamusa, M., & Jalal, A. (2014). The effects of corruption on capital structure:
When does it matter? The Journal of Developing Areas, 48(1), 315–335.
Bellos S.K., (2010). Institutional, economic and regional determinants of foreign
direct investments in the Balkan, Central European and ex-Soviet transition
economies Unpublished manuscript, University of Bath.
Bellos, S., & Subasat, T. (2011). Corruption and foreign direct investment: A panel
gravity model approach. Bulletin of Economic Research, 64(4), 565–575.
Bellos, S., & Subasat, T. (2012). Governance and foreign direct investment: a panel
gravity model approach. International Review of Applied Economics, 26(3),
303–328.
Bennett, R. D. (2005). The determinant of FDI in sub-Saharan Africa, 1–25.
Bhagwati J.N. (1978). Anatomy and consequences of exchange control regimes.
Studies in International Economic Relations (New York: National Bureau of
Economic Research), 1.
Bliss, C., & Tella, R. Di. (1997). Does competition kill corruption? Chicago
Journals, 105(5), 1001–1023.
Brada, J. C., Drabek, Z., & Perez, M. F. (2012). The effect of home-country and
host-country corruption on foreign direct investment. Review of Development
Economics, 16(4), 640–663.
Brainard, S. L. (1997). An empirical assessment of the proximity-concentration
trade-off between multinational sales and trade. American Economic Review,
87(4), 520–544.
113
Breen, M., & Gillanders, R. (2012). Corruption, institutions and regulation.
Economics of Governance, 13(3), 263–285.
Buckley, P. J., & Casson, M. C. (1998). Analyzing extending foreign the market
entry strategies: Internalization approach. Journal of International Business
Studies, 29(3), 539–561.
Budima, G. (2006). Can corruption and economic crime be controlled in developing
economies, and if so, is the cost worth it? Journal of Financial Crime, 13(4),
408–419.
Canning, D., & Bennathan, E. (2000, November 30). The social rate of return on
infrastructure investments. Working Paper Series No 2930, World Bank
Washington DC. The World Bank.
Christopher, J., & Watson, A. (2004). Corruption and change : The impact of foreign
direct investment. Strategic Management Journal, 396(11), 385–396.
Corner, K. R. (1991). A historical comparison of resource-based theory and five
schools of thought within industrial organization economics: Do we have a new
theory of the firm? Journal of Management, 17(1), 121–154.
Cuervo-cazurra, A. (2008). Better the devil you don’t know: Types of corruption and
FDI in transition economies. Journal of International Management, 14(1), 12–
27.
Cuervo-cazurra, A., & Genc, M. (2008). Transforming developed disadvantages
MNEs countries into advantages: In the least Developed countries. Journal of
International Business Studies, 39(6), 957–979.
Daude, C., & Stein, E. (2007). The Quality of institutions and foreign direct
investment. Economics and Politics, 19(3), 317–345.
Davidson, W. H. (1980). Effects of foreign direct yhe location activity: Country
characteristics investment effects. Journal of International Business Studies,
11(2), 9–22.
DE Mello, L. R. (1997). Foreign direct ivestment in developing countries and
growth: a selective survey. Journal of Development Studies, 34(1), 1 – 34.
Deardorff, A. (1998). Determinants of bilateral trade: does gravity work in a
neoclassical world ? The regionalization of the world economy, Jeffrey A.
Frankel, ed., University of Chicago Press. (7–32).
Dion, M. (2010). What is corruption corrupting? A philosophical viewpoint. Journal
of Money Laundering Contro, 13(1), 45 – 54.
Dreher, A., & Gassebner, M. (2011). Greasing the wheels? The impact of regulations
and corruption on firm entry. Public Choice, 155(3-4), 413–432.

114
Dunning, J. H. (1979). Explaining changing patterns of international production: In
defense of the eclectic theory. Oxford Bulletin of Economics and Statistics,
41(3), 269–295.
Dunning, J. H. (1980). Toward an eclectic theory of international production: Some
emperical tests. Journal of International Business Studies, 11(1), 9–31.
Dunning, J. H. (1988). The eclectic paradigm of international the eclectic production:
A restatement and some possible extensions. Journal of International Business
Studies, 19(1), 1–31.
Dunning, J. H. (2000). The eclectic paradigm as an envelope for economic and
business theories of MNE activity. International Business Review, 9, 163–190.
Dunning, J. H., & Rugman, A. M. (1985). The Influence of Hymer’s dissertation on
the theory of foreign direct investment. American Economic Association, 75(2),
228–232.
Egger, P., & Winner, H. (2005). Evidence on corruption as an incentive for foreign
direct investment. European Journal of Political Economy, 21(4), 932–952.
Ernst, & Youg. (2012). Growing beyond. Africa by numbers: Accessing market
attractiveness in Africa. Retrieved from http://emergingmarkets.ey.com/wp-
content/uploads/downloads/2012/11/Ernst-Young-Africa-by-Numbers-
2012.pdf.
Ernst, & Young. (2012). Transparency international corruption perceptions index, the
global coalition against corruption. 1-12
Freckleton, M., Wright, A., & Craigwell, R. (2013). Economic growth, foreign direct
investment and corruption in developed and developing countries. Journal of
Economic Studies, 39(6), 639–652.
Freenstra, R., & Kee, H. L. (2004). On the measurement of product variety in trade.
American Economic Review, 94(3), 145–149.
Gujarati, D. N., & Porter, C. P. (2009). Basic econometris (9th ed.). McGraw-Hills,
New York.
Habib, M., & Zurawicki, L. (2002). Corruption and foreign direct investment.
Journal of International Business Studies, 33(2), 291–307.
Hassen, S., & Anis, O. (2012). Foreign direct investment (FDI) and economic
growth: An approach in terms of cointegration for the case of Tunisia. Journal
Applied Finance & Banking, 2(4), 193–207.
Head, K. (2003). Gravity for beginners. Journal of International Economics, 42(1):
1-19.
Hirsch, S. (1976). An international trade and investment theory of the firm. Oxford
Economic Papers, New Series, 28(2), 258–270.
115
Hossain, T., Peters, S., & Keep, W. (2012). Corruption and foreign direct investment:
The moderating effect of bilateral tax treaties. IJBIT, 4(3), 40–49.
Hymer, S. H. (1976). The international operations of national firms: A study of direct
foreign investment. The MIT Press Cambridge Massachusetts and London,
England.
IMF (2004) Foreign Direct Investment Statistics: (Washington). Retrieve from
http://www.imf.org/External/NP/sta/bop/pdf/diteg20.pdf
IMF. (2009). World economic outlook crisis an recovery. Retrieved from
http://www.imf.org/external/pubs/ft/weo/2009/01/pdf/text.pdf. In World
Economic and Financial Survey.
Javorcik, B. S. (2004). Does foreign direct investment increase the productivity of
domestic firms? In search of spillovers through backward linkages. The
American Economic Review, 94(3), 605–627.
John, M. (1995). National borders matter: Canada-U.S. regional trade patterns. The
American Economic Review, 85(3), 615–623.
Khamfula, Y. (2007). Foreign direct investment and economic growth in EP and IS
countries: The role of corruption. The World Economy, 30(12), 1843–1854.
Kinda, T. (2014). The Quest for Non-Resource-Based FDI: Do Taxes Matter? IMF
Working Papers, 14(15), 1–24.
Kindleberger, C. P. (1969). American Business Abroad. New Haven: Yale University
Press.
Knack, S., & Keefer, P. (1995). Institutions and economic performance: cross-
country tests using alternative institutional measures. Economics and Politics,
7(9), 207–227.
Kusum W. Ketkar, A. M. and S. L. K. (2005). Impact of corruption on foreign direct
investment and tax revenues. Journal of Public Budgeting & Financial
Management, 17(3), 313–342.
Larraín, F., & Tavares, J. (2004). Does foreign direct investment decrease corruption.
Cuadernon De Economia, 41(8), 217–230.
Lawal, G. (2007). Corruption and development in africa : challenges for political and
economic change. Humanity and Social Sciences Journal, 2(1), 1–7.
Leff, N. H. (1964). Economic development through bureaucratic corruption.
American Behavioural Scientiest, 8(3), 8–14.
Leon, Z., & Habib, M. (2002). Corruption and foreign direct investment. Journal of
International Business Studies, 33(2), 291–307.

116
Li, H., Xu, L. C., & Zou, H. (2000). Corruption, income distribution, and growth.
Economics and Politics, 12(2), 155–182.
Linden, M., & Ledyaeva, S. (2006). Testing for foreign direct investment gravity
model for russian regions 32, 1–28. Retrieved from
http://epublications.uef.fi/pub/urn_isbn_952-458-782-3/urn_isbn_952-458-782-
3.pdf
Liu, Z. (2008). Foreign direct investment and technology spillovers: Theory and
evidence. Journal of Development Economics, 85(1-2), 176–193.
Lui, F. T. (1983). An equilibrium queueing model of bribery. Center For Economic
Research, 185(9), 1–32.
MacDougall G.D.A. (1960). The benefits and costs of private investment from
abroad: a theoretical approach. Bulletin of the Oxford University Institute of
Economics & Statistics, 22(3), 189–211.
Mathur, A. (2007). Foreign direct investment, corruption , and democracy. American
Enterprise Institute for Public Policy Reseach Working Paper, (15), 1 – 49.
Mathur, A., & Singh, K. (2013). Foreign direct investment, corruption and
democracy. Applied Economics, 45(12), 991 – 1002.
Mauro, P. (1995). Corruption and growth. Quarterly Journal of Economics, 110(3),
681–712.
Mauro, P. (1997). “The Effects of corruption on growth, investment, and government
expenditure: a cross-country analysis.” In Corruption in the Global Economy,
ed. by Kimberly Ann Elliott (Washington: Institute for International
Economics).
Mauro, P. (1998). Corruption and the composition of government expenditure.
Journal of Public Economics, 69(2), 263–279.
Mauro, P. (2004). The persistence of corruption and slow economic growth.
International Monetory Funds Staff Paper, 51(1), 1–18.
Michalowski, T. (2012). Foreign direct investment in sub-Saharan Africa and its
effects on economic growth of the region. Institute of International Business
University of Gdansk Working Paper, (31), 687 – 701.
Morisset, J. (2000). foreign direct investment in africa: policies also matter
Transnational Corporations 9(2), 107–125.
Mudambi, R., Navarra, P., & Delios, A. (2012). Government regulation, corruption,
and FDI. Asia Pacific Journal of Management, 30(2), 487–511.
Mundell, R. A. (1957). AssociationInternational trade and factor mobility. American
Economic Review, 47(3), 321–335.
117
Mwenda, K. K. (2011). Public international law and the regulation of diplomatic
immunity in the fight against corruption. Pretoria University: Law Press.
Naudé, W. a., & Krugell, W. F. (2007). Investigating geography and institutions as
determinants of foreign direct investment in Africa using panel data. Applied
Economics, 39(10), 1223–1233.
Navaretti, G. B., & Castellani, D. (2004). Investments abroad and performance at
home: evidence from italian multinationals. Retrieved from
www.cepr.org/pubs/dps/DP4284.asp.
Okurut, F. N., Narayana, N., & Chidozie, N. (2012). Determinants of foreign direct
investment in economic community of west african states. International Journal
of Economics and Business Studies, 2(1), 26–36.
Onakoya, A. B. (2012). Foreign direct investments and economic growth in nigeria :
a disaggregated sector analysis. Journal of Economics and Sustainable
Development, 3(10), 66–75.
Onyeiwu, S., & Shrestha, H. (2004). Determinants of foreign direct investment in
africa. Journal of Developing Societies, 20(1-2), 89–106.
Paniagua, J. (2011). FDI gravity equation: Models, estimations and zeros, 1(5), 1 –
52.
Porters, S. P. and L. S. V. (2010). Corruption and foreign direct investment. Franklin
Business & Law Journal, (4), 92 – 97.
Primorac, D., Primorka, L., & Smoljić, M. (2011). Impact of corruption on foreign
direct investment. Megatrend Review, 8(2), 169–190.
Pupovic, E. (2012). Corruption’s effect on foreign direct investment – the case of
montenegro. Journal of Economics and Business, 10(2), 13 – 28.
Quazi, R. (2007). Economic freedom and foreign direct investment in East Asia.
Journal of the Asia Pacific Economy, 12(3), 329–344.
Quazi, R. M. (2014). Effects of corruption and regulatory environment on foreign
direct investment : A Case of Africa. Global Journal of Business Research, 8(4),
51–61.
Quazi, R., Vemuri, V., & Soliman, M. (2014). Impact of corruption on foreign direct
investment in africa. International Business Research, 7(4), 1–10.
Rahman, M. M. (2003). A panel data analysis of bangladesh ’ s trade : the gravity
model approach. 5th Annual Conference of the European Trade Study Group.
Retrieved from http://www.etsg.org/ETSG2003/papers/rahman.pdf
Rogmans, T., & Ebbers, H. (2013). The determinants of foreign direct investment in
the Middle East North Africa region. International Journal of Emerging
Markets, 8(3), 240–257.
118
Salvatici, L. (2013). The Gravity Model in International Trade. African Growth &
Development Policy. Version 2
Samanta, S. K. (2011). Corruption, religion and economic performance in OPEC
countries: an analysis. International Journal of Economics, Management and
Acounting, 2(2), 187–208.
Sethi, D., & Guisinger, S. (2002). Liability of foreignness to competitive advantage:
How multinational enterprises cope with the international business environment.
Journal of International Management, 8, 223–240.
Sharma, B., & Abekah, J. (2007). Foreign direct investment and economic growth of
africa. Atlantic Economic Journal, 36(1), 117–118.
Shera, A., Dosti, B., & Grabova, P. (2014). Corruption impact on economic growth:
An empirical analysis. Journal of Economics Development, Management, IT,
Finance and Marketing, 6(9), 57–77.
Sichei, M. M., & Kinyondo, G. (2012). Determinants of foreign direct investment in
Africa : A panel data analysis. Global Journal of Management and Business
Research, 12(18), 85 – 97.
Subasat, T. (2011). Economic freedom and foreign direct investment: A panel
gravity model approach. The Empercal Economics Letters, 10(7), 698–704.
Subasat, T. (2013). Governance and foreign direct investment in Latin America: A
panel gravity model approach. Latin American Journal of Economis, 1(5), 107–
131.
Subasat, T., & Bellos, S. (2013). corruption and foreign direct investment in Latin
America: A panel gravity model approach. Journal of Management and
Sustainability, 3(4), 151–156.
Suliman, A. H., & Mollick, A. V. (2009). Human capital development, war and
foreign direct investment in sub-Saharan Africa. Oxford Development Studies,
37(1), 47–61.
Susan, R.-A. (2006). International Handbook on The Economics of Corruption.
Edward Elgar Publishing, Inc. (1–615).
Tamilla Curtis, D. L. and T. E. G. (2013). Effects of global competitiveness, human
development, and corruption on inward foreign direct investment, Review of
Business, 34(1), 67–81.
Tanzi, V. (1998). Corruption Around the World. Retrieved from http://www.iuc-
edu.eu/group/sem1_L2/BFC/reading/tanzi.pdf. IMF Staff Paper, 45(4), 559–
594.
Tanzi, V., & Devoodi, H. (1997). corruption, public investment and growth. IMF
Working Papers WP97/139.

119
Tinbergen, J. (1962). Shaping the world economy: Suggestions for an international
economic policy. Economic Journal, 76(1), 94 – 95.
Tosun, M. U., Yurdakul, M. O., & İyidoğan, P. V. (2014). The relationship between
corruption and foreign direct investment inflows in turkey: An empirical
examination. Transylvanian Review of Administrative Sciences, 42, 247 – 257.
Transparency International. (1997). Transparency International 1997 Corruption
Perception Index. In CPI (pp. 1–15).
Transparency international. (2013). Corruption Perception Index. Retrieved from
http://www.transparency.org/policy_research/surveys_indices/cpi
Transperency International. (2014). Corruption Perception Index. Retrieved from
http://www.transparency.org/research/cpi/overview
Umoh, O. J., Jacob, A. O., & Chuku, C. A. (2012). Foreign direct investment and
economic growth in Nigeria: An analysis of the endogenous effects. Current
Research Journal of Economic Theory, 4(3), 53–66.
UNCTAD. (2014) United Nations Conference on Trade and Development. World
Investment Report. Retrieved from
http://unctad.org/en/publicationslibrary/wir2014_en.pdf
UNDP. (2013). United Nations Development Programmes. Report on Corruption.
Vernon, R. (1966). International investment and international trade in the product
cycle. Quarterly Journal of Economics, 80, 190–207.
Vernon, R. (1979). The Product cycle hypothesis in a new international environment.
Oxford Bulletin of Economics and Statistics, 41(4), 255–267.
Wei, S.-J. (2000). How taxing is corruption on international investors? Review of
Economics and Statistics, 82(1), 1 – 11.
Wernerfelt. B. (1995). Resource-based view of firm: Ten years after. Strategic
Management Journal, 16(3), 171–174.
World Bank. (2014). World governance indicators. Retrieved From
http://info.worldbank.org/governance/wgi/pdf/ge.pdf.
Williams, B. (1997). Positive theories of multinational banking: Eclectic theory vs
internalization theory. Journal of Economic Survey, 11(3), 71–100.
World Bank. (1997). Helping countries combat corruption. Poverty Reduction and
Economic Management, (9).
World Bank. (2014). World development indicators. Retrieved from
http://data.worldbank.org/sites/default/files/wdi-2014-book.pdf

120
Yusuf, M., Malarvizhi, C. a., Huda Mazumder, M. N., & Su, Z. (2013). Corruption,
poverty, and economic growth relationship in the Nigerian economy. The
Journal of Developing Areas, 48(3), 95–107.
Zhang, K. H., & Markusen, J. R. (1999). Vertical multinationals and host country
characteristics. Journal of Development Economics, 59(2), 233 – 252.