determinants of health in developing countries: cross ... osipp discussion paper : dp-2010-e-009...
TRANSCRIPT

1
OSIPP Discussion Paper : DP-2010-E-009
Determinants of Health in Developing Countries:
Cross-Country Evidence
December 15, 2010
Yusuke Kamiya
Ph.D candidate, Osaka School of International Public Policy (OSIPP)
【Keywords】Determinants of health, child health, health systems, System GMM
【JEL classification】I12, I18, O15
【Abstract】There is a growing consensus that stronger health systems are crucial to
achieving a further reduction in child mortality. On the other hand, socioeconomic
status has also long been considered to be a crucial factor to affect people’s health
status. Nevertheless, there exists no consistent empirical evidence on whether or not and
how health systems and socioeconomic factors affect health outcomes. This paper
applies system Generalised Method of Moments (system GMM) to estimate the
determinants of under-five mortality for cross-country panel data from 141 developing
countries. Empirical results show that GDP per capita and the access to improved
sanitation have statistically significant and favourable effects in reducing child
mortality. In contrast, health system factors, which are measured by government health
spending, the coverage of immunisation and skilled birth attendants, and the number of
physicians per 1,000 people, do not lead to mortality reduction.
Address: Osaka School of International Public Policy, Osaka University, 1-31 Machikaneyama, Toyonaka, Osaka 560-0043 Japan, Tel/Fax: (81) 6-6850-5839, E-mail address: [email protected] I acknowledge Professor Naoto Yamauchi, Osaka School of International Public Policy, for permitting me to publish this paper.

2
1. Introduction
Every year 8.8 million of under-five children die and half a million women lose their lives
from causes related to pregnancy and childbirth. Saving lives of children and mothers has
become a global agenda since the establishment of Millennium Development Goals
(MDGs) in 2000. The UN Millennium Declaration was adopted in 2000 by 189 countries,
exemplifying a commitment to a new global partnership to reduce extreme poverty by the
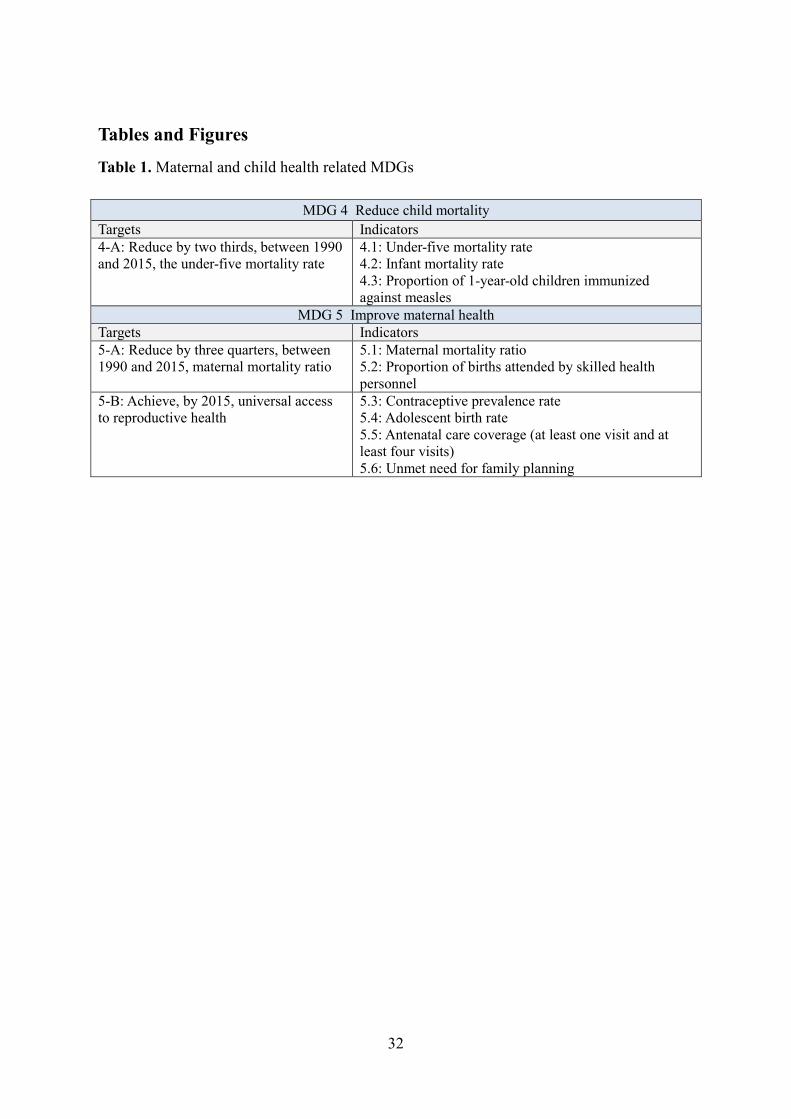
year 2015. Amongst the eight MDGs, two goals directly aim to improve maternal and child
health. MDG 4 targets to reduce the under-five mortality rate by two thirds between 1990
and 2015, whilst MDG 5 aims to reduce maternal mortality ratio by three quarters between
1990 and 2015 (MDG 5-A) and to achieve universal access to reproductive health by 2015
(MDG 5-B) as shown in Table 1.
<Table 1>
Regarding the progress of MDG 4 and 5, under-five mortality rate in developing
countries declined by 28% from 100 deaths in 1990 to 72 deaths per 1,000 live births in
2008 (Figure 1). It is encouraging that the progress has been accelerated after the year 2000,
i.e. the average annual rate of reduction increased to 2.3% during 2000-2008, compared to
1.4% in the 1990s (UN, 2010). The total number of under-five deaths per annum decreased
from 12.5 million in 1990 to 8.8 million in 2008, in which a half of the deaths occurred in

3
Sub-Saharan Africa. Although under-five mortality rate in Sub-Saharan Africa dropped by
22% from 183 deaths per 1,000 live births to 144 deaths per 1,000 live births during 1990-
2008, the pace of progress is not sufficient to meet the target by 2015. Looking at individual
countries, there are several countries in Sub-Saharan Africa such as Eritrea, Malawi,
Mozambique and Rwanda that performed well in reducing child mortality, but most of the
countries still suffer unacceptably high levels of child deaths1. Figure 2 shows the causes of
under-five mortality rate worldwide. It shows that pneumonia (14%), diarrhoea (14%) and
malaria (8%) constitute main causes. 41% of child deaths occur in the neonatal period (the
first four weeks after the birth), and the progress in reducing newborn deaths is slower than
deaths among children aged one month to five years (WHO and UNICEF, 2010).
<Figures 1-2>
Prospect to achieve MDG 5 is more pessimistic than MDG 4. Global maternal mortality
ratio dropped by just 6% from 480 per 100,000 live births in 1990 to 450 deaths per
100,000 live births in 2005 (Figure 3). To achieve the MDG 5-A, 40% of reduction per
annum is necessary. Geographically, among 536,000 deaths which took place in 2005, more
than 99% occurred in developing countries. About a half of the maternal deaths (265,000)
1 All of 34 countries with under-five mortality rates exceeding 100 per 1,000 live births in 2008 are from Sub-Saharan Africa except for Afghanistan.

4
occurred in sub-Saharan Africa and another third (187,000) in South Asia (WHO, 2008, UN,
2009)2.
<Figure 3>
A maternal death is defined by “the death of a woman during pregnancy or within 42
days of termination of pregnancy, from any cause related to or aggravated by the pregnancy
or its management, regardless of the site or duration of pregnancy” (WHO and UNICEF,
2010). According to UNICEF, 2009, the causes of maternal deaths can be divided into
direct causes, indirect causes and underlying causes. Direct causes comprise of obstetric
complications (post-partum haemorrhage, infections, eclampsia and prolonged or obstructed
labour) and complications of abortion. These direct causes can be preventable if women
have access to skilled health personnel, key drugs and equipment. Indirect causes include
maternal anaemia, iodine deficiency during pregnancy, HIV/AIDS and Malaria. Latest
estimate show that haemorrhage (35%) and hypertension (18%) are dominant among direct
and indirect causes of maternal deaths (Figure 4). Underlying causes include a lack of
knowledge and education, inadequate maternal and newborn practices and care seeking,
insufficient access to nutritious food and essential micronutrients, poor environmental
2 A recent analysis, using a new database for 181 countries constructed from registration data, censuses,
surveys, and verbal autopsy studies for 1980-2008, estimate that there were 342,900 maternal deaths
worldwide in 2008, down from 526300 in 1980. According to their study, maternal mortality ratio
declined from 422 in 1980 to 320 in 1990, and to 251 per 100,000 live births in 2008 (Hogan et al., 2010).

5
health facilities and inadequate basic health care services and limited access to maternity
services (UNICEF, 2009). Poverty, social exclusion and gender discrimination are also
important underlying causes. In particular, access to quality health care services is of
particular significance to women’s health.
<Figure 4>
Figure 5 presents the indicators of access to health services for pregnant women in
developing countries for the period 2000-2007. Delivery-care coverage with skilled
attendants at birth and contraceptive prevalence in developing countries are 61% and 60%
respectively. The proportion of women who receive four or more antenatal visits is lower in
South Asia (34%) and Sub-Saharan Arica (42%), where the most of maternal deaths occur.
<Figure 5>
There is now a global consensus that health systems strengthening (HSS) is crucial to
improving health status of children and mothers in the developing world. On the other hand,
socioeconomic status (SES) such as political, economic, social, technological and
environmental factors, which is often called “social determinants of health (SDH)”, has also
long been considered to be critical in affecting health outcomes worldwide. Figure 6 depicts

6
a conceptual framework for SES and HSS as determining factors of maternal, newborn and
child survival.
<Figure 6>
Both theoretical and empirical analysis on the linkages of HSS and SES with health
outcomes assists policymakers in designing effective public policies for improvement of
maternal and child health. This paper therefore provides a theoretical framework to analyse
causes of health outcomes by reviewing past studies, and uses it as a basis to perform
regression analysis using cross-country panel data. Since there is scarce evidence on the role
of health system and socioeconomic factors in explaining variations of child health
outcomes across countries, the analysis throughout the paper will be a merit to providing
important policy implications towards the progress of the health-related MDGs.
2. Literature review
In this section, I review the literature on HSS and SDH in the context of maternal and child
health in developing countries.
Health System Strengthening (HSS)

7
Although there is increasing evidence on the efficacy of specific interventions for priority
health problems including maternal and child health3, progress towards the health-related
MDGs remains sluggish in many developing countries. This fact implies that a primary
bottleneck to the MDGs targets are fragile and fragmented health systems and therefore
strong and effective health systems are considered a prerequisite to achieving the health-
related MDGs (Jesper et al., 2010, Travis et al., 2004, Reich and Takemi, 2009).
One of the most frequently cited frameworks of health systems was developed by the
World Health Organization (WHO)’s World Health Report 2000, in which health systems
are defined as “all the activities whose primary purpose is to promote, restore or maintain
health” (WHO, 2000). This framework is based on four key functions: stewardship, resource
creation, service provision, and financing (Figure 7). Health system outcomes are defined as
“good health, responsiveness to the expectations of the population, and fairness of financial
contribution”. Following this framework, WHO ranked health systems in 189 countries
according to their performance.
<Figure 7>
In 2007 WHO provided a revised framework on health systems in its publication
Everybody’s Business: strengthening health systems to improve health outcomes, which
3 On the other hand, there are very few evaluation studies which scrutinise the effectiveness of large-scale programmes which comprise packages of interventions (Lancet, 2010, Victora et al., 2010, Bryce et al., 2010, Victora et al., 2009).

8
include six building blocks; service delivery; human resources; information; medical
product; financing; and governance (Figure 8). In this framework, HSS is defined as
“improving these six health system building blocks and managing their interactions in ways
that achieve more equitable and sustained improvements across health services and health
outcomes” (WHO, 2007). This approach is useful to describe health system constraints and
identify where, why, and in what way further investments are needed (Shakarishvili 2009).
<Figure 8>
Social Determinants of Health (SDH)
Socioeconomic factors have also long been considered as important determinants of health
outcomes, which are now widely known as “social determinants of health” (SDH)
(Mammot and Wilkinson, 2006). Thomas and Frankenberg 2002, reviewing both
experimental and observational studies, conclude that there is abundant evidence at both the
microeconomic and macroeconomic levels showing that a variety of health indicators are
positively associated with different dimensions of economic prosperity and the causal
pathways linking health and economic outcomes run in both directions (For review papers
see: WB, 1993, CMH, 2001, Jack and Lewis, 2009, UNESCAP, 2007, Deaton, 2006, CSDH,
2008, Lopez, 2007, Caldwell, 1986, Ranis and Stewart, 2005, Deaton, 2003, Strauss and
Duncan, 1998, Currie, 2009). In 2008 WHO’s Commission on the Social Determinants of

9
Health (CSDH) published a comprehensive report on SDH which contains a plenty of
evidence for SDH to affect health outcomes and health inequality (CSDH, 2008). Figure 9
presents the framework developed by CSDH, which illustrates both routes from SES to
health and vice versa.
<Figure 9>
Empirical evidence on the determinants of health
There is a large volume of empirical literature to scrutinise the linkages of health system
and socioeconomic factors with health outcomes. First, as to the link between income and
health, early economics literature documented the importance of health as human capital in
boosting economic growth. Bloom and Canning, 2003, Bloom et al., 2004, Gyimah-
Brempong and Wilson, 2004, Sala-i-Martin, 1997, among others, have clarified that health
capital has a positive impact on aggregate economic output. According to their analysis,
about one-fourth of economic growth was attributable to health capital accumulation, and
health condition equivalent to one additional year of life expectancy is correlated with
higher economic growth of up to 4% per year. Thereafter, human capital became identified
as an ultimate goal of countries instead of just a driver for economic growth especially since
the publication of Human Development Report by the United Nations Development
Programme (UNDP) in 1990 (Schultz, 1999, Anand and Ravallion, 1993, Ravallion and

10
Chen, 1997, Squire, 1993). A conceptual framework underpinning this idea clearly comes
from a series of works by Novel laureate Amartya Sen (Sen, 1999, Sen, 1987, Sen, 1985,
Sen, 1977a, Sen, 1977b). Nowadays there are numerous empirical studies that analyse
factors contributing to better health outcomes using cross-country data.
As reviewed above, stronger health systems are expected to contribute to better
population health. However, a theoretical linkage between health systems, which is often
proxied by government health expenditures, and health outcomes is complex for the
following reasons. First, if there is a functioning private health care market, an increase in
government health expenditure may “crowd out” private health spending, i.e. a household
diverts its resources towards other uses once the government increases their spending on
health. Second, public resources may be used ineffectively. For instance, it is often
observed in developing countries that doctors or nurses don’t show up to work at health
facilities, equipment lies idle due to a lack of necessary parts, or drugs provided by a central
government are not distributed to patients in need (Lewis, 2006). Third, even if public
spending applied appropriately, they may yield little benefit to people’s health if
complementary services such as water, sanitation, transportation and communication
infrastructure are not there or lacking.
Empirical results from cross-country studies on the linkage between health spending and
health outcomes have so far built a relatively “fair” consensus that aggregate government
health spending has less impact on average health status than it is expected for, whilst
11
socioeconomic characteristics explain almost all of the variations in infant and child
mortality rates across countries (Filmer et al., 2000). Early studies, especially during 1980-
1990s, examined cross-sectional data for a specific year or pooled cross-sectional data using
the ordinary least squares (OLS) or two-step least squares (2SLS). They confirmed that the
impact of government health investment on child health outcomes is either small or
statistically insignificant (Kim and Moody, 1992, Carrin and Politi, 1995, Musgrove, 1996,
Filmer and Pritchett, 1999). For instance, Filmer and Pritchett, 1999, which is one of the
most influential studies, investigated the association between government health
expenditure as a share of GDP and under-five mortality rate across around 100 countries.
They found that government health spending explains just one-seventh of one percent of
variations in infant and under-5 mortality across countries, whilst GDP per capita, income
distribution, female schooling, ethno-linguistic fragmentation, and religious and regional
dummy variables explain almost 95% of the variations. In contrast, several early studies
also confirm a statistically significant impact of government public spending on the
reduction in infant or child mortality albeit for a relatively small sample size ranging from
10 to 35 countries (Anand and Ravallion, 1993, Bidani and Ravallion, 1997, Hojman, 1996,
Gupta et al., 2002b). For example, Bidani and Ravallion, 1997 confirmed that public
spending has a significant and positive effect on the health status of the poor (but not on
aggregate health status of the poor and the non-poor taken together). Recent studies, using
the Generalised Method of Moments (GMM) estimation technique with instrumental

12
variables for cross-sectional country data, confirmed the statistically significant effects of
government health spending on child mortality (Bokhari et al., 2007, Gottret and Schieber,
2006).
One of the reasons why the effect of government health expenditure is not
straightforward is attributable to a weak institutional capacity in the public sector to realise
efficient transformation from inputs to health outcomes. Filmer et al., 2000 and Lewis, 2006
argue that fragile institutional capacity in developing countries, including a lack of incentive
mechanism in the public sector for utilising limited resources, critically hampers effective
health service provision. Fayissa and Gutema, 2005 find an unexpected negative impact of
health expenditures (including both public and private) on health outcomes for 31 Sub-
Saharan African countries using a two-way random effect model. This result made them
speculate that inefficient health service provision caused a negative relationship between
government health spending and health outcomes. One of the examples that clearly show
the inefficiency of health systems in developing countries is a high rate of absenteeism and
a lack of motivation among public health workers. Chaudhury et al., 2006 showed that
absenteeism rates of health staff ranged from 25% to 40% in Bangladesh, Ecuador, India,
Indonesia, Peru, and Uganda. Das and Hammer, 2007 found that doctors in the public health
facilities exert less effort than private doctors. Recent studies confirmed the importance of
institutional capacity and incentive mechanism. For instance, Meessen et al., 2007 found

13
that the change of contract structure from fixed payment to performance-based payment
increased health staff productivity in Rwanda.
There is also a growing volume of cross-country studies on the impact of governance on
population health. Virtuous effects of good governance on health indicators are verified by
several studies (Gupta et al., 2002b, Gupta et al., 1999)4. Wagstaff and Claeson, 2004
confirms that public expenditure contributes to the reduction in child mortality rate in
countries with good governance indicators measured by the World Bank’s Country Policy
and Institutional Assessment (CPIA). Baldacci et al., 2008 conclude that government health
spending is effective only in an environment with good governance. Rajkumar and Swaroop,
2008 obtain similar results using the degree of corruption and bureaucratic quality as
governance indicators. However, Lewis, 2006 confirmed no significant effects of
governance indicators measured by government effectiveness or corruption indices
produced by Kaufmann et al., 2004.
Some other studies analyse the effects of a composition of government health spending.
Filmer et al., 1997 found that the share of total national health spending on “local” health
services is unrelated to under-five mortality. In contrast, Mehrotra and Delamonica, 2002
confirmed that the share of public spending on primary health care devoted to the poorest
quintile of the population is associated with lower under-five mortality. However, McGuire,
2006 found the public health care spending on “basic”, “local”, or “primary” health services
4 Regarding the social spending for economic development, Mauro, 1998, Gupta et al., 2002a, Rodrik et
al., 2004, Hausmann et al., 2005 confirm the importance of governance in fostering economic growth.

14
are not effective in reducing child mortality. They state that this result may be caused by the
fact that health interventions which are most effective in reducing under-five mortality are
inexpensive and therefore they do not show up in aggregate data.
The role of human resource, which is also an important component of health systems, in
improving health status has also been analysed empirically. A number of cross-sectional
studies showed that density of human resources for health is positively associated with
better population health (Anand et al., 2008, Anand and Barnighausen, 2007, Anand and
Barnighausen, 2004, Aakvik and Holmås, 2006, Speybroeck et al., 2006, Flegg, 1982,
Robinson and Wharrad, 2000). In particular, physicians density per capita plays the most
significant role in explaining country variations in infant, under-five, and maternal mortality
(Farahani et al., 2009).
3. Model
Based on the literature review in the previous section, an aggregate health production
function (Grossman, 1972, Fayissa and Gutema, 2005) is specified as,
[1] ℎ = �(���, ��)
where h denotes average health status of children at the national level measured by under-
five mortality rate, ��� = (��, � , … , ��) is a vector of socioeconomic factors,
�� = (ℎ�, ℎ , … , ℎ�) is a vector of health system components, and r and s are the
number of variables in each category. In the following analysis, SES vector includes

15
variables of income, sanitation, gender, population, inequality and governance indicator,
while HS vector comprises of variables representing health financing, health service
delivery and human resources for health at the national levels.
Pooled cross-sectional specification
As to the empirical model, I first apply a pooled-cross sectional OLS regression model as a
basic specification.
[2] �� �5���� = � + ������ + ����� + �� + ���
where �� �5���� is a natural log of the under-five mortality rate, �����
= (����, � ��, … , ����) is a vector of socioeconomic status variables, and ���� =
(ℎ���, ℎ ��, … , ℎ���) is a vector of health system variables for a country = 1,2, … , # and
for the period $ = 1,2, … , %. �� is a vector of period dummies capturing time trends, and ���
is an error term. For each variable, the annual data are averaged over five-year periods to
reduce annual fluctuations and measurement errors. I specify the log-log functional form for
several variables of the SES and HS vectors to smooth the data as well as to calculate
elasticities of these variables on under-five mortality. The log-log specification also
accommodates the fact that health gains from an increase in health spending is larger in
countries where the initial mortality is higher (Deaton, 2006).

16
Fixed effects panel data specification
The OLS estimates are biased if explanatory variables of interest in the equation [2] are
correlated with the unobserved error components of child mortality. To control for the
unobserved country-specific heterogeneities, country-fixed effects are included in the
estimation model. The fixed effects model is specified as:
[3] ln �5���� = � + ������ + ����� + (� + �� + ���
where (� a vector of time-invariant country fixed effects which reflect unobserved country
factors that may affect under-five mortality.
System GMM specification
Even after controlling for time-invariant country fixed effects, the residual may contain
time-varying factors that may be correlated with explanatory variables and it would cause
biased estimates on the coefficients of interest. In addition, the presence of measurement
errors in variables of the SES and HS vectors would also bias the estimated coefficients. To
deal with this endogeneity bias stemming from omitted variables or measurement errors, I
use a system of moment equations using the GMM, i.e. system GMM, developed by
Blundell and Bond, 1998 which is specified as follows:
[4] ln �5���� = � + )ln �5����*� + ������ + ����� + (� + �� + ���
[5] ∆ln �5���� = )(∆ln �5����*�) + �(∆�����) + �(∆����) + ∆�� + ∆���
17
Note that ����� vector includes both endogenous and exogenous variables, and
variables in ���� vector are basically endogenous. I differentiate a set of endogenous
variables included in ����� by adding a subscript* as �����∗ . In the system GMM estimation,
lagged differences of potential endogenous variables, i.e. ( ln �5���� − ln �5����*� ),
(�����∗ − �����*�
∗ ), (���� − ����*�), are used as instruments in the level equation [4], and
lagged levels of the endogenous variables, i.e. ln �5����* , �����*�∗ and ����*� are used
as instruments in the first differenced equation [5]. In the following analysis, lagged under-
five mortality rate as well as variables reflecting income, population, health financing,
health service delivery and human resources for health are treated as endogenous variables.
Then, sanitation, gender and governance variables, which are not strictly exogenous, are
assumed to be “predetermined variables” (Bond, 2002). Lastly, period dummies are treated
as “strictly exogenous variables”. Following Blundell and Bond, 2000 and Mishra and
Newhouse, 2009, I use system GMM rather than first-differenced GMM (Arellano and
Bond, 1991) which use only equation [5] because system GMM improves the accuracy of
estimates by setting the additional moment conditions in the level equations when the
dependent variable is persistent like child mortality. The following assumptions are made
under the system GMM estimators (Blundell and Bond, 2000).
[6] �((�) = �(���) = �((����) = 0
[7] �(������) = 0, $ ≠
[8] �(�5�������) = 0, $ = 2, … , %

18
[9] �(�����∗ ���) = 0, $ = 2, … , %
[10] �(�������) = 0, $ = 2, … , %
[11] �(∆�5��� (�) = 0
[12] �(∆���� ∗ (�) = 0
[13] �(∆��� (�) = 0
Equations [8]-[13] denote the initial conditions under the system GMM model.
Conditions [8]-[10] assume that the initial levels of endogenous variables, i.e. �5���� ,
�����∗ , ����, are uncorrelated with all future unobserved shocks in under-five mortality.
Similarly, conditions [11]-[13] postulate that initial changes of endogenous variables, i.e.
∆�5��� , ∆���� ∗ , ∆��� , are uncorrelated with the unobserved country fixed effects
5.
Importantly, the system GMM estimator has much smaller finite sample bias and is much
more accurate in estimating autoregressive parameters using panel data with a large number
of cross-section units (large ") and a small number of time periods (small T). For the
estimation using system GMM, I used “xtabond2” command in Stata (Roodman, 2009).
One caveat of system GMM is that including excessive number of instruments, relative to
the number of observations, may yield finite-sample bias in the estimates. Furthermore, too
many instruments dilute the power of Hansen’s J test for over identification and the test
may falsely reject the null hypothesis that the instruments are valid (Roodman, 2008). I
check the robustness of the model in changing the number of instruments by using different
time lags.
5 Similar assumptions are made for the predetermined variables.

19
All of the estimations are performed by the two-step GMM, but standard errors of
the two-step GMM estimators are known to be downward biased. I therefore use
Windmeijer’s finite-sample correction for the two-step covariance matrix (Windmeijer,
2005).
4. Data
I compile panel data for 141 developing countries during the period of 1990-20086. Most of
health systems and socioeconomic variables are from the World Development Indicators
2009, WHO Statistical Information System7 and World Bank’s Worldwide Governance
Indicators Project8.
Dependent variable
Under-five mortality rate: The number of newborn children out of 1,000 who die before
reaching the age of five. Source: World Development Indicators
Independent variables
Income: Gross Domestic Product (GDP) per capita based on purchasing power parity (PPP).
Data are in constant 2005 international US dollar. Source: World Development Indicators
6 Name of each country in the dataset are listed in Table A.1.1. 7 http://www.who.int/whosis/en/
8 http://info.worldbank.org/governance/wgi/index.asp

20
Sanitation: Improved sanitation facilities expressed as a percentage of population with
access. Source: World Development Indicators
Gender equality: Share of female students in primary schools. Source: World Development
Indicators
Population: Population (in thousand). Source: World Development Indicators
Inequality: Gini coefficient. Source: World Development Indicators
Governance: Mean values of six governance indicators produced by Kaufmann et al., 2009:
(1) Voices and Accountability; (2) Political Stability and Absence of Violence; (3)
Government Effectiveness; (4) Regulatory Quality; (5) Rule of Law; and (6) Control of
Corruption9. Source: World Bank’s Governance Indicator Project
Health financing: Government health expenditures as a share of total government
expenditures. Source: WHO Statistical Information System
Health service delivery: Coverage of DPT (diphtheria, pertussis, and tetanus) as a
percentage of children ages 12-23 months and utilisation of skilled attendants at birth
delivery. Source: World Development Indicators
Human resources for health: Physicians per 1,000 people. Source: World Development
Indicators
In addition, period dummies for the year 1995-1999, 2000-2004, and 2005-2008
(with a reference to the period 1990-1994), are included as independent variables. World
regions are categorized into East Asia and Pacific (EAP), Europe and Central Asia (ECA),
9 Definition of each governance indicator is shown in Table A.2.

21
Latin America and Caribbean (LAC), Middle East and North Africa (MENA), South Asia
(SA) and Sub-Saharan Africa (SSA).
Descriptive statistics are summarised in Table 2. The mean value of child mortality
(per 1,000 live births) is 82, ranging from 6.7 to 303.5. The average share of government
health expenditures in total government spending is 9.68% ranging from 0.98% to 28.75%.
Level of health service delivery also varies a lot across countries, i.e. the coverage of DPT
and skilled birth attendance ranges from 15.8% to 99.0% and from 5.6% to 100%
respectively. Figures A.1-A.12 are created using locally weighted smoothed scatter plots
(LOWESS) in Stata to depict the relationship between SES and HS variables and under-five
mortality rates.
<Table 2>
<Figures A.1-A.12>
5. Results
I report the estimated results from OLS, fixed effects, and system GMM models on the
effects of socioeconomic status and health system variables in reducing child mortality rate
in developing countries.

22
Results from the OLS estimation
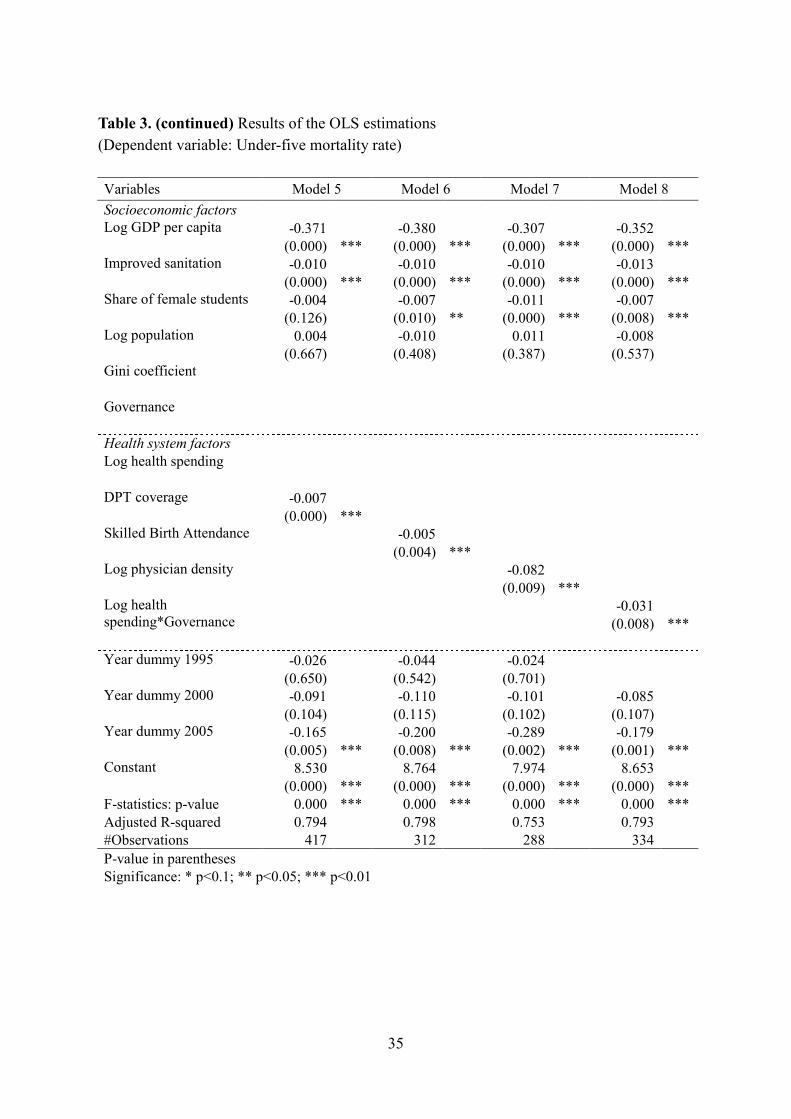
Table 3 presents the results from OLS regressions. The estimated coefficients on GDP per
capita and improved sanitation are negative and statistically significant at the less than 1%
significance level throughout Model 1 to Model 8. The share of female students is also
significantly related to lower child mortality except for Model 5. All of the health system
variables except government health expenditure have effects in reducing child mortality at
the less than 1% significance level.
<Table 3>
Results from the fixed effects estimation
Table 4 presents the fixed effects regression results. F-statistics show that time-invariant
country fixed effects (=(�) are different across countries and therefore the fixed effects
specification is preferred to OLS. The effects of DPT coverage, physician density, and an
interaction term of health spending and governance turn to be insignificant.
<Table 4>

23
Results from the System GMM estimation
Estimated coefficients from the system GMM are reported in Table 5.10 Identification is
based on lags of independent variables. One and more period lagged levels (up to two or
three lags depending on the length of time periods in each model specification) of the
endogenous variables and predetermined variables are used as instruments in the difference
equations, while the current and one period lagged differences are used in the level
equations. Specification tests are satisfactory as Hansen’s J for over-identifying restrictions
passes. In addition, tests for serial correlation cannot reject the null hypothesis that there are
autoregressive correlations for both the one- and two-periods.
<Table 5>
The system GMM results suggest that estimated coefficients on lagged under-five
mortality are close to one (ranging from 0.893 to 0.989) at the 1% significance level,
implying that child mortality is persistent over time. Of the socioeconomic variables, GDP
per capita has a significant and favourable effect in reducing child mortality although it
becomes insignificant when governance (Model 3) or health spending variable (Model 4) is
included in the estimation. The access to improved sanitation also contributes to the
reduction in child mortality except for Model 2 and 7. With regards to the health system
10 Results are obtained from two-step estimator. However, one-step estimator yields the similar results.

24
variables, the health service delivery, which is represented by the coverage of DPT and
skilled birth attendants, does not affect a significant impact on the mortality reduction.
Furthermore, the coverage of skilled birth attendants exhibits an effect in increasing child
mortality on the contrary to the expectation. Turning to the variables on health financing
and human resources, neither government health expenditures nor physician density are
statistically significant.
In summary, the empirical results from system GMM demonstrate that the effects of
health system factors, which are shown to be significant in OLS and fixed effects models,
become insignificant. It implies that residuals in the equations contain unobserved time-
varying country specific factors such as the access to community health facilities, people’s
hygiene practices and epidemic situation, and these factors are correlated with health system
variables in the equations. Therefore, the estimated coefficients (=� ) on health system
factors in both the OLS and fixed effects models are probably overestimated.
Finally, I checked the robustness of a different lag structure of endogenous and
predetermined variables, and confirmed that the estimated results are robust to using only
one period or two periods of lags as instruments. Table 6 presents the estimated coefficients
on the effects for lagged independent variables from both SES and HS. It is confirmed that
the overall results are not different from Table 5.
<Table 6>

25
6. Conclusions
This paper scrutinised the impact of socioeconomic factors and health system components
on child health outcomes by applying estimation methods which treat with the endogenous
nature of those variables. I used system GMM to estimate the determinants of under-five
mortality rate with a cross-country panel dataset from 141 developing countries. The
empirical results show that GDP per capita and access to improved sanitation have
statistically significant and favourable effects in reducing child mortality. On the other hand,
health system factors, which are measured by government health spending, immunisation
coverage, and physician density, do not affect any significant impact on the mortality
reduction. These results suggest that estimation models which do not properly treat with the
endogenous nature of determinants of health would lead to biased results.
26
References
Aakvik, A. & Holmås, T. H. 2006. Access to primary health care and health outcomes: The relationships between GP characteristics and mortality rates. Journal of Health
Economics, 25, 1139-1153.
Anand, S. & Barnighausen, T. 2004. Human resources and health outcomes: cross-country econometric study. Lancet, 364, 1603-9.
Anand, S. & Barnighausen, T. 2007. Health workers and vaccination coverage in developing countries: an econometric analysis. Lancet, 369, 1277-85.
Anand, S., Fan, V. Y., Zhang, J., Zhang, L., Ke, Y., Dong, Z. & Chen, L. C. 2008. China's human resources for health: quantity, quality, and distribution. Lancet, 372, 1774-81.
Anand, S. & Ravallion, M. 1993. Human Development in Poor Countries: On the Role of Private Incomes and Public Services. The Journal of Economic Perspectives, 7, 133-150.
Arellano, M. & Bond, S. 1991. Some Tests of Specification for Panel Data: Monte Carlo Evidence and an Application to Employment Equations. Review of Economic
Studies, 58, 277–297.
Baldacci, E., Clements, B., Gupta, S. & Cui, Q. 2008. Social Spending, Human Capital, and Growth in Developing Countries. World Development, 36, 1317-1341.
Bidani, B. & Ravallion, M. 1997. Decomposing Social Indicators Using Distributional Data. Journal of Econometrics, 77, 125-139.
Bloom, D. & Canning, D. 2003. The Health and Poverty of Nations: from theory to practice. Journal of Human Development, 4, 47 - 71.
Bloom, D. E., Canning, D. & Sevilla, J. 2004. The Effect of Health on Economic Growth: A Production Function Approach. World Development, 32, 1-13.
Blundell, R. & Bond, S. 1998. Initial conditions and moment restrictions in dynamic panel data models. Journal of Econometrics, 87, 115-143.
Blundell, R. & Bond, S. 2000. GMM Estimation with persistent panel data: an application to production functions. Econometric Reviews, 19, 321 - 340.
Bokhari, F. A. S., Gai, Y. & Gottret, P. 2007. Government health expenditures and health outcomes. Health Economics, 16, 257-273.
Bond, S. 2002. Dynamic panel data models: a guide to micro data methods and practice. Portuguese Economic Journal, 1, 141-162.
Bryce, J., Gilroy, K., Jones, G., Hazel, E., Black, R. E. & Victora, C. G. 2010. The Accelerated Child Survival and Development programme in west Africa: a

27
retrospective evaluation. Lancet, 375, 572-82.
Caldwell, J. C. 1986. Routes to Low Mortality in Poor Countries. Population and
Development Review, 12, 171-220.
Carrin, G. & Politi, C. 1995. Exploring the health impact of economic growth, poverty reduction, and public health expenditure. Tijdshrift voor Economie en Management, 40.
Chaudhury, N., Hammer, J., Kremer, M., Muralidharan, K. & Rogers, F. H. 2006. Missing in Action: Teacher and Health Worker Absence in Developing Countries. The
Journal of Economic Perspectives, 20, 91-116.
CMH 2001. Macroeconomics and health: investing in health for economic development. Commission on Macroeconomics and Health.
CSDH 2008. Closing the gap in a generation: health equity through action on the social determinants of health. Final report on the Commission on the Social Determinants of Health.
Currie, J. 2009. Healthy, Wealthy, and Wise: Socioeconomic Status, Poor Health in Childhood, and Human Capital Development. Journal of Economic Literature, 47, 87-122.
Das, J. & Hammer, J. S. 2007. Money for Nothing: The Dire Straits of Medical Practice in Delhi, India. Journal of Development Economics, 83, 1-36.
Deaton, A. 2003. Health, Inequality, and Economic Development. Journal of Economic
Literature, 41, 113-158.
Deaton, A. 2006. Global patterns of income and health: facts, interpretations, and policies. "BER Working Paper, No.12735.
Farahani, M., Subramanian, S. V. & Canning, D. 2009. The effect of changes in health sector resources on infant mortality in the short-run and the long-run: A longitudinal econometric analysis. Social Science & Medicine, 68, 1918-1925.
Fayissa, B. & Gutema, P. 2005. Estimating a health production function for Sub-Saharan Africa (SSA). Applied Economics, 37, 155 - 164.
Filmer, D., Hammer, J. & Pritchett, L. 1997. Health policy in poor countries: weak links in the chain. World Bank Policy Research Working Paper, 1874.
Filmer, D., Hammer, J. S. & Pritchett, L. H. 2000. Weak Links in the Chain: A Diagnosis of Health Policy in Poor Countries. World Bank Res Obs, 15, 199-224.
Filmer, D. & Pritchett, L. 1999. The impact of public spending on health: does money matter? Social Science & Medicine, 49, 1309-1323.
Flegg, A. T. 1982. Inequality of income, illiteracy and medical care as determinants of infant mortality in underdeveloped countries. Popul Stud (Camb), 36, 441-58.
28
Gottret, P. & Schieber, G. 2006. Health financing revisited: a practitioner's guide,
Washington DC, World Bank.
Grossman, M. 1972. On the Concept of Health Capital and the Demand for Health. Journal
of Political Economy, 80, 223-255.
Gupta, S., Davoodi, H. & Alonso-Terme, R. 2002a. Does corruption affect income inequality and poverty? Economics of Governance, 3, 23-45.
Gupta, S., Verhoeven, M. & Tiongson, E. R. 2002b. The effectiveness of government spending on education and health care in developing and transition economies. European Journal of Political Economy, 18, 717-737.
Gupta, S., Verhoeven, M. & Tiongson, T. 1999. Does higher government spending buy better results in education and healh care? IMF Working Paper. Washington DC: International Monetary Fund.
Gyimah-Brempong, K. & Wilson, M. 2004. Health human capital and economic growth in Sub-Saharan African and OECD countries. The Quarterly Review of Economics and
Finance, 44, 296-320.
Hausmann, R., Pritchett, L. & Rodrik, D. 2005. Growth Accelerations. Journal of Economic
Growth, 10, 303-329.
Hogan, M. C., Foreman, K. J., Naghavi, M., Ahn, S. Y., Wang, M., Makela, S. M., Lopez, A. D., Lozano, R. & Murray, C. J. 2010. Maternal mortality for 181 countries, 1980-2008: a systematic analysis of progress towards Millennium Development Goal 5. Lancet, 375, 1609-23.
Hojman, D. E. 1996. Economic and other determinants of infant and child mortality in small developing countries: the case of Central America and the Caribbean. Applied
Economics, 28, 281 - 290.
Jack, W. & Lewis, M. 2009. Health investment and economic growth: macroeconomic evidence and microeconomic foundations. World Bank Policy Research Working
Paper, 4877.
Jesper, S., Swanson, R. C., Arvind, B., David, S., Collins, T. a. E., George, S. & Ruairi, B. 2010. Health-systems strengthening: current and future activities. The Lancet.
Kaufmann, D., Kraay, A. & Mastruzzi, M. 2004. Governance Matters III: Governance Indicators for 1996, 1998, 2000, and 2002. World Bank Econ Rev, 18, 253-287.
Kaufmann, D., Kraay, A. & Mastruzzi, M. 2009. Governance Matters VIII: Aggregate and Individual Governance Indicators 1996-2008. World Bank Policy Research
Working Paper. Washington DC: World Bank.
Kim, K. & Moody, P. M. 1992. More resources better health? A cross-national perspective. Social Science & Medicine, 34, 837-842.

29
Lancet 2010. Evaluation: the top priority for global health. Lancet, 375, 526.
Lewis, M. 2006. Governance and Corruption in Public Health Care Systems. CGD Working
Paper 78. Washington, DC: Center for Global Development.
Lopez, C. 2007. Health and Economic Growth: Findings and Policy Implications MIT Press.
Mammot, M. & Wilkinson, R. G. 2006. Social determinants of health, Oxford University Press.
Mauro, P. 1998. Corruption and the composition of government expenditure. Journal of
Public Economics, 69, 263-279.
McGuire, J. W. 2006. Basic health care provision and under-5 mortality: A Cross-National study of developing Countries. World Development, 34, 405-425.
Meessen, B., Kashala, J. P. & Musango, L. 2007. Output-based payment to boost staff productivity in public health centres: contracting in Kabutare district, Rwanda. Bull
World Health Organ, 85, 108-15.
Mehrotra, S. & Delamonica, E. 2002. Public spending for children: an empirical note. Journal of International Development, 14, 1105-1116.
Mishra, P. & Newhouse, D. 2009. Does health aid matter? Journal of Health Economics, 28, 855-872.
Musgrove, P. 1996. Public and Private Roles in Health: Theory and Financing Patters. World Bank Discussion Paper 339. Washington DC: World Bank.
Rajkumar, A. S. & Swaroop, V. 2008. Public spending and outcomes: Does governance matter? Journal of Development Economics, 86, 96-111.
Ranis, G. & Stewart, F. 2005. Dynamic links between the economiy and human development. DESA Working Paper No. 8, November.
Ravallion, M. & Chen, S. 1997. What Can New Survey Data Tell Us about Recent Changes in Distribution and Poverty? World Bank Econ Rev, 11, 357-382.
Reich, R. & Takemi, K. 2009. G8 and strengthening of health systems: follow-up to the Toyako summit. The Lancet, 373, 508-515.
Robinson, J. & Wharrad, H. 2000. Invisible nursing: exploring health outcomes at a global level. Relationships between infant and under-5 mortality rates and the distribution of health professionals, GNP per capita, and female literacy. J Adv "urs, 32, 28-40.
Rodrik, D., Subramanian, A. & Trebbi, F. 2004. Institutions Rule: The Primacy of Institutions Over Geography and Integration in Economic Development. Journal of
Economic Growth, 9, 131-165.
Roodman, D. 2008. A Note on the Theme of Too Many Instruments CGD Working Paper

30
125. Washington, DC: Center for Global Development.
Roodman, D. 2009. How to do xtabond2: An introduction to difference and system GMM in Stata. Stata Journal, 9, 86-136.
Sala-i-Martin, X. 1997. I just ran two million regressions. American Economic Review, 87, 178-183.
Schultz, T. P. 1999. Health and schooling investments in Africa. Journal of Economic
Perspectives, 13, 67–88.
Sen, A. 1977a. On Weights and Measures: Informational Constraints in Social Welfare Analysis. Econometrica, 45, 1539-72.
Sen, A. 1977b. Social Choice Theory: A Re-examination. Econometrica, 45, 53-89.
Sen, A. 1985. Commodities and Capabilities, Amsterdam: North-Holland.
Sen, A. 1987. The Standard of Living Cambridge, Cambridge University Press.
Sen, A. 1999. Development as freedom, New York, Alfred A. Knopf Inc.
Speybroeck, N., Kinfu, Y., Poz, M. R. D. & Evans, D. B. 2006. Reassessing the relationship between human resources for health, intervention coverage and health outcomes: Background paper prepared for the World Health Report 2006 - Working together for health. Geneva: World Health Organization.
Squire, L. 1993. Fighting Poverty. The American Economic Review, 83, 377-382.
Strauss, J. & Duncan, T. 1998. Health, Nutrition and Economic Development. Journal of
Economic Literature, 36, 766-817.
Travis, P., Bennett, S., Haines, A., Pang, T., Bhutta, Z., Hyder, A. A., Pielemeier, N. R., Mills, A. & Evans, T. 2004. Overcoming health-systems constraints to achieve the Millennium Development Goals. Lancet, 364, 900-6.
UN 2009. The Millennium Development Goals Report 2009. New York: United Nations.
UN 2010. The Millennium Development Goals Report 2010. New York: United Nations.
UNESCAP 2007. Achieving the Health Millennium Development Goals in Asia and the Pacific: Policies and Actions within Health Systems and Beyond.
UNICEF 2009. The state of the world's children 2009: maternal and newborn health.
Victora, C. G., Black, R. E., Boerma, J. T. & Bryce, J. 2010. Measuring impact in the Millennium Development Goal era and beyond: a new approach to large-scale effectiveness evaluations. Lancet.
Victora, C. G., Black, R. E. & Bryce, J. 2009. Evaluating child survival programmes. Bull
World Health Organ, 87, 83.

31
Wagstaff, A. & Claeson, M. 2004. Rising to the Challenge: The Millennium Development Goals for Health. Washington, DC: World Bank.
WB 1993. World Development Report 1993 : investing in health. Washington DC: The World Bank.
WHO 2000. The World Health Report 2000 - health systems: improving performance. The
World Health Report. World Health Organization.
WHO 2007. Everybody's business: strengthening health systems to improve health outcomes: WHO's framework for action. World Health Organization.
WHO 2008. Maternal mortality in 2005: Estimates developed by WHO, UNICEF, UNFPA and The World Bank. World Health Organization.
WHO & UNICEF 2010. Countdown to 2015: Decade Report (2000-2010) with country profiles, Taking stock of maternal, newborn and child survival. Cuntdown to 2015,
Maternal, "ewborn & Child Survival.
Windmeijer, F. 2005. A finite sample correction for the variance of linear efficient two-step GMM estimators. Journal of Econometrics, 126, 25-51.
32
Tables and Figures
Table 1. Maternal and child health related MDGs
MDG 4 Reduce child mortality
Targets Indicators
4-A: Reduce by two thirds, between 1990 and 2015, the under-five mortality rate
4.1: Under-five mortality rate 4.2: Infant mortality rate 4.3: Proportion of 1-year-old children immunized against measles
MDG 5 Improve maternal health
Targets Indicators
5-A: Reduce by three quarters, between 1990 and 2015, maternal mortality ratio
5.1: Maternal mortality ratio 5.2: Proportion of births attended by skilled health personnel
5-B: Achieve, by 2015, universal access to reproductive health
5.3: Contraceptive prevalence rate 5.4: Adolescent birth rate 5.5: Antenatal care coverage (at least one visit and at least four visits) 5.6: Unmet need for family planning

33
Table 2. Descriptive statistics Variable Obs. Mean S.D. Min Max
Health outcome variable
Under-five mortality rate, per 1,000 live births 563 82.0 64.7 6.7 303.5
Socioeconomic status (SES)
GDP per capita (PPP, constant 2000 international US$) 518 4241 3606 252 18830 Improved sanitation facilities (% of population with access) 480 55.9 29.4 3.0 100 Share of female students in primary schools (%) 508 91.8 12.0 29.2 126.2
Population (thousand) 562 35,449 136,572 16 1,314,672
Gini coefficient 280 43.2 9.5 21.8 74.3
Governance* 415 3.534 0.643 1.649 5.187
Health systems (HS)
Government health expenditures per total government expenditures (%) 419 9.68 4.21 0.98 28.75 DPT (diphtheria, pertussis and tetanus) coverage (%) 552 78.5 19.0 15.8 99.0
Skilled birth attendance (%) 387 70.6 27.7 5.6 100.0
Physician density (physicians per 1,000 people) 431 1.114 1.267 0.000 5.900
*Mean value of six governance indicators produced by Kaufmann et al, 2009

34
Table 3. Results of the OLS estimations
(Dependent variable: Under-five mortality rate)
Variables Model 1 Model 2 Model 3 Model 4
Socioeconomic factors Log GDP per capita -0.370 -0.451 -0.310 -0.381
(0.000) *** (0.000) *** (0.000) *** (0.000) *** Improved sanitation -0.012 -0.009 -0.014 -0.013
(0.000) *** (0.000) *** (0.000) *** (0.000) *** Share of female students -0.008 -0.013 -0.007 -0.008
(0.000) *** (0.000) *** (0.015) ** (0.002) *** Log population 0.006 0.016 -0.011 0.003
(0.572) (0.362) (0.351) (0.768) Gini coefficient 0.009
(0.002) *** Governance -0.197
(0.000) ***
Health system factors Log health spending -0.044
(0.381) Log DPT coverage
Log MCV coverage
Log physician density
Log health spending*Governance
Year dummy 1995 -0.046 -0.059
(0.423) (0.374) Year dummy 2000 -0.125 -0.099 -0.090 -0.076
(0.028) ** (0.130) (0.085) * (0.152) Year dummy 2005 -0.225 -0.387 -0.196 -0.169
(0.000) *** (0.000) *** (0.000) *** (0.002) *** Constant 8.491 8.858 8.790 8.718
(0.000) *** (0.000) *** (0.000) *** (0.000) ***
F-statistics: p-value 0.000 *** 0.000 *** 0.000 *** 0.000 ***
Adjusted R-squared 0.784 0.817 0.793 0.784
#Observations 418 230 334 336
P-value in parentheses
Significance: * p<0.1; ** p<0.05; *** p<0.01
35
Table 3. (continued) Results of the OLS estimations
(Dependent variable: Under-five mortality rate)
Variables Model 5 Model 6 Model 7 Model 8
Socioeconomic factors Log GDP per capita -0.371 -0.380 -0.307 -0.352
(0.000) *** (0.000) *** (0.000) *** (0.000) *** Improved sanitation -0.010 -0.010 -0.010 -0.013
(0.000) *** (0.000) *** (0.000) *** (0.000) *** Share of female students -0.004 -0.007 -0.011 -0.007
(0.126) (0.010) ** (0.000) *** (0.008) *** Log population 0.004 -0.010 0.011 -0.008
(0.667) (0.408) (0.387) (0.537) Gini coefficient
Governance
Health system factors Log health spending
DPT coverage -0.007
(0.000) *** Skilled Birth Attendance -0.005
(0.004) *** Log physician density -0.082
(0.009) *** Log health spending*Governance
-0.031
(0.008) *** Year dummy 1995 -0.026 -0.044 -0.024
(0.650) (0.542) (0.701) Year dummy 2000 -0.091 -0.110 -0.101 -0.085
(0.104) (0.115) (0.102) (0.107) Year dummy 2005 -0.165 -0.200 -0.289 -0.179
(0.005) *** (0.008) *** (0.002) *** (0.001) *** Constant 8.530 8.764 7.974 8.653
(0.000) *** (0.000) *** (0.000) *** (0.000) ***
F-statistics: p-value 0.000 *** 0.000 *** 0.000 *** 0.000 ***
Adjusted R-squared 0.794 0.798 0.753 0.793
#Observations 417 312 288 334
P-value in parentheses
Significance: * p<0.1; ** p<0.05; *** p<0.01

36
Table 4. Results of the fixed effects estimations
(Dependent variable: Under-five mortality rate)
Variables Model 1 Model 2 Model 3 Model 4
Socioeconomic factors Log GDP per capita -0.210 -0.238 -0.217 -0.176
(0.001) *** (0.007) *** (0.005) *** (0.020) ** Improved sanitation -0.011 -0.014 -0.008 -0.010
(0.000) *** (0.000) *** (0.003) *** (0.000) *** Share of female students 0.001 0.004 0.003 0.002
(0.680) (0.120) (0.248) (0.347) Log population 0.512 0.179 0.299 0.393
(0.000) *** (0.345) (0.109) (0.034) ** Gini coefficient -0.003
(0.172) Governance 0.133
(0.006) ***
Health system factors Log health spending -0.057
(0.109) DPT coverage
Skilled Birth Attendance
Log physician density
Log health spending*Governance
Year dummy 1995 -0.132 -0.103
(0.000) *** (0.000) *** Year dummy 2000 -0.280 -0.237 -0.138 -0.148
(0.000) *** (0.000) *** (0.000) *** (0.000) *** Year dummy 2005 -0.460 -0.414 -0.312 -0.327
(0.000) *** (0.000) *** (0.000) *** (0.000) *** Constant 1.969 4.924 2.994 2.587
(0.147) (0.014) ** (0.113) (0.168)
F-statistics: p-value 0.000 *** 0.000 *** 0.000 *** 0.000 ***
#Observations 418 230 334 336
#Group 125 93 125 125
P-value in parentheses
Significance: * p<0.1; ** p<0.05; *** p<0.01

37
Table 4. (continued) Results of the fixed effects estimations
(Dependent variable: Under-five mortality rate)
Variables Model 5 Model 6 Model 7 Model 8
Socioeconomic factors Log GDP per capita -0.200 -0.201 -0.230 -0.159
(0.001) *** (0.025) ** (0.002) *** (0.037) ** Improved sanitation -0.011 -0.011 -0.012 -0.010
(0.000) *** (0.001) *** (0.001) *** (0.001) *** Share of female students 0.001 0.000 -0.001 0.002
(0.729) (0.947) (0.552) (0.346) Log population 0.542 0.653 0.377 0.390
(0.000) *** (0.002) *** (0.035) ** (0.039) ** Gini coefficient
Governance
Health system factors Log health spending
DPT coverage 0.000
(0.851) Skilled Birth Attendance -0.003
(0.027) ** Log physician density 0.012
(0.722) Log health spending*Governance
-0.005
(0.589) Year dummy 1995 -0.136 -0.164 -0.122
(0.000) *** (0.000) *** (0.000) *** Year dummy 2000 -0.286 -0.305 -0.245 -0.152
(0.000) *** (0.000) *** (0.000) *** (0.000) *** Year dummy 2005 -0.469 -0.483 -0.448 -0.336
(0.000) *** (0.000) *** (0.000) *** (0.000) *** Constant 1.641 0.813 3.486 2.379
(0.242) (0.716) (0.042) ** (0.213)
F-statistics: p-value 0.000 *** 0.000 *** 0.000 *** 0.000 ***
#Observations 417 312 288 334
#Group 125 125 114 125
P-value in parentheses
Significance: * p<0.1; ** p<0.05; *** p<0.01

38
Table 5. Results of the system GMM estimations
(Dependent variable: Under-five mortality rate)
Variables Model 1 Model 2 Model 3 Model 4
Socioeconomic factors
Lagged log under-five mortality rate
0.893 0.913 0.942 0.938
(0.000) *** (0.000) *** (0.000) *** (0.000) ***
Log GDP per capita -0.090 -0.103 -0.080 -0.072
(0.023) ** (0.020) ** (0.132) (0.157) Improved sanitation -0.003 -0.002 -0.003 -0.003
(0.029) ** (0.237) (0.024) ** (0.024) ** Share of female students 0.001 0.000 0.002 0.002
(0.364) (0.940) (0.223) (0.308) Log population -0.017 -0.043 -0.017 -0.019
(0.117) (0.014) ** (0.194) (0.038) ** Gini coefficient 0.000
(0.649) Governance 0.023
(0.541)
Health system factors Log health spending 0.030
(0.290) DPT coverage
Skilled Birth Attendance
Log physician density
Log health spending*Governance
Year dummy 1995 0.000 -0.007
(0.984) (0.672) Year dummy 2000 -0.023 -0.033 -0.021 -0.018
(0.246) (0.117) (0.050) * (0.072) * Year dummy 2005 -0.068 -0.077 -0.059 -0.060
(0.019) ** (0.088) * (0.002) *** (0.004) *** Constant 1.255 1.564 0.801 0.831
(0.033) ** (0.080) * (0.137) (0.233)
AR1 test: p-value 0.51 0.298 0.647 0.557
AR2 test: p-value 0.214 0.703
Hansen test: p-value 0.356 0.489 0.276 0.338
#Instruments 65 66 55 57
#Observations 416 230 334 336
#Groups 125 93 125 125
P-value in parentheses
Significance: * p<0.1; ** p<0.05; *** p<0.01

39
Table 5. (continued) Results of the system GMM estimations
(Dependent variable: Under-five mortality rate)
Variables Model 5 Model 6 Model 7 Model 8
Socioeconomic factors
Lagged log under-five mortality rate
0.905 0.989 0.935 0.946
(0.000) *** (0.000) *** (0.000) *** (0.000) ***
Log GDP per capita -0.071 -0.064 -0.091 -0.080
(0.000) *** (0.050) * (0.056) * (0.082) * Improved sanitation -0.003 -0.002 -0.002 -0.003
(0.012) ** (0.043) ** (0.220) (0.019) ** Share of female students 0.002 0.000 0.000 0.002
(0.188) (0.952) (0.797) (0.171) Log population -0.023 -0.020 -0.023 -0.014
(0.005) *** (0.041) ** (0.063) * (0.126) Gini coefficient
Governance
Health system factors Log health spending
DPT coverage -0.002
(0.171) Skilled Birth Attendance 0.002
(0.096) * Log physician density 0.004
(0.862) Log health spending*Governance
0.010
(0.190)
Year dummy 1995 0.005 0.010 0.009
(0.743) (0.616) (0.527) Year dummy 2000 -0.019 -0.009 -0.012 -0.018
(0.255) (0.715) (0.444) (0.063) * Year dummy 2005 -0.058 -0.042 -0.060 -0.059
(0.019) ** (0.168) (0.054) * (0.001) *** Constant 1.162 0.552 1.126 0.768
(0.028) ** (0.297) (0.153) (0.178)
AR1 test: p-value 0.467 0.232 0.13 0.577
AR2 test: p-value 0.21 0.261 0.959
Hansen test: p-value 0.692 0.668 0.454 0.423
#Instruments 78 70 78 57
#Observations 415 312 286 334
#Groups 125 125 113 125
P-value in parentheses
Significance: * p<0.1; ** p<0.05; *** p<0.01

40
Table 6. Results of the system GMM estimations using lagged independent variables
(Dependent variable: Under-five mortality rate)
Variables Model 1 Model 2 Model 3 Model 4
Lagged log under-five mortality rate
0.893 0.980 1.069 1.038
(0.000) *** (0.000) *** (0.000) *** (0.000) ***
Log GDP per capita -0.090 -0.049 0.026 -0.003
(0.023) ** (0.365) (0.644) (0.955) Improved sanitation -0.003 -0.001 -0.001 -0.001
(0.029) ** (0.433) (0.398) (0.548) Share of female students
0.001 0.000 0.001 -0.002
(0.364) (0.837) (0.701) (0.350) Log population -0.017 -0.036 -0.038 -0.024
(0.117) (0.016) ** (0.008) *** (0.035) ** Lagged Gini coefficient
-0.001
(0.506) Lagged Governance -0.006
(0.879)
Health system factors Lagged Log health spending
0.076
(0.269) Lagged DPT coverage
Lagged Skilled Birth Attendance
Lagged Log physician density
Lagged Log health spending*Governance
Year dummy 1995 0.000 0.020
(0.984) (0.212) Year dummy 2000 -0.023 -0.024 0.000 0.027
(0.246) (0.321) (0.000) *** (0.017) ** Year dummy 2005 -0.068 -0.058 -0.031 0.000
(0.019) ** (0.039) ** (0.025) ** (0.000) *** Constant 1.255 0.750 -0.281 -0.051
(0.033) ** (0.335) (0.668) (0.943)
AR1 test: p-value 0.51 0.247 . ***
AR2 test: p-value 0.214 0.251
Hansen test: p-value 0.356 0.061 * 0.509 0.499
#Instruments 65 66 55 57
#Observations 416 263 225 230
#Groups 125 96 122 122
P-value in parentheses
Significance: * p<0.1; ** p<0.05; *** p<0.01

41
Table 6. (continued) Results of the system GMM estimations using lagged independent
variables (Dependent variable: Under-five mortality rate)
Variables Model 5 Model 6 Model 7 Model 8
Lagged log under-five mortality rate
0.918 0.915 0.872 1.076
(0.000) *** (0.000) *** (0.000) *** (0.000) ***
Log GDP per capita -0.051 -0.107 -0.111 0.014
(0.000) *** (0.157) (0.001) *** (0.790) Improved sanitation -0.003 -0.003 -0.002 -0.001
(0.081) * (0.003) *** (0.286) (0.676) Share of female students
0.001 -0.002 0.001 -0.001
(0.598) (0.478) (0.554) (0.684) Log population -0.020 -0.030 -0.018 -0.035
(0.041) ** (0.046) ** (0.079) * (0.024) ** Gini coefficient
Governance
Health system factors Log health spending
DPT coverage -0.002
(0.120) Skilled Birth Attendance
0.002
(0.061) * Log physician density -0.018
(0.489) Log health spending*Governance
0.008
(0.420)
Year dummy 1995 0.027 -0.019 -0.008
(0.099) (0.558) (0.510) Year dummy 2000 0.013 -0.037 -0.025 0.000
(0.547) (0.208) (0.149) (0.000) *** Year dummy 2005 -0.023 -0.075 -0.072 -0.024
(0.385) (0.030) ** (0.001) *** (0.079) * Constant 0.966 1.521 1.490 -0.204
(0.063) * (0.157) (0.001) *** (0.767)
AR1 test: p-value 0.366 0.208 0.883 ***
AR2 test: p-value 0.345 0.195 0.288
Hansen test: p-value 0.666 0.769 0.454 0.579
#Instruments 78 70 78 57
#Observations 406 268 343 225
#Groups 125 117 113 122
P-value in parentheses
Significance: * p<0.1; ** p<0.05; *** p<0.01

42
Table A.1. Countries in the sample
East Asia and Pacific
(EAP): 22 countries
Latin America and
Caribbean (LAC): 29
countries
Middle East and
*orth Africa
(ME*A): 13
countries
Sub-Saharan Africa
(SSA): 46 countries
Cambodia Argentina Algeria Angola
China Belize Djibouti Benin
Fiji Bolivia Egypt Botswana
Indonesia Brazil Iran Burkina Faso
Kiribati Chile Iraq Burundi
Korea, Dem. Rep. Colombia Jordan Cameroon
Lao PDR Costa Rica Lebanon Cape Verde
Malaysia Cuba Libya Central African Republic
Marshall Islands Dominica Morocco Chad
Micronesia Dominican Republic Syria Comoros
Mongolia Ecuador Tunisia Congo, Dem. Rep.
Myanmar El Salvador West Bank and Gaza Congo, Rep.
Palau Grenada Yemen Cote d'Ivoire
Papua New Guinea Guatemala South Asia (SA): 8
countries
Eritrea
Philippines Guyana Afghanistan Ethiopia
Samoa Haiti Bangladesh Gabon
Solomon Islands Honduras Bhutan Gambia
Thailand Jamaica India Ghana
Timor-Leste Mexico Maldives Guinea
Tonga Nicaragua Nepal Guinea-Bissau
Vanuatu Panama Pakistan Kenya
Vietnam Paraguay Sri Lanka Lesotho
Europe and Central Asia
(ECA): 23 countries
Peru Liberia
Albania St. Kitts and Nevis Madagascar
Armenia St. Lucia Malawi
Azerbaijan Vincent and the Grenadines Mali
Belarus Suriname Mauritania
Bosnia and Herzegovina Uruguay Mauritius
Bulgaria Venezuela Mozambique
Georgia Namibia
Kazakhstan Niger
Kyrgyz Republic Nigeria
Latvia Rwanda
Lithuania Sao Tome and Principe
Macedonia Senegal
Moldova Seychelles
Montenegro Sierra Leone
Poland Somalia
Romania South Africa
Russian Federation Sudan
Serbia Swaziland
Tajikistan Tanzania
Turkey Togo
Turkmenistan Uganda
Ukraine Zambia
Uzbekistan Zimbabwe

43
Table A.2. Description of governance indicators
Indicator Description
1. Voice and Accountability – capturing perceptions of the extent to which a country's citizens are able to participate in selecting their government, as well as freedom of expression, freedom of association, and a free media.
2. Political Stability and Absence of Violence
– capturing perceptions of the likelihood that the government will be destabilized or overthrown by unconstitutional or violent means, including politically-motivated violence and terrorism.
3. Government Effectiveness
– capturing perceptions of the quality of public services, the quality of the civil service and the degree of its independence from political pressures, the quality of policy formulation and implementation, and the credibility of the government's commitment to such policies.
4. Regulatory Quality
– capturing perceptions of the ability of the government to formulate and implement sound policies and regulations that permit and promote private sector development.
5. Rule of Law
– capturing perceptions of the extent to which agents have confidence in and abide by the rules of society, and in particular the quality of contract enforcement, property rights, the police, and the courts, as well as the likelihood of crime and violence.
6. Control of Corruption – capturing perceptions of the extent to which public power is exercised for private gain, including both petty and grand forms of corruption, as well as "capture" of the state by elites and private interests.

44
Figure 1. Under-five mortality rate in the developing regions
Source: UN, 2009 and UN, 2010
Figure 2. Causes of child deaths
Source: WHO and UNICEF, 2010
Developing
regions
Northern
Africa
Sub-
Saharan
Africa
Latin
America &
Caribbean
Eastern
Asia
Southern
Asia
South-
Eastern
Asia
Western
AsiaOceania CIS, Asia CIS, Europe
1990 100 83 183 54 45 122 77 67 85 78 26
2000 88 48 164 33 36 95 46 46 69 62 23
2007 72 29 144 23 21 74 38 32 60 39 14
0
20
40
60
80
100
120
140
160
180
200
U5
MR
Pneumonia,
neonatal, 4%Preterm, 12%
Asphyxia, 9%
Sepsis, 6%
Other neonatal, 5%
Congenital, 3%Tetanus, 1%
Diarrhoea,
neonatal, 1%Diarrhoea, 14%Measles, 1%
Injury, 3%
Malaria, 8%AIDS, 2%
Pertussis, 2%
Meningitis, 2%
Other infections, 9%
Noncommunicable
diseases, 4%
Pneumonia, 14%
Neonatal 41%

45
Figure 3. Maternal mortality ratio in the developing regions
Source: UN, 2009
Figure 4. Direct and indirect causes of maternal deaths
Source: WHO and UNICEF, 2010
Figure 5. Access to health services for pregnant women in developing countries
Source: UNICEF, 2009
Developing
regions
Northern
Africa
Sub-
Saharan
Africa
Latin
America &
Caribbean
Eastern AsiaSouthern
Asia
South-
Eastern Asia
Western
AsiaOceania CIS
1990 480 250 920 180 95 620 450 190 550 58
2005 450 160 900 130 50 490 300 160 430 51
0
100
200
300
400
500
600
700
800
900
1000
MM
R
Haemorrhage,
35%
Hypertension,
18%Sepsis, 8%
Abortion, 9%
Embolism, 1%
Other direct, 11%
Indirect,
18%
61
85 87
4145
60
69
78
53
23
77
9489
6872
46
83
66
34
42
0
10
20
30
40
50
60
70
80
90
100
Developing
countries
Latin America and
Caribbean
East Asia and
Pacific
South Asia Sub-Saharan Africa
Delivery care coverage
(%) Skilled attendant at
birth 2000-07
Contraceptive
prevalence (%) 2000-07
ANC coverage (%) At
least once 2000-07
ANC coverage (%) At
least 4 times 2000-07

46
Figure 6. Conceptual framework of maternal, newborn and child survival
Socioeconomic status (SES) Political, economic, social,
technological, environmental factors
Health
system
Financial
flows
•ODA
•Domestic
Health systems
and policies
•Human resources
•Policies
•Health systems strength
Coverage
Equity
•Health status
•Coverage
•SES
•Gender
•Geographic Family and
community
Source: WHO and UNICEF, 2010
Figure 7. Framework of health systems in “World Health Report 2000”
Stewardship
Financing
(collecting, pooling,
and purchasing)
Delivering servicesCreating resources
Fair (financial)
contribution
Health
Responsiveness
(to people’s non-
medical expectations)
Functions Goals
Source: WHO, 2000

47
Figure 8. Framework of health systems in WHO’s “Everybody’s Business”
Service delivery
Leadership/Governance
Financing
Medical Products, Vaccines
& Technologies
Information
Human resources
System building blocks Overall goals/ Outcomes
Improved health (level & equity)
Improved efficiency
Social and financial risk
protection
Responsiveness
Access
Coverage
Quality
Safety
Source: WHO, 2007
Figure 9. Framework of social determinants of health (SDH)
Socioeconomic
&
political context
Governance
Policy
(Macroeconomic,
Social Health)
Cultural and
societal norms
and values
Societal position Maternal
circumstances
Social cohesion
Psychosocial
factors
Biological
factors
Distribution of
health and well-
beingEducation
Occupation
Income
Gender
Ethnicity/ Race
Health -Care System
Social determinants of health and health inequities
Source: CSDH, 2008

48
Figure A.1. GDP per capita by the region
Figure A.2. GDP per capita (log) and under-five mortality rate (log)
1990-1994 1995-1999 2000-2004 2005-2008
EAP 2,601 2,876 3,090 3,582
ECA 5,284 4,783 5,944 8,160
LAC 5,587 6,202 6,486 7,524
MENA 4,070 5,080 5,485 6,252
SA 1,416 1,839 2,216 2,756
SSA 2,223 2,336 2,461 2,760
1000
2000
3000
4000
5000
6000
7000
8000
9000
GD
P p
er
cap
ita
, P
PP
, co
nst
an
t 2
00
5
inte
rna
tio
na
l U
S d
oll
ar
23
45
62
34
56
5 10 5 10
1990-1994 1995-1999
2000-2004 2005-2008
Under-five mortality rate (log)
GDP per capita (log)bandwidth = .8
Lowess smoother
49
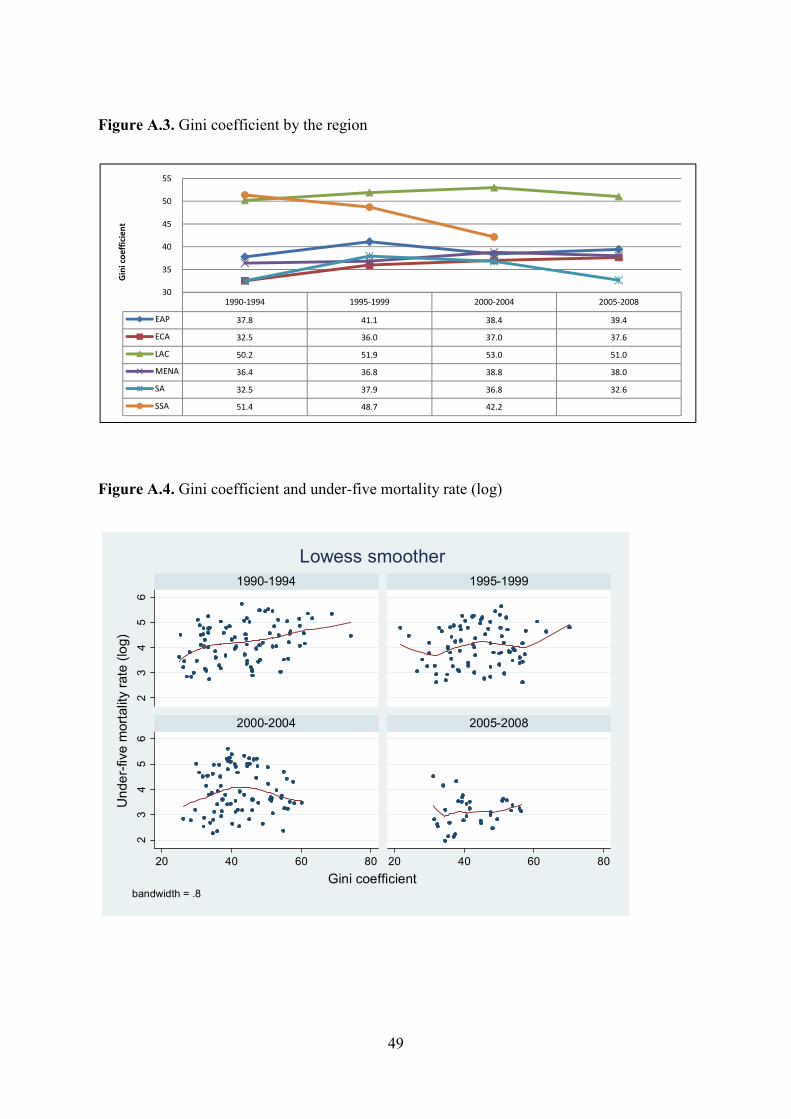
Figure A.3. Gini coefficient by the region
Figure A.4. Gini coefficient and under-five mortality rate (log)
1990-1994 1995-1999 2000-2004 2005-2008
EAP 37.8 41.1 38.4 39.4
ECA 32.5 36.0 37.0 37.6
LAC 50.2 51.9 53.0 51.0
MENA 36.4 36.8 38.8 38.0
SA 32.5 37.9 36.8 32.6
SSA 51.4 48.7 42.2
30
35
40
45
50
55
Gin
i co
eff
icie
nt
23
45
62
34
56
20 40 60 80 20 40 60 80
1990-1994 1995-1999
2000-2004 2005-2008
Under-five mortality rate (log)
Gini coefficientbandwidth = .8
Lowess smoother

50
Figure A.5. Mean value of six governance indicators by the region
Figure A.6. Mean value of six governance indicators and under-five mortality rate (log)
1995-1999 2000-2004 2005-2008
EAP 3.65 3.64 3.67
ECA 3.48 3.51 3.63
LAC 3.93 3.90 3.90
MENA 3.26 3.31 3.25
SA 3.54 3.45 3.36
SSA 3.33 3.34 3.33
3.10
3.20
3.30
3.40
3.50
3.60
3.70
3.80
3.90
4.00
Me
an
va
lue
of
six
go
ve
rna
nce
in
dic
ato
rs2
34
56
23
45
6
2 3 4 5
2 3 4 5
1995-1999 2000-2004
2005-2008
Under-five mortality rate (log)
Mean value of six governance indicatorsbandwidth = .8
Lowess smoother

51
Figure A.7. Government health expenditure per government total expenditure by the region
Figure A.8. Government health expenditure per government total expenditure (log) and under-five mortality rate (log)
.
1995-1999 2000-2004 2005-2008
EAP 8.9 9.2 10.1
ECA 10.2 10.3 11.0
LAC 12.6 12.0 12.1
MENA 7.4 7.6 7.9
SA 6.3 6.2 6.8
SSA 8.1 8.8 9.8
6.0
7.0
8.0
9.0
10.0
11.0
12.0
13.0
Go
ve
rnm
en
t h
ea
lth
sp
en
din
g p
er
go
ve
rnm
en
t to
tal
spe
nd
ig (
%)
23
45
62
34
56
0 1 2 3
0 1 2 3
1995-1999 2000-2004
2005-2008
Under-five mortality rate (log)
Government health spending per government total spending (log)bandwidth = .8
Lowess smoother

52
Figure A.9. DPT coverage by the region
Figure A.10. DPT coverage and under-five mortality rate (log)
1990-1994 1995-1999 2000-2004 2005-2008
EAP 77.9 79.3 79.3 82.4
ECA 82.5 91.8 93.3 94.8
LAC 80.9 84.4 87.2 88.9
MENA 81.9 84.3 87.1 89.7
SA 64.8 71.8 77.1 85.7
SSA 61.6 60.8 66.5 75.8
50.0
55.0
60.0
65.0
70.0
75.0
80.0
85.0
90.0
95.0
100.0
DP
T c
overage (
%)
EAP
ECA
LAC
MENA
SA
SSA
23
45
62
34
56
20 40 60 80 100 20 40 60 80 100
1990-1994 1995-1999
2000-2004 2005-2008
Under-five mortality rate (log)
DPT coverage, %bandwidth = .8
Lowess smoother

53
Figure A.11. Physician per 1,000 people by the region
Figure A.12. Physician per 1,000 people (log) and under-five mortality rate (log)
1990-1994 1995-1999 2000-2004 2005-2008
EAP 0.46 0.74 0.69 1.50
ECA 3.12 2.99 2.95 2.84
LAC 1.07 1.33 1.46 1.45
MENA 0.77 0.97 1.17 1.36
SA 0.24 0.29 0.42 0.33
SSA 0.20 0.18 0.19 0.30
0.00
0.50
1.00
1.50
2.00
2.50
3.00
3.50
Ph
ysi
cia
ns
per 1
,000 p
eop
le
EAP
ECA
LAC
MENA
SA
SSA
23
45
62
34
56
-4 -2 0 2 -4 -2 0 2
1990-1994 1995-1999
2000-2004 2005-2008
Under-five mortality rate (log)
Physicians per 1,000 people (log)bandwidth = .8
Lowess smoother