determinants of milk use in the public ... - dairy markets
TRANSCRIPT

AE&RS209 FEBRUARY 1990
Marketing Research Report 6
Determinants of Milk Use in the Public Schools of Pennsylvania
Blair J. Smith Jack J. Kirkland
Department of Agricultural Economics and Rural Sociology Agricultural Experiment Station
The Pennsylvania State University University Park, P A 16802

ACKNOWLEDGEMENTS
INTRODUCTION . .
RELATED STUDIES
DATA ..
RESULTS
CONTENTS
Key Characteristics of School Lunch and Milk Programs
Multivariate Analysis
DISCUSSION
SUMMARY
REFERENCES
Participation in the School Lunch Program
Milk Consumption per Student per Day
OTHER REPORTS RELATED TO THIS RESEARCH
ACKNOWLEDGEMENTS
1
2
3
5
6
6
9
9
12
14
17
21
22
The authors gratefully acknowledge the cooperation of the 443 Pennsylvania public school district food service directors who completed the mail questionnaire used as the primary source of data in this study. Special thanks are also extended to James Dorwart and Loretta Adderson of the Pennsyl vani a Department of Educat ion for the counsel and information they provided, all of which was virtually indispensable to the successful completion of this study.
This research was supported in part by a special appropriation from the u.S. Congress administered by the U.S. Department of Agriculture.
2
DETERMINANTS OF MILK USE IN THE PUBLIC SCHOOLS OF PENNSYLVANIA
Blair J. Smith and Jack J~ Kirkland1
INTRODUCTION
The dairy industry has long promoted the idea of making milk
available in public schools, both in the United States and in many
other developed countries of the worlq as well. That they are
supported by the general public in this matter is evidenced by the
presence of free or reduced-price milk iin the public schools of many
countries today. In 1982, for example, ~ales of fluid milk in schools
were est-imated at 7.0, 15.2, and 6.2 percent of all milk sales in
Belgium, Japan, and the United States, r~spectively [1]. In all three
of these countries school milk sales were l subsidized with public funds.
Presumably, public support of school milk schemes is motivated out
of concern for the nutritional well-being of school children. The
general public (and the dairy industry) seems to believe that higher
milk consumption in our public schools is preferable to lower levels of
consumption. The purpose of this research is to identify factors which
may explain differences in the levels of consumption of milk in the
public schools of Pennsylvania.
1 Assoc i ate Professor and formerl y Ass i stant Profes sor of Agricultural Economics, respectively.

3
RELATED STUDIES
A study of the quality of school mil k and the patterns of mi 1 k
consumption in 271 public schools (195 elementary, 36 middle, 40 high)
in Connecticut was conducted throughout the 1978-79 school year [2].
Although several measures of quality were established, no attempts to
relate quality to levels of consumption were reported. Preferences for
type of milk among the students in the public schools studied were
reported. Strong preferences for chocolate over whole white milk were
found within all categories of schools where both products were
offered. El ementary and mi ddl e school students were found to prefer
chocolate over white in the ratio of about 2.6 to 1.0, but this ratio
was only about 1.5 to 1.0 among high school students. An analysis of
mi 1 k waste was i ncl uded -j n the study, and it was found that a higher
proportion of whole white than chocolate was wasted.
In the fall of 1983 researchers at Cornell mailed a questionnaire,
focusing on school milk, to everyone of the 709 public school
districts in New York [3]. The results they reported are based on a
usabl e response rate of 29 percent. Average daily consumption was
0.84 half pints per student in the 1982-83 school year . A negative
correlation between average daily consumption of milk and number of
students in the district was discovered. No significant relationships
were found between average daily consumption and (a) chocolate milk's
share of total beverage sales, (b) the pr.ice of whole white milk, or
(c) the price of chocolate milk. Among the responding school
districts, 72 percent offered chocolate milk for lunch. Presumably
4
(although this was not made explicit in the report) 100 percent of the
districts offered whole white milk. On a volume basis, chocolate milk
accounted for 37 percent of all m"ilk beverage sales, and whole white
accounted for 44 percent. The remainder was comprised of skim and low
fat milks. If chocolate had been offered in all the school districts,
sales of chocolate most likely would have exceeded sales of white milk
on a per student basis.
In the spring of 1987, a survey was sent to cafeteria managers in
12,000 schools in eight southeastern states under the sponsorship of
the Southeast United Dairy Industry Association [4]. Completed
questionnaires were received from 2,161 schools. Some key findings
pertinent to our study are:
(a) Virtually all of the schools participated in the National
School Lunch Program, and 82 percent of the students in those schools
ate lunch in the school's cafeteria. The "offer vs. serve" program was
operative in 63 percent of the elementary schools, 88 percent of the
middle schools, and 95 percent of the high schools.
(b) The actual quantities of milk beverages consumed were not
reported. Percentages of schools offering the several different milk
products were provided. The frequencies at which students chose
particular products were determined only for "any milk product" (84%)
and for "any chocolate product" (74% of the 84% choosing milk). The
preference for chocolate does seem to be very strong, but there is no
direct way of comparing chocolate milk sales to sales of any of the
other products because actual volumes by type of product were not
provided.

5
DATA ·
Two principal sets· of data serve as the basis for the analysis
reported in this article. One was provided by the Pennsylvania
Department of Education (PDE), the other was obtained by way of a
direct mail survey of Pennsylvania public school district food service
directors.
The PDE provided the following for each of Pennsylvania's 500
school districts for the 1986-87 academic year:
Average Daily Attendance Numbers of School Breakfasts and School Lunches Served Numbers of Lunches Served Free or at Reduced Prices Racial-Ethnic Composition of the Student Body Mailing Labels for the District Administrative Offices, and Names of the District Food Service Directors.
The primary survey instrument was mailed out on October 15, 1987.
The Total Design Method of Dillman [5] was followed except that a
cert ifi ed 1 etter for the fi na 1 mail i ng was not used. By the end of
December 1987, following several reminders, 443 completed
questionnaires had been returned for a response rate of 88.6 percent.
Ultimately, 413 of these were determined to be usable and serve as the
basis for our analysis.

6
RESULTS
Key Charact eristics of School l unch and Mi lk Programs
It was found that all respondent districts had a school lunch
program, 15 percent had a school breakfas"t program, and 19 percent
participated in the special milk program. Chocolate milk was available
to students in 78 percent of the elementary schools in the reporting
districts . However, in 27 percent of those school districts where
chocolate milk was available at the elementary level, there were
restrictions imposed as to frequency of offering (days per week) and/or
numbers of cartons students were permitted to purchase with anyone
meal. The average number of different types of products offered was
3.3 per school district. Virtually all the districts (98.6 percent)
reported offering an unflavored lowfat or skim product, as required for
participation in the National School Lunch Program. Either a whole or
lowfat chocolate product, or both, were offered in one or more schools
in 97 percent of the reporting districts. How many individual school s
within each district offered a chocolate-flavored milk was not
determined.
Table 1 provides additional detail regarding the types of product
available to students. In the final column there are estimates of what
the overall preferences for each product would be if they were
available in every school district. Table 2 shows the characteristics
of school districts with respect to several key variables. These
variables, along with others to be discussed later, were used in the
multivariate analyses reported in the next section of this report .

7
Table 1: Share of Milk Sales by Product Type and Prevalence of Product Offering in Pennsylvania Public School Districts.
Actual Share Hypothetically of Sales Prevalence of Extended Share of (% of total Offeri ng (% of Sales (% of total
Product Type milk sales) school districts) milk sales)a
Unfl avored mil k:
Whole 26.9 90.0 17.9 2% lowfat 10.7 67.2 9.5 1% lowfat 1.1 7.7 8.3 Skim 3.2 55.5 3.6
Chocolate Flavored Milk:
Whole 15.6 42.6 22.0 Lowfat 42.5 65.8 38.7
Total 100.0 b 100.0
a The numbers in this column are derived by dividing Actual Share of Sales by Prevalence of Offering and scaling the resulting figure to sum to 100. They are, roughly, the shares that each type of product would be expected to command were they all to be offered in all school districts. A key assumption here is that students in schools not now receiving any particular product would consume that product in the same relative quantities as those students who are in schools that do already offer that product.
b The sum here is considerably greater than 100 because of multiple offerings of types of products.
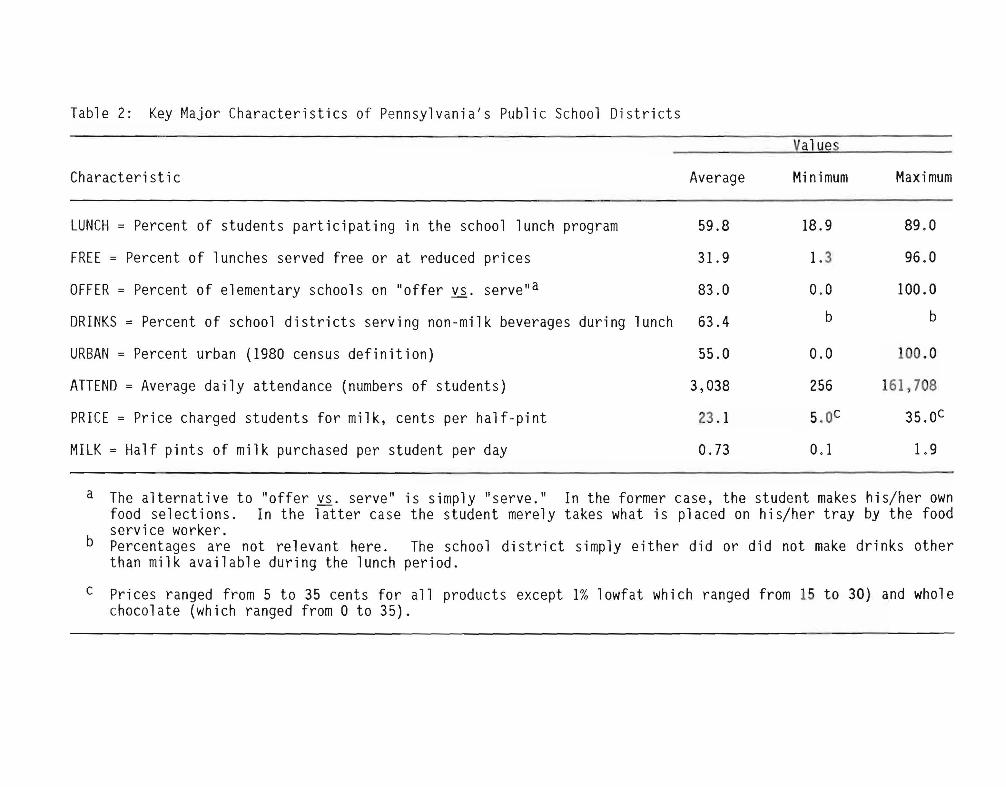
Table 2: Key Major Characteristics of Pennsylvania's Public School Districts
Characteristic
LUNCH = Percent of students participating in the school lunch program
FREE = Percent of lunches served free or at reduced prices
OFFER = Percent of elementary schools on "offer vs. serve"a
DRINKS = Percent of school districts serving non-milk beverages during lunch
URBAN = Percent urban (1980 census definition)
ATTEND = Average daily attendance (numbers of students)
PRICE = Price charged students for milk, cents per half-pint
MILK = Half pints of milk purchased per student per day
Average
59.8
31.9
83.0
63.4
55.0
3,038
23 .1
0.73
Values
Minimum Maximum
18.9 89.0
1.3 96.0
0.0 100.0
b b
0.0 100 .0
256 161,708
5.0c 35.0c
0.1 1.9
a The alternative to "offer vs. serve" is simply "serve." food selections. In the latter case the student merely service worker.
In the former case, the student makes his/her own takes what is placed on his/her tray by the food
b Percentages are not relevant here. The school di stri ct than milk available during the lunch period.
simply either did or did not make drinks other
c Prices ranged from 5 to 35 cents for all products except 1% lowfat which ranged from 15 to 30) and whole chocolate (which ranged from 0 to 35) .

9
Multivariate Analysis
The key dependent vari abl e of interest was mil k consumption per
student per day (MILK). The MAXR vari ant of the stepwi se regress ion
model [6] was used to sort through the variables hypothesized to have
explanatory usefulness. Early in the analysis, it became evident that
the variable explaining the most variation in level of milk consumption
was rate of student participation in the school lunch program (LUNCH).
Attention was then directed toward explaining variation in LUNCH
before returning to the initial, key variable of interest, MILK.
Participation in the School Lunch Program (LUNCH).
The results of the analysis which focused on LUNCH are summarized
in Table 3. All the coefficients have signs that confirm they are
related to LUNCH in the expected manner. The dominance of URBAN in the
estimating equation is evident in the relative sizes of the student's
t-values. In fact, URBAN was the first variable to enter the stepwise
regression, and immediately accounted for 23 percent of the variation
in LUNCH. After the other four variables had entered, the R-square
increased to only 0.27, thus explaining only an additional four
percent of the variation in the percent of students participating in a
district's school lunch program (LUNCH).
Most of the coefficients (with the exception of PRICE and URBAN)
are relatively small in comparison to the mean values for the variable
included in the equation. This is evident from the figures in the last
column of Table 3. For example, in order to increase participation in

10
Table 3: Statistics from the Equation Used to Explain Participation in the School Lunch Program (LUNCH)
Statistics
Regression Mean Student's Variable~ Coefficient Values t-valueQ
Intercept 72.55954 19.239
FREE 0.07201 31.9 2.348
OFFER 0.03870 83.0 2.665
PRICE - 0.30347 23.1 -2.028
ATTEND - 0.00011 3,038 -1. 755
URBAN -0.19761 55.0 -9.433
Total number of observations F value for the analysis of variance R - square
382 d 27.4 0.27
a As defined in Table 2.
Change needed to Increase LUNCH one percent£;.
+13 .9
+25.8
-3.3
-8,728
-5.1
b All coefficients are statistically significant at the ten percent probability level or less.
c The change in the independent vari abl e needed to increase the dependent variable by one percent (from 59.8 to 60.8 percent, for example, at the mean)
d Significant at the 0.0001 probability level.

11
the school lunch program (LUNCH) by one percent, the percent of lunches
served free or at reduced prices (FREE) would need to be increased by
13.9 percent. This would require FREE to go from 31.9 percent, its
mean value, to 45.8 percent. It probably is not possible to increase
FREE to this degree in a short period of time within a given school
district. Nevertheless, the range of FREE within the 382 school
districts in the sample is 1.3 to 96.0 percent, implying a difference
in LUNCH among these districts of 6.8 percent [(96.0 - 1.3) ~ 13.9]
attributable to FREE.
Similar interpretations can be applied to the other explanatory
(independent) variables. A brief discussion about PRICE (price charged
students for milk, cents per half-pint) is in order. PRICE is an
important explanatory variable for the MILK (half-pints of milk drunk
per student per day) equation reported in the next section of this
article. As used in the present equation (LUNCH), MILK is a proxy for,
or i nd i cator of , school 1 unch pri ces. Unfortunately, data on school
1 unch pri ces were not obtained in the school survey, so the actual
nature of the correspondence between school mil k pri ces and school
lunch prices could not be established. We would expect school lunch
participation to vary inversely with school lunch price, all other
things being equal.

12
Milk Consumpt ion per Student per Day (M ILK)
The res ul ts of the model f i nall y chosen to explain MILK are
summarized in Table 4. As previously ment i oned, LUNCH was a very
strong explanatory var i able for MILK. Table 4 shows an R-square of
0 .27 for the three var i able model. The domin ance of LUNCH i n the final
model is attested to by the fac t t ha t the R-square was 0 .24 after just
the firs t variable (LUNCH) was incorporated into the model. Thus, the
addition of PRICE and DRI NKS did not add much to the explanatory pmver
of the model. Nevertheless, the signs of their coefficients are as
expected, and they are statistically significant at low levels of
probabil i ty .
The figures in the fin al column of Table 4 are another way of
i ll ustrating the importance and potential impact of variation in the
independent variables on the level of MILK. In Table 2 it is shown
that LUNCH ranged from 18.9 to 89.0 percent in the sample school
districts. This is a range of 70.1 percent, and implies a potential
difference in MILK of 0.62 half-pints between the school district with
the lowest level of LUNCH and the one with the highest level of LUNCH
[ (70.1 + 11. 3) x (0.1 ) ]

Table 4: Statistics from the Equation Used to per Student per Day (MILK)
Statistics
Variablea Regression Mean Coefficient Values
Intercept 0.42960
LUNCH 0.00889 59.8
PRICE - 0.00892 23.1
DRINKS - 0.04369 0.63
Total number of observations
F value for the analysis of variance
R - square
a As defined in Table 2
Studentbs t-value
9.853
- 3.071
- 1. 972
382
46.3d
0.27
13
Explain Milk Consumed
Change needed to increase MILK 0.1 half-pintsC
+ 11.3
- 11. 2
c
b All coefficients are statistically significant at the five percent probability level or less.
c The change in the independent vari abl e needed to increase the dependent variable by 0.1 half-pints (from 0.73 to 0.83, for example, at the mean). Since DRINKS is a zero-one var"iable, the coefficient for drinks tells us that in those school districts where drinks other than milk are available during the school lunch period, students drink 0.04 fewer half pints of milk each day.
d Significant at the 0.0001 probability level.

14
Although reducing the price of milk (PRICE) would be expected to
increase milk consumption, the potential is not great because prices
would have to be cut almost in half to generate just a 0.1 half-pint
increase in MILK. To stop offering other drinks at lunch would not
seem to show much promise either, because to do so would be expected to
increase milk consumption by only 0.04 half-pints .
DISCUSSION
Results are presented on the basis of entire school districts,
not individual schools or individual students. Among the 500 public
school districts in Pennsylvania, the number of school buildings ranged
from 1 to 256. Thus, there is a rather high degree of aggregation in
the data in most cases, and the overall explanatory power (R-squares)
of the estimating equations are rather low. Because of the 1 arge
number of observations fairly high levels of significance for the
relationships tested were found, however, and the signs of the
regression coefficients were in accordance with prior expectations.
The data on milk sales by type of product (Table 1) show a clear
and strong preference for lowfat chocolate. 2 The least preferred milk
product would seem to be unflavored skim milk. National school lunch
rules, as of the 1987-88 school year, require the offering of a whole
milk (flavored or unflavored) and a white lowfat or skim milk beverage
(or buttermilk), in order to be eligible for subsidies from state and
federal funds. If a school cafeteria is limited to serving only two
milk beverages, one of them, of course, must be whole milk (either
wh ite or chocolate). F or the second mil k beverage, it is clear wh ite

15
skim milk would lose out to the 1 percent and 2 percent lowfat white
products, if a school's goal is to maximize milk consumption by public
school students. A slight preference for the 2 percent product is
indicated in Table 1, but further analysis is required before it can
be asserted with confidence 2 percent would be the best choice for the
second mil k beverage. One-percent mil k might have the advantage of
being the better compromise between whole milk (3.25% butter fat) and
skim milk (less than 0.5% butter fat). Preference for skim milk and
one percent milk might increase if they were fortified with added non
fat mi-Ik solids to improve their flavor, but little of either fortified
product is currently being bottled in Pennsylvania. The fact remains
- a lot of school districts offer skim milk (mostly unfortified), and
there are very few takers. If there is the opportunity to offer three
products, there is no doubt the third product ought to be lowfat
chocolate, again assuming a goal of maximum milk consumption on a per
student basis.
The multi-variate analysis showed clearly that participation in
the school 1 unch program (LUNCH) was the primary determinant of mil k
consumption (MILK). LUNCH, on a district to district basis, varied
from 18.9 to 89.0 percent, with 59.8 as the mean rate of participation
(Table 2).3 MILK, on the other hand, ranged more widely, from 0.1 to
1.9 half-pints per student per day, with a mean of 0.73 half-pints
(Table 2).4 There was no way to separate milk drinkers into those who
ate the school's 1 unch from those who d i dn' t, since mil k was made
available on an a-la-carte basis in all the districts. If all the
mil k purchased was assumed to be attri butab 1 e only to school 1 unch

16
part i cipants, however, the average rate of consumption would be 1.2
hal f-pints, with a range of 0.1 to 3.0 half-pints per student.
As shown in Table 3, the way to increase LUNCH is to increase FREE
and OFFER, and to decrease PRICE, ATTEND, and URBAN . 5 Of course,
ATTEND and URBAN are largely dependent on size and location of the
school district, and these factors are outside the control of school
administrators. In the present case, they simply help explain
variation in LUNCH. Local school administrators may not have much
control over FREE, either, as the criteria for eligibility for free or
reduced price lunches are established elsewhere. If the price of milk
(PRICE) is an adequate proxy for the price of school lunches
generally, then reducing the price of school lunches would clearly
increase LUNCH. Not many food servi ce supervi sors are 1 ike 1 y to feel
there is a lot of remaining unexploited opportunity there, however.
The final, remaining variable, OFFER (percent of elementary schools on
"offer vs. serve"), is a variable that would seem to be clearly under
the control of local school district administrators. Although the mean
value of OFFER is already high at 83.0, its range is from 0 to 100
(Table 2). This certainly implies a potential for increasing LUNCH
within the districts with low levels of OFFER.
Aside from finding ways to increase LUNCH as a way of increasing
MILK, changing two other variables, both largely under the control of
local school district administrators, may be considered. The most
direct one, of course, is PRICE. But the predicted effect would be
small. To increase MILK by only 0.1 half-pints would require a
reduction in price of 11.2 cents (Table 4). This would be roughly
17
equivalent to cutting the price of milk in half, on average (from 23.1
to 11.9 cents). The other variable that might be manipulated to
increase MILK is DRINKS (the availability of non-milk beverages during
the school lunch period). Nevertheless, the analysis shows that even
if those di stri cts that do offer competing beverages were to cease
doing so, an increase in MILK of only 0.04 half-pints per student per
day would be expected to take place.
Again, for emphasis, a word of caution. The data on which all the
preceding analysis is based are highly aggregated. Thus, much of the
variation that exists among individual schools is masked. Since this
variation is masked, the potentials for both increasing LUNCH and MILK
within any particular school can only be highly general ized, as they
have in this report. Further analysis of the present data is
contemplated and will be reported in other publications. Also,
individual school visits will later be conducted in an attempt to
better quantify the variation that does exist from school to school.
SUMMARY
The specific purpose of the survey reported here was to determine
and explain differences in levels of m"ilk consumption among
Pennsylvania public school districts. A mail survey to all 500
Pennsylvania school district food service directors resulted in 413
usable returns. This information, along with certain key data from the
Pennsylvania Department of Education, form the basis for the findings
and conclusions reported in this article.
The key variable of ultimate interest was the number of half-pints

18
of milk consumed per student per day (MILK). This variable ranged in
value from 0.1 to 1.9, with 0.73 for a mean. Multivariate analyses of
the data showed that participation in the school lunch program (LUNCH)
was by far the most important "explainer" of MILK (accounting for 24
percent of the variation). In turn, the percent of the people living
in the county in which the school district was located who were defined
to be urban in the 1980 census of popul ation was by far the most
important "explainer" of LUNCH (accounting, also, for 24 percent of the
total variation).
Other variables whose regression coefficients were statistically
significant and of the right sign in the equation for LUNCH were:
percent of lunches served free or at reduced prices; percent of
elementary schools on "offer vs serve"; price of milk (as a presumed
proxy for price of the school lunch), and; average daily attendance in
the school district. The addition of all four of these variables
increased the multiple correlation coefficient (R2) by only four
percent, however, bringing to 27 the percent of total variation
explained by the entire estimating equation.
Other variables in the MILK equation that were statistically
significant with the anticipated sign were: the price of milk, and;
whether or not other drinks were available during the school lunch
period. Again, but strictly by coincidence, the addition of these two
variables increased R2 only to 0.27, an increase in the explanatory
power of the equation of only three percent.
It is clear the milk beverage of first choice, where offered, is
lowfat chocolate. It is even clearer the milk beverage least desired

19
by students , where offered, is white skim milk. Either 1% or 2% lowfat
white milk should be used to fulfill the requirement for a lowfat or
skim white product, if a goal is to increase milk consumption in public
schools. Federal regulations now require that whole miH be offered
(beginning with the 1987-88 academic year) in addition to a white
lowfat or skim product. Thus, in order to offer lowfat chocolate, the
school cafeteria must have the capacity to handle at least three
different milk products. If such capacity does not exist, the new
school lunch milk requirement effectively prevents offering the milk
beverage most desired by public school students.
Because data were obtained and analyzed on the basis of entire
school districts, much of the variation in the key variables of
interest may have been obscured. Additional analyses of the present
data are contemplated. In 1 ater research, data wi 11 be obta i ned from
individual schools in an attempt to further advance our understanding
of what drives the consumption of milk in the public schools of
Pennsylvania.

2
3
20
FOOTNOTES
Hankin, et al. [2] also showed there was a strong preference for
chocolate over white when both products were offered. A similar
preference can be inferred from the data in Boynton and Bandl er
[3] . A strong preference for chocolate was apparent, too, in
Lenox [4].
The mean rate of participation in the school lunch program in the
ei ght southeastern states i ncl uded in the Lenox study [4] was
reported to be 82 percent .
4 Average daily consumption per student was estimated to be 0.84
half pints in Boynton and Bandler [3].
5 It was reported in Boynton and Bandler [3] that ATTEND and MILK
were negatively correlated, which agrees with our findings here .
It was also asserted that neither the price of whole white or
chocolate milk were significantly related to MILK . We found a
significant negative relationship between MILK and PRICE, but it
was, of course, quite small.
21
REFERENCES
[1] Weale, R. M. 1983. School Milk Schemes 1983, International Dairy
Federation, Document 164.
[2] Hankin, L., Stephens,G., Shields,D., and Cushman, K. 1980.
Quality of Milk and Patterns of Consumption by Children in
Connecticut Schools and Camps, Bulletin 782, The Connecticut
Agricultural Experiment Station New Haven, New Haven, CT
06504.
[3] Boynton, R. D. and Bandler, D. K. 1984. Milk Use in New York
State Public Schools, Cornell Agricultural Economics Staff
Paper No. 84-27, Cornell University Agricultural Experiment
Station, Ithaca, NY, 14853.
[4] Lenox Research, Inc. 1987. Flavor Saver Survey ... School
Cafeteri a Managers, prepared for the Southern Un ited Dairy
Industry Association, Atlanta, Georgia, by Lenox Research,
Inc., 1009 Adam Avenue, N.E., Atlanta, GA 30306.
[5] Dillman, D. A. 1978. Mail and Telephone Surveys: The Total
Design Method. New York: John Wiley and Sons, Inc.
[6] SAS Institute Inc. 1985. Sas User's Guide: Statistics, Version
5 Edition. Cary, N.C.

22
OTHER REPORTS RELATED TO THIS RESEARCH
Smith, B. J. and R. S. Miller. 1988. Characteristics of Packaged Fluid Milk Sales in Pennsylvania, October 1987. Department of Agricultural Economics and rural Sociology, A.E. & R.S. 197, The Pennsylvania State University, June 1988, 56 pp.
Herrmann, R.O., R. H. Warland, and B. J. Smith. 1988. Assessing the Impact of Milk Advertising: A Survey of U.S. and Pennsylvania Adults, Department of Agricultural Economics and Rural Sociology, A.E. & R.S . 199, tt.arketing Research Report 4, The Pennsylvania State University, December 1988, 26 pp.
Warland, R. H., C. Kassab, R. O. Herrmann, and B. J. Smith. 1989. "Who's Drinking More (or Less) Milk?" Farm Economics, Penn State Cooperative Extension, The Pennsylvania State University, University Park, PA, January/February 1989, 4 pp.
Smith, B. J. 1989. Characteristics and Practices of Dealers Delivering Milk to Pennsylvania Public Schools. Department of Agricultural Economics and Rural Sociology, A.E. & R.S. 202, Marketing Research Report 5, The Pennsylvania State University, February 1989, 20 pp.
Smith, B. J., R. H. Warland, R. O. Herrmann, and S. S. Houts, 1989. "Why People Do or Do Not Drink Milk -- A National Survey," Advertising, Promotion and Consumer Use of Dairy Products: Insights from Economic Research, The Ohio State University, Columbus, Ohio, C. S. Thraen and D. E. Hahn, Editors, Chapter 7, pp. 63-69.
Smith, B. J. 1989. "What Affects Sales of Milk in Pennsylvania Schools," Farm Economics, Penn State Cooperative Extension, The Pennsylvania State University, University Park, PA, July/August 1989, 4 pp.
Smith, B. J. 1989. "Study Targets Consumer Reaction to BST Milk," Hoard's Dairyman, Volume 134, No. 15, September 10, 1989.
Smith, B. J., R. O. Herrmann, and R. H. Warland. 1990. Milk Consumption and Consumer Concerns about Fat, Cholesterol, and Calories . Department of Agricultural Economics and Rural Sociology, AE & RS 210, Marketing Research Report 7, The Pennsylvania State University, February 1990, 32 pp.
Smith, B. J. and R. D. Yonkers. 1990. The Importance of Cereal to Fluid Milk Consumption. Department of Agricultural Economics and Rural Sociology, AE & RS 211, Marketing Research Report 8, The Pennsylvania State University, February 1990, 22 pp.

23
The Pennsylvania State University, in compliance with federal and state laws, is committed to the pol icy that all persons shall have equal access to programs, admission, and employment without regard to race, religion, sex, national origin, handicap, age, or status as a disabled or Vietnam-era veteran. Direct inquiries to the Affirmative Action Officer, 201 Willard Building, University Park, PA 16802; (814) 863-0471.