determinants of multisensory integration in superior ...stein, 1986b) because these multisensory...
TRANSCRIPT

The Journal of Neuroscience, October 1987, 7(10): 3215-3229
Determinants of Multisensory Integration in Superior Colliculus Neurons. I. Temporal Factors
M. Alex Meredith,’ James W. Nemitz,* and Barry E. Stein3
‘Department of Anatomy, Virginia Commonwealth University, Richmond, Virginia 23298, *Department of Structural Biology, West Virginia School of Osteopathic Medicine, Lewisberg, West Virginia 24901, and 3Department of Physiology and Biophysics, Virginia Commonwealth University, Richmond, Virginia 23298
One of the most impressive features of the central nervous system is its ability to process information from a variety of stimuli to produce an integrated, comprehensive represen- tation of the external world. In the present study, the tem- poral disparity among combinations of different sensory stimuli was shown to be a critical factor influencing the in- tegration of multisensory stimuli by superior colliculus neu- rons. Several temporal principles that govern multisensory integration were revealed: (1) maximal levels of response enhancement were generated by overlapping the peak dis- charge periods evoked by each modality; (2) the magnitude of this enhancement decayed monotonically to zero as the peak discharge periods became progressively more tem- porally disparate; (3) with further increases in temporal dis- parity, the same stimulus combinations that previously pro- duced enhancement could often produce depression; and (4) these kinds of interactions could frequently be predicted from the discharge trains initiated by each stimulus alone. Since multisensory superior colliculus neurons project to premotor areas of the brain stem and spinal cord that control the orientation of the receptor organs (eyes, pinnae, head), they are believed to influence attentive and orientation be- haviors. Therefore, it is likely that the temporal relationships of different environmental stimuli that control the activity of these neurons are also a powerful determinant of superior colliculus-mediated attentive and orientation behaviors.
In a natural environment, there exist vast numbers of different sensory stimuli occurring at various positions in space and time. One of the problems facing an organism, then, is to determine which stimuli are related to each other and which are not. While separate sensory channels (e.g., visual and auditory) may pro- vide a means of dissociating many of these stimuli, multisensory cues are often linked together by common causality and must be integrated before the nature and significance of the external event that generates them can be defined and the appropriate response produced. The manner in which the nervous system accomplishes multisensory integration at the level of the single
Received Oct. 22, 1986; revised Feb. 27, 1987; accepted Apr. 6, 1987. This work was supported by NIH Grant NS 22543. We thank Dr. A. M. Clarke,
the Biomedical Instrumentation Facility, H. Shumaker, and N. London for their technical assistance and Dr. V. Chinchilli for his contributions to the statistical evaluation of this work.
Correspondence should be addressed to M. Alex Meredith, Ph.D., Department of Anatomy, Medical College of Virginia, Box 709 MCV Station, Richmond, VA 23298. Copyright 0 1987 Society for Neuroscience 0270-6474/87/103215-15$02.00/O
neuron has recently provoked considerable interest. There is now a growing body of literature indicating that convergence of multiple sensory modalities on the same neuron is a common phenomenon in many central nervous system structures and at many phyletic levels (see Meredith and Stein, 1986b, for a re- view).
Using multisensory neurons of the superior colliculus as a model population, we previously demonstrated that this con- vergence results in the integration of responses to simultaneous- ly occurring stimuli from different sensory modalities. This in- tegration produces either a significant increase (response enhancement) or a significant decrease (response depression) in the neuron’s activity as compared to its responses to any of the stimuli individually (Meredith and Stein, 1983, 1986b; see also Newman and Hartline, 198 1; Wiener and Hartline, 1984; King and Palmer, 1985). Multisensory interactions depend on the spatial relationships among the stimuli, the register of the dif- ferent sensory maps in the superior colliculus, and the presence of receptive fields with excitatory centers and suppressive sur- rounds (Meredith and Stein, 1986a). According to these spatial principles, if 2 spatially coincident stimuli from different mo- dalities fall within the excitatory receptive fields of a given cell, response enhancement will be produced. On the other hand, if one stimulus of a spatially disparate pair falls in a cell’s sup- pressive surround, it inhibits the cell’s responses to the other stimulus (i.e., response depression). While it is obvious that at some temporal intervals 2 stimuli from different sensory mo- dalities will be processed as discrete events, the specific interval defining the interactive period, and the manner in which inter- actions may change as this interval is approached, have not been known. The present series of experiments was initiated to explore these issues.
Once again, cells of the superior colliculus were used as a model population because of the high incidence of multisensory convergence on them (see, for review, Stein, 1984; Meredith and Stein, 1986b) and because these multisensory cells are believed to be intimately involved in specific overt behaviors (Jay and Sparks, 1984; Meredith and Stein, 1985, 1986b). The results of these experiments revealed that the temporal principles gov- erning multisensory integration are so powerful that changing the interval between the 2 different sensory stimuli affects not only the likelihood that an interaction will or will not occur, but its magnitude and sign (enhancement vs depression) as well. Therefore, seemingly minor variations in the temporal disparity between 2 stimuli are likely to have major consequences on superior colliculus-mediated behaviors and, presumably, on all behaviors dependent on the rapid integration of multiple sen-

3216 Meredith et al. * Temporal Determinants of Multisensory Integration
sory cues. Preliminary results from these experiments have been reported in abstract form (Nemitz et al., 1984).
Materials and Methods Most of the procedures used in these experiments are similar to those described in detail in a previous report (Meredith and Stein, 1986b) and are, therefore, only briefly described here.
Surgical procedures. Several days prior to recording, the animal (cat, n = 28) was deeply anesthetized with sodium pentobarbital(40 mg/kg, i.p.) and placed in a stereotaxic head holder. Using aseptic surgical techniques, a 15 mm craniotomy was made dorsal to the cortical areas overlying the superior colliculus and a specially designed recording well was stereotaxically positioned over the craniotomy and cemented into place with dental acrylic (McHaffie and Stein, 1983).
Recordingprocedures. The first experiment was conducted 5-7 d after the implantation of the recording well. Generally, animals were used in 2-3 recording sessions at approximately 1 week intervals. The animal was anesthetized with ketamine hydrochloride (30 mg/kg, i.m.) and its head was held by the mount, thereby providing support during recording without the presence of pressure points (e.g., ear bars, eye bars, etc.) or occlusion of the pinnae, eyes, or body surface.
The animal was intubated through the mouth and the saphenous vein was cannulated. Paralysis was achieved by intravenous administration of a 1: 1 mixture of gallamine triethiodeld-tubocurarine ( 10 mg’kg initial dose, followed by supplements of 0.6 mg/kg/hr, i.v.) and the animal was artifically respired with 75% nitrous oxide and 25% oxygen. Sup- plemental doses of anesthetic (10 mg/kg, i.v.) were administered every 90 min. Expiratory CO, was monitored and kept between 4.0 and 4.7%. Body temperature was monitored with a rectal thermometer and main- tained at 37-38°C with a heating pad. At the end of each recording session, the animal was allowed to recover from paralysis and, when locomotor function was regained, it was returned to its home cage. At the end of a recording series, the animal was overdosed with barbiturate anesthetic and perfused through the heart with physiological saline fol- lowed by formalin. Routine histological procedures (50 pm frozen sec- tions, cresyl violet stain) were used to locate electrolytically marked recording sites.
brator (Ling Electronics), which produced displacements (amplitude range, 0.05-5.0 mm; velocity range, 15-420 mm/set) of the skin, hairs, or vibrissae. Auditory stimuli (broadband noise burst, 200 to > 20,000 Hz, <IO dB SPL), whose intensity and duration were independently controlled, were produced by a broadband noise generator and delivered through a speaker mounted- on a movable semicircular track.
Single-modality (i.e., unimodal) tests were conducted by presenting stimuli (5-16 times) from each of the 3 modalities (e.g., visual alone, auditory alone, somatosensory alone) separately, as described above. Generally, a 1 O-20 set intertrial interval was sufficient to avoid response habituation.
The pupils were dilated with a 1% ophthalmic atropine solution and the positions of the optic discs were projected, by means of a Keeler pantascope, onto a translucent 92-cm-diameter plexiglass hemisphere 45 cm in front of the animal. Contact lenses were applied to prevent cornea1 drying and to correct for retinoscopically determined refractive errors. A Kopf calibrated X-Y slide was mounted over the implanted well to admit the recording electrode and to allow the precise positioning of each electrode penetration.
Single-unit activity was recorded extracellularly with glass-insulated tungsten electrodes whose tips were electrolytically etched to l-3 pm with 12-20 pm of the tip exposed. The electrode, guided by the Kopf X-Y slide, was lowered to the surface of the superior colliculus and then advanced in small (l-5 brn) steps with a hydraulic microdrive.
Once a cell was isolated, its receptive field(s) was (were) mapped. Visual receptive fields were mapped with a hand-held light source pro- jected directly onto the translucent plastic hemisphere. Each cell’s re- ceptive field was mapped with both moving and flashing spots or slits of light. All mapping and subsequent sensory testing were conducted with stimuli presented to the contralateral eye only. Camel’s hair brushes and calibrated von Frey hairs (10 mg to 3 gm displacement force) were used to map somatosensory receptive fields. Auditory receptive fields were mapped using broadband noise bursts delivered from a hoop- mounted speaker that could be moved to different positions of elevation and azimuth.
Quantitative testing procedures. Once the receptive field(s) had been mapped, the responses of the cell was evaluated with controlled, repro- ducible stimuli. On the basis of qualitative tests for each modality (i.e., visual, auditory, and somatosensory), an optimal stimulus was selected and presented repeatedly (5-16 times) for quantitative evaluation of its effectiveness.
Controlled, reproducible moving or stationary visual stimuli were generated by a projector (Prado) equipped with an electronic shutter and circular and rectangular diaphragms. Visual stimuli (luminance, 53 cd/m2 against a background of 2.7 cd/m>) of selected size and shape were projected through a rotating prism and reflected from a galvanom- eter-driven mirror onto the translucent hemisphere. Somatosensory stimuli were generated by an electronically controlled moving-coil vi-
Combined-modality (i.e., multimodal) tests were then conducted by repeatedly presenting (the same number of times as were the control or unimodal tests) the same stimuli used in the single-modality tests, but now in combinations (i.e., visual-auditory, visual-somatosensory, or auditory-somatosensory). Most visual and auditory stimuli were pre- sented in spatial register (at the same point in space) and within their respective receptive fields. Somatosensory stimuli were presented within the somatosensory receptive field and in general topographic register with stimuli appropriate for the other modality. When a receptive field could not be mapped for a particular modality, the stimuli for that modality were presented at a location known to be in topographic reg- ister with the other sensory receptive fields (Stein et al., 1976; Middle- brooks and Knudsen, 1985). Initially, the combined-modality tests were conducted with simultaneous onsets of both stimuli. Subsequent tests presented the stimuli progressively out of synchrony with one another. The intervals of temporal disparity between the onset of the 2 stimuli ranged from 0 to 1000 msec. Neuronal responses to each stimulus presentation (single-modality tests) were compared to the responses evoked by multisensory stimuli (combined-modality tests) at the dif- ferent interstimulus intervals. Initially, to control for shifts in baseline activity, each combined-modality test was preceded and followed by single-modality tests. Later, an interleaved data collection program was implemented, which allowed the collection of test (combined-modality) and control (single-modality) data over the same period of time. We found no significant differences among the data collected using these different methods.
Data analysis. The data (i.e., neuronal discharges) were collected, stored, and analyzed using a DEC MINC PDP 1 l/23 computer. Data were displayed in the form of dot rasters and peristimulus time histo- grams. Response latencies were calculated by determining the average time interval between the onset of a stimulus and the first impulse evoked.
A multisensory interaction in a single neuron occurs when combined- modality stimulation produces a significant (p < 0.05; 2-tailed t test) increase (“response enhancement”) or decrease (“response depression”) in activity compared to that produced by the most effective of these stimuli presented alone. This definition of interaction emphasizes the total product of these stimuli at the level of the individual neuron without arbitrary restrictions regarding the magnitude of this product. As previously discussed (Meredith and Stein, 1986b), manipulation of the physical, spatial, and temporal properties of multisensory stimuli can yield response interactions of various magnitudes along a continuum (see Results). Thus, the use of terms such as “facilitation,” “summa- tion, ” “occlusion,” and “inhibition,” which imply a static, invariant relationship of fixed value, were avoided here.
The magnitude of a response interaction was calculated by the fol- lowing formula:
[(CM - sA4m,,)Isi14m,,] x 100 = %
where CM is the mean number of impulses evoked by combined-mo- dality stimulation and SM,,, is the mean number of impulses evoked by the most effective single-modality stimulus.
For each single- and combined-modality test, the following temporal measures of response were calculated: average (LSD) response duration and average peak discharge frequency. Average peak discharge fre- quency was measured from the time bin in each peristimulus time histogram (consisting of 6-16 trials) in which the greatest number of spikes occurred, it was calculated as the average number of spikes per trial within that 10 msec time bin. Average peak discharge frequency was chosen over average discharge frequency because it is unrelated to discharge duration and is not artificially depressed when long discharge trains are evoked by temporally disparate stimuli.
Responses to combined stimuli with wide temporal disparities were analyzed somewhat differently, since separate responses to each stimulus

The Journal of Neuroscience, October 1997, 7(10) 3217
Table 1. Incidence of cells exhibiting multisensory response Table 2. Mean, SD, and range of values for response latency (to enhancement or response depression (in response to temporally onset of a stimulus), response duration, and average peak discharge coincident stimuli) are arranged according to the combination of frequency for responses to the single-modality visual, auditory, and sensory stimuli that produced the interactions somatosensory stimuli used in the present experiments
Temporally coincident stimulation
Modality Mean & SD Range
Latency (msec) Visual 82.5 ? 20.2 39-136
Auditory 19.0 * 9.0 8-44
Somatosensory 26.6 zk 8.2 16-39
Duration (msec) Visual 296 TL 190 23-140
Auditory 277 k 209 21-800
Somatosensory 190 ?z 95 35-345
Average peak frequency (Hz) Visual 155 + 156 20-15 1 Auditory 151 ? 116 33-765
Somatosensory 216 ?z 284 50-912
Modalities
Auditory-visual Somatosensory-visual Auditory-somatosensory
Total
Enhance- Depres- ment sion
56 26 15 3 9 4
80 33
Total
82 18 13
113
often resulted and were readily apparent in the discharge records. In these cases, the second, or trailing, discharge in a response complex (initiated by the second of 2 widely disparate stimuli) was compared with the discharges elicited by the second stimulus when presented alone. Results of those calculations for sequential responses were plotted in the accompanying figures as dotted rather than solid lines.
A.
A V VA VAi
F. 6001
I II II11 I I
VACipsilaterat)
Figure 1. Response features of an auditory-visual neuron to single- and combined-modality stimulation. In A, an auditory stimulus (square-wave, 100 msec duration, broadband noise burst, ~70 dB SPL) evoked a response on each of 8 presentations and these responses are represented by the dot raster and peristimulus time histogram below the stimulus truce. Each dot in the raster represents one neuronal impulse. The histogram is calibrated for 10 spikes/ 10 msec time bin and the time scale represents 100 msec. These same conventions apply to B-D and to subsequent figures. B, A visual stimulus (V) indicated by the ramp, moved across the receptive field at 135 deg/sec and evoked more discharges over a slightly longer time period and at a higher discharge frequency than did the auditory (A) stimulus. (C) When the auditory and visual stimuli were combined (VA) and presented at the same location in space (within their respective and overlapping receptive fields), the number of discharges, the duration of the discharge train, and the discharge frequency of the response were markedly increased over those evoked by either stimulus presented alone (i.e., response enhancement). D, However, when the auditory stimulus was shifted out of its receptive field and into ipsilateral auditory space (Ai), combining it with the visual stimulus now evoked fewer impulses (i.e., response depression), a shorter discharge duration, and a lower discharge frequency than did the most effective single-modality stimulus. The bar graphs at the bottom illustrate how the mean number of impulses evoked per trial (E), discharge duration Q, and average peak discharge frequency (G) varied with these different single- and combined-modality stimuli; lines through the bars reflect SEMs.

3218 Meredith et al. l Temporal Determinants of Multisensory Integration
12 0 Response enhancement
1 l-l q Response depression
% Interaction
n n i-7 l-l s do ,“‘b”“bd”“““‘.’ In’ 400
% Change2 ii Discharge Duration 500 &o
8
% Change in P Peak Frequency
Figure 2. The number of cells exhibiting changes in number of im- pulses, discharge duration, and average peak discharge frequency as a consequence of multisensory response interactions. The top graph il- lustrates the number of cells showing different levels of response en- hancement and response depression, as defined by changes in the num- ber of impulses evoked. The middle graph illustrates discharge duration, which frequently remained unchanged during interactions but could also be positive or negative regardless of the sign (enhancement or depres- sion) of the interaction. Changes in average peak frequency (bottom graph) varied more closely with the sign of an interaction than did changes in discharge duration: only 4 cells exhibiting response depres- sion showed increases in peak frequency, and these increases were com- paratively small.
Results
Neurons in the superficial laminae of the superior colliculus were excluded from study, since only cells in the deeper laminae receive convergent visual, auditory, and somatosensory inputs and exhibit multisensory interactions. Among the cells studied (n = 113), all possible bimodal convergence patterns were rep- resented, the incidence is listed in Table 1. Their response la- tencies, discharge train durations, and average peak discharge frequencies in response to the variety of stimuli are listed in Table 2. These cells were widely distributed throughout the anterior-posterior (A-P) and mediolateral (M-L) aspects of the deep laminae of the superior colliculus.
Since the primary objective of these experiments was to detail
the effects of temporal variables on multisensory interactions, manipulations of the spatial and physical parameters of mul- tisensory stimuli were minimized. In each of the 113 cells stud- ied, optimal stimuli were first presented simultaneously or with- in 50 msec of one another, and repeatedly (5-16 times) at low iterative rates (3-4/min) within the borders of their respective receptive fields. Because the receptive fields of different sensory modalities overlap one another for any given cell (Gordon, 1973; Stein et al., 1976; Middlebrooks and Knudsen, 1984), these stimulus combinations were considered to be spatially coinci- dent, or in “spatial register,” and generally (76%) evoked re- sponse enhancement when compared to responses evoked by either unimodal stimulus. In 23 cells these tests were repeated with one of the stimuli placed outside the borders of its excitato- ry receptive field (spatially disparate). This generally (65%) pro- duced response depression, although sometimes no interaction was produced (35%). The magnitude of an interaction was then calculated in terms of the number of impulses evoked (see Ma- terials and Methods) to provide a standard index of the inter- actions produced by simultaneously presented stimuli. In ad- dition, the temporal measures of response (discharge duration, average peak discharge frequency) were calculated to evaluate their relationships to the sign and magnitude of an interaction.
Once these measures were generated, the interval between the 2 stimuli was systematically varied. A total of 4 1 cells was tested in this manner. Since, at very long interstimulus intervals, 2 stimuli are processed as discrete events, it was of particular interest to determine at what temporal separations stimuli from 2 different modalities would produce interactions, and how these interactions would change as the separation between the stimuli increased or decreased.
Temporally coincident stimulation
As noted earlier, when 2 stimuli of different modalities were presented simultaneously within their respective receptive fields, reliable response enhancement usually occurred. Within the present sample, this enhancement varied in magnitude from 23 to 635% (although substantially higher levels of enhancement can be obtained, see Meredith and Stein, 1986b), and was gen- erally observed in cells that responded to either sensory modality presented alone. In other examples, the cell appeared to be unimodal, and its multisensory character was exposed only by the interaction produced by combining stimuli. Response depression varied from -23 (77% of control value) to -94% (6% of control value) and was often evoked by a seemingly ineffective stimulus presented outside the excitatory receptive field borders. However, response depression was also observed in a few instances in which both sensory stimuli were presented in spatial register within their receptive fields and each stimulus evoked an excitatory response when presented alone. In these cases, response depression appeared to be effected by a postex- citatory inhibitory period evoked by one or both stimuli.
Although the presence or absence of an interaction was de- fined by a significant (p < 0.05; 2-tailed t test) change in the number of impulses evoked by multisensory versus unimodal stimulation, changes in the temporal measures of response (dis- charge duration, average peak discharge frequency) were also noted when stimuli were combined. This is apparent in Figure 1, where the cell was activated by a visual and an auditory stimulus independently. Responses were enhanced by the com- bination of these stimuli when they were presented within their respective receptive fields, and were depressed when the audi-

The Journal of Neuroscience, October 1987, 7(10) 3219
tory stimulus was eccentric to its receptive field. The obvious companied by greater decreases in average peak discharge fre- increase in the number of impulses evoked by stimuli in spatial quency than in discharge duration, but the magnitude of the register was accompanied by an increase in the duration of the depression was only weakly reflected in concomitant decreases discharge train and in the average peak discharge frequency. in average peak discharge frequency (r = 0.34, n = 10, p > Similarly, the depression of the number of impulses evoked by 0.05). Thus, while among the population sampled no single spatially disparate stimuli was accompanied by a decrease in temporal measure of response varied immutably with the mag- the duration of the discharge train, as well as in the average nitude of an interaction, changes in the magnitude appeared to peak discharge frequency. be effected mostly via changes in discharge frequency.
Changes in the duration of the discharge train and average peak discharge frequency did not each invariably accompany significant changes in the number of impulses evoked by com- bined-modality stimuli. The likelihood of both, or either, of these response measures covarying with response enhancement or response depression is shown in Figure 2. How these temporal measures varied with response magnitude is revealed in Figure 3, where the magnitude of each interaction is plotted against the changes in response duration and in average peak discharge frequency that accompanied it. In general, response enhance- ments exhibited increases in discharge duration and average peak discharge frequency, but usually (25/43, 58%) increases of the latter were greater. The magnitude of these response en- hancements correlated best with increases in the average peak discharge frequency (r = 0.84, n = 28, p < 0.01). Similarly, most examples of response depression (10/l 6, 63%) were ac-
Temporally disparate stimulation
Although large, reliable response enhancements could be pro- duced by simultaneous multisensory stimuli, they could be sub- stantially degraded, and in some cases reversed to response depression when the interval between the stimuli was varied. Three temporal response profiles resulted from combined-mo- dality tests in which only the interval between the 2 different sensory stimuli was manipulated: (1) response enhancement only, where the magnitude of the enhancement varied monotonically along a continuum with temporal disparity; (2) a sequence of response enhancement-response depression, where both the magnitude and the sign of the effect varied along continua (en- hancement was greatest at short interstimulus intervals, but decreased in magnitude as the interval increased; at some point a reversal occurred and further increases in the interval pro-
650
600
250
200 2
E 150 3
,\” 100
50
.O
-50
-400
Figure 3. Covariance of the various temporal measures of response as a function of enhanced (E&z.) and de- pressed (Depr.) interactions. For each interaction, the magnitude of the in- teraction (vertical axis) was plotted against the percentage change in dis- charge duration (left axis) and in av- erage peak discharge frequency (right axis). Values for enhanced interac- tions rise above the horizontal plane (open symbols), while those for de- pressed interactions fall below (stip- pled symbols). Although most en- hanced interactions demonstrated proportionately greater changes in av- erage peak discharge frequency, some showed the reverse relationships. Re- sponse depressions generally showed reductions in both discharge duration and average peak discharge frequen- CY.

3220 Meredith et al. * Temporal Determinants of Multisensory Integration
A 50 V A=V
800.
V50A A200V A IOOV
‘;;; I -600 G s ?? : A
I \ $4 / - Kx
I L I 1 A2OOV 6 V2Ob
~ , e, ,“$ kl-~~~~~l,,A
A2OOV 0
Temporal Disparity (ms) A only V only
Figure 4. Decreasing the temporal disparity between 2 stimuli from different sensory modalities can dramatically increase the magnitude of response enhancement. This cell responded to a visual stimulus swept across the visual receptive field, but an auditory stimulus (broadband noise burst) failed to elicit impulses when presented alone (lower left). The rasters and histograms at the top show that when the auditory stimulus was presented 200 msec before the visual (A2OOV), it had only a modest effect on the response to the visual stimulus. However, as the stimuli were presented progressively closer in time, the magnitude of the response enhancement increased. This response enhancement decreased as the visual stimulus was presented at progressively longer intervals before the auditory stimulus (e.g., V2OOA). The influence of temporal disparity on response enhancement (i.e., number of impulses evoked) is plotted at the bottom of the figure, as are the effect of temporal disparity on the duration of the evoked discharge train and average peak discharge frequency. Note that all 3 response measures show the same pattern of changes as the stimuli approach simultaneous onset. Dashed horizontal lines represent the values elicited by the most effective single-modality stimulus (in this case, visual).
duced response depression, until the temporal limits of the in- teractive period were reached); and (3) response depression only, which varied monotonically with temporal disparity. Each of these temporal response profiles is described in detail below.
Response enhancement only. In the largest group of cells (n = 2 l/4 1,5 1% of sample), combining the 2 different sensory stimuli within their excitatory receptive fields and at short temporal disparities produced optimal levels of response enhancement. These levels of enhancement were progressively degraded at longer interstimulus intervals until the limits of the interactive period were reached. The responses of the cell illustrated in Figure 4 are representative of this group. The cell responded
reliably to a visual stimulus swept across its receptive field, but did not respond to an auditory (or somatosensory) stimulus. However, when the visual and auditory stimuli were presented simultaneously and in spatial register there was approximately a 5-fold increase in the number of impulses evoked, as well as increases in the discharge train duration and average peak dis- charge frequency. Increasing the temporal disparity between the auditory and the visual stimuli produced a progessive decrease in the magnitude of the interaction, but a significant enhance- ment was still observed when the visual stimulus preceded the auditory stimulus by 200 msec. For this cell, the changes in the number of impulses evoked by different stimulus disparities

Auditory-Visual 480
3 4201
bh III
The Journal of Neuroscience, October 1987, 7(10) 3221
Somatosensory-Visual Auditory-Somatosensory
5 160.
E . 8 120.
6 5 80. w .
o- - is . -- f$ -40. P f&80-
n
is! 54321012345 210123 4321012345’ AV VA ZW3 V”s AS SA
Temporal Disparity (IOOms) Figure 5. Multisensory interactions were often of greatest magnitude when the onsets of stimuli were temporally disparate. Examples of each of the 3 temporal response profiles observed (top: enhancement only; middle: enhancement-depression; bottom: depression only) are plotted here. Although maximal response enhancements were frequently produced when the temporal disparity of the stimuli was minimal (e.g., near simultaneity), it was not rare to find examples in which the optimal levels of response enhancement were produced when temporal disparities were 100 msec or more (top, middle). In addition, maximal levels of response depression could often be generated by stimuli as disparate as 200 msec or more (bottom). Maximal interactions depended on the overlap of the peak periods of excitation, or excitation and inhibition, in each discharge train, and the variations in these peaks determined the most effective temporal disparity for each cell (see Fig. 6 and text). In nearly all examples, there was a monotonic decay in the magnitude of the interaction as temporal disparity was changed from optimal. The different symbols distinguish among different cells plotted along the same axes. Dashed lines represent interactions in which the activity evoked by each stimulus was distinguishable as nearly separate sequential responses because the temporal limit of the interactive period was approached.

3222 Meredith et al. * Temporal peterminants of Multisensory Integration
A300V
A200S
AIOOS
A 50 S
S 17A
S 50A
S IOOA
S200A
3
Al50V
A IOOV
VA
V IOOA
V200A
I
00
Figure 6. Periods of maximal enhancement occur when peak discharge periods in the response trains evoked by the 2 stimuli overlap. In A, responses to auditory and somatosensory stimuli had comparatively short latencies and discharge durations; stimulus combinations presented at 400 200 and 100 msec intervals were processed as separate events. Shorter interstimulus intervals (ASOS, BOA), however, evoked discharge trains whose peak periods of activity (hatched areas) overlapped (cross-hatched areus) and generated significant levels of enhancement ( 167 and 13 l%, respectively). Near-simultaneous (S17A) stimulus presentation produced the maximal overlap of peak activity periods and thereby produced the

were also reflected in similar, but less dramatic changes in the discharge duration and average peak discharge frequency (Fig. 4, bottom). Yet, these response measures did not covary at all interstimulus intervals and, at many of these (e.g., AlOOV, Vl OOA, and V200A in Fig. 4) significant interactions were not accompanied by noticeable changes in the duration of the dis- charge train.
No striking differences were consistently noted in the tem- poral profiles of the “enhancement-only” interactions produced by different combinations of modalities. Thus, the temporal profiles for representative examples of auditory-visual, somato- sensory-visual, and auditory-somatosensory interactions plot- ted in Figure 5 (top row) look quite similar. Regardless of the specific stimulus combinations that produced an interaction, the magnitude of the response enhancement appeared to vary inversely with the temporal disparity of the 2 stimuli, and to be greatest when the stimuli were presented almost simulta- neously. This was surprising. Since the response latencies of the same cell to different stimulus modalities are rarely the same (see Table 2), simultaneous stimulus presentation would not be expected to produce coincident arrival of the different afferent inputs. Yet the maximum interactions were often produced when stimuli were presented simultaneously rather than when their latency disparities were minimized, as in the cell illustrated in Figure 4. This cell had a vigorous response to a visual stimulus that began 104 msec after stimulus onset. Although no responses were evoked by a unimodal auditory stimulus, the latency range for all auditory superior colliculus cells studied was 8-44 msec. Therefore, the input (albeit subthreshold) from a simultaneously presented auditory stimulus would be expected to arrive ap- proximately 96 msec (and no less than 60 msec) before the response to the visual stimulus began. Yet maximal enhance- ment was produced in this cell when the stimuli were presented simultaneously, and nearly the same enhancement level was evoked even when the auditory stimulus was presented 50 msec before the visual stimulus, when the arrival of the afferent inputs was separated by 1 lo- 146 msec. It seems most likely, then, that these maximal levels of enhancement are attributable to the long duration of the auditory influence on the cell, as suggested by the long discharge train durations (see Table 2) seen in other cells responsive to auditory stimuli. The comparatively long period in which a given stimulus can influence a cell is evident in the long discharge train durations evoked by each stimulus modality and allows a period of several hundred milliseconds in which interactions among different sensory inputs are pos- sible.
By progressively increasing and decreasing the intervals be- tween 2 stimuli, it soon became evident that, in many cells, maximal enhancement depended most on overlapping the pe- riods of peak activity evoked by unimodal stimuli, rather than on matching either the stimulus onset (i.e., simultaneously pre- sented stimuli) or response latencies. Since many cells had peak discharge periods that occupied a substantial portion of their
t
The Journal of Neuroscience, October 1997, 7(10) 3223
discharge trains, some overlap of peak discharge periods was produced both by simultaneously presented stimuli and by in- terstimulus intervals that offset differences in latency to the 2 stimuli. But in other examples, the beginning of the period of peak discharge initiated by each stimulus independently could be separated by 100 msec or more. In these cases, neither si- multaneously presented stimuli nor intervals that minimized latency differences produced enhancements as great as those produced when the peak discharge periods overlapped. Exam- ples of these observations are provided in Figure 6. The cell in Figure 6A had similar short latencies and brief peak discharge periods to a somatosensory (latency = 23 msec, peak discharge period = 28-5 1 msec) and to an auditory (latency = 20 msec, peak discharge period = 20-44 msec) stimulus. At intervals of 400, 200, and 100 msec, the stimuli were processed as separate events. At a 50 msec interval, an interaction was noted, and it became maximal at near-simultaneity when significant portions of the 2 peak discharge periods overlapped. In this, as in most other cells, it was difficult to determine whether the simultaneity of the stimulus onset, the minimizing of latency differences, or the overlapping of peak discharge periods accounted for optimal enhancement. In the cell described in Figure 6B, however, the peak discharge periods were more discrepant and longer. Here, the maximal interaction was produced neither when the stimuli were simultaneous nor when latency differences were mini- mized; rather, the greatest enhancement occurred when the vi- sual stimulus preceded the auditory stimulus by 300 msec, there- by overlapping their peak discharge periods. Although not common, it was not rare to find cells in which the greatest enhancements were produced at temporal disparities in excess of 250 msec, and in one case a 900 msec disparity was required. Once the “optimal” temporal combination was determined, these peak levels of enhancement could be degraded by progressively separating the 2 evoked discharge trains. For the group of visual- auditory cells depicted in Figure 7 (top), interactions were de- graded to 75% of maximum when the discharge trains were separated by a mean of 115 msec (range = 60-220 msec) and to 50% when separated by a mean of 215 msec (range = 140- 266 msec), regardless of the sequence in which the 2 stimuli were presented.
These observations indicate that the pattern of discharges evoked by the stimuli influences the interactions produced by their combination. Since discharge patterns (e.g., duration of the discharge train, location, and duration of the peak period of activity, etc.) often depended on the physical parameters of the stimulus, changing stimulus parameters changed the resul- tant interaction. Although stimulus parameters were usually held constant in order to avoid confounding observations regarding temporal variables, an example of how the physical parameters of the stimuli can alter an interaction is provided in Figure 8. Here, an auditory stimulus and a rapidly moving visual stimulus were combined at various temporal disparities. Both unimodal stimuli evoked comparatively short discharge trains; thus, the
maximal levels of enhancement (18 1%). However, as shown by the responses illustrated in B, maximal levels of enhancement were not necessarily evoked by simultaneous stimulus combinations or by minimizing the latency differences among modalities. In this cell, the period of optimal discharge activity evoked by a visual stimulus occurred at a substantially longer latency and duration than that elicited by an auditory stimulus. Stimulus combinations with temporal disparities of A3OOv, A150P’, A100v, and even with simultaneity were processed largely as independent events. Only when the periods of peak activity of each discharge train overlapped (initiated by WOOA, V200~, and v3OOA intervals) were maximal levels of enhancement generated (33, 110, and 178%, respectively). However, further temporal separation of the visual and auditory stimuli (v4OOA) separated the periods of peak discharge activity they evoked, and lower levels of enhancement were then obtained (76%).

3224 Meredith et al. - Temporal Determinants of Multisensory Integration
80
E 60
g 40
s 5 20 w
‘T5 0 E ‘Z 0 Is
-20
3 -40 8
-60
-80
VA Disparity (IOOms) from Optimal A”
Figure 7. The normalized temporal response profiles of visual-audi- tory cells exhibiting enhancement only (top), enhancement-depression (middle), and depression only (bottom). Interactions at each temporal disparity were plotted as a percentage of the maximal level of interaction that could be evoked in that cell by that combination of stimuli. Symbols connected by solid lines represent individual cells, while the heavy dashed line represents the averaged response profile for the sample. A best-fit curve that closely represented the data for each category was calculated
-501 . , , , , I 600 400 200 0 200 400 600
A” Temporal Disparity (ms) VA
Figure 8. The temporal determinants of multisensory integration are influenced by the physical parameters of the stimuli. The responses of a given cell were evaluated when the same auditory stimulus was paired with a rapidly (550 deg/sec; closed circles) or more slowly (100 deg/sec; closed triangles) moving visual stimulus. The rapidly moving stimulus evoked a relatively short discharge train (approximately 300 msec du- ration), while the more slowly moving stimulus elicited a longer dis- charge train (>700 msec). Since response enhancement is limited by the overlap of periods of excitation, the rapidly moving stimulus limited the interactive period more than the slower-moving visual stimulus did.
interactive period in which enhancement was exhibited was only 300 msec, with the interval of 150 msec producing optimal enhancement. A slowly moving visual stimulus elicited a much longer discharge train than did the rapidly moving visual stim- ulus, and its combination with the auditory stimulus lengthened the period in which enhancement occurred. The interstimulus interval required to produce optimal enhancement was not reached even at 500 msec. Changes similar to these were noted for combinations of all the sensory modalities tested.
Responseenhancement-depression. In testing for the influence of temporal disparity on cells that demonstrated response en- hancement when the combined-modality stimuli were presented simultaneously, we discovered that some ( 11/4 1; 27%) cells could respond with both response enhancement and response depres- sion to spatially coincident stimuli. Thus, both response en- hancement and response depression could be evoked in the same cell solely by manipulating the temporal disparity between stim- uli. The responses of the cell depicted in Figure 9 (responses of the same neuron are also shown in Fig. 8) are typical of this group. This particular cell responded to unimodal visual or auditory stimuli with a long discharge train, and exhibited the characteristic response enhancement described earlier when the 2 stimuli were within their respective receptive fields. The mag- nitude of the enhancement was greatest when the visual stimulus preceded the auditory stimulus by 150 msec (when the maximal
t
(enhancement only, rz = 0.63; enhancement-depression, rz = 0.74; depression only, r2 = 0.25). By ignoring the sign (enhancement or depres- sion) of an interaction and comparing (using analysis of covariance) only the time course with. which they decayed, it became apparent that there were no significant differences among the time courses of en- hancement-only and depression-only profiles (p > 0.5). However, the time course of enhancement-only profiles differed significantly from that for enhancement-only interactions (p < 0.05), and this distinction was underscored further by the significant difference between the enhance- ment (positive) phases of these response profiles (p < 0.01).
The Journal of Neuroscience, October 1987, 7(10) 3225
A200V AIOOV A=V V50A V150A V 300A
A only v only
I h
tb IX O Temporal Disparity (ms)
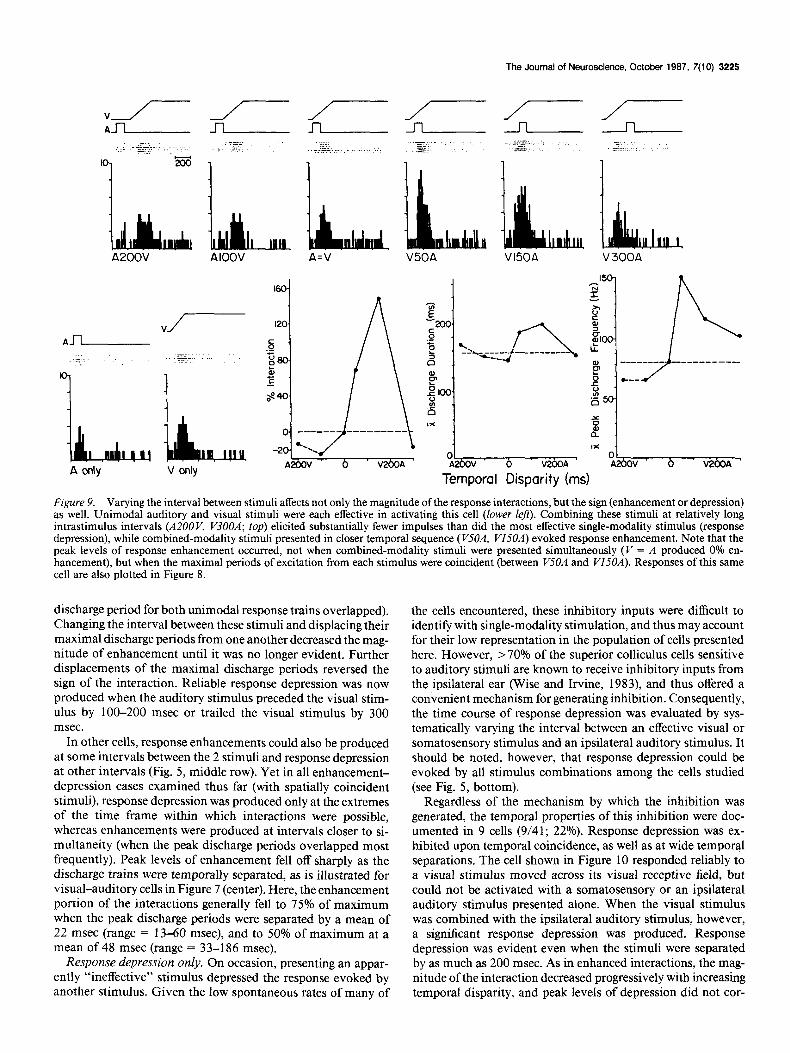
Figure 9. Varying the interval between stimuli affects not only the magnitude of the response interactions, but the sign (enhancement or depression) as well. Unimodal auditory and visual stimuli were each effective in activating this cell (lower left). Combining these stimuli at relatively long intrastimulus intervals (A200 V, V3OOA; top) elicited substantially fewer impulses than did the most effective single-modality stimulus (response depression), while combined-modality stimuli presented in closer temporal sequence (VJOA, VISOR) evoked response enhancement. Note that the peak levels of response enhancement occurred, not when combined-modality stimuli were presented simultaneously (V = A produced 0% en- hancement). but when the maximal neriods of excitation from each stimulus were coincident (between WOA and W5OA). Responses of this same cell are also plotted in Figure 8.
discharge period for both unimodal response trains overlapped). Changing the interval between these stimuli and displacing their maximal discharge periods from one another decreased the mag- nitude of enhancement until it was no longer evident. Further displacements of the maximal discharge periods reversed the sign of the interaction. Reliable response depression was now produced when the auditory stimulus preceded the visual stim- ulus by 100-200 msec or trailed the visual stimulus by 300 msec.
In other cells, response enhancements could also be produced at some intervals between the 2 stimuli and response depression at other intervals (Fig. 5, middle row). Yet in all enhancement- depression cases examined thus far (with spatially coincident stimuli), response depression was produced only at the extremes of the time frame within which interactions were possible, whereas enhancements were produced at intervals closer to si- multaneity (when the peak discharge periods overlapped most frequently). Peak levels of enhancement fell off sharply as the discharge trains were temporally separated, as is illustrated for visual-auditory cells in Figure 7 (center). Here, the enhancement portion of the interactions generally fell to 75% of maximum when the peak discharge periods were separated by a mean of 22 msec (range = 13-60 msec), and to 50% of maximum at a mean of 48 msec (range = 33-186 msec).
Response depression only. On occasion, presenting an appar- ently “ineffective” stimulus depressed the response evoked by another stimulus. Given the low spontaneous rates of many of
the cells encountered, these inhibitory inputs were difficult to identify with single-modality stimulation, and thus may account for their low representation in the population of cells presented here. However, >70% of the superior colliculus cells sensitive to auditory stimuli are known to receive inhibitory inputs from the ipsilateral ear (Wise and Irvine, 1983), and thus offered a convenient mechanism for generating inhibition. Consequently, the time course of response depression was evaluated by sys- tematically varying the interval between an effective visual or somatosensory stimulus and an ipsilateral auditory stimulus. It should be noted, however, that response depression could be evoked by all stimulus combinations among the cells studied (see Fig. 5, bottom).
Regardless of the mechanism by which the inhibition was generated, the temporal properties of this inhibition were doc- umented in 9 cells (9/41; 22%). Response depression was ex- hibited upon temporal coincidence, as well as at wide temporal separations. The cell shown in Figure 10 responded reliably to a visual stimulus moved across its visual receptive field, but could not be activated with a somatosensory or an ipsilateral auditory stimulus presented alone. When the visual stimulus was combined with the ipsilateral auditory stimulus, however, a significant response depression was produced. Response depression was evident even when the stimuli were separated by as much as 200 msec. As in enhanced interactions, the mag- nitude of the interaction decreased progressively with increasing temporal disparity, and peak levels of depression did not cor-

3226 Meredith et al. * Temporal Determinants of Multisensory Integration
AZOOV AIOOV
; _ ‘~~:. ::. :i:. .,:: :;,.~,. ,, ,” : -
8
ldllii&L V only A only
V IOOA V200A V 300 A V400A V 500 A
1 ; 20
----------------- v A2+ Ix A!ii
Temporal Disparity (ms) Figure 10. Response depression varies monotonically with temporal disparities between stimuli. While a visual stimulus evoked a vigorous response from this cell on each of 5 stimulus presentations, an ipsilateral auditory stimulus failed to excite it (lower left). When the visual stimulus was initiated 100 msec before the auditory stimulus, its excitatory input was maximally depressed. The ability of the auditory stimulus to depress the effect of the visual stimulus decayed as the temporal disparity was increased or decreased from this optimum. The interaction depended on the overlap of the maximal excitatory (visual) and inhibitory (auditory) influences of these stimuli. The graphs at the bottom illustrate that although number of impulses, discharge duration, and average peak frequency all had similar trends, the magnitude of their changes was differently dependent 6n temporal disparity.
respond to simultaneous stimulus onset. Presumably, peak depression was produced by matching the excitatory period ini- tiated by one stimulus with the maximal inhibitory period ini- tiated by the other. For visual-auditory cells, the maximal level of response depression (i.e., - 100%) could be substantially de- graded (to -75%) when the temporal disparity changed by as little as 94 msec (range = 23-166 msec) (see Fig. 7, bottom, for a more complete depiction). As with response enhancement, the different response measures (number, discharge duration, av- erage peak frequency) observed during response depression did not necessarily covary. Thus, the stimulus combination that evoked peak levels of depression in Figure 10 also elicited the lowest average peak discharge frequency, but did not induce the maximal shortening of the discharge train. Apparently, the strongest depressive effects on discharge frequency occurred when the inhibitory inputs of one modality immediately preceded and overlapped the peak excitatory activity of the other; the strong- est depressive effects that affected duration of the discharge train occurred when the inhibition from one input came during or immediately after the peak excitation evoked by the other. These results did not appear to depend on the specific combination of modalities, and similar temporal response profiles for response depression were obtained with the different combinations of sensory stimuli, as illustrated in Figure 5 (bottom row).
Discussion Interactive period The present experiments demonstrate that multisensory inter- actions can take place over surprisingly long periods of time. A specific interactive period depends on the duration of the ex- citatory and inhibitory influences of the relevant stimuli on the cell, and these influences depend, in turn, on the physical prop- erties of the stimuli themselves. With the stimulus parameters and anesthetic conditions employed here, cells generating re- sponse enhancement typically exhibited interactive periods of 400 msec or less when the stimuli were presented simultaneous- ly, but these could extend up to 1500 msec with temporally disparate stimuli. Since a given stimulus might have both ex- citatory and inhibitory influences on a cell, combinations of stimuli could produce a rich variety of interactive magnitudes and sign reversals, depending on their temporal relationships to one another.
Since the spontaneous rates of most superior colliculus cells were low, the duration of an inhibitory influence of a stimulus was much more difficult to determine. It became apparent only when it depressed the excitatory influence of another stimulus on that cell. With the stimuli used here, the time course for these depressed-only interactions (mean = 240 msec) generally

The Journal of Neuroscience, October 1987, 7(10) 3227
30 A+
I vA+t----
-6m
-6Om
Discharge Train “A; Overlap
6 A+ I
v-HtHt
vA-iliMt-
I
viHttt- 30 A+
vA+
Figure I I. Two models of orientation based on integrating simultaneous visual and auditory stimuli. The models are based on the need for multisensory integration (e.g., the visual appearance and the noise made by the rat) to enhance neural activity above a theoretical threshold that neither stimulus alone (e.g., visual appearance or noise) would achieve. In the first model (left), the principal integrative feature leading to an orientation response is the overlap of the onset of discharges that would be initiated by the visual and the auditory stimuli. Sound travels at 340 m/set (the speed of light is taken as instantaneous) and there are substantial latency differences for responses to visual and auditory stimuli (90% range for superior colliculus visual latency, 55-125 msec; for auditory latency, 10-30 msec) even in the same cell. Because of these factors, only when the rat is within a narrow strip 7-39 m away from the cat will the visual and auditory inputs coincide (shown diagrammatically as oscillogrums above the cat’s head). Note that when the rat is 30 m from the cat, the impulses initiated by its appearance and sound coincide. However, at greater (60 m) and lesser (6 m) distances, the onsets of the evoked impulses do not overlap and no interaction is produced. In the second model (right), the most important factor is that some portion of the discharge trains that would be initiated by the visual and auditory stimuli overlap (90% range for discharge duration; visual, 39-690 msec; auditory, 28-500 msec). The data generated in the present study indicate that interactions occur as long as any portion of the discharge trains overlap, and that they are most significant when the peak discharge periods overlap. This is illustrated by the schematized oscillogrums above the cat’s head, in which auditory stimuli located at varying distances from the cat (6, 30, 60 m) evoke discharge trains that overlap and interact with discharge trains elicited by the visual appearance of the rat. Because of these factors, the biological limits within which the effects of sensory stimuli can overlap to produce orientation behaviors in the second model are extremely broad and are not restricted to that area of space in which latencies to simultaneous stimuli can match.
resembled that for enhanced interactions, and, with some stim- uli, could last longer than 840 msec.
It seems unlikely that the excitatory or inhibitory interactive period is fixed for any given multisensory cell. While the re- sponse properties of a given cell no doubt limit the duration of its responses to stimuli from each modality, the physical pa- rameters of the stimuli can influence the magnitude and duration of the discharge trains within rather broad limits, leading to a wide interactive range.
Given that most natural multisensory stimuli derived from the same event are closely linked in time, and that there are significant differences among the latencies of the modalities in- fluencing a given cell, there appears to be an integrative paradox. Since visual and somatosensory latencies are so different (min- imum and maximum differences in the range of latencies for 90% of population is from 13 to 108 msec, respectively), their response onsets may never coincide (if simultaneously pre- sented) and might be expected never to produce significant in-

3228 Meredith et al. ‘Temporal Determinants of Multisensory Integration
teractions. Latencies for visual and auditory inputs are even more discrepant (minimum and maximum differences in the range of latencies for 90% of population is from 20 to 115 msec, respectively), and the inputs initiated by simultaneous visual- auditory stimulus pairs would arrive at a cell simultaneously only when these stimuli existed in an extremely circumscribed spatial area (see Fig. 1 l), thereby severely limiting the range and usefulness of this integration. But these stimulus combinations did produce multisensory interactions, even when they were presented simultaneously. It is because these stimuli evoked discharge trains whose durations exceeded their individual la- tency differences that these interactions were possible, and the duration of the unimodal discharge trains provided a good pre- dictive index ofthe interactive periods of excitatory interactions. Individual stimuli evoked discharge trains that could be very short (e.g., 1 msec) or quite long (>800 msec), and the inter- active period was dependent on how much of their discharge trains overlapped: the longer the unimodal discharge trains, the longer the possible interactive period. If one stimulus (e.g., vi- sual) evoked a long discharge train-for example, 500 msec- another stimulus (e.g., auditory) eliciting a short-duration dis- charge (e.g., 10 msec) could interact with it anywhere within that 500 msec window. These factors allow significant inter- actions to take place even when the temporal disparity of the stimuli is quite great. Thus, interactions can be produced by simultaneous visual and auditory stimuli located at any point within a very wide spatial domain (see Fig. 11).
Neither temporal measure of response (discharge duration, average peak discharge frequency) varied exclusively with the sign of an interaction, or covaried with its magnitude. However, the vast majority of interactions showed relatively greater changes in the average peak discharge frequency than in discharge du- ration. In the absence of more detailed information regarding the synaptology and membrane properties of multisensory su- perior colliculus neurons, it is difficult to speculate about the specific biophysical mechanisms that account for the temporal properties peculiar to these interactions.
Sensitivity to temporal disparity Deep laminae superior colliculus cells integrated responses to simultaneous combinations of visual, auditory, and somatosen- sory stimuli in the form of response enhancement or response depression. However, when the temporal interval between the stimuli was progressively increased, 3 temporal response profiles could be distinguished: response enhancement only, response enhancement-depression, and response depression only. Re- gardless of the interactive type, all multisensory interactions exhibited a monotonic decay in the magnitude of the interaction as the stimuli were separated from their optimal temporal re- lation (the point at which the interaction of the greatest mag- nitude occurred). At some point, the decay reached zero (no interaction) and, for cells exhibiting enhancement only or depression only, that point marked the temporal limit, or bor- der, of the interactive period. In contrast to these response pro- files, cells categorized as enhancement-depression exhibited a sign reversal if the temporal disparity extended beyond this zero point, so that enhancement was eliminated and depression was produced.
Each cell examined in these experiments fell into only one of these 3 categories. Nevertheless, it is possible that the categories are artificially restrictive and that the same cell might exhibit more than one type of response profile if sequences of quali-
tatively different stimuli were presented. Despite the fact that we have, at present, no empirical data to support this speculation (when spatial factors are held constant), these categories must be viewed as a descriptive convenience and not necessarily as defining the absolute capabilities of subpopulations of superior colliculus cells.
Visual-auditory cells demonstrating enhancement-only pro- files displayed the longest interactive periods and generally evoked > 50% of maximal enhancement when stimuli were pre- sented up to 2 15 msec out of the optimal temporal register. Cells showing depression only generally exhibited >50% of maxi- mum depression when stimuli were presented up to 166 msec out of their optimal temporal register. Yet despite the differences in their sign (enhancement or depression), the fitted curves of the functions describing these temporal profiles were not sig- nificantly different 0, > 0.05; analysis of covariance). In con- trast, cells exhibiting enhancement-depression profiles revealed an extremely brief temporal window in which enhancement could be evoked; in these cases > 50% of maximal enhancement could be elicited only when the stimuli were presented within 22 msec of the optimal temporal register. This brief window of enhancement was flanked by periods in which profound levels of depression were evoked, and extended until the temporal limits of the interactive period were reached. Furthermore, these distinctions were statistically significant whether the entire func- tion (i.e., including positive and negative values) of enhance- ment-depression and enhancement-only profiles were com- pared (p < 0.05; analysis ofcovariance) or only the enhancement portions of those same functions (i.e., positive values only (p < 0.01; analysis of covariance) were evaluted.
Maximizing enhancement and/or depression Although interactions were produced for as long as any portion of the discharge trains evoked by stimuli from each modality overlapped, the positions of overlap were critical because of variations in the discharge patterns. Some unimodal discharge trains had high-frequency discharges at the onset, followed by an exponential decay in activity; others showed a gradual rise and fall in discharge frequency; and still others showed postex- citatory depression. Consequently, varying the overlap of the discharge trains evoked by pairs of stimuli produced a wide variety of interactive magnitudes. Yet regardless of the specific stimulus combinations presented, one consistent feature of the resultant interactions emerged: maximum excitatory interac- tions occurred when the periods of highest discharge activity overlapped.
Behavioral implications Although a high incidence and dynamic response range of mul- tisensory cells were demonstrated in this study, the data may reflect only a portion of the activity present in alert animals. Barbiturates are generally known to depress neuronal activity (McIlwain, 1964; McKenna et al., 1982) and in the superior colliculus they not only depress visual activity (Stein and Arigbede, 1972) but also appear to limit auditory responses to l-4 impulses over a duration of 10 msec or less (Wise and Irvine, 1983; Hirsch et al., 1985). Even in the present ketamine-nitrous oxide preparations, neither the responses of auditory or visual cells reached the high levels reported for superior colliculus neurons in behaving cats (Grantyn and Berthoz, 1985). Thus, it is likely that interactions would produce higher discharge
The Journal of Neuroscience, October 1987, 7(10) 3229
frequencies and longer discharge durations (with even weaker stimuli) in more natural circumstances, and would be exhibited in even greater proportions of superior colliculus cells than could be demonstrated here or previously (Meredith and Stein, 1986b).
It has been hypothesized that the response enhancement pro- duced by multisensory interactions can facilitate the detection of combinations of individually weak or ineffective stimuli (Meredith and Stein, 1983). The present experiments indicate that there are restricted temporal domains within which this effect could take place. This seems intuitively reasonable, since stimuli having a common causality will most likely be tempo- rally linked. Such a temporal constraint, coupled with the pre- viously demonstrated spatial constraint (Meredith and Stein, 1986a) on response enhancements, limits the likelihood that unrelated stimuli could confound these interactions and thereby lead to inappropriate responses.
Two populations of cells appear to define the temporal limits ofresponse enhancement and, presumably, of the behaviors they facilitate: enhancement-only cells and enhancement-depression cells. The former and more frequently encountered cells (with the stimuli employed in this study) pool inputs over a rather broad (up to 600 msec; see Fig. 7) temporal domain. The latter, however, have much sharper peaks of activity and maximize enhancement over a narrow temporal period (up to 200 msec; see Fig. 7) while responses to more temporally disparate stimuli are rendered particularly weak. Although it is not immediately obvious why such cell types would be advantageous, as func- tional complements they could produce a well-defined temporal focus of activity (within a population of superior colliculus cells) to near-simultaneously occurring stimuli without precluding en- hancement (albeit less dramatic enhancements) at slightly longer intervals.
Multisensory cells of the superior colliculus are known to have descending efferent projections (Meredith and Stein, 1986b) in pathways controlling the orientation of the eyes, pinnae, and ‘head (Huerta and Harting, 1984). Among the best studied “ef- fector” cells of the superior colliculus are the tectobulbospinal cells, which are activated by multisensory stimuli (Munoz and Guitton, 1986) and demonstrate a premotor burst before an eye movement (Grantyn and Berthoz, 1985; Munoz and Guitton, 1985, 1986). These sensory and premotor involvements can be temporally dissociated: the latency of a sensory response is time- locked to the onset ofa stimulus, while the initiation of premotor burst activity is time-locked to the onset of a saccade (Mohler and Wurtz, 1976). Given that deep layer neurons burst before eye movements to visual as well as to auditory targets (Jay and Sparks, 1984), it is likely that their premotor activity and effect would be enhanced by closely related multisensory stimuli (e.g., a visual-auditory target) and depressed by those exceeding spa- tial and temporal interactive limits. Whether enhancement (or depression) of behavior would occur as a direct result of mul- tisensory integration within the premotor neuron itself, or would result from further processing at other loci remains to be de- termined. Nevertheless, it seems likely that the mechanisms shown to govern multisensory integration would exert a pow- erful influence on the production of an eye movement or other overt behavior, with which these deep laminae superior collicu- lus neurons are involved.
References
Gordon, B. G. (1973) Receptive fields in the deep layers of the cat superior colliculus. J. Neurophysiol. 36: 157-l 78.
Grantyn, A., and A. Berthoz (1985) Burst activity of identified tecto- reticulospinal neurons in the alert cat. Exp. Brain Res. 57: 4 17-42 1.
Hirsch, J. A., C. K. Chan, and T. C. Yin (1985) Responses of neurons in the cat’s superior colliculus to acoustic stimuli. I. Monaural and binaural response properties. J. Neurophysiol. 53: 726-745.
Huerta, M.F. and J.K. Harting (1984) The mammalian superior col- liculus: Studies of its morphology and connections. In Comparative Neurology ofthe Optic Tectum, H. Vanegas, ed., pp. 687-773, Plenum, New York.
Jay, M. F., and D. L. Sparks (1984) Auditory receptive fields in primate superior colliculus shift with changes in eye position. Nature 309: 345-347.
King, A. J., and A. R. Palmer (1985) Integration of visual and auditory information in bimodal neurones in the guinea-pig superior colliculus. Exp. Brain Res. 60: 492-500.
McHaffie, J. G., and B. E. Stein (1983) A chronic headholder mini- mizing facial obstructions. Brain Res. Bull. 10: 859-860.
McIlwain, J. T. (1964) Receptive fields of optic tract axons and lateral geniculate cells: Peripheral extent and barbiturate sensitivity. J. Neu- rophysiol. 27: 1154-I 173.
McKenna, T. M., B. L. Whitsel, and D. A. Dreyer (1982) Anterior parietal cortical topographic organization in macaque monkey: A reevaluation. J. Neurophysiol. 48: 289-3 17.
Meredith, M. A., and B. E. Stein (1983) Interactions among converging sensory inputs in the superior colliculus. Science 221: 389-39 1.
Meredith, M. A., and B. E. Stein (1985) Descending efferents from the superior colliculus relay integrated multisensory information. Sci- ence 227: 657-659.
Meredith, M. A., and B. E. Stein (1986a) Spatial factors determine the activity of multisensory neurons in cat superior colliculus. Brain Res. 365: 350-354.
Meredith, M. A., and B. E. Stein (1986b) Visual, auditory and so- matosensory convergence on cells in superior colliculus results in multisensory integration. J. Neurophysiol. 56: 640-662.
Middlebrooks, J. C., and E. I. Knudsen (1984) A neural code for auditory space in the cat’s superior colliculus. J. Neurosci. 4: 2621- 2634.
Mohler, C. W., and R. H. Wurtz (1976) Organization of monkey superior colliculus: Intermediate layer cells discharging before eye movements. J. Neurophysiol. 39: 722-744.
Munoz, D. P., and D. Guitton (1985) Tectospinal neurons in the cat have discharges coding gaze position error. Brain Res. 341: 184-188.
Munoz, D. P., and D. Guitton (1986) Effect of attention on tecto- reticula-spinal neuron sensory and motor discharges in the alert head- free cat. Sot. Neurosci. Abstr. 12: 458.
Nemitz, J. W., M. A. Meredith, and B. E. Stein (1984) Temporal determinants of multimodal interactions in superior colliculus cells. Sot. Neurosci. Abstr. 10: 298.
Newman, E. A., and P. H. Hartline (1981) Integration of visual and infrared information in bimodal neurons of the rattlesnake optic tec- turn. Science 213: 789-791.
Stein, B. E. ( 1984) Multimodal representation in the superior colliculus and optic tectum. In Comparative Neurolofl of the Optic Tectum, H. Vanegas, ed., pp. 8 19-84 1, Plenum, New York.
Stein. B. E.. and M. 0. Ariabede (1972) Unimodal and multimodal response properties of neirons in the cat’s superior colliculus. Exp. Neurol. 36: 179-l 96.
Stein, B. E., B. Magalhaes-Castro, and L. Kruger (1976) Relationship between visual and tactile representations in cat superior colliculus. J. Neurophysiol. 39: 40 l-4 19.
Wiener. S. I.. and P. H. Hartline (1984) Multimodal neurons of mouse superior cblliculus: Magnitude and sign of interaction depend on in- termodality delay. Sot. Neurosci. Abstr. 10: 736.
Wise, L. Z., and D. R. F. Irvine (1983) Auditory response properties of neurons in deep layers of cat superior colliculus. J. Neurophysiol. 49: 674-685.