determinants of scientific productivity in firms
TRANSCRIPT
7/27/2019 Determinants of scientific productivity in firms
http://slidepdf.com/reader/full/determinants-of-scientific-productivity-in-firms 1/8
e c h c a l Performance and F irm Size:
of Patents a nd Publications
f US. FirmsAlo k K . C‘hcikruharti
iLlic*huelR. Halperin
of different sizes in different industries in the U.S. Both
s, and papers an d publications ar e used as measures of
of f irms, one
of 225 large firms (annual sales at least $250
of S 1 million) and
of 248 small and medium sized firms
10 to $200 million and annual R&D
10 thousand) have been presented here . Th e
of R&D expendi ture a re
of different sizes. For the large firms, R& Das well as its size,
of annu al sales. For small size firms, R&D
is related to both
two output measures, patents and papers are
a very strong one for
both R& D expenditure as well as annu al sales. Th e firm’s
a
of small firms. Papers
in innovation than the large firms. Small firms are
apers per million dollars of R& D expenditure.
l version accepted on Decem ber 14, 1989
K. Chakrabarti
of Industrial M anagement
of Technology
71 2
R. Halperin
of Pennsylvania
This study focuses on the scientific outp ut of firms
of different sizes in different industries in the U.S.Firm size has been of particular interest here as we
have witnessed some recent major mergeractivities giving rise to consolidation and restruc-
turing in many industries. According to Kamienand Schwartz 1 975), beyond some magnitude,size does n ot appear especially conducive to eitherinnovational effort or output. The Bolton Com-mittee concluded that small firms contributed10 of all indu strial innovations in the U.K. whileaccounting for only 5 of R&D expenditure(Freeman, 1971). Very large firms on the otherhand, accounted for 54”/0 of R&D expenditureand accounted for 20 of all innovations. Pavitt,Robson, and Townsend (1 987 ) have concludedthat “companies with less than 1,000 employeescommercialized a much greater share than isindicated by their share of R&D expenditure”.
Edwards and Gordon (1984) found that smallfirms produced 745 innovations per millionemployees while large firms generated only 3 13
innovations per million employees.Although Edwards and Gordon (1984) .found
small firms to be more productive p er em ployee ininnovation, larger firms were more innovative inindustries where 4-firm concentration was 21 to
40 . Small firms were four times as innovative peremployee as large firms in industries with con-centration ratios of 4 1 to 60%. Acs and A udretsch
(1 987 ) have suppo rted the mo dified Schum peteri-an hypothesis about imperfect market structureand benefits from innovation. Large firms seem tohave an innovative advantage in industries withhigh levels of concentration as well as capital andadvertising intensity. Small firms derive innova tive
advantages in the early stages of life cycle in an
Econ omics 2 : 183-1 90, 1990.
1990 Kluw er Acad em ic Publishers. Printed in the N etherlands.
7/27/2019 Determinants of scientific productivity in firms
http://slidepdf.com/reader/full/determinants-of-scientific-productivity-in-firms 2/8
lok K . Chakrabarti and Michael R. Halperirz
also found
with con-
A study of 130 largest U.S. firms by Soete
with increases in firm
supports an earlier conclusion by Scherer
We have focused on technical performance of
U.S. (President’s Commis-
Several studies have pointed out that the
U.S. has slowed down
aily and Chakrabarti, 1988; Chakrabarti, 1988;
1982; Glisman
firms in
es of performance at a macro level. We
f technical output.
samples
edium size firms sample. Our sample
in the COM-
ales in 1986 must be between 10 to 200
(b) annual R&D expenditure during the
10
(c) annual R & D expenses showed a
10% during this time period. These
c range of size and were
in R&D in some serious and systematic
ge firm s sam ple. The sample of large firms was
ed from the list of public companies in the
of 250 million (b) an annual R&D budget of
1 million (c) annual R&D budget at least 1%of
sales. 225 companies were selected by this criteria.
We obtained data for these companies for the
period 1975-1 983 (Halperin and Chakrabarti,
1987).
It may be mentioned that the studies reportedby Soete (1979b) and Griliches (1984) used
similar source of data, i.e. R&D surveys by
Business Week. We have stratified the sample by
imposing the additional conditions as explained
above.
Variables and sources of data
From COMPUSTAT we obtained the data on the
following variables: Sales, RGrD expenditure,
Average Sales during 1977- 1986, Net Incomeand the main SIC number for the company.
The growth rates for sales, R&D and income
are computed as the regression coefficient of the
trend of the respective variables during the time
period. The growth rate for income was not
calculated for the companies which did not have
consistent positive earning.
R&D expenditure data were obtained from
Business Week for the group of companies in our
large firm sample as that was the best source
available at the time when we conducted the studyin 1985-86.
Patent information. We used BRS/PATSEARCH,
an online database to search for the patents issues
to these firms during 1977 to date. This on-line
database contains all utility patents, reissue patents
and defensive patents issued by the U.S. Office of
Patents and Trademarks since 1975. To ensure
complete coverage, we searched for the patents
issues to the subsidiaries of these firms, if they had
any. (See Halperin, 1986 for details about the
technique of database search)
Piihlicutiott.v it~or-tmitioti.W e obtained the infor-
mation on papers and publications from SCISE-
A RCH , a mach ne reada 171e m u t id i c pl na ry
index to the literature on science and technology
prepared by the Institute of Scientific Information
(ISI). All articles, reports of meetings, letters,
editorials, correction notices from over 3000
major scientific and technical journals are indexed
in SCISEARCH. We obtained the number of
7/27/2019 Determinants of scientific productivity in firms
http://slidepdf.com/reader/full/determinants-of-scientific-productivity-in-firms 3/8
Technical Performance and Firm Size 185
papers and publications published by au thors withthe affiliation with the respective firms (or their
subsidiaries) from 19 72 to 19 86 for the small firmsample. For the large firm sample the data onpapers corresponded to the time period 1975-
83.
Industry characteristics.We used th e definition byLawrence (1984) to categorize firms into fiveclasses: high technology, capital intensive, laborintensive, resource intensive and service. Hightechnology industries require a high pro portio n of
R&D or employment of scientists and engineers.Firms in capital intensive industries use standard-
ized technologies and employ more capital thanlabor in production. Firms in labor intensive
industries use labor intensive technologies. Firms
in resource intensive industries use natural re-sources as their main input. We classified thesample firms into these categories by matchingtheir four-digit SIC codes w ith those of Lawrence(1984, Appendix 1).
Characteristics of the two samples
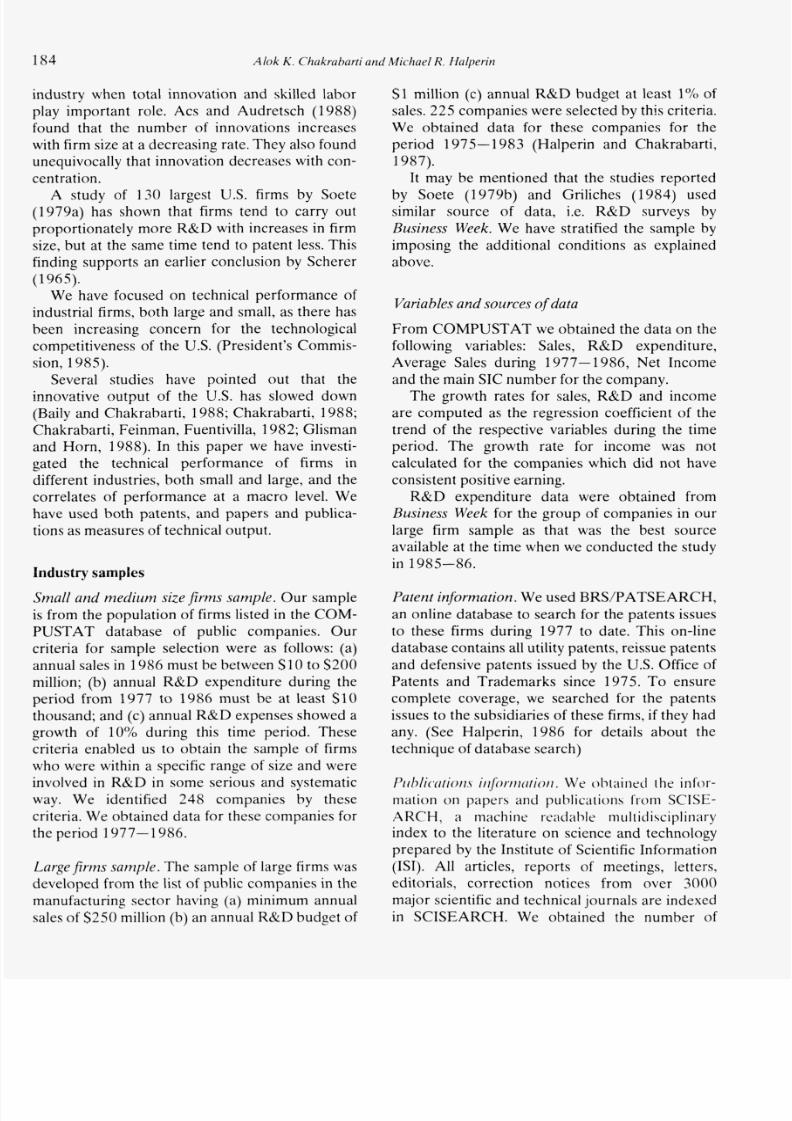
Table I provides the information on the firms in
our two samples. The table indicates the differ-ences between the two groups of samples. It isinteresting to note that the large firms as a grouphave financially performed quite well in thisperiod. Their growth rate in sales, income as wellas R&D expenditure have been much better than
T A B L E I
Characteristicsof the two samp les
Small firm samp le Large firm samp leVariables N = 248 N = 225
Av. annual sales
Av. annual R& D
expenditure
Annual income
Annual R&D
growth
Annual sales
growth
Annual income
growth
Paten tK O/ year
PaperK O/ year
64.68
2.39
1.82
20.47%
10.09%
11.17%
2.12
0.55
3479.00
82.30
180.40
54.9 3%
4 7.7 8%
39.4 5 /o
50.46
43.29
the small and medium size firms. This p oints to thecompetitive stress in which the smaller firms haveto operate. This table also points out that smallerfirms have a better record of patents com pared totheir size, while the large firms tend to publish
more.
Table I1 provides the data on the industrycharacteristics of the two sam ples of firm s investi-
gated in this paper. Both samples had a largenumber of firms in the high tech industry. Thesample for large firms had very few firms in thelabor intensive industry. The sample for smaller
firms, on the other hand, had only a few firms inthe reso urce intensive industry.
Results
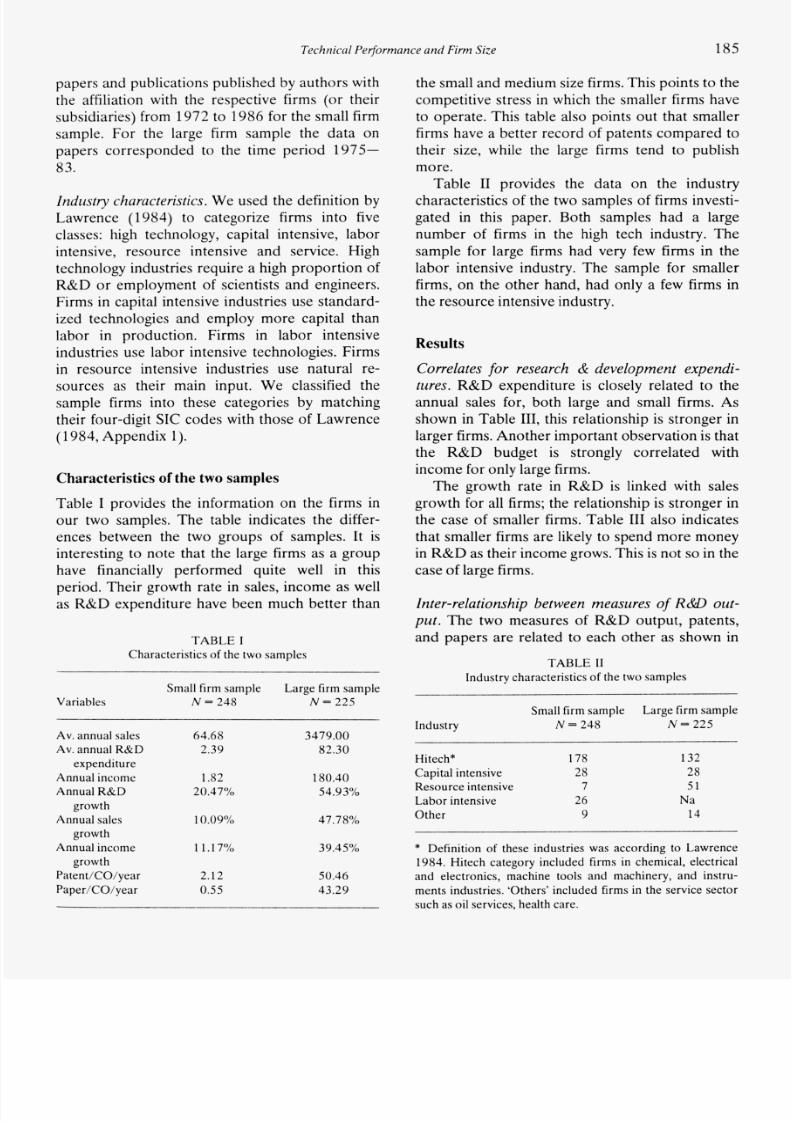
Correlates for research & development expendi-tures. R&D expenditure is closely related to theannual sales for, both large and small firms. Asshown in Table 111, this relationship is stronger in
larger firms. An othe r impo rtant observation is thatthe R&D budget is strongly correlated withincome for only large firms.
The growth rate in R&D is linked with sales
growth for all firms; the relationship is stronger inthe case of smaller firms. Table 111 also indicates
that smaller firms are likely to spend mo re mon eyin R& D as their income grows. This is not so in the
case of large firms.
Inter-relationship between measures of R&D out-put . The two measures of R&D output, patents,
and papers are related to each other as shown in
T A B L E IIndustry characteristicsof the two samples
Industry
Small firm sam ple Large firm sample
N = 248 N 225
Hitech* 178 132
Capital intensive 28 28
Resou rce intensive 7 51
Lab or intensive 26 Na
Other 9 14
* Definition of these industries was according to Lawrence
1984. Hitech category included firms in chemical, electrical
and electronics, machine tools and machinery, and instru-
ments industries. ‘Others’ included firms in the service sector
such as oil services. health care.
7/27/2019 Determinants of scientific productivity in firms
http://slidepdf.com/reader/full/determinants-of-scientific-productivity-in-firms 4/8
186 A l ok K . Chakrabarti and Michael R. Halperin
T A B L E 111
Corre lates for R&D expenditures
TA BLE V
Corre lates for patents
Small firm sample Large firm sample
Variables N = 248 N = 225
R & D budget 0.43** 0.75**
sales
income
sales growth
income growth
R&D budget -0.1 1 0.83**
R & D growth 0.78** 0.4 1 **
R & D growth 0.49** -0.0 1
* Indicates significant at 0.05 level.
** Indicates significant at 0.0 1 level.
Table IV. The correlation coefficients among themar e significant at 0.01 level. We observe that thesimple correlation between patent and papers forthe large firms is higher than that fo r smaller firms.When we controlled for the size of the firms in o urcorrelation analysis by computing the partialcorrelation, we find that the correlation is signifi-cantly lower for the large firm sample, but not forthe sm all firms. Moreov er the partial correlationsfor these two samples are close to each o ther.
Correlates of patents. Table V provides the data oncorrelates for patents. Th e total number of patentsand size are correlated as expected. We have twoindicators of size, average sales and average R&Dexpenditure. For both the samples, the relation-ships are significant beyond 0 01 level. Howe ver,for the sample of large firms, the relationship isstronger. For the large firms, patents and incomeare strongly correlated. We do not observe anystatistically significant relations between incomeand patents for the small firms. An other important
T A B L E NCorrelation between paper and patents
Small firms sample
N = 248
Large irms sample
N = 225
Correla tion Partial correlation Corre lation Partial correlation
controlling sales controlling sales
0.32 0.29 0.79 0.39
Nore: All c orrelations significant at 0.0 level.
Correlation coefficients
Variables
Small firm samp le Large firm samp le
N = 248 N-225
R & D expenditure 0.36** 0.64**
Sales 0.3 1** 0.56**
Income 0.10 0.60**
R & D growth -0.1 1* 0.05
Sales growth -0.06 0.06
Income growth -0.18* -0.0 1
* Significant at 0.05 level.
** Significant at 0.01 level.
observation is that paten t is not cor related w ith thegrowth related variables. If anything, we find anegative relationship between patent and R&Dgrowth as well as income growth for the sample of
small firms.
Correlates of publications. Table VI provides thedata on the correlates of papers and publications.Papers are correlated with R&D expendituremuch more strongly than w ith sales for both largeand smaller firms. These relationships are much
stronger in the case of large firms. In the case oflarge firms, income and papers are stronglycorrelated. Interestingly, none of the growthvariables ar e significantly related with pape rs.
Firm size and R D productivity. Are small firms
more productive than large firms? We have
TABLE VI
Correlates for papers and publications
Correlation coefficients
Variables
Small firm samp le
N = 248
Large firm sam ple
N = 225
R & D expenditure
Sales
Income
R & D growth
Sales growth
Income growth
0.44*
0.14*
-0.03
0.07
0.09
-0.09
0.69**
0.48**
0.67**
0.07
0.09
0.01
* Significant at 0 05 level.
** Significant at 0.01 level.
7/27/2019 Determinants of scientific productivity in firms
http://slidepdf.com/reader/full/determinants-of-scientific-productivity-in-firms 5/8
Technical Performance and Firm Size
I
0 9
I 0 7 -
n 0 6
z 5 -
4
1 0 3 -
g 0 8
187
. - - - + - - - a - - *-q /
/
/
\ I \
k/\ I
PATENT/$MILLION R&D 4
J PAPER/$MILLION R&D
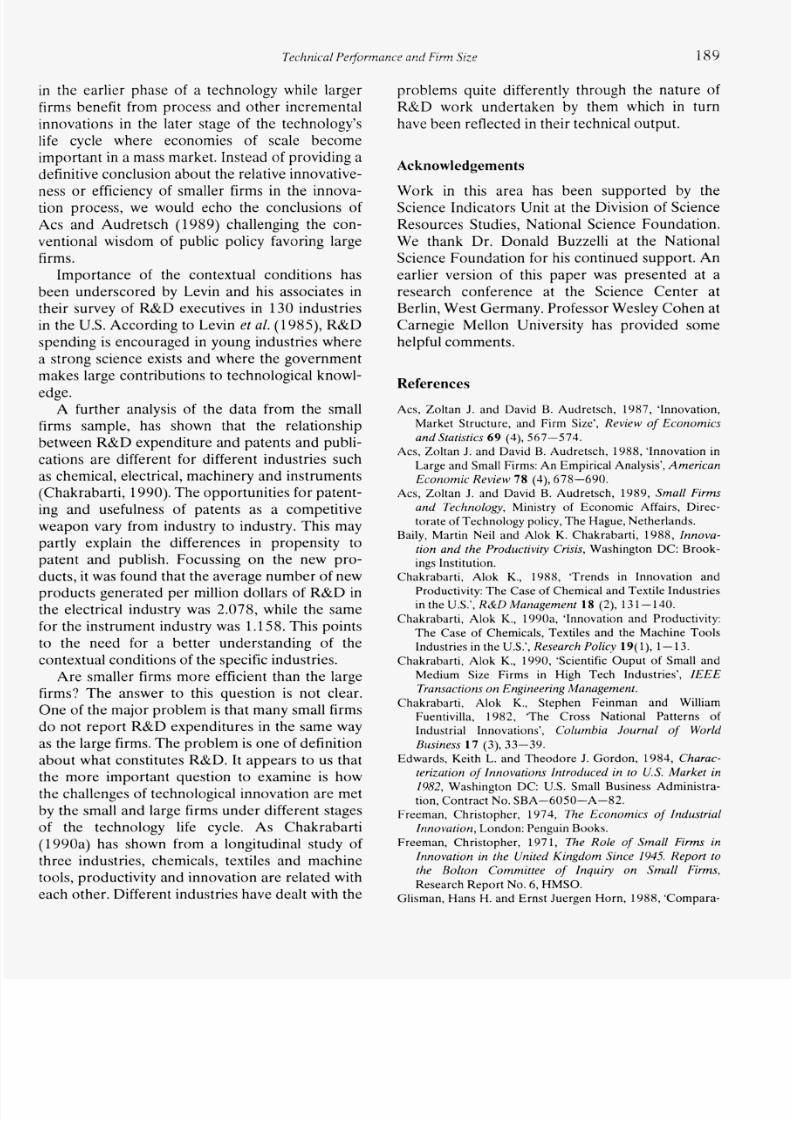
examined this question in ou r study. Halperin andChakrabarti (1987) have observed that in large
firms both patents and publications increase lessproportionately with sales for the largest 100
firms. This finding is consistent with Scherer's(1965) findings. For the second sample of firms,however we did not see such relationship. Table
VII provides the concentration d ata on the firms inour two sam ples.
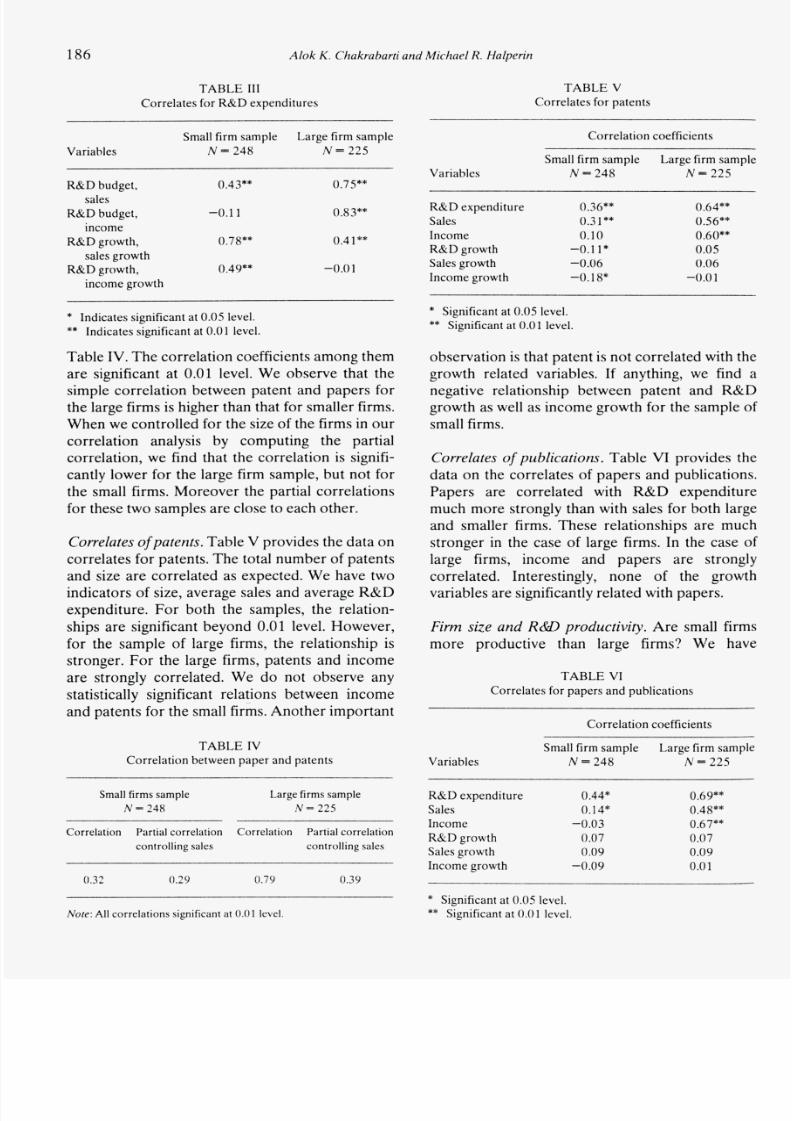
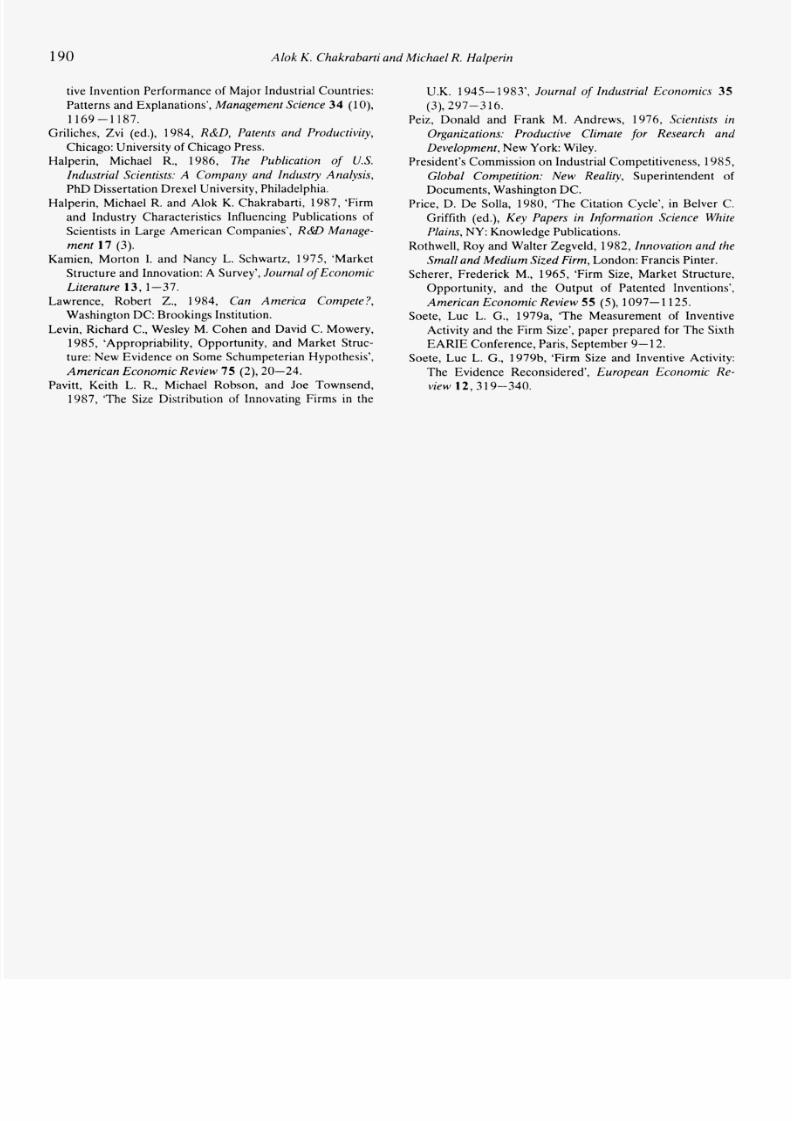
To investigate the R&D productivity further,we computed the number of patents and papersper million of dollars of R&D for groups of com-panies of different sizes in ou r two samples. TableVIII provides the data on these variables for thesmall firm and T able IX for the large firm sam ple.
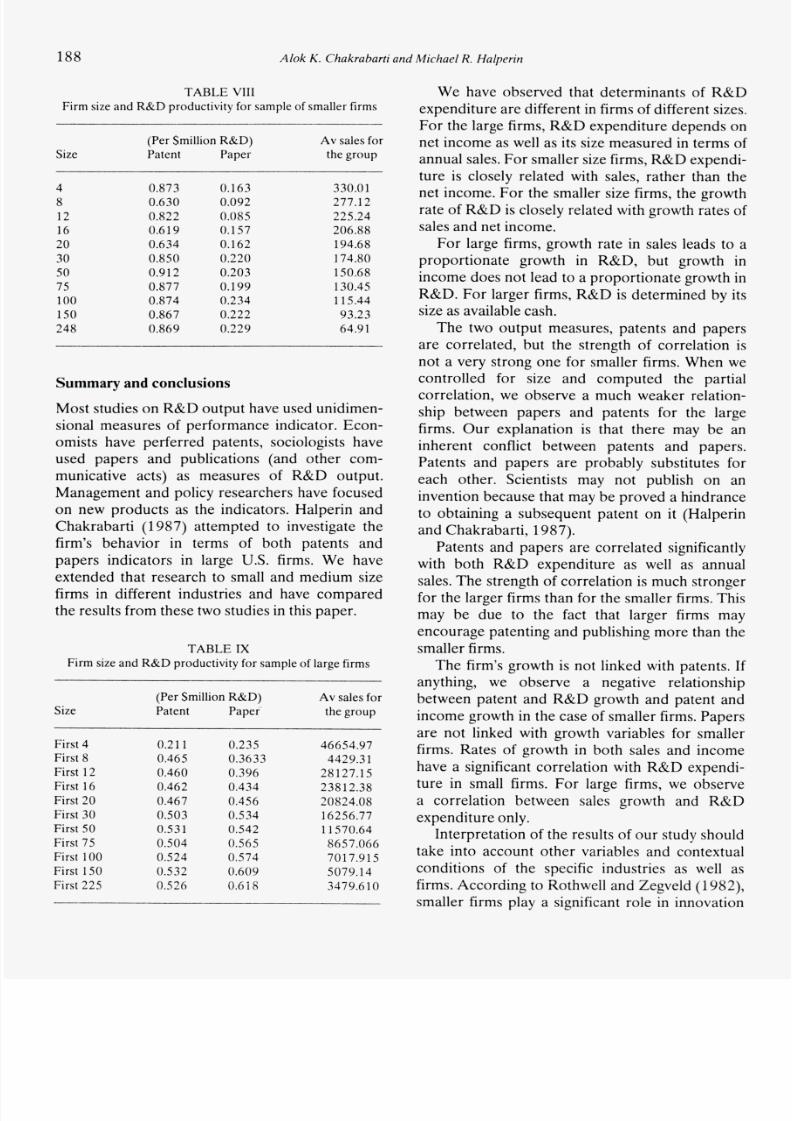
We plotted the R&D productivity, both patent
and papers, against the log of sales for the twosamples. Figure 1 shows the plot for the large firmsample and Figure for the small firm sample.
.65
0 3 5 10 3 4
0 2 5
PAPER/SMILLION R&D . \
' * \ \\\
Fig. 1 . Techn ical productivity: L arge firms.
o 1 , , , , , , , , , , , , ,
Fig. 2. Technical productivity: Smaller firms.
4 J 4 5 4 1 4 9 5 1 5 3 5 5 5 1
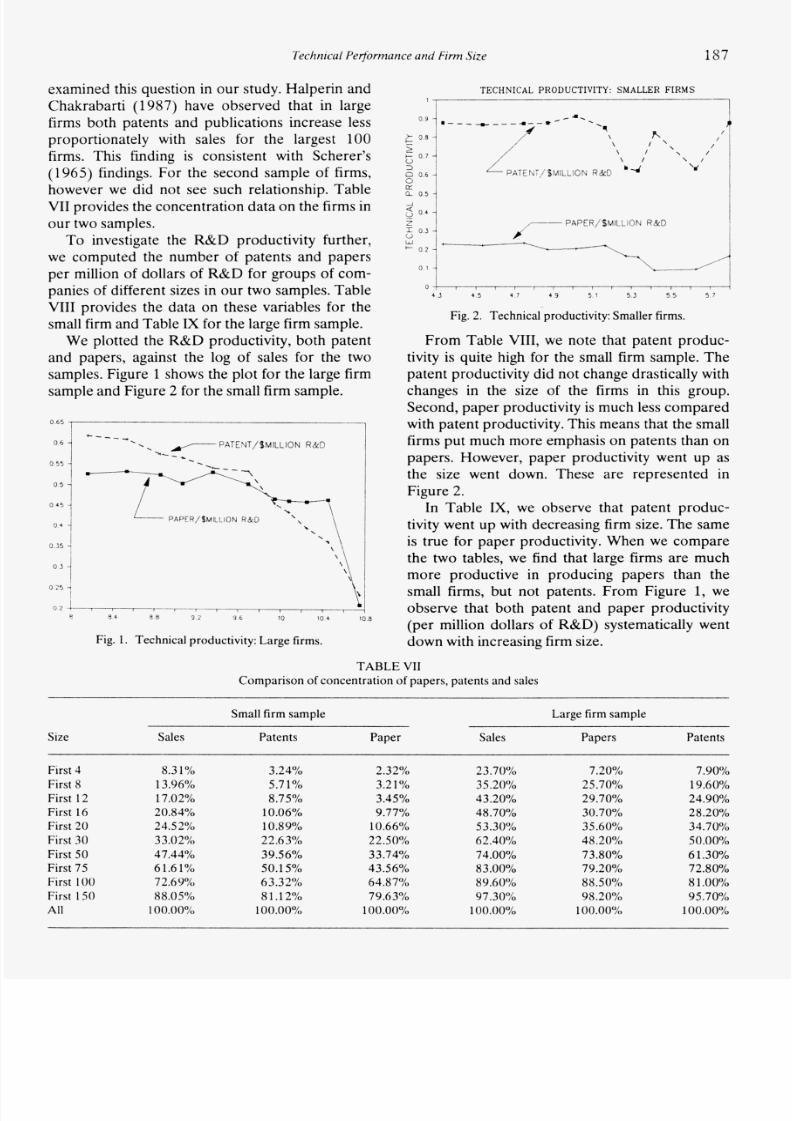
From Table VIII, we note that patent produc-
tivity is quite high for the small firm sample. Thepatent productivity did not change drastically withchanges in the size of the firms in this group.Second , paper productivity is much less comparedwith patent productivity. This m eans that the sm allfirms put much m ore emphasis on patents than o npapers. However, paper productivity went up asthe size went down. These are represented inFigure 2.
In Table IX, we observe that patent produc-tivity went up with decreasing firm size. Th e same
is true for paper productivity. When we comparethe two tables, we find that large firms are muchmore productive in producing papers than the
small firms, but not patents. From Figure 1, weobserve that both patent and paper productivity(per million dollars of R&D) systematically wentdow n w ith increasing firm size.
TA BLE VII
Comparison of concentration of papers patents and sales
Size
Small firm sample Large firm sample
Sales Patents Paper Sales Papers Patents
First 4
First 8
First 12
First 16
First 20
First 30
First 50
First 75
First 100
First 150
All
8.31OO
13.96%
17.02%
20.84%
24.5 2%
33 O2%
4 7.44%
6 1.6 /o
72.69 /0
88 O 5
100.00
3.24%
5.71%
8.75OO
lO.O6%
10.89%
22.63%
39.56%
50.15
6 3.3 2%
8 1 . 2%
100.00
2.32%
3.21O/o
3.45
9.77
10.66%
22.50%
3 3.74%
43.56%
6 4.87%
79.63%
100.00%
23.70
35.20%
43.20%
4 8.70
53.30%
62.40%
74.00%
83 OO
89.60%
97.30%
00.00%
7.20°/0
25.70%
29.70%
30.70%
35.60%
48.20%
73.80%
79.20%
88.50%
9 8.20
100.00%
7.90%
19.60%
24.90%
28.20%
34.70%
50.00°/o
6 1.30%
72.80%
8 1 .OO
95.70
00.00%
7/27/2019 Determinants of scientific productivity in firms
http://slidepdf.com/reader/full/determinants-of-scientific-productivity-in-firms 6/8
188 Alok K Chakrabarti and Michael R. Halperin
T A B L E VIII
Firm size and R&D productivity for sample of smalle r firms
(Per Srnillion R&D) Av sales for
Size Patent Paper the group
4
8
12
16
20
30
50
75
100
150
248
0.873
0.630
0.822
0.619
0.634
0.850
0.91 2
0.877
0.874
0.867
0.869
0.163
0.092
0.085
0.157
0.162
0.220
0.203
0.199
0.234
0.222
0.229
330.0 1
277.12
225.24
206.88
194.68
174.80
150.68
130.45
115.44
93.23
64.91
Summ ary and conclusions
Most studies on R& D outpu t have used unidimen-sional measures of performance indicator. Econ-omists have perferred patents, sociologists haveused papers and publications (and other com-municative acts) as measures of R&D output.Management and policy researchers have focusedon new products as the indicators. Halperin andChak rabarti (1 987) attempted to investigate the
firm’s behavior in terms of both patents andpapers indicators in large U.S. firms. We haveextended that research to small and medium sizefirms in different industries and have comparedthe results from these two studies in this pap er.
T A B L E IX
Firm size and R&D productivity for sample of large firms
(Per Srnillion R& D)
Patent Pape r the group
Av sales forSize
First 4
First 8
First 12
First 16
First 20
First 30
First 50
First 75
First 100
First 150
First 225
0.21 1
0.465
0.460
0.462
0.467
0.503
0.531
0.504
0.524
0.532
0.526
0.235
0.3633
0.396
0.434
0.456
0.534
0.542
0.565
0.574
0.609
0.618
46654.97
4429.3 1
28127.1 5
238 12.38
20824.08
16256.77
1 1570.64
8657.066
7017.915
5079.14
3479.61 0
We have observed that determinants of R&Dexp end iture ar e different in firms of different sizes.For the large firms, R&D expenditure dep ends onnet inco me as well as its size measured in term s ofannual sales. For smaller size firms, R& D expendi-
ture is closely related with sales, rather than thenet income. F or the smaller size firms, the growthrate of R &D is closely related with growth rates ofsales and net income.
For large firms, growth rate in sales leads to aproportionate growth in R&D, but growth in
income does not lead to a proportionate growth in
R&D. For larger firms, R&D is determined by itssize as available cash.
The two output measures, patents and papersare correlated, but the strength of correlation is
not a very strong on e for smaller firms. When wecontrolled for size and computed the partialcorrelation, we observe a much weaker relation-ship between papers and patents for the largefirms. Our explanation is that there may be aninherent conflict between patents and papers.Patents and papers are probably substitutes foreach other. Scientists may not publish on aninvention because that may be proved a hindranceto obtaining a subsequent patent on it (Halperinand Chakrabarti, 1987).
Patents and papers are correlated significantlywith both R&D expenditure as well as annualsales. Th e strength of correlation is much strongerfor the larger firm s than for the sm aller firms. Thismay be due to the fact that larger firms may
encoura ge patenting and publishing more than thesmaller firms.
Th e firm’s growth is not linked with patents. If
anything, we observe a negative relationshipbetween patent and R&D growth and patent andincome growth in the case of smaller firms. Papersare not linked with growth variables for smallerfirms. Rates of growth in both sales and income
have a significant correlation with R& D expendi-ture in small firms. For large firms, we observea correlation between sales growth and R&Dexpenditure only.
Interpretation of the results of ou r study shouldtake into account other variables and contextualconditions of the specific industries as well asfirms. Acco rding to R othwell and Zegveld (1982),
smaller firms play a significant role in innovation
7/27/2019 Determinants of scientific productivity in firms
http://slidepdf.com/reader/full/determinants-of-scientific-productivity-in-firms 7/8
Technical Performance and Firm Size 189
in the earlier phase of a technology while larger
firms benefit from process and other incrementalinnovations in the later stage of the technology’slife cycle where economies of scale becomeimportant in a mass market. Instead of providing a
definitive conclusion about the relative innovative-ness or efficiency of smaller firms in the innova-
tion process, we would echo the conclusions ofAcs and Audretsch (1989) challenging the con-ventional wisdom of public policy favoring large
firms.Importance of the contextual conditions has
been underscored by Levin and his associates intheir survey of R& D executives in 1 30 industriesin the U.S. According to Levin el af. 1 9 8 9 , R & Dspending is encouraged in young industries where
a strong science exists and where the governmentmakes large contribution s to technological knowl-
edge.A further analysis of the data from the small
firms sample, has shown that the relationshipbetween R&D expenditure and patents and publi-cations are different for different industries suchas chemical, electrical, machinery and instruments(Chakrabarti, 1990). Th e opportunities for patent-ing and usefulness of patents as a competitive
weapon vary from industry to industry. This may
partly explain the differences in propensity topatent and publish. Focussing on the new pro-duc ts, it was found that the average num ber of newproducts generated per million dollars of R &D inthe electrical industry was 2.078, while the samefor the instrument industry was 1.158. This po intsto the need for a better understanding of thecontextual condition s of the specific industries.
A re sm aller firms more efficient than the largefirms? The answer to this question is not clear.One of the major problem is that many small firms
d o not report R &D expenditures in the same wayas the large firms. Th e problem is one of definitionabout what constitutes R&D. It appears to us thatthe more important question to examine is howthe challenges of technological innovation are metby the small and large firms under different stagesof the technology life cycle. As Chakrabarti(1990a) has shown from a longitudinal study ofthree industries, chemicals, textiles and machinetools, productivity and innovation ar e related w itheach oth er. Different industries have dealt with the
problems quite differently through the nature ofR&D work undertaken by them which in turn
have been reflected in their technical output.
Acknowledgements
Work in this area has been supported by the
Science Indicators Unit at the Division of ScienceResources Studies, National Science Foundation.We thank Dr. Donald Buzzelli at the NationalScience Foundation for his continued support. An
earlier version of this paper was presented at aresearch conference at the Science Center atBerlin, West G ermany . Professor Wesley Cohen a tCarnegie Mellon University has provided somehelpful comm ents.
References
Acs, Zoltan J. and David B. Audretsch, 1987 , ‘Innovation,
Market Structure, and Firm Size’, Review of Economics
and Statistics 9 (4), 567-574.
Acs, Zoltan J. and David B. Audretsch, 1988 , ‘Innovation in
Large and Small Firms: An E mpirical Analysis’,American
Economic Review 78 (4), 678-690.
Acs, Zoltan J. and David B. Audretsch, 1989, Small Firms
and Technology, Ministry of Economic Affairs, Direc-
torate of Techno logy policy, The H ague, Netherlands.
Baily, Martin Neil and Alok K. Chakrabart i , 1988, Innova-
tion and the Productivity Crisis, Washington DC: Brook-ings Institution.
Chakrabarti, Alok K., 1988, ‘Trends in Innovation and
Productivity: The Case of Chemical and Textile Industries
in the U.S.’, R D Management 18 (2), 131 40.
Chakrabarti, Alok K., 199 0a, ‘Innovation and Productivity:
The Case of Chemicals, Textiles and the Machine Tools
Ind ustr ies in t he U.S.’, Research Policy 19 ), 1- 13.
Chakrabarti, Alok K., 1990 , ‘Scientific Oup ut of Small and
Medium Size Firms in High Tech Industries’, IEEE
Transactions on Engineering Management.
Chakrabarti, Alok K., Stephen Feinman and William
Fuentivilla, 1 982 , ‘The Cro ss National Pattern s of
Industrial Innovations’, Columbia Journal of WorldBusiness 17 (3), 33-39.
Edwards, Keith L. and Theodore J. Gordon, 1984, Charac-
terization of Innovatiom Introduced in to US.Market in
1982, Washington DC: U.S. Small Business Administra-
tion, Con tract No. SBA-6050-A-82.
Freeman, Christopher, 1974, The Economics of Industrial
Innovation,Londo n: Penguin Books.
Freeman, Christopher, 1971, The Role of Small Firms in
Innovation in the Unit Kin gdom Since 1945. Report to
the Rolton Committee of Inquiry on Small Firms,
Research Report No. 6, HMSO.
Glisman, Hans H. and E rnst Juergen Horn, 198 8, ‘Compara-
7/27/2019 Determinants of scientific productivity in firms
http://slidepdf.com/reader/full/determinants-of-scientific-productivity-in-firms 8/8
190 Alok K . Chakrabarti and Michael R . Halperin
tive Invention Perform ance of Major Industrial C ountries:
Patterns and E xplanations’, Management Science 34 (lo),
Griliches, Zvi (ed.), 1984, R D, Patents and Productivity,
Chicag o: University of Chicag o Press.
Halperin, Michael R., 1986, The Publication of U S .
Industrial Scientists: A Com pan y and Industry Analysis,PhD Disse rtation Drexel University, Philadelphia.
Halperin, Michael R. and Alok K. Chakrabarti, 1987, ‘Firm
and Industry Characteristics Influencing Publications of
Scientists in Large American Companies’, Rgd Manage-
ment 17 (3).
Kamien, Morton I. and Nancy L. Schwartz, 1975, ‘Market
Structure and Innovation: A Survey’,Journal of Econom ic
Literature 13, 1-37.
Lawrence, Robert Z. 1984, Can America Compete?,
Wa shington D C: Brook ings Institution.
Levin, Richard C., Wesley M. Cohen and David C. Mowery,
1985, ‘Appropriability, Opportunity, and Market Struc-
ture: New Evidence on Some Schumpeterian Hypothesis’,
American Economic Review 7 5 (2), 20-24.
Pavitt, Keith L. R., Michael Robson, and Joe Townsend,
1987, ‘The Size Distribution of Innovating Firms in the
1169 - 1 187.
U.K. 1945- 1983’, Journal of Industrial Economics 35
Peiz, Donald and Frank M. Andrews, 1976, Scientisrs in
Organizations: Productive Climate fo r Research and
Development, New York: W iley.
President’s Com mission on Industrial Competitiveness, 1985,
Global Competition: New Reality, Superintendent ofDocuments, Washington DC.
Price, D. De Solla, 1980, ‘The Citation Cycle’, in Belver C.
Griffith (ed.), Key Papers in Information Science White
Plains, N Y : Knowledge Publications.
Rothwell, Roy and Walter Zegveld, 1982, Innovation and the
Small and M edium Sized Firm, London: Francis Pinter.Scherer, Frederick M., 1965, ‘Firm Size, Market Structure,
Opportunity, and the Output of Patented Inventions’,
American Economic Review 55 (5 ) , 1097-1 125.
Soete, Luc L. G., 1979a, ‘The Measurement of Inventive
Activity and the Firm Size’, paper prepared for The Sixth
EA RIE C onference, Paris, September 9-1 2.
Soete, Luc L. G., 1979b, ‘Firm Size and Inventive Activity:The Evidence Reconsidered’, European Economic Re-
view 12,319-340.
(3), 297-3 16.