determinants of self-reported sleep quality in healthy ... · 2009; riedel & lichstein, 1998;...
TRANSCRIPT
Page 1 of 14
HEALTH PSYCHOLOGY | RESEARCH ARTICLE
Determinants of self-reported sleep quality inhealthy sleepers and patientsMaaike Goelema, Tim Leufkens, Reinder Haakma and Panos Markopoulos
Cogent Psychology (2018), 5: 1499197

HEALTH PSYCHOLOGY | RESEARCH ARTICLE
Determinants of self-reported sleep quality inhealthy sleepers and patientsMaaike Goelema1,2*, Tim Leufkens1, Reinder Haakma1 and Panos Markopoulos2
Abstract: A clear clarification of which objective variables are predictive of thesubjective sleep experience, and furthermore, which variables of the subjective sleepvariables are an adequate representation of the sleep quality score are missing. Thismay lead to people not identifying possible sleep problems or to people who feelmisunderstood when the problem is not objectively observed. Data from the SIESTAdatabase were used, which consists of two consecutive nights of polysomnographyand includes subjective data of 156 healthy persons and 95 patients (age range20–95). Among other things, the strongest significant correlations were found whenthe difference between nights was taken, for instance, between the subscore “SleepQuality” of the Subjective sleep and awakening questionnaire (SSA-1) and total sleeptime (r = .423, p < .001). For the mental disorder group, stronger correlations wereobserved between the absolute sleepmeasurements of night 1 and SSA-1 (wake timeafter sleep onset: r = .732, p < .001). The subscore “Sleep Quality” was sufficient as arepresentative for the subjective sleep quality score. Our findings indicate that intra-individual variability plays a role and to enhance the insight more nights are neededwhen investigating the association between subjective sleep quality and objectivesleep measurements.
ABOUT THE AUTHORMaaike Goelema started her professional careeras a PhD student at the Eindhoven University ofTechnology. The PhD project was performed atthe User Centered Engineering research group ofthe faculty of Industrial design in collaborationwith Philips Research. The topic of her PhD pro-ject was “Perceived sleep quality in a personalhealth monitoring context.” Maaike obtained herPhD under the supervision of Professor PanosMarkopoulos and Reinder Haakma in 2018. TimLeufkens is a sleep researcher within RoyalPhilips. Maaike is currently employed at a mentalhealthcare company treating patients with var-ious mental illnesses.
PUBLIC INTEREST STATEMENTThe importance of a good night’s sleep isincreasingly known to the general public. Moreand more people want to monitor their sleep tofind out how they have slept, especially peoplewho are worried about their sleep. Until now, lowto medium correlations were found betweenobjective sleep measures and subjective sleepquality. This may lead on the one hand to peoplenot identifying a possible sleep problem subjec-tively, in the case of an absence of an objectivesleep measurement. On the other hand, this maylead to people who subjectively report having asleep problem becoming frustrated and dis-tressed as their problem is not objectivelyobserved. A reason for the low correlation couldbe on how the association has been analyzed sofar. This article studies with an explorative analy-sis aforementioned relationship from a differentangle. Differences between nights was a greatpredictor for the subjective sleep quality, meaningthat more research studies are needed thatinvestigate aforementioned relationship in alongitudinal way.
Goelema et al., Cogent Psychology (2018), 5: 1499197https://doi.org/10.1080/23311908.2018.1499197
© 2018 The Author(s). This open access article is distributed under a Creative CommonsAttribution (CC-BY) 4.0 license.
Received: 09 October 2017Accepted: 01 July 2018First Published: 18 July 2018
*Corresponding author: MaaikeGoelema, Philips Group InnovationResearch, High Tech Campus 34,5656 AE, Eindhoven, The NetherlandsE-mail: [email protected]
Reviewing editor:Peter Walla, University of Newcastle,Australia
Additional information is available atthe end of the article
Page 2 of 14
Subjects: Health Psychology; Quality of Life; Behavioral Medicine
Keywords: sleep measurements; subjective sleep quality; sleep variability
1. IntroductionIt has been frequently shown that in both healthy individuals as people suffering from mental andsomatic diseases that objective sleep measurements are, at best, weakly to moderately correlatedwith subjective sleep quality ratings (Åkerstedt, Hume, Minors, & Waterhouse, 1994a; Åkerstedt,Hume, Minors, & Waterhouse, 1997; Armitage, Trivedi, Hoffmann, & Rush, 1997; O’Donnell et al.,2009; Riedel & Lichstein, 1998; Rosipal, Lewandowski, & Dorffner, 2013; Rotenberg, Indursky,Kayumov, Sirota, & Melamed, 2000). This may lead on the one hand to people not identifying apossible sleep problem subjectively in the case of an absence of an objective sleep measurement.On the other hand, this may lead to people who subjectively report having a sleep problembecoming frustrated and distressed as their problem is not objectively observed.
A reason for not finding high correlations between objective and subjective sleep measures maybe that the majority of previous studies are cross-sectional and thus do not capture the variationsbetween nights within individuals (Argyropoulos et al., 2003; O’Donnell et al., 2009; Riedel &Lichstein, 1998; Westerlund, Lagerros, Kecklund, Axelsson, & Åkerstedt, 2016). For instance,O’Donnell et al. (2009) found only an association between subjective sleep quality and lightsleep, but not with total sleep time, wake time after sleep onset or sleep onset latency (the lengthof time it takes from lying down for the night until sleep onset). In contrast, Åkerstedt et al. (1997)have not found an association between subjective sleep quality and light sleep but observed acorrelation between deep sleep and total sleep time. They also did not find a correlation betweensubjective sleep quality and sleep efficiency (the number of minutes of sleep divided by thenumber of minutes in bed) or wake time after sleep onset. In another study of Åkerstedt et al.(1994a), a correlation was observed between subjective sleep quality and sleep efficiency butsubjective sleep quality was not related to the sleep stages. Overall, higher correlations have beenfound between subjective evaluation of sleep and irregular sleep schedules. For instance, whenparticipants were allowed to sleep for 6 h and a 1-h nap subjective ratings of sleep quality weremore strongly associated with objective sleep parameters than when they were allowed to have 8nocturnal hours straight (Åkerstedt et al., 1994a; Åkerstedt et al., 1997; O’Donnell et al., 2009).
Higher correlations between objective and subjective measures were found in Lewandowski,Rosipal, and Dorffner (2012) and Rosipal et al. (2013). Both studies used objective measuresderived from a probabilistic sleep model mainly focusing on microstructure elements of sleep.Although both studies provide a valuable new approach of continuous sleep representation,current clinical practice still focuses on conventional R&K scoring (Rechtschaffen & Kales, 1968)or its updated version (Iber, Ancoli-Israel, Chesson, & Quan, 2007). In addition and contrasting tothe aforementioned studies, the present study has a primary interest in night-to-night variations insleep parameters.
As far as we know only Riedel and Lichstein (1998) and Saletu et al. (2005) tried to predict thesubjective sleep quality based on the difference between the objective sleep measurements of twonights. Riedel and Lichstein (1998) investigated the relationship between objective and subjectivesleep ratings in insomniacs by subtracting the polysomnography (PSG) measures of the first nightfrom those of the second night and conducted a linear regression analysis to predict the subjectivesleep satisfaction of the second night. Depth of sleep and sleep latency were found to moderatelycorrelate with subjective sleep satisfaction of the second night. The results were found in a specificsubsample of older individuals suffering from insomnia, i.e. without somatic or psychiatric comor-bidities. Rosipal et al. (2013) conducted analyses using the same data set as the present study andfound that sleep efficiency correlated most with scores on self-rating questionnaire for sleep andawakening quality. However, it was not revealed whether specific subscores of the questionnairecorrelated with objective sleep parameters and whether per night correlations were investigated
Goelema et al., Cogent Psychology (2018), 5: 1499197https://doi.org/10.1080/23311908.2018.1499197
Page 3 of 14
as well. Moreover, correlations of day-to-day changes between subjective and objective sleep indifferent patient populations appeared not to be examined.
A limited number of studies have examined the relationship between objective and subjectivesleep measurements in patient populations, leading to divergent outcomes. For example, Armitageet al. (1997) did not find correlations between subjective sleep quality and sleep efficiency, waketime after sleep onset, light sleep (in this phase the sleep starts, but it is still very light. You nolonger wake up from every sound, but you can easily be awakened), deep sleep (or slow-wavesleep, in this phase respiration and heart rate drop to the lowest rhythm. From this phase it is hardto wake someone up.) or sleep onset latency in depressed patients. Another study found only apositive correlation between slow wave sleep (SWS) and the subjective estimation of sleep dura-tion in depressed patients (Rotenberg et al., 2000). A subjective sleep quality rating was notincluded in the study.
Another reason why objective measurements until now have not been found to correlate highlywith subjective sleep quality may be due to the versatile use of the term sleep quality, as discussed byKrystal and Edinger (2008). One conclusion the authors postulated is: “The term ‘sleep quality’ is not aresult of the amount or distribution of sleep and wakefulness but rather a result of variations in theexperience of sleep itself.” Some studies make a distinction between sleep quality and sleep duration,others take sleep duration as part of the subjective sleep quality. Moreover, some questionnaires askabout awakening quality, such as being refreshed, as part of the overall sleep quality index, otherstake these as two different subscores. Additionally, there is no standardized questionnaire availableto assess subjective sleep quality. The sleep quality indices used differ in the number of questions.When an unambiguous term of sleep quality is operationalized (objectively as well as subjectively), itwill benefit future research as each study can utilize the same term and definition.
The aim of the present study was to explore whether night to night changes in objective sleepmeasures are stronger correlated with subjective evaluations of sleep than when correlatingabsolute values of one night only. We expect that variations between nights of objective andsubjective sleep measurements may explain a greater extent of the relationship between objectivesleep variables and perceived sleep quality. Moreover, this is the first study that also conductedsuch a comparison in various patient samples. In addition, with this exploratory study we want tocontribute to the existing literature to examine with a large study sample whether a betterrelationship is found when using the total score, a subscore or a single question of a sleep qualityquestionnaire as representative of the subjective sleep quality.
2. Participants and methodsTo determine the association between subjective and objective sleep measurements, data fromthe Siesta project were used (Klösch et al., 2001). In this data set, two nights of PSG measureswere collected that we could use for valid objective sleep measures; for that reason, it wasconsidered more efficient to reuse the Siesta data set rather than collect new data. The nowcompleted Siesta project aimed to “conduct extensive research on the development andevaluation of advanced methods for sleep analysis and creating a normative database ofhealthy and sleep-disturbed patients” (Klösch et al., 2001). The Siesta project was supportedby the European Commission and was carried out in several countries around Europe. In short,at the beginning of the study participants signed an informed consent form and did anentrance examination, which consisted of a physical examination and a medical screening.For 2 weeks, participants wore a wrist actigraph device and went to a sleep laboratory for twoconsecutive nights (night 7 and night 8 of wearing the actigraph device) during which PSG wereacquired. During the two nights in the sleep laboratory, an evening and a morning protocolwere implemented that included neuropsychological tests and questionnaires asking abouttheir daily events and sleeping habits. For the whole study period, participants filled out asubjective sleep and awakening quality questionnaire each morning. This article focuses solely
Goelema et al., Cogent Psychology (2018), 5: 1499197https://doi.org/10.1080/23311908.2018.1499197
Page 4 of 14

on the two consecutive nights in the sleep laboratory, and here refers to them as night 1 andnight 2.
2.1. MeasurementsFor this study, the subjective sleep and awakening questionnaire (SSA) was used to determine thesubjective sleep quality every morning (Saletu, Wessely, Grünberger, & Schultes, 1987). The SSAconsists of 27 questions, divided into three parts: sleep quality (SSA-1), awakening quality (SSA-2)and somatic complaints (SSA-3) (Table 1). The question “Did you sleep well?” (part of the sleepquality subscore) was also used in the analysis, referred to as “sleep well.” A total score can becalculated from the three parts, but a subscore of each part separately can be calculated as well.The total score ranges between 20 and 80, and higher scores indicate worse sleep quality.
For applying the PSG, 16 EEG channels were used (Fp1, Fp2, O1, O2, O3, C4, C3, Fz, Cz, Pz, F3, P3,T3, F4, P4, T4). In addition, EOG (Electro-oculogram), EMG (Electromyogram) and ECG(Electrocardiogram) were attached at the appropriate places. The polygraphic recording startedat the normal bedtimes of the participants, and they wore the PSG until the time they wouldnormally wake up. The PSG recordings were analyzed in 30-s epochs based on standardized criteria(Rechtschaffen & Kales, 1968). The following parameters were derived from the PSG: time in bed(TIB), total sleep time (TST), sleep efficiency (SE) (in percentages), sleep onset latency (SOL), waketime after sleep onset (WASO), total wake time (TWT), number of awakenings (NAW), total time insleep stage 1/stage 2/stage 3/stage 4/REM/SWS (Stage 1) (Stage 2) (Stage 3) (Stage 4) (REM) (SWS),all reported in minutes unless stated otherwise.
2.2. ParticipantsOur analysis was based on data of 156 healthy participants, 14 Parkinson patients, 18 general anxietydisorder, 8with depressive disorder, 5 periodic limbmovement disorder and 50 sleep apnea patients. Foranalysis purposes, a mental disorder group was created consisting of the general anxiety disorder andthe depressive disorder patients (N = 26) and a somatic disorder group wasmade including the periodiclimbmovement disorder, sleep apnea and Parkinson patients (N = 69) (all patients: N = 95). The healthycontrol group was created based on the following inclusion criteria: not diagnosed with a medicaldisorder interfering with the aim of the study, a Mini Mental State Examination score ≥25 (Folstein,Folstein, & McHugh, 1975), a Self-Rating Anxiety Scale score <33 (Zung, 1971), a Self-Rating DepressionScale score <35 (Zung, 1965), a Pittsburgh Sleep Quality Index global score ≤5 (Buysse, Reynolds, Monk,Berman, & Kupfer, 1989) and with normal regularity bedtimes (no shift workers). Based on theInternational Statistical Classification of Diseases and Related Health Problems (ICD-10) (World HealthOrganization), a classification of the patient groups was made.
2.3. Statistical analysesThe following main hypothesis was formulated: the association between objective sleep para-meters and subjective sleep quality score is enhanced when the difference between two nights of
Table 1. Subjective sleep and awakening quality questionnaire
Sleep quality SSA-1 Awakening quality SSA-2 Somatic complaints SSA-3(1) Did you sleep well?
(2) Did you have deep sleep?
(3) Did you have difficulties infalling asleep?
(4) Did you have difficulties instaying asleep?
(5) Did you have bad dreams?
(6) Did you have difficulties get-ting back to sleep?
(7) Did you wake up earlier thanusual?
8. Did you feel giddy afterawakening?9. Did you feel disorientated?10. Did you feel tired?11. Were you in a good mood?12. Did you feel interested in yoursurroundings?13. Did you feel slowed down?14. Was your attention/concentration reduced?15. Did you feel refreshed andrested?
16. Any nausea after awakening?17. Any headache?18. Dryness of your mouth?19. Any dizziness?20. In coordination of movements?
Goelema et al., Cogent Psychology (2018), 5: 1499197https://doi.org/10.1080/23311908.2018.1499197
Page 5 of 14
measurements is applied compared to taking the measurements of a single night. In addition, weexpect that this relationship is also visible in other patient populations as the previous nightinfluences the present night greatly. On an explanatory note, we investigated whether askingonly the single question, the subscore or the overall sleep quality score is strongly related to theobjective sleep measurements.
Before conducting correlation analyses, the data were checked for violations of the assumptionsof this statistical method. The analyses were performed on persons with data on the subjectiveside as well as on the objective side, leaving a total of 158 healthy controls and 96 patients.However, two subjects (one healthy control and one Parkinson patient) were excluded because ofvery low total sleep time (less than 84 min) on one of the PSG nights. Analyses were carried out onthe remaining 157 healthy persons and 95 patients. Since not every variable in this data set wasnormally distributed, Spearman correlations were performed.
The variables that represent the difference between the nights were computed. This was done byextracting the sleep parameters of night 1 from night 2, for example, wake after sleep onset night 2 –
wake time after sleep onset night 1 = wake time after sleep onset_ difference. Differences were alsocalculated for the sleep quality subscore (SSA-1) of the SSA questionnaire and its total score, as well asthe single question “Did you sleep well?”. These variables were taken as indices of the subjective sleepquality. Because of the considered large number of correlations, the Bonferroni correction was appliedas such reported associations were significant at a two-tailed p-value of ≤ .001.
3. Results
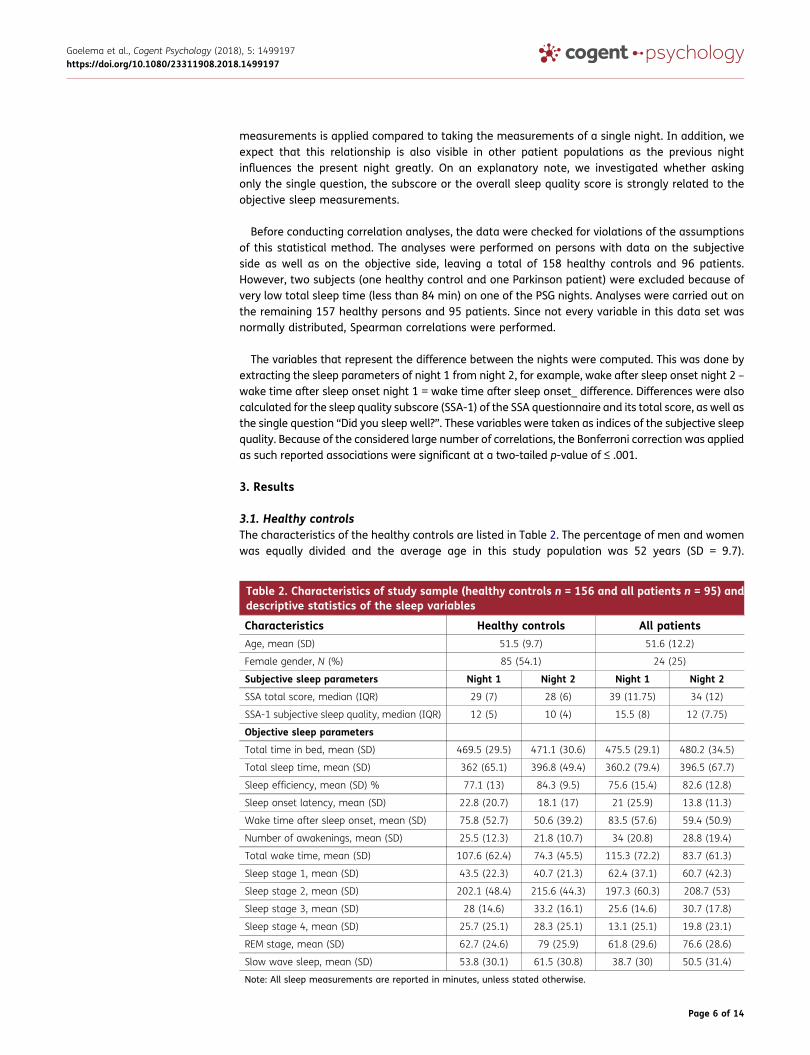
3.1. Healthy controlsThe characteristics of the healthy controls are listed in Table 2. The percentage of men and womenwas equally divided and the average age in this study population was 52 years (SD = 9.7).
Table 2. Characteristics of study sample (healthy controls n = 156 and all patients n = 95) anddescriptive statistics of the sleep variables
Characteristics Healthy controls All patientsAge, mean (SD) 51.5 (9.7) 51.6 (12.2)
Female gender, N (%) 85 (54.1) 24 (25)
Subjective sleep parameters Night 1 Night 2 Night 1 Night 2
SSA total score, median (IQR) 29 (7) 28 (6) 39 (11.75) 34 (12)
SSA-1 subjective sleep quality, median (IQR) 12 (5) 10 (4) 15.5 (8) 12 (7.75)
Objective sleep parameters
Total time in bed, mean (SD) 469.5 (29.5) 471.1 (30.6) 475.5 (29.1) 480.2 (34.5)
Total sleep time, mean (SD) 362 (65.1) 396.8 (49.4) 360.2 (79.4) 396.5 (67.7)
Sleep efficiency, mean (SD) % 77.1 (13) 84.3 (9.5) 75.6 (15.4) 82.6 (12.8)
Sleep onset latency, mean (SD) 22.8 (20.7) 18.1 (17) 21 (25.9) 13.8 (11.3)
Wake time after sleep onset, mean (SD) 75.8 (52.7) 50.6 (39.2) 83.5 (57.6) 59.4 (50.9)
Number of awakenings, mean (SD) 25.5 (12.3) 21.8 (10.7) 34 (20.8) 28.8 (19.4)
Total wake time, mean (SD) 107.6 (62.4) 74.3 (45.5) 115.3 (72.2) 83.7 (61.3)
Sleep stage 1, mean (SD) 43.5 (22.3) 40.7 (21.3) 62.4 (37.1) 60.7 (42.3)
Sleep stage 2, mean (SD) 202.1 (48.4) 215.6 (44.3) 197.3 (60.3) 208.7 (53)
Sleep stage 3, mean (SD) 28 (14.6) 33.2 (16.1) 25.6 (14.6) 30.7 (17.8)
Sleep stage 4, mean (SD) 25.7 (25.1) 28.3 (25.1) 13.1 (25.1) 19.8 (23.1)
REM stage, mean (SD) 62.7 (24.6) 79 (25.9) 61.8 (29.6) 76.6 (28.6)
Slow wave sleep, mean (SD) 53.8 (30.1) 61.5 (30.8) 38.7 (30) 50.5 (31.4)
Note: All sleep measurements are reported in minutes, unless stated otherwise.
Goelema et al., Cogent Psychology (2018), 5: 1499197https://doi.org/10.1080/23311908.2018.1499197
Page 6 of 14
Participants slept an average of 6 h and 2 min (SD = 1 h 5 min) on the first night and an average of6 h and 37 min (SD = 49 min) on the second night. Also, 26% of the healthy controls indicated theyhad not slept well or slept only slightly well during the first night of sleep and for the second night10% of the healthy controls did not sleep (slightly) well, based on the single question “How well didyou sleep?”. A paired-sample t-test was conducted to determine whether there were significantdifferences between the two nights. A significant increase in the mean sleep efficiency (SE) of thesecond night compared to the mean of the first night was found (t(156) = −7.202, p < .001).Similarly, the subjective sleep quality (SSA-1) was significantly lower after the second night thanafter the first night (t(156) = −4.544, p < .001).
3.2. PatientsIn Table 2, the characteristics of the patient sample are displayed. The percentage of women is lower inthis sample compared to thehealthy controls. However, the averageageof 52years is identical. The totalsleep time during the first night was 6 h, and the total amount of sleep time during the second night was6 h and 36min. Also, 68% reported they did not sleep well or slept slightly well during the first night and33% of the patients indicated they had not slept well or slightly well on the second night. This was alsoconfirmedby thepaired-sample t-testwhere the sleep efficiencywas lower after the first night thanafterthe second night. Also, the subjective sleep quality scorewas higher after the first night compared to thesecond night (sleep efficiency (t(95) = –.5.108, p < .001) and sleep quality (t(95) = 4.390, p < .001)).
3.3. Correlations healthy controls
3.3.1. First nightSignificant correlations were found between TST, WASO, SE, NAW, REM, Stage 2 and TWT andSSA-1 (Table 3). This means that, for instance, less minutes spent in REM is associated withan increase in the SSA-1 (SSA-1 with REM r = –.33, p < .001). Around the same level ofcorrelations were found between SSA total score and objective sleep parameters. Moreover,slightly less high correlations were observed with the sleep well question and TST, WASO,TWT and REM.
3.3.2. Second nightThe lowest correlations were found when taking the absolute parameters of the second night(Table 4). Noteworthy is that stronger significant correlations were observed between NAW andSSA-1 of the second night (r = .32, p < .001) compared to the association between NAW and SSA-1of the first night (r = .27, p = .001).
3.3.3. Differences between nightsThe highest correlations were found when taking the difference of the nights: subjective sleepquality (SSA-1) with TWT (r = .42, p < .001) and subjective sleep quality (SSA-1) with SE (r = .42,p < .001) (Table 5). Moreover, significant correlations were found between ΔTST, ΔWASO and theΔtotal score of the SSA (Table 5).
Overall, higher correlations were found when taking the sleep quality subscore (SSA-1) to associatedwith objective sleep measures (Tables 3–5). Additionally, the question “Did you sleep well?” correlatedwith some of the absolute objective sleep parameters and with some of the delta objective sleepmeasures, although fewer and weaker correlations were found compared to the SSA-1. The total scoreof the SSA had stronger correlations with the absolute parameters of the two nights than with theparameters of the difference between nights.
There were no correlations observed between awakening quality (SSA-2) and the absolute objectivesleepmeasures from night 1 and night 2. Somatic complaints subscore (SSA-3) was associatedwith TST,WASO, SE, TWT and Stage 2 with an r ranging from .29 till .34 based on night 1. Fewer correlations werefound between SSA-3 and the objective sleep measurements of night 2 (SE: r = –.288, p < .001; WASO:r = .327, p < .001; TWT: r = .306, p < .001).
Goelema et al., Cogent Psychology (2018), 5: 1499197https://doi.org/10.1080/23311908.2018.1499197
Page 7 of 14
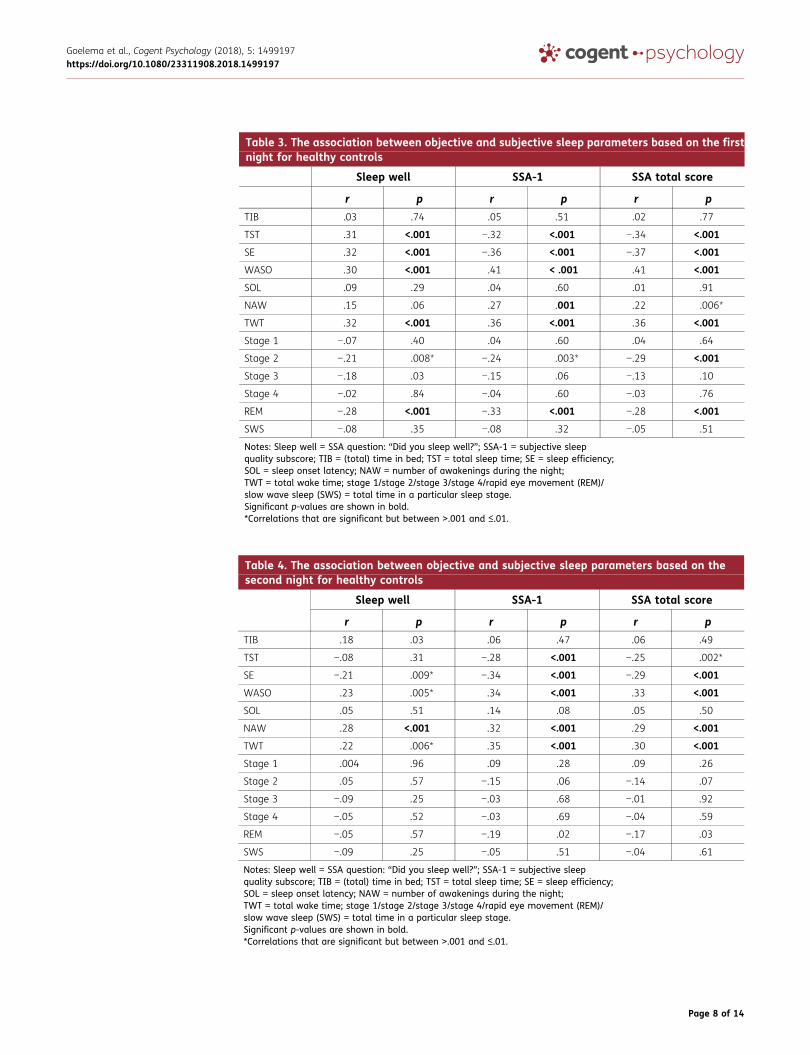
Table 3. The association between objective and subjective sleep parameters based on the firstnight for healthy controls
Sleep well SSA-1 SSA total score
r p r p r pTIB .03 .74 .05 .51 .02 .77
TST .31 <.001 −.32 <.001 −.34 <.001
SE .32 <.001 −.36 <.001 −.37 <.001
WASO .30 <.001 .41 < .001 .41 <.001
SOL .09 .29 .04 .60 .01 .91
NAW .15 .06 .27 .001 .22 .006*
TWT .32 <.001 .36 <.001 .36 <.001
Stage 1 −.07 .40 .04 .60 .04 .64
Stage 2 −.21 .008* −.24 .003* −.29 <.001
Stage 3 −.18 .03 −.15 .06 −.13 .10
Stage 4 −.02 .84 −.04 .60 −.03 .76
REM −.28 <.001 −.33 <.001 −.28 <.001
SWS −.08 .35 −.08 .32 −.05 .51
Notes: Sleep well = SSA question: “Did you sleep well?”; SSA-1 = subjective sleepquality subscore; TIB = (total) time in bed; TST = total sleep time; SE = sleep efficiency;SOL = sleep onset latency; NAW = number of awakenings during the night;TWT = total wake time; stage 1/stage 2/stage 3/stage 4/rapid eye movement (REM)/slow wave sleep (SWS) = total time in a particular sleep stage.Significant p-values are shown in bold.*Correlations that are significant but between ˃.001 and ≤.01.
Table 4. The association between objective and subjective sleep parameters based on thesecond night for healthy controls
Sleep well SSA-1 SSA total score
r p r p r pTIB .18 .03 .06 .47 .06 .49
TST −.08 .31 −.28 <.001 −.25 .002*
SE −.21 .009* −.34 <.001 −.29 <.001
WASO .23 .005* .34 <.001 .33 <.001
SOL .05 .51 .14 .08 .05 .50
NAW .28 <.001 .32 <.001 .29 <.001
TWT .22 .006* .35 <.001 .30 <.001
Stage 1 .004 .96 .09 .28 .09 .26
Stage 2 .05 .57 −.15 .06 −.14 .07
Stage 3 −.09 .25 −.03 .68 −.01 .92
Stage 4 −.05 .52 −.03 .69 −.04 .59
REM −.05 .57 −.19 .02 −.17 .03
SWS −.09 .25 −.05 .51 −.04 .61
Notes: Sleep well = SSA question: “Did you sleep well?”; SSA-1 = subjective sleepquality subscore; TIB = (total) time in bed; TST = total sleep time; SE = sleep efficiency;SOL = sleep onset latency; NAW = number of awakenings during the night;TWT = total wake time; stage 1/stage 2/stage 3/stage 4/rapid eye movement (REM)/slow wave sleep (SWS) = total time in a particular sleep stage.Significant p-values are shown in bold.*Correlations that are significant but between ˃.001 and ≤.01.
Goelema et al., Cogent Psychology (2018), 5: 1499197https://doi.org/10.1080/23311908.2018.1499197
Page 8 of 14
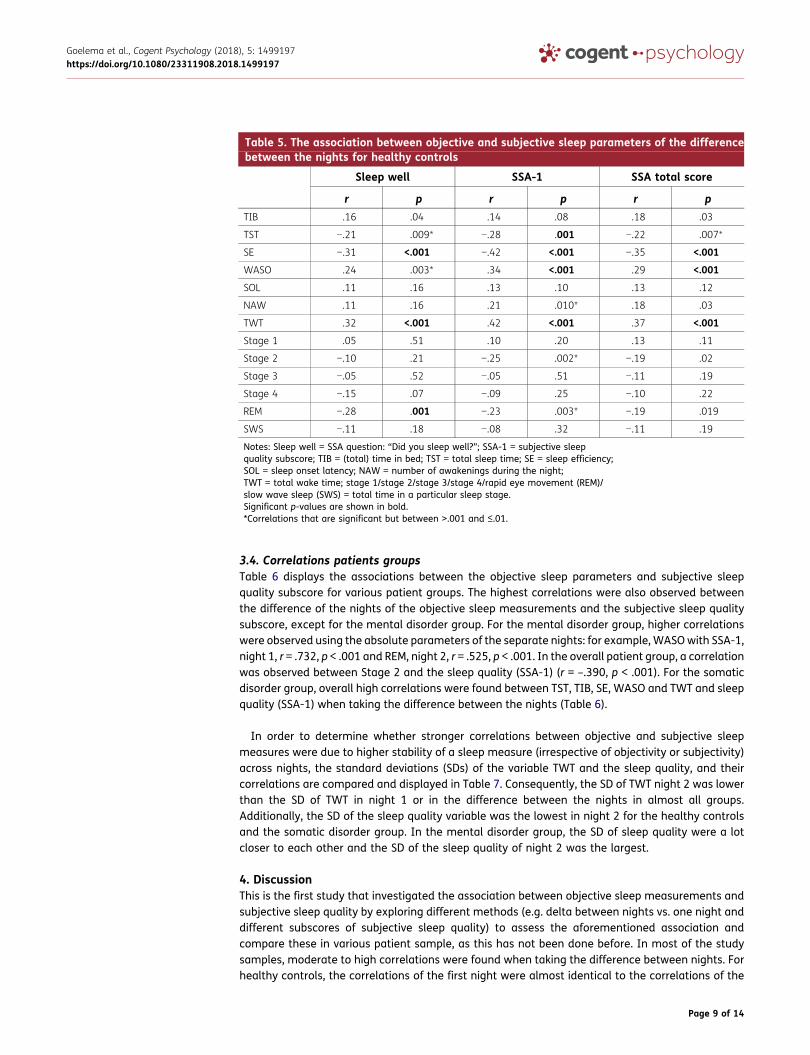
3.4. Correlations patients groupsTable 6 displays the associations between the objective sleep parameters and subjective sleepquality subscore for various patient groups. The highest correlations were also observed betweenthe difference of the nights of the objective sleep measurements and the subjective sleep qualitysubscore, except for the mental disorder group. For the mental disorder group, higher correlationswere observed using the absolute parameters of the separate nights: for example,WASOwith SSA-1,night 1, r = .732, p < .001 and REM, night 2, r = .525, p < .001. In the overall patient group, a correlationwas observed between Stage 2 and the sleep quality (SSA-1) (r = –.390, p < .001). For the somaticdisorder group, overall high correlations were found between TST, TIB, SE, WASO and TWT and sleepquality (SSA-1) when taking the difference between the nights (Table 6).
In order to determine whether stronger correlations between objective and subjective sleepmeasures were due to higher stability of a sleep measure (irrespective of objectivity or subjectivity)across nights, the standard deviations (SDs) of the variable TWT and the sleep quality, and theircorrelations are compared and displayed in Table 7. Consequently, the SD of TWT night 2 was lowerthan the SD of TWT in night 1 or in the difference between the nights in almost all groups.Additionally, the SD of the sleep quality variable was the lowest in night 2 for the healthy controlsand the somatic disorder group. In the mental disorder group, the SD of sleep quality were a lotcloser to each other and the SD of the sleep quality of night 2 was the largest.
4. DiscussionThis is the first study that investigated the association between objective sleep measurements andsubjective sleep quality by exploring different methods (e.g. delta between nights vs. one night anddifferent subscores of subjective sleep quality) to assess the aforementioned association andcompare these in various patient sample, as this has not been done before. In most of the studysamples, moderate to high correlations were found when taking the difference between nights. Forhealthy controls, the correlations of the first night were almost identical to the correlations of the
Table 5. The association between objective and subjective sleep parameters of the differencebetween the nights for healthy controls
Sleep well SSA-1 SSA total score
r p r p r pTIB .16 .04 .14 .08 .18 .03
TST −.21 .009* −.28 .001 −.22 .007*
SE −.31 <.001 −.42 <.001 −.35 <.001
WASO .24 .003* .34 <.001 .29 <.001
SOL .11 .16 .13 .10 .13 .12
NAW .11 .16 .21 .010* .18 .03
TWT .32 <.001 .42 <.001 .37 <.001
Stage 1 .05 .51 .10 .20 .13 .11
Stage 2 −.10 .21 −.25 .002* −.19 .02
Stage 3 −.05 .52 −.05 .51 −.11 .19
Stage 4 −.15 .07 −.09 .25 −.10 .22
REM −.28 .001 −.23 .003* −.19 .019
SWS −.11 .18 −.08 .32 −.11 .19
Notes: Sleep well = SSA question: “Did you sleep well?”; SSA-1 = subjective sleepquality subscore; TIB = (total) time in bed; TST = total sleep time; SE = sleep efficiency;SOL = sleep onset latency; NAW = number of awakenings during the night;TWT = total wake time; stage 1/stage 2/stage 3/stage 4/rapid eye movement (REM)/slow wave sleep (SWS) = total time in a particular sleep stage.Significant p-values are shown in bold.*Correlations that are significant but between ˃.001 and ≤.01.
Goelema et al., Cogent Psychology (2018), 5: 1499197https://doi.org/10.1080/23311908.2018.1499197
Page 9 of 14
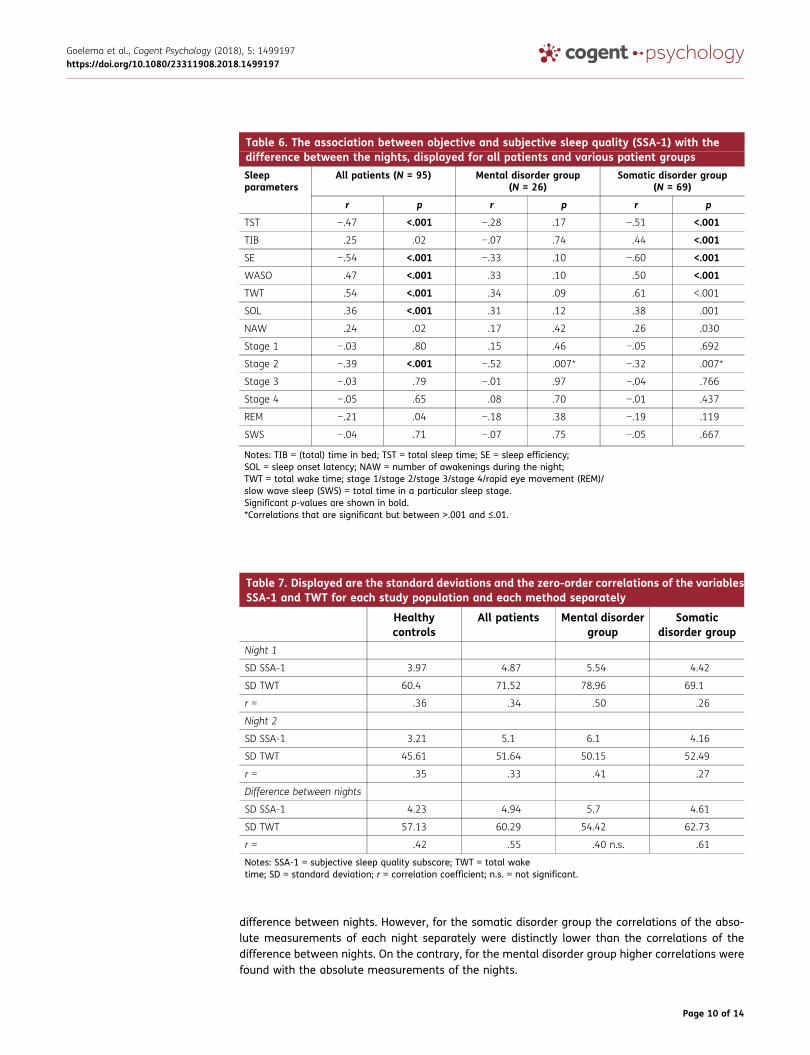
difference between nights. However, for the somatic disorder group the correlations of the abso-lute measurements of each night separately were distinctly lower than the correlations of thedifference between nights. On the contrary, for the mental disorder group higher correlations werefound with the absolute measurements of the nights.
Table 6. The association between objective and subjective sleep quality (SSA-1) with thedifference between the nights, displayed for all patients and various patient groups
Sleepparameters
All patients (N = 95) Mental disorder group(N = 26)
Somatic disorder group(N = 69)
r p r p r p
TST −.47 <.001 −.28 .17 −.51 <.001
TIB .25 .02 −.07 .74 .44 <.001
SE −.54 <.001 −.33 .10 −.60 <.001
WASO .47 <.001 .33 .10 .50 <.001
TWT .54 <.001 .34 .09 .61 <.001
SOL .36 <.001 .31 .12 .38 .001
NAW .24 .02 .17 .42 .26 .030
Stage 1 −.03 .80 .15 .46 −.05 .692
Stage 2 −.39 <.001 −.52 .007* −.32 .007*
Stage 3 −.03 .79 −.01 .97 −.04 .766
Stage 4 −.05 .65 .08 .70 −.01 .437
REM −.21 .04 −.18 .38 −.19 .119
SWS −.04 .71 −.07 .75 −.05 .667
Notes: TIB = (total) time in bed; TST = total sleep time; SE = sleep efficiency;SOL = sleep onset latency; NAW = number of awakenings during the night;TWT = total wake time; stage 1/stage 2/stage 3/stage 4/rapid eye movement (REM)/slow wave sleep (SWS) = total time in a particular sleep stage.Significant p-values are shown in bold.*Correlations that are significant but between ˃.001 and ≤.01.
Table 7. Displayed are the standard deviations and the zero-order correlations of the variablesSSA-1 and TWT for each study population and each method separately
Healthycontrols
All patients Mental disordergroup
Somaticdisorder group
Night 1
SD SSA-1 3.97 4.87 5.54 4.42
SD TWT 60.4 71.52 78.96 69.1
r = .36 .34 .50 .26
Night 2
SD SSA-1 3.21 5.1 6.1 4.16
SD TWT 45.61 51.64 50.15 52.49
r = .35 .33 .41 .27
Difference between nights
SD SSA-1 4.23 4.94 5.7 4.61
SD TWT 57.13 60.29 54.42 62.73
r = .42 .55 .40 n.s. .61
Notes: SSA-1 = subjective sleep quality subscore; TWT = total waketime; SD = standard deviation; r = correlation coefficient; n.s. = not significant.
Goelema et al., Cogent Psychology (2018), 5: 1499197https://doi.org/10.1080/23311908.2018.1499197
Page 10 of 14
This difference in findings between the healthy controls and the patients groups led us toexamine whether the results were due to a larger variation in some of the variables. There wasclearly a link between the height of the SD of the variables and the height of the correlation foundbetween the variables. This is in line with Krystal and Edinger (2008), who noted that the variationbetween nights is indicative of the sleep quality. Instead of seeing it as a linear relationship, maybethe association between objective and subjective sleep parameters is only shown when the mostextreme values are present. For example, with sleep duration, only a short or long sleep durationcorrelates well with subjective sleep quality. Moreover, this could mean that regularity measuressuch as SD are better predictors of the subjective sleep experience. This should be better investi-gated in longitudinal studies.
However, in the somatic disorder group, low correlations were observed in the first night, regardlessof the first night effect. This is probably due to a high SD in the objective sleep measurements but arelatively small SD on the subjective measurement, meaning that the ratings of the participants werenot that distinctive regardless of the large differences in the objective measurements, resulting in alow correlation. In contrast, the mental disorder group had high correlations in the absolute mea-sures of the nights, indicating that probably those persons rated accurately how they have slept,making the analysis of the difference between nights less meaningful. Alternatively, the results mayalso be due to the small sample size of the mental disorder group (N = 26).
It appeared that the variables that represent sleep continuity, for example, wake time and sleepefficiency, were also correlated the strongest with the subjective sleep quality subscore. This is in linewith Åkerstedt et al. (1997). Events that happen during the night and that people remember the nextmorning contribute themost to their assessment of their subjective sleep experience. For instance, whena higher delta between the scores of TWT of the nights was observed, also a larger difference betweenthe subjective sleep quality scores was found. In other words, the range of the difference in the objectivesleep variables was around the same as the range of difference in the subjective sleep quality for mosthealthy participants. Regarding the sleep stages, Stage 2 and REMhad the strongest associationwith thesubjective sleep quality subscore, but to a lesser extent compared to the sleep continuity variables in thehealthy controls. These findings are in line with previous research (O’Donnell et al., 2009; Saletu, 1975).
Lastly, the associationwas best shownwhen using the subjective sleep quality subscore instead of thetotal score of the SSA. When analyzing the association with the single question “Did you sleep well?” thecorrelations were less strong. This means that a couple of questions about last night are necessary as arepresentative for the subjective sleep quality score. In our study, these included the following themes:general rating of sleep quality, falling and staying asleep, the amount of deep sleep, ease of getting backto sleep and early awakening. Åkerstedt, Hume, Minors, and Waterhouse (1994b) found similar out-comes andmade a sleep quality index based on the following questions: sleep quality, calm sleep, easeof falling asleep and ability to sleep throughout the time allotted. Harvey, Stinson, Whitaker, Moskovitz,and Virk (2008) also examined the subjective sleep quality, but among individuals with and withoutinsomniaanddidnot includePSGmeasurements of sleep. Theyusedas amethodan interviewand speakfreely procedure. The normal sleepers rated the following five questions as the most important factorsfor judging sleep quality: whether you get enough sleep, how tired you feel throughout the day, howrested you feel when waking up, feeling restored on waking and feeling alert throughout the day. In thepresent study, the correlations between awakening quality (SSA-2) and the objective measures werelower than the correlations with sleep quality (SSA-1).
Arguably in depressed patients, sleep disturbances can consist of both biological and cognitiveelements (Argyropoulos et al., 2003; Lee et al., 1993). This means that improvements in thesubjective sleep quality may represent changes in their general way of thinking, improved by, forexample, cognitive behavioral therapy for treating their depression. This change in subjective sleepquality may be found regardless of enhancements in PSG measurements or biological changes.Stated is then that subjective and objective measurements may demonstrate two different pro-cesses and not be directly related (Argyropoulos et al., 2003). However, with regards to normal
Goelema et al., Cogent Psychology (2018), 5: 1499197https://doi.org/10.1080/23311908.2018.1499197
Page 11 of 14

sleepers, one needs to be cognizant that when answering, for example, the question: “How well didyou sleep?”, individual differences and various frames of reference are used. At the same time,errors and malfunctions on the objective side cause noise in the aforementioned association.
This is one of the few studies that investigated the association between objective and subjectivesleep measurements in a large study sample. The outcomes for healthy sleepers in this study werealso compared to different patient groups. Additionally, two nights of PSG were obtained, asnormally with such large study samples only actigraphy is used. A limitation of the study is thatthe two nights of PSG are executed in the laboratory. Ideally, testing should be done at home tohave more representative “normal” nights. As is previously mentioned, more nights are required toreveal the variations between nights. In this study, there is a “first night effect” since significantdifferences were found between the objective and subjective sleep measurements, which mayinterfere with the results. However, due to the “first night effect,” we were able to show that takingthe difference between the nights of the measurements is more informative than the absolutemeasures of each night separately. People will experience throughout their life good and badnights of sleep. Recently studies with a longitudinal design investigated various relationshipsbetween objective sleep measurements and sleepiness, sleep quality and stress (Åkerstedt,Axelsson, Lekander, Orsini, & Kecklund, 2013; Åkerstedt et al., 2012; Doane & Thurston, 2014;Garde, Albertsen, Persson, Hansen, & Rugulies, 2012). Åkerstedt et al. (2012) investigated therelationship between objective sleep measurements, stress and subjective sleep quality. Theyfound that stress at bedtime was the main factor that predicted the subjective sleep quality thenext morning. Still, most of the studies did not examine the relationship between objective andsubjective sleep quality specifically and did not take into account the variation on a subjectivesleep quality level. Another limitation of the current study is that other parameters that mightinfluence sleep were not taken into account, such as exercise, caffeine intake and stress (Hall et al.,2004; Roehrs & Roth, 2008; Youngstedt, 2005).
5. ConclusionsThis is the first study to explore the association between objective and subjective sleepmeasurements taking into account the difference between nights in normal sleepers andvarious patient samples. A stronger association was evident when conducting the analyseswith the delta of two nights. This result shows that when examining multiple nights this couldresult in more insight in the subjective sleep experience. As a consequence, more longitudinalstudies should be performed to collect data that is more suitable for these kinds of purposes.The enhanced correlation in the analysis with the difference between measurements of the twonights was also observed in the mental disease population but not for the other patientsamples. In addition, it was concluded that a standardized and well-accepted subjectivesleep quality index is necessary that should contain questions around continuity and deepnessof sleep, and an overall sleep quality rating, to improve the current assessment of subjectivesleep quality. Intra-individual variability plays a role, and to enhance the insight, more nightsare needed to investigate the association between subjective sleep quality and objective sleepmeasurements.
FundingThe authors received no direct funding for this research.
Competing interestsThe authors declare no competing interests.
Author detailsMaaike Goelema1,2
E-mail: [email protected] ID: http://orcid.org/0000-0002-9768-9582Tim Leufkens1
E-mail: [email protected] Haakma1
E-mail: [email protected]
Panos Markopoulos2
E-mail: [email protected] Department of Personal Health, Philips Group InnovationResearch, Eindhoven, The Netherlands.
2 Department of Industrial Design, Eindhoven University ofTechnology, Eindhoven, The Netherlands.
Citation informationCite this article as: Determinants of self-reported sleepquality in healthy sleepers and patients, Maaike Goelema,Tim Leufkens, Reinder Haakma & Panos Markopoulos,Cogent Psychology (2018), 5: 1499197.
Cover ImageSource: Cover doctoral thesis M. Goelema
Goelema et al., Cogent Psychology (2018), 5: 1499197https://doi.org/10.1080/23311908.2018.1499197
Page 12 of 14
ReferencesÅkerstedt, T., Axelsson, J., Lekander, M., Orsini, N., &
Kecklund, G. (2013). The daily variation in sleepiness andits relation to the preceding sleep episode—A prospec-tive study across 42 days of normal living. Journal ofSleep Research, 22(3), 258–265. doi:10.1111/jsr.12014
Åkerstedt, T., Hume, K., Minors, D., & Waterhouse, J.(1994a). The meaning of good sleep: A longitudinalstudy of polysomnography and subjective sleepquality. Journal of Sleep Research, 3(3), 152–158.doi:10.1111/j.1365-2869.1994.tb00122.x
Åkerstedt, T., Hume, K., Minors, D., & Waterhouse, J.(1994b). The Subjective meaning of good sleep, anintraindividual approach using the karolinska sleepdiary. Perceptual and Motor Skills, 79(1), 287–296.doi:10.2466/pms.1994.79.1.287
Åkerstedt, T., Hume, K., Minors, D., & Waterhouse, J.(1997). Good sleep — Its timing and physiologicalsleep characteristics. Journal of Sleep Research, 6(4),221–229. doi:10.1111/j.1365-2869.1997.00221.x
Åkerstedt, T., Orsini, N., Petersen, H., Axelsson, J.,Lekander, M., & Kecklund, G. (2012). Predicting sleepquality from stress and prior sleep – A study of day-to-day covariation across six weeks. Sleep Medicine,13(6), 674–679. doi:10.1016/j.sleep.2011.12.013
Argyropoulos, S. V., Hicks, J. A., Nash, J. R., Bell, C. J., Rich, A. S.,Nutt, D. J., &Wilson, S. J. (2003). Correlation of subjectiveand objective sleepmeasurements at different stages ofthe treatment of depression. Psychiatry Research, 120(2), 179–190. doi:10.1016/S0165-1781(03)00187-2
Armitage, R., Trivedi, M., Hoffmann, R., & Rush, A. J.(1997). Relationship between objective and subjec-tive sleep measures in depressed patients andhealthy controls. Depression and Anxiety, 5(2), 97–102. doi:10.1002/(SICI)1520-6394(1997)5:2<97::AID-DA6>3.0.CO;2-2
Buysse, D. J., Reynolds, C. F., Monk, T. H., Berman, S. R., &Kupfer, D. J. (1989). The Pittsburgh sleep qualityindex: A new instrument for psychiatric practice andresearch. Psychiatry Research, 28(2), 193–213.doi:10.1016/0165-1781(89)90047-4
Doane, L. D., & Thurston, E. C. (2014). Associations amongsleep, daily experiences, and loneliness in adoles-cence: Evidence of moderating and bidirectionalpathways. Journal of Adolescence, 37(2), 145–154.doi:10.1016/j.adolescence.2013.11.009
Folstein, M. F., Folstein, S. E., & McHugh, P. R. (1975). “Mini-mental state”: A practical method for grading thecognitive state of patients for the clinician. Journal ofPsychiatric Research, 12(3), 189–198. doi:10.1016/0022-3956(75)90026-6
Garde, A. H., Albertsen, K., Persson, R., Hansen, Å. M., &Rugulies, R. (2012). Bi-directional associations betweenpsychological arousal, cortisol, and sleep. BehavioralSleep Medicine, 10(1), 28–40. doi:10.1080/15402002.2012.636272
Hall, M., Vasko, R., Buysse, D., Ombao, H., Chen, Q.,Cashmere, J. D., . . . Thayer, J. F. (2004). Acute stressaffects heart rate variability during sleep.Psychosomatic Medicine, 66(1), 56–62. doi:10.1097/01.PSY.0000106884.58744.09
Harvey, A. G., Stinson, K., Whitaker, K. L., Moskovitz, D., & Virk,H. (2008). The subjective meaning of sleep quality: Acomparison of individuals with and without insomnia.Sleep, 31(3), 383–393. doi:10.1093/sleep/31.3.383
Iber, C., Ancoli-Israel, S., Chesson, A., & Quan, S. F. others.(2007). The AASM manual for the scoring of sleep and
associated events: Rules, terminology and technical spe-cifications (Vol. 1). Westchester, IL: American Academyof Sleep Medicine.
Klösch, G., Kemp, B., Penzel, T., Schlogl, A., Rappelsberger,P., Trenker, E., . . . Dorffner, G. (2001). The SIESTAproject polygraphic and clinical database. IEEEEngineering in Medicine and Biology Magazine, 20(3),51–57. doi:10.1109/51.932725
Krystal, A. D., & Edinger, J. D. (2008). Measuring sleep quality.SleepMedicine, 9, S10–S17. doi:10.1016/S1389-9457(08)70011-X
Lee, J. H., Reynolds, C. F., Hoch, C. C., Buysse, D. J.,Mazumdar, S., George, C. J., & Kupfer, D. J. (1993).Electoencephalographic sleep in recently remitted,elderly depressed patients in double-blind placebo-maintenance therapy. Neuropsychopharmacology, 8(2), 143–150. doi:10.1038/npp.1993.16
Lewandowski, A., Rosipal, R., & Dorffner, G. (2012).Extracting more information from EEG recordings fora better description of sleep. Computer Methods andPrograms in Biomedicine, 108(3), 961–972.doi:10.1016/j.cmpb.2012.05.009
O’Donnell, D., Silva, E. J., Münch, M., Ronda, J. M.,Wang,W., &Duffy, J. F. (2009). Comparison of subjective and objec-tive assessments of sleep in healthy older subjectswithout sleep complaints. Journal of Sleep Research, 18(2), 254–263. doi:10.1111/j.1365-2869.2008.00719.x
Rechtschaffen, A., & Kales, A. (1968). A manual of stan-dardized terminology, techniques and scoring systemfor sleep stages of human subjects. Bethesda, MD: USPublic Health Service.
Riedel, B. W., & Lichstein, K. L. (1998). Objective sleepmeasures and subjective sleep satisfaction: How doolder adults with insomnia define a good night’ssleep? Psychology and Aging, 13(1), 159–163.doi:10.1037/0882-7974.13.1.159
Roehrs, T., & Roth, T. (2008). Caffeine: Sleep and daytimesleepiness. Sleep Medicine Reviews, 12(2), 153–162.doi:10.1016/j.smrv.2007.07.004
Rosipal, R., Lewandowski, A., & Dorffner, G. (2013). Insearch of objective components for sleep qualityindexing in normal sleep. Biological Psychology, 94(1),210–220. doi:10.1016/j.biopsycho.2013.05.014
Rotenberg, V. S., Indursky, P., Kayumov, L., Sirota, P., &Melamed, Y. (2000). The relationship between sub-jective sleep estimation and objective sleep variablesin depressed patients. International Journal ofPsychophysiology, 37(3), 291–297. doi:10.1016/S0167-8760(00)00110-0
Saletu, B. (1975). Is the subjectively experienced qualityof sleep related to objective sleep parameters?Behavioral Biology, 13(4), 433–444. doi:10.1016/S0091-6773(75)91009-3
Saletu, B., Gruber, G., Parapatics, S., Anderer, P., Klösch, G.,Barbanoj, M. J., & Others,. (2005). The self-assess-ment scale for sleep and awakening quality (SSA)–Normative data and polysomnographic correlates. InThe First Biennial Congress of the World Association ofSleep Medicine (WASM). Sleep Medicine 6 (Suppl.2),S94, Berlin, Germany.
Saletu, B., Wessely, P., Grünberger, J., & Schultes, M. (1987).Erste klinische Erfahrungen mit einem neuen schlafan-stossenden Benzodiazepin, Cinolazepam, mittels einesSelbstbeurteilungsbogens für Schlaf- undAufwachqualität (SSA).Neuropsychiatrie, 1(4), 169–176.
Westerlund, A., Lagerros, Y. T., Kecklund, G., Axelsson, J.,& Åkerstedt, T. (2016). Relationships between
Goelema et al., Cogent Psychology (2018), 5: 1499197https://doi.org/10.1080/23311908.2018.1499197
Page 13 of 14

questionnaire ratings of sleep quality and polysom-nography in healthy adults. Behavioral SleepMedicine, 14(2), 185–199. doi:10.1080/15402002.2014.974181
Youngstedt, S. D. (2005). Effects of exercise on sleep.Clinics in Sports Medicine, 24(2), 355–365.doi:10.1016/j.csm.2004.12.003
Zung. (1965). A self-rating depression scale. Archives ofGeneral Psychiatry, 12(1), 63–70. doi:10.1001/archpsyc.1965.01720310065008
Zung, W. W. (1971). A rating instrument for anxiety dis-orders. Psychosomatics, 12(6), 371–379. doi:10.1016/S0033-3182(71)71479-0
©2018 The Author(s). This open access article is distributed under a Creative Commons Attribution (CC-BY) 4.0 license.
You are free to:Share — copy and redistribute the material in any medium or format.Adapt — remix, transform, and build upon the material for any purpose, even commercially.The licensor cannot revoke these freedoms as long as you follow the license terms.
Under the following terms:Attribution — You must give appropriate credit, provide a link to the license, and indicate if changes were made.You may do so in any reasonable manner, but not in any way that suggests the licensor endorses you or your use.No additional restrictions
Youmay not apply legal terms or technological measures that legally restrict others from doing anything the license permits.
Cogent Psychology (ISSN: 2331-1908) is published by Cogent OA, part of Taylor & Francis Group.
Publishing with Cogent OA ensures:
• Immediate, universal access to your article on publication
• High visibility and discoverability via the Cogent OA website as well as Taylor & Francis Online
• Download and citation statistics for your article
• Rapid online publication
• Input from, and dialog with, expert editors and editorial boards
• Retention of full copyright of your article
• Guaranteed legacy preservation of your article
• Discounts and waivers for authors in developing regions
Submit your manuscript to a Cogent OA journal at www.CogentOA.com
Goelema et al., Cogent Psychology (2018), 5: 1499197https://doi.org/10.1080/23311908.2018.1499197
Page 14 of 14