determination of apurinic/apyrimidinic lesions in dna with high-performance liquid chromatography...
TRANSCRIPT
Determination of Apurinic/Apyrimidinic Lesions in DNA withHigh-Performance Liquid Chromatography and Tandem Mass
Spectrometry
Kenneth P. Roberts,*,† Justin A. Sobrino,† Julie Payton,† Lavinnia B. Mason,† andRobert J. Turesky‡,§
Department of Chemistry and Biochemistry, The UniVersity of Tulsa, Tulsa, Oklahoma 74104, andNational Center for Toxicological Research, U.S. Food and Drug Administration, Jefferson, Arkansas 72079
ReceiVed September 14, 2005
A new method has been developed to accurately measure apurinic and apyrimidinic (AP) DNA damagesites, which are lesions in DNA formed by loss of a nucleobase from oxidative stress or carcinogenadducts. If AP sites are left unrepaired (or if improperly repaired), these sites can lead to DNA mutationsthat may ultimately result in the formation of cancer. Hence, detection of AP sites may provide a usefulindicator of exposure and susceptibility to chemical carcinogens and oxidative stress. AP detection iscurrently accomplished by immunodetection methods using an aldehyde reactive probe [Nakamura, J.,Walker, V. E., Upton, P. B., Chiang, S.-Y., Kow, Y. W., and Swenberg, J. A. (1998)Cancer Res. 58,222-225; Atamna, H., Cheung, I., and Ames, B. N. (2000)Proc. Natl. Acad. Sci. U.S.A. 97, 686-691];however, these approaches lack the specificity required for unequivocal identification of the AP site.Therefore, we have developed an accurate method based on mass spectrometry detection of AP sitesfrom AP DNA that have been prelabeled withO-4-nitrobenzylhydroxylamine (NBHA). Once labeledand once the excess labeling agent has been removed, enzymatic digestion of DNA to monomeric subunitscan be accomplished, followed by isolation and detection with high-performance liquid chromatographycoupled to electrospray ionization tandem mass spectrometry (HPLC-ESI-MS/MS). Optimization andvalidation of the experimental procedures and detection limits have been established using a model DNAoligomer (11-mer) containing uracil. Enzymatic removal of uracil with uracil glycosylase generates well-defined AP sites in both single- and double-stranded DNA. The addition of NBHA labels the AP site inthe oligomer, creating a labeled 11-mer. HPLC-ESI-MS/MS in the negative ionization mode was used tomonitor and confirm binding of NBHA to the AP oligomer. The NBHA-tagged oligomer underwentendo- and exonuclease digestion to the 5′-deoxyribose monophosphate (5′-dRp) level, thereby releasingfree 5′-dRp-NBHA. The 5′-dRp-NBHA product was partially purified by solid phase extraction andquantified by LC-MS/MS using several transitions of the deprotonated molecule ([M- H]- at m/z 363)and isotopically labeled 5′-dRp-NBHA as an internal standard. Further experiments with 5′,3′-bisphosphate-deoxyribose and heat/acid-treated calf thymus DNA showed similar labeling, digestion, and detectionresults. Initial results show a quantification limit with 100µg of DNA to be 100 fmol (three abasic sitesper 107 bases).
Introduction
Apurinic/apyrimidinic (AP) sites in DNA are one of the mostprevalent types of DNA damage and are often the consequenceof spontaneous hydrolysis of theN-glycoside bond fromexposure to chemical carcinogens, irradiation, oxidative stress,or through enzymatic processes in base excision repair pathways(1, 2). The result is loss of a nucleobase, leaving a ribosyl moietythat is in equilibrium between a ring-closed and a ring-openedaldehydic structure. The ring-opened structure accounts forapproximately 5% of the equilibrium concentration (3). Ifincorrectly (or inefficiently) repaired, AP sites may lead togenetic mutations and to the development of cancer (4). Whatis more, reports have shown that overexposure to certainenvironmental toxicants may induce formation of high levels
of AP sites beyond the reported basal level of one AP site in105 bases (5, 6), which could exceed the capacity of error-freerepair (7-9). Hence, detection of AP sites may provide a usefuldosimeter of exposure and susceptibility to toxicants and variousforms of oxidative stress.
Several approaches for AP site detection have been uti-lized including radiometric labeling of the AP site with14C-methoxyamine,14C-phenylhydrazine, and14C-semicarbazide(10-12); HPLC with 32P-postlabeling (13); diaminopurinetethered to acridine for NMR detection of single-strand breaksattributed to AP sites (14); fluorimetric labeling of AP sites withrhodamine and dansyl probes (15); a colorimetric ELISA assaybased on formation of a Schiff base withO-4-nitrobenzyl hy-droxylamine (NBHA) (16); atomic force microscopy of probedAP sites (17); and, most commonly, colorimetric detection withan aldehyde reactive probe (ARP) (3, 6, 18-23).
In the ARP approach, the aldehyde group of the AP site iscovalently labeled with specially designed aminooxy functional-ity at one end of the ARP probe to form a Schiff base at theAP site of intact DNA. The opposing end of ARP contains a
* To whom correspondence should be addressed. Fax: 918-631-3404.E-mail: [email protected].
† The University of Tulsa.‡ U.S. Food and Drug Administration.§ Current address: Division of Environmental Disease and Prevention,
NYS Department of Health, Albany, NY 12201-0509.
300 Chem. Res. Toxicol.2006,19, 300-309
10.1021/tx0502589 CCC: $33.50 © 2006 American Chemical SocietyPublished on Web 01/19/2006
biotin moiety for avidin recognition in subsequent slot-blotdetection schemes. AP site determinations with ARP, utilizinga commercially available kit (Dojindo Molec. Tech., Gaithers-burg, MD), can be accomplished within the detection limits ofthis commercial ELISA type assay (one AP site per 105 basepairs), and one AP site per 107 base pairs has been reportedusing an ARP-based slot-blot method (6). Although com-mercialization and sufficient detection levels have been dem-onstrated with ARP, these approaches lack specificity and,hence, the potential mislabeling of DNA oxidation productsother than AP sites (6, 12, 23, 24). In addition, noncovalentintercalation of the ARP probe within DNA may occur, resultingin further overestimation of AP sites. With this, researchers haverecently begun to utilize mass spectrometry as a more accurateanalysis of oxidative products of DNA damage, either bymonitoring apurinic sites by14C-labeling with accelerator massspectrometry detection (12) or by using tandem mass spectrom-etry to measure oxidation products of deoxyribose that havebeen labeled with ARP (23). Detection limits were one AP sitein 106 nucleotides and two adducts in 108 guanines, respectively.
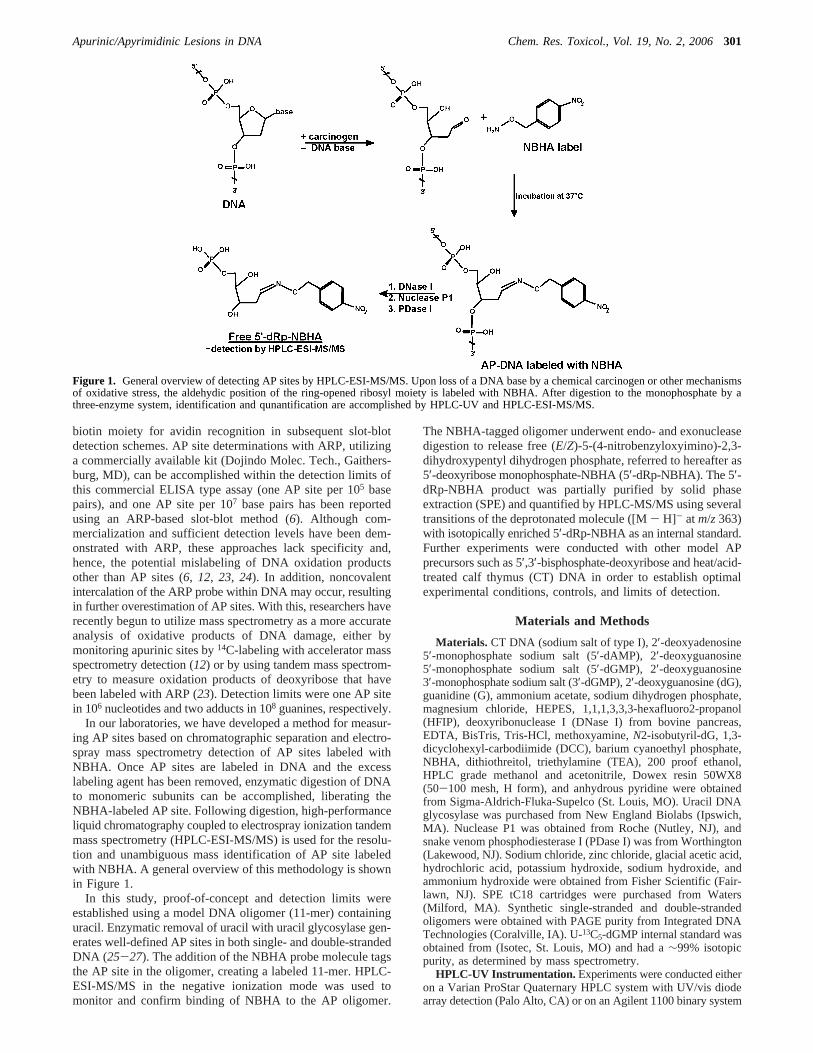
In our laboratories, we have developed a method for measur-ing AP sites based on chromatographic separation and electro-spray mass spectrometry detection of AP sites labeled withNBHA. Once AP sites are labeled in DNA and the excesslabeling agent has been removed, enzymatic digestion of DNAto monomeric subunits can be accomplished, liberating theNBHA-labeled AP site. Following digestion, high-performanceliquid chromatography coupled to electrospray ionization tandemmass spectrometry (HPLC-ESI-MS/MS) is used for the resolu-tion and unambiguous mass identification of AP site labeledwith NBHA. A general overview of this methodology is shownin Figure 1.
In this study, proof-of-concept and detection limits wereestablished using a model DNA oligomer (11-mer) containinguracil. Enzymatic removal of uracil with uracil glycosylase gen-erates well-defined AP sites in both single- and double-strandedDNA (25-27). The addition of the NBHA probe molecule tagsthe AP site in the oligomer, creating a labeled 11-mer. HPLC-ESI-MS/MS in the negative ionization mode was used tomonitor and confirm binding of NBHA to the AP oligomer.
The NBHA-tagged oligomer underwent endo- and exonucleasedigestion to release free (E/Z)-5-(4-nitrobenzyloxyimino)-2,3-dihydroxypentyl dihydrogen phosphate, referred to hereafter as5′-deoxyribose monophosphate-NBHA (5′-dRp-NBHA). The 5′-dRp-NBHA product was partially purified by solid phaseextraction (SPE) and quantified by HPLC-MS/MS using severaltransitions of the deprotonated molecule ([M- H]- atm/z363)with isotopically enriched 5′-dRp-NBHA as an internal standard.Further experiments were conducted with other model APprecursors such as 5′,3′-bisphosphate-deoxyribose and heat/acid-treated calf thymus (CT) DNA in order to establish optimalexperimental conditions, controls, and limits of detection.
Materials and Methods
Materials. CT DNA (sodium salt of type I), 2′-deoxyadenosine5′-monophosphate sodium salt (5′-dAMP), 2′-deoxyguanosine5′-monophosphate sodium salt (5′-dGMP), 2′-deoxyguanosine3′-monophosphate sodium salt (3′-dGMP), 2′-deoxyguanosine (dG),guanidine (G), ammonium acetate, sodium dihydrogen phosphate,magnesium chloride, HEPES, 1,1,1,3,3,3-hexafluoro2-propanol(HFIP), deoxyribonuclease I (DNase I) from bovine pancreas,EDTA, BisTris, Tris-HCl, methoxyamine,N2-isobutyril-dG, 1,3-dicyclohexyl-carbodiimide (DCC), barium cyanoethyl phosphate,NBHA, dithiothreitol, triethylamine (TEA), 200 proof ethanol,HPLC grade methanol and acetonitrile, Dowex resin 50WX8(50-100 mesh, H form), and anhydrous pyridine were obtainedfrom Sigma-Aldrich-Fluka-Supelco (St. Louis, MO). Uracil DNAglycosylase was purchased from New England Biolabs (Ipswich,MA). Nuclease P1 was obtained from Roche (Nutley, NJ), andsnake venom phosphodiesterase I (PDase I) was from Worthington(Lakewood, NJ). Sodium chloride, zinc chloride, glacial acetic acid,hydrochloric acid, potassium hydroxide, sodium hydroxide, andammonium hydroxide were obtained from Fisher Scientific (Fair-lawn, NJ). SPE tC18 cartridges were purchased from Waters(Milford, MA). Synthetic single-stranded and double-strandedoligomers were obtained with PAGE purity from Integrated DNATechnologies (Coralville, IA). U-13C5-dGMP internal standard wasobtained from (Isotec, St. Louis, MO) and had a∼99% isotopicpurity, as determined by mass spectrometry.
HPLC-UV Instrumentation. Experiments were conducted eitheron a Varian ProStar Quaternary HPLC system with UV/vis diodearray detection (Palo Alto, CA) or on an Agilent 1100 binary system
Figure 1. General overview of detecting AP sites by HPLC-ESI-MS/MS. Upon loss of a DNA base by a chemical carcinogen or other mechanismsof oxidative stress, the aldehydic position of the ring-opened ribosyl moiety is labeled with NBHA. After digestion to the monophosphate by athree-enzyme system, identification and qunantification are accomplished by HPLC-UV and HPLC-ESI-MS/MS.
Apurinic/Apyrimidinic Lesions in DNA Chem. Res. Toxicol., Vol. 19, No. 2, 2006301
with UV/vis diode array detection (Palo Alto, CA). Unless otherwisestated below, the separation columns of choice were 4.6 mm×250 mm Supelco C18-DB and Supelco Discovery C18, with inlineC18 Supelco guard columns. Injection of sample onto the HPLCwas either manual or by the use of an autosampler. All solventswere of HPLC grade and/or prepared with doubly deionizedultrahigh purity (18 MΩ) water. Mobile phase buffers were filteredthrough 0.45µm nylon filters and degassed by sonication prior touse. Unless otherwise stated, the optimal HPLC-UV/vis conditionsfor separations were to utilize a solvent gradient beginning with100% 50 mM NaH2PO4 (pH 4.5) for 3 min followed by a lineargradient to 100% of 66% acetonitrile at 13 min, and holding to 16min before returning to 100% NaH2PO4 for reequilibration. Thedetection wavelength was 274 nm. A constant flow rate of 1.0 mLper min was maintained. In cases where subsequent MS/MS wasto be performed, the phosphate buffer was replaced with 50 mMammonium acetate (pH 6.8).
HPLC-ESI-MS/MS Instrumentation. Chromatography wasaccomplished with a capillary HPLC system from LC Packings/Dionex (Amsterdam, Netherlands) and comprised of an UltiMatequaternary pump, Switchos II column switching system, and aFamos autosampler. A Waters Symmetry Column (1 mm× 5 cm,4 µm particle size with 80 Å pore size) was used for chromato-graphic separations using mobile phases of 0.1% formic acid (A)and 0.1% formic acid in acetonitrile (B). Elution was carried outby holding A constant for 4 min followed by a linear gradient to100% B in 15 min at a flow rate of 50µL/min. Typical injectionvolumes were 1-5 µL.
Detection and quantification of DNA digestion products wereaccomplished by ESI-MS/MS with a Waters Micromass QuattroUltima triple quadrupole mass spectrometer (Manchester, U.K.).Unless otherwise stated, qualitative and quantitative detection weredone in negative ionization mode using full scan and product ionmass spectral transitions. The monitored transitions for 5′-dRp-NBHA were m/z 363 f 97 andm/z 363 f 79, and for the13Cinternal standard, the transitions werem/z 368 f 97 andm/z 368f 79. The dwell time for the selected reaction monitoringtransitions of 5′-dRp-NBHA was 0.1 s. The cone voltage was 40V, the capillary voltage was 3.0 kV, hexapoles 1 and 2 were 0 V,and the collision energy was set to 21 eV. Source and desolvationtemperatures were 110 and 300°C, respectively, with cone gasand desolvation flow rates of 70 and 500 L/h, respectively. Argonwas used as the collision gas at a pressure of 2.5 mTorr.
Synthesis of 5′-dRp-NBHA. The procedure used for synthesisof 5′-dRp-NBHA was carried out with either 5′-dAMP or 5′-dGMPdue to the lack of commercially available 5′-dRp at the time ofthis study. In brief, to 100 mg of dAMP in 10 mL of H2O wasadded 173µL of concentrated acetic acid and hydrolyzed at 65°Cfor 70 min. Upon cooling, NBHA label could be added directly tothe hydrolysis mixture (see below), or if need be, 5′-dRp waspurified. The latter was accomplished with 3 cc Waters brand tC18Sep-Pak SPE cartridges. Cartridges were conditioned with 2.0 mLof methanol followed by 2.0 mL of water. Three milliliters ofhydrolysis product was then loaded on the cartridges, and 1 mLfractions were collected. No additional elution solvent was used.Purified 5′-dRp eluted in fractions 1 and 2 as determined by massspectrometry. Fractions 1 and 2 were collected, and solvent wasremoved by evaporation under reduced pressure.
However, in most cases, NBHA was added directly to thehydrolysis mixture without SPE purification. This was done byadding 1.8 mM NBHA (final concentration) to the hydrolysismixture and reacting for 2 h atroom temperature, protected fromlight with aluminum foil. After centrifugation to remove insolublenucleobase (e.g., Ade), SPE was performed with Waters tC18 3 cccartridges. Prior to sample loading, SPE cartridges were equili-brated with 2.0 mL of methanol, followed by 2.0 mL of 2.0 mMNaH2PO4 (pH 4.5). One milliliter of the hydrolysis supernatant wasadded to a single SPE cartridge, and 0.5 mL fractions werecollected. A stepwise solvent gradient was added in 1.0 mL incre-ments that included 2.0 mM NaH2PO4, 75% 2.0 mM NaH2PO4:25% methanol, 50% NaH2PO4:50% methanol, 25% NaH2PO4:75%
methanol, and 100% methanol. Purified 5′-dRp-NBHA eluted infractions eight and nine, which were combined and evaporated todryness. HPLC-UV diode array detection was utilized to monitorhydrolysis, NBHA labeling, and purity of the SPE fractions usingHPLC conditions described above. The characterization of the5′-dRp-NBHA product was characterized by full scan productESI-MS spectra, both positive and negative ionization mode, andby NMR, which showed the presence ofE/Z isomers.
For completeness, control studies were conducted with dG,3′-dGMP, and commercial 5′-deoxyribose. Hydrolysis, NBHAlabeling, HPLC, and mass spectrometry monitoring were achievedin the same manner as that described above for the hydrolysisproduct of 5′-GMP (data not shown).
Synthesis of 5′,3′-Bis-phosphodeoxyguanosine (pdGp).Bariumcyanoethyl phosphate (1.4 g) was added to 150 mL of water andstirred. Barium cyanoethyl phosphate is only partially soluble inwater. Dissolution was optimized by alternating between sonicationand magnetic stirring for approximately 30 min. The solutionremained cloudy. A 1 cm × 20 cm glass column was filled withapproximately 10 mL of Dowex resin and washed with 5 resinvolumes of 1 M HCl and then rinsed with 5× resin volumes ofwater (the resin appeared brown). A 1 M concentration of pyridinewas passed through the column (5 resin volumes) until the resinwas yellowish. Next, the column was washed with 8× bed volumeusing high purity water to remove excess pyridine. Immediatelythereafter, the barium cyanoethyl phosphate solution was passedthrough the column at a rate of 1-2 mL/min, and the effluent wascollected into a 300 mL round-bottom flask. After evaporation ofthe effluent to an oily residue [bis(pyridinium)cyanoethyl phosphate]by rotoevaporation, further drying was accomplished by overnightdesiccation under vacuum until a final residue weight of ap-proximately 0.8 g was obtained. The amount ofN2-isobutyril-dGadded was calculated to be 1/5 equivalents of the bis(pyridinium)-cyanoethyl phosphate residue.N2-Isobutyryl-dG was dissolved in2.0 mL of anhydrous pyridine (pyridine saturated with molecularsieves). The amount of DCC used was calculated as 10 equiv ofN2-isobutyril-dG, e.g., 5 mol of bis(pyridinium)cyanoethyl phos-phate to 1 mol ofN2-isobutyryl-dG to 10 mol of DCC. The reactiontook place by adding theN2-isobutyril-dG solution to a 30 mLround-bottom flask that contained the bis(pyridinium)cyanoethylphosphate, followed by gentle stirring for 3 min. Next, DCC solidwas added, along with enough anhydrous pyridine to give a finalvolume of 10 mL. The solution remained turbid, as DCC is nothighly soluble in this milieu. The reaction was allowed to runovernight at room temperature with stirring. The reaction wasquenched by addition of 15 mL of water and stirring for 5 min.After vacuum filtration and washing the precipitate with 5 mL ofwater, the aqueous filtrate was evaporated to a final volume of 0.5mL. Deprotection of N2 and PO4 was accomplished with theaddition of 10 mL of 2 M NH4OH for 4-8 h in a hot water bathat 55-60 °C with stirring. Deprotection kinetics were monitoredby HPLC-UV diode array detection (see instrumentation detailsabove). The mobile phase components were 100 mM ammoniumacetate (pH 6.8) (A) and 100% methanol (B). Solvent B wasincreased from 0 to 50% B in 25 min, and to 100% B at 28 min,and then held at 100% B until 30 min. HPLC absorbance detectionwas accomplished at 256 nm. Under these conditions, deprotectedpdGp eluted nearly at the dead volume. Upon completion of thedeprotection step, ammonium hydroxide was removed by evapora-tion. The oily residue remaining was dissolved in a minimumvolume of water and purified by SPE.
The SPE procedure was accomplished by loading 0.3 mL of thedissolved product onto SPE cartridges (3 cc t-C18 SepPaks, Waters)preconditioned with 5 mL of methanol, followed by 5 mL of water.One milliliter fractions were collected using water as the SPEmobile phase. pdGp eluted in fraction 1 at approximately 95% purityas determined by HPLC-UV/vis and ESI-MS/MS. The final pdGpproduct was evaporated to dryness and stored at-80 °C.
Synthesis of 5′,3′-pdRp-NBHA. Prior to NBHA labeling ofpdGp, acid hydrolysis was performed to remove guanine. This wasachieved by dissolving the oily pdGp product in a minimum volume
302 Chem. Res. Toxicol., Vol. 19, No. 2, 2006 Roberts et al.
of water to which 0.5 M HCl was added at a 20:1 ratio, i.e., 20parts HCl to 1 part pdGp. Hydrolysis was carried out at 37°C for12 h or until hydrolysis was complete, as monitored by HPLC-UV. HPLC conditions were as follows: 50 mM NH4Ac (pH 6.8)(A) was held for 3 min with a linear gradient to 100% of 66%acetonitrile (B) in 10 min, returning to solvent A in 20 min. HPLC-UV absorbance was monitored at 274 nm. Upon complete hydroly-sis, a 10× mole excess of NBHA was added to the solution. Thelabeling was allowed to proceed for approximately 3 h at roomtemperature with stirring. Purification of the pdRp-NBHA productwas realized by semiprep-HPLC (Supleco, C18 10 mm× 250 mm)using a 2.0 mL injection volume, at a flow rate of 2.5 mL/minunder isocratic conditions. Characterization of 5′,3′-pdGp startingmaterial and the 5′,3′-pdRp-NBHA product was accomplished bynegative mode ESI-MS/MS.
AP Sites in a Single-Stranded Oligomer (11-mer) and NBHALabeling. AP sites can be “cleanly” prepared in synthetic oligomersthat contain uracil. The following is a modification of a previouslydescribed procedure for generation of AP sites in oligomers (26).Our adapted procedure involved enzymatic removal of uracil withuracil DNA glycosylase (UDG) from a single-stranded uracil-oligo(11-mer), with the sequence, 5′-GCCGT-U-AGGTA-3′. The parentmass of the oligo is 3358.2 g/mol. In short, the procedure used1.79 mg of single-stranded oligo in 400µL of UDG buffer (40mM HEPES, 70 mM NaCl, and 2 mM EDTA, pH 7.5). To theoligo solution was added 157µL of UDG at 2000 units/mL (1.7nmol oligomer:1 unit enzyme). After 1 h of incubation with slightagitation at 37°C, the reaction was quenched by placing theincubation tube on ice. Next, 533µL of NBHA in UDG bufferwas added, i.e., adding 10× stoichiometric excess NBHA. Monitor-ing of a uracil removal by UDG and subsequent labeling withNBHA at room temperature was accomplished by HPLC-UV,injecting 20µL, and detecting at 256 nm.
To monitor the reaction kinetics of uracil removal, HPLC-UVwas employed. Twenty microliters of the incubation mixture wasinjected, with detection at 256 nm. To provide suitable HPLCconditions that would not hamper ESI efficiency, we madeadaptations to a previously described procedure for oligomerseparations (26). The same LC-18-DB column as described abovewas used for the separations. A two-solvent gradient, 400 mMhexafluoro2-propanol (HFIP), pH adjusted to 7.0 with triethyamine(TEA) (A), and 800 mM HFIP, pH adjusted to 7.0 with TEA/100%methanol (1:1, v/v%) (B), was used for complete separation of theuracil oligomer, the AP oligomer product, and the NBHA-labeledAP oligomer. A linear gradient from 100% A to 100% B over 22min, and held at 100% B until 25 min, followed by return to 100%A at 27 min, was employed. For subsequent DNA digestion to thenucleotide level, the labeled oligo was HPLC purified and thenlyophilized to dryness.
MS showed the labeled oligo to be stable to this process (datanot shown). Final concentrations of the purified NBHA-AP oligowere determined by UV spectrometry, using the extinction coef-ficient of the parent oligo 108300 L/mol cm. The concentrationwas measured to be 0.48 mM, dissolved in 500µL of 5 mM BisTris,pH 7.1. Complete characterization of uracil oligomer, the AP oligo,and the NBHA-AP oligo was accomplished by negative modeESI-MS.
Generation of AP Sites in CT DNA and NBHA Labeling.AP sites were created under acidic conditions with adaptations ofpreviously described procedures (28). In our study, 5.0 mg of CTDNA was dissolved in 5.0 mL of 5.0 mM methoxyamine, whichwas in 10 mM Tris-HCl (pH 7.2 with KOH). Methoxyamine wasallowed to cap preexisting AP sites by incubation for 2 h at 37°C.After cooling on ice, 100µL of 5 M NaCl was added prior toprecipitation in 15 mL of cold ethanol, followed by washing theDNA pellet 3× with 15 mL of 70% ethanol. Further removal ofmethoxyamine was achieved by redissolving the washed pellet in5.0 mL of 10 mM Tris-HCl (pH 7.2 with KOH), addition of 100µL of 5 M NaCl, and reprecipitation in 15 mL of cold ethanol.Again, the DNA was washed 3× with 15 mL of 70% ethanol anddried under nitrogen.
For comparison to methoxyamine, sodium borohydride was alsoused to reduce the number of preexisting AP sites in CT DNAaccording to previously described methods (3). Stock solutions of0.1 mg/mL CT DNA were dissolved in deionized water anddialyzed overnight at 4°C against 10 mM sodium phosphate, pH11.5. The DNA solution was then treated with 0.1 M sodiumborohydride at room temperature for 2 h and neutralized with 0.05M HCl. Excess sodium borohydride was removed from the DNAby overnight dialysis against 10 mM sodium phosphate buffer (pH7.5) at 4°C. The DNA was then chilled on ice. A 100µL amountof 5 M NaCl was added, and the AP DNA precipitated with 15mL of cold ethanol. The AP DNA was then washed 3× with cold70% ethanol and dried under nitrogen.
The CT DNA was then resuspended in 5.0 mL of sodium citratebuffer (10 mM sodium citrate, 10 mM NaH2PO4, and 10 mM NaCl,pH 5.0) and incubated at 70°C for specific times to achieve desiredDNA damage levels (28). The reaction was stopped by rapid chillingon ice. A 100µL amount of 5 M NaCl was added, and the APDNA precipitated with 15 mL of cold ethanol. The AP DNA wasthen washed 3× with cold 70% ethanol and dried under nitrogen.
Labeling of AP DNA with NBHA was carried out by dissolvingthe AP DNA pellet in 2.5 mL of 10 mM Tris-HCl (pH 7.2 withKOH). Upon dissolution, 2.5 mL of 2 mM NBHA in 10 mM Tris-HCl (pH 7.2 with KOH) was added. The solution was thenincubated at 37°C for 1 h. Following incubation and chilling onice, 100µL of 5 M NaCl was added, and the labeled AP DNA wasprecipitated with 15 mL of cold ethanol. After washing the DNA3× with cold 70% ethanol, the pellet was dried with N2 andredissolved in 5.0 mL of 5.0 mM BisTris, pH 7.1. The final DNAconcentration was determined by UV spectrophotometry.
Enzyme Digestion of NBHA-Labeled AP DNA.Digestion ofthe labeled DNA to the nucleotide level was done with a threeenzyme system and using13C-dRp-NBHA as an internal standardfor quantification. The procedure was an adaptation of a previouslydescribed procedure for digestion of DNA adducted with chemicalcarcinogens (29). As an example assay, to 5.0 mL of a 1 mg/mL(5.0 mM BisTris, pH 7.1) solution from the labeling procedureabove were added 500µL of 100 mM MgCl2 and 30µL of 1.0µM 13C-dRp-NBHA, [M - H]- 368. To this solution, 50µL ofDNase I [10 mg/mL saline (in 0.9% NaCl)] was added, followedby incubation at 37°C for 1.5 h. Next, 75µL of Nuclease P1 (1mg/mL in 1 mM ZnCl2) was added, followed by incubation for 3h at 37°C. Finally, 4 units of PDase I (type II) (1 unit in 1.0 mLwater) was added, followed by incubation for 13 h. Upon comple-tion of incubation, the digestion mixture was chilled on ice andthen centrifuged at 4000 rpm for 10 min to remove excess proteinprior to evaporation to dryness. Isolation of the digested 5′-dRP-NBHA product was accomplished by SPE conditions describedabove for the standard. HPLC-UV or HPLC-MS/MS conditionsdescribed above for characterization of the standard were thenutilized to determine the presence and quantity of 5′-dRp-NBHAfrom the digest (see the Results section for further details).
Limit of Detection. Absolute detection limits for HPLC-MS/MS were established by isotope dilution quantification of theNBHA-labeled (and HPLC-purified) AP oligo described (seeabove). In a 15 mL conical tube, 29.4µL of 0.17 mg/mL oligosolution in 5 mM BisTris (pH 7.1) was added and diluted to 5.0mL with 1 mg/mL CT DNA (5 mM BisTris (pH 7.1) stock solution.This provided the equivalent of one AP site in 103 bases. A seriesof serial dilutions were performed with CT DNA stock solution toprovide AP sites to unmodified DNA base ratios of 1:104, 1:105,1:106, and 1:107. A control experiment was performed on the CTDNA stock solution where no NBHA-AP oligo was added. To5.0 mL of each of these solutions was added 30µL of 1.0 µM13C-dRp-NBHA, [M - H]- 368. This gave the equivalent of twoAP sites in 106 deoxyribonucleotides. Next, enzyme digestion wasperformed simultaneously on each dilution (and control) underdigestion procedures described above. After digestion, each dilutionwas processed by SPE and lyophilized to dryness. Prior to HPLC-MS/MS analysis, each sample was reconstituted in 900µL water/100 µL acetonitrile.
Apurinic/Apyrimidinic Lesions in DNA Chem. Res. Toxicol., Vol. 19, No. 2, 2006303
Results and Discussion
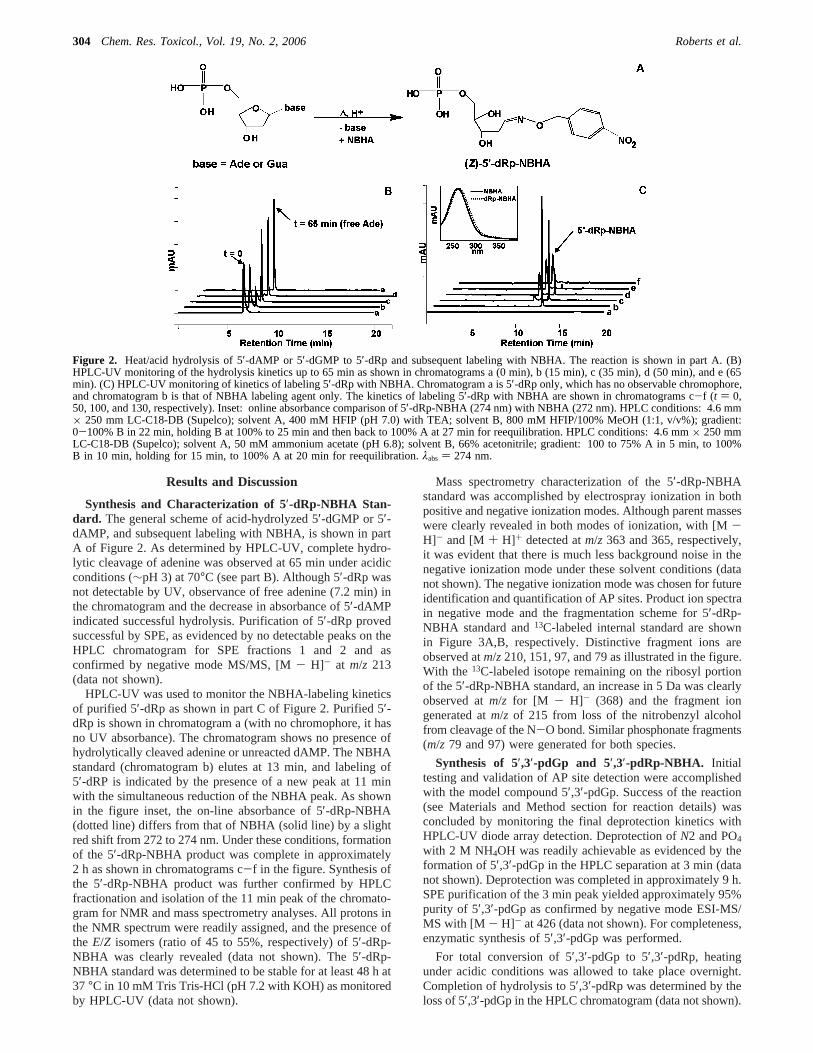
Synthesis and Characterization of 5′-dRp-NBHA Stan-dard. The general scheme of acid-hydrolyzed 5′-dGMP or 5′-dAMP, and subsequent labeling with NBHA, is shown in partA of Figure 2. As determined by HPLC-UV, complete hydro-lytic cleavage of adenine was observed at 65 min under acidicconditions (∼pH 3) at 70°C (see part B). Although 5′-dRp wasnot detectable by UV, observance of free adenine (7.2 min) inthe chromatogram and the decrease in absorbance of 5′-dAMPindicated successful hydrolysis. Purification of 5′-dRp provedsuccessful by SPE, as evidenced by no detectable peaks on theHPLC chromatogram for SPE fractions 1 and 2 and asconfirmed by negative mode MS/MS, [M- H]- at m/z 213(data not shown).
HPLC-UV was used to monitor the NBHA-labeling kineticsof purified 5′-dRp as shown in part C of Figure 2. Purified 5′-dRp is shown in chromatogram a (with no chromophore, it hasno UV absorbance). The chromatogram shows no presence ofhydrolytically cleaved adenine or unreacted dAMP. The NBHAstandard (chromatogram b) elutes at 13 min, and labeling of5′-dRP is indicated by the presence of a new peak at 11 minwith the simultaneous reduction of the NBHA peak. As shownin the figure inset, the on-line absorbance of 5′-dRp-NBHA(dotted line) differs from that of NBHA (solid line) by a slightred shift from 272 to 274 nm. Under these conditions, formationof the 5′-dRp-NBHA product was complete in approximately2 h as shown in chromatograms c-f in the figure. Synthesis ofthe 5′-dRp-NBHA product was further confirmed by HPLCfractionation and isolation of the 11 min peak of the chromato-gram for NMR and mass spectrometry analyses. All protons inthe NMR spectrum were readily assigned, and the presence ofthe E/Z isomers (ratio of 45 to 55%, respectively) of 5′-dRp-NBHA was clearly revealed (data not shown). The 5′-dRp-NBHA standard was determined to be stable for at least 48 h at37 °C in 10 mM Tris Tris-HCl (pH 7.2 with KOH) as monitoredby HPLC-UV (data not shown).
Mass spectrometry characterization of the 5′-dRp-NBHAstandard was accomplished by electrospray ionization in bothpositive and negative ionization modes. Although parent masseswere clearly revealed in both modes of ionization, with [M-H]- and [M + H]+ detected atm/z 363 and 365, respectively,it was evident that there is much less background noise in thenegative ionization mode under these solvent conditions (datanot shown). The negative ionization mode was chosen for futureidentification and quantification of AP sites. Product ion spectrain negative mode and the fragmentation scheme for 5′-dRp-NBHA standard and13C-labeled internal standard are shownin Figure 3A,B, respectively. Distinctive fragment ions areobserved atm/z210, 151, 97, and 79 as illustrated in the figure.With the 13C-labeled isotope remaining on the ribosyl portionof the 5′-dRp-NBHA standard, an increase in 5 Da was clearlyobserved atm/z for [M - H]- (368) and the fragment iongenerated atm/z of 215 from loss of the nitrobenzyl alcoholfrom cleavage of the N-O bond. Similar phosphonate fragments(m/z 79 and 97) were generated for both species.
Synthesis of 5′,3′-pdGp and 5′,3′-pdRp-NBHA. Initialtesting and validation of AP site detection were accomplishedwith the model compound 5′,3′-pdGp. Success of the reaction(see Materials and Method section for reaction details) wasconcluded by monitoring the final deprotection kinetics withHPLC-UV diode array detection. Deprotection ofN2 and PO4
with 2 M NH4OH was readily achievable as evidenced by theformation of 5′,3′-pdGp in the HPLC separation at 3 min (datanot shown). Deprotection was completed in approximately 9 h.SPE purification of the 3 min peak yielded approximately 95%purity of 5′,3′-pdGp as confirmed by negative mode ESI-MS/MS with [M - H]- at 426 (data not shown). For completeness,enzymatic synthesis of 5′,3′-pdGp was performed.
For total conversion of 5′,3′-pdGp to 5′,3′-pdRp, heatingunder acidic conditions was allowed to take place overnight.Completion of hydrolysis to 5′,3′-pdRp was determined by theloss of 5′,3′-pdGp in the HPLC chromatogram (data not shown).
Figure 2. Heat/acid hydrolysis of 5′-dAMP or 5′-dGMP to 5′-dRp and subsequent labeling with NBHA. The reaction is shown in part A. (B)HPLC-UV monitoring of the hydrolysis kinetics up to 65 min as shown in chromatograms a (0 min), b (15 min), c (35 min), d (50 min), and e (65min). (C) HPLC-UV monitoring of kinetics of labeling 5′-dRp with NBHA. Chromatogram a is 5′-dRp only, which has no observable chromophore,and chromatogram b is that of NBHA labeling agent only. The kinetics of labeling 5′-dRp with NBHA are shown in chromatograms c-f (t ) 0,50, 100, and 130, respectively). Inset: online absorbance comparison of 5′-dRp-NBHA (274 nm) with NBHA (272 nm). HPLC conditions: 4.6 mm× 250 mm LC-C18-DB (Supelco); solvent A, 400 mM HFIP (pH 7.0) with TEA; solvent B, 800 mM HFIP/100% MeOH (1:1, v/v%); gradient:0-100% B in 22 min, holding B at 100% to 25 min and then back to 100% A at 27 min for reequilibration. HPLC conditions: 4.6 mm× 250 mmLC-C18-DB (Supelco); solvent A, 50 mM ammonium acetate (pH 6.8); solvent B, 66% acetonitrile; gradient: 100 to 75% A in 5 min, to 100%B in 10 min, holding for 15 min, to 100% A at 20 min for reequilibration.λabs ) 274 nm.
304 Chem. Res. Toxicol., Vol. 19, No. 2, 2006 Roberts et al.
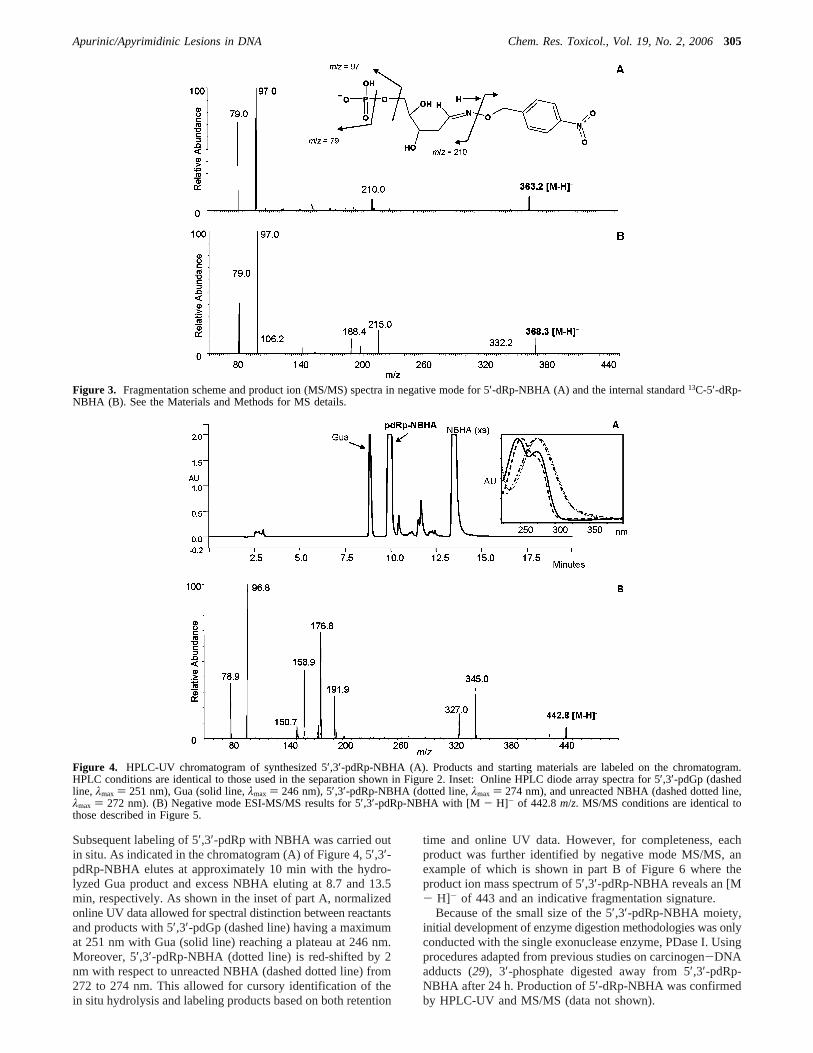
Subsequent labeling of 5′,3′-pdRp with NBHA was carried outin situ. As indicated in the chromatogram (A) of Figure 4, 5′,3′-pdRp-NBHA elutes at approximately 10 min with the hydro-lyzed Gua product and excess NBHA eluting at 8.7 and 13.5min, respectively. As shown in the inset of part A, normalizedonline UV data allowed for spectral distinction between reactantsand products with 5′,3′-pdGp (dashed line) having a maximumat 251 nm with Gua (solid line) reaching a plateau at 246 nm.Moreover, 5′,3′-pdRp-NBHA (dotted line) is red-shifted by 2nm with respect to unreacted NBHA (dashed dotted line) from272 to 274 nm. This allowed for cursory identification of thein situ hydrolysis and labeling products based on both retention
time and online UV data. However, for completeness, eachproduct was further identified by negative mode MS/MS, anexample of which is shown in part B of Figure 6 where theproduct ion mass spectrum of 5′,3′-pdRp-NBHA reveals an [M- H]- of 443 and an indicative fragmentation signature.
Because of the small size of the 5′,3′-pdRp-NBHA moiety,initial development of enzyme digestion methodologies was onlyconducted with the single exonuclease enzyme, PDase I. Usingprocedures adapted from previous studies on carcinogen-DNAadducts (29), 3′-phosphate digested away from 5′,3′-pdRp-NBHA after 24 h. Production of 5′-dRp-NBHA was confirmedby HPLC-UV and MS/MS (data not shown).
Figure 3. Fragmentation scheme and product ion (MS/MS) spectra in negative mode for 5′-dRp-NBHA (A) and the internal standard13C-5′-dRp-NBHA (B). See the Materials and Methods for MS details.
Figure 4. HPLC-UV chromatogram of synthesized 5′,3′-pdRp-NBHA (A). Products and starting materials are labeled on the chromatogram.HPLC conditions are identical to those used in the separation shown in Figure 2. Inset: Online HPLC diode array spectra for 5′,3′-pdGp (dashedline, λmax ) 251 nm), Gua (solid line,λmax ) 246 nm), 5′,3′-pdRp-NBHA (dotted line,λmax ) 274 nm), and unreacted NBHA (dashed dotted line,λmax ) 272 nm). (B) Negative mode ESI-MS/MS results for 5′,3′-pdRp-NBHA with [M - H]- of 442.8m/z. MS/MS conditions are identical tothose described in Figure 5.
Apurinic/Apyrimidinic Lesions in DNA Chem. Res. Toxicol., Vol. 19, No. 2, 2006305
Identification of AP Sites in a Single-Stranded Oligomer.With success using a model dimer AP DNA system, further
investigation into a slightly larger model system was undertaken.Enzymatic removal of uracil with uracil DNA glycosylase
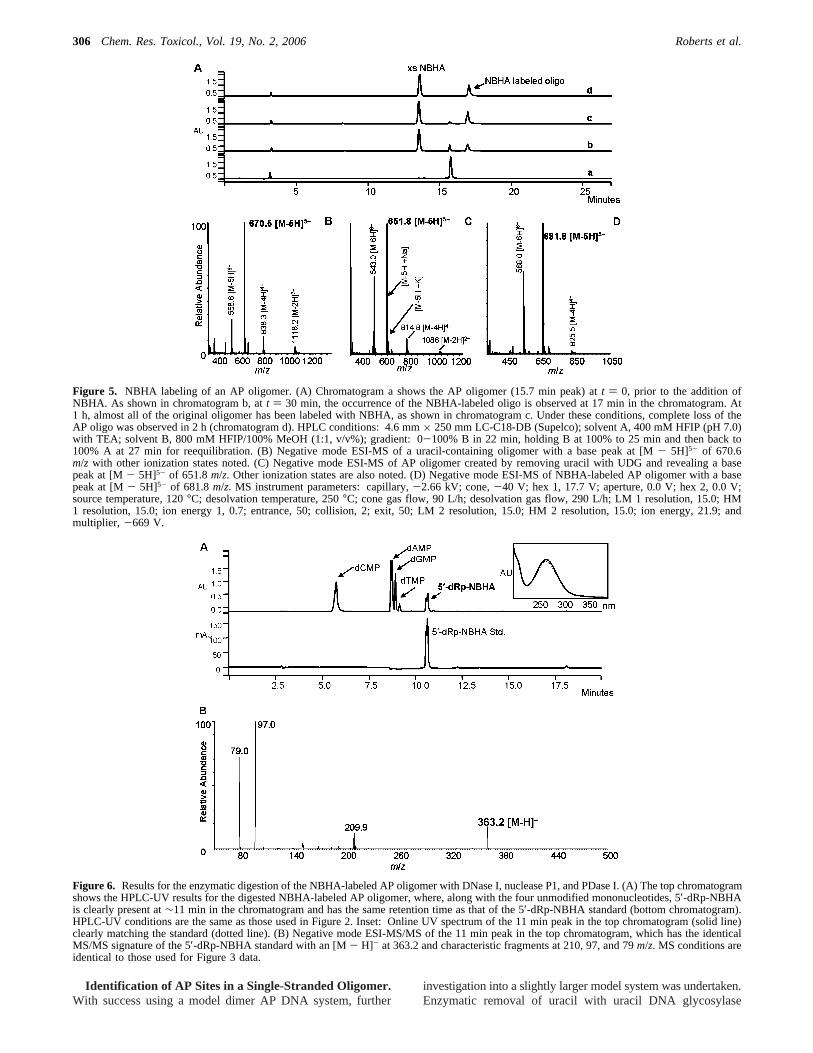
Figure 5. NBHA labeling of an AP oligomer. (A) Chromatogram a shows the AP oligomer (15.7 min peak) att ) 0, prior to the addition ofNBHA. As shown in chromatogram b, att ) 30 min, the occurrence of the NBHA-labeled oligo is observed at 17 min in the chromatogram. At1 h, almost all of the original oligomer has been labeled with NBHA, as shown in chromatogram c. Under these conditions, complete loss of theAP oligo was observed in 2 h (chromatogram d). HPLC conditions: 4.6 mm× 250 mm LC-C18-DB (Supelco); solvent A, 400 mM HFIP (pH 7.0)with TEA; solvent B, 800 mM HFIP/100% MeOH (1:1, v/v%); gradient: 0-100% B in 22 min, holding B at 100% to 25 min and then back to100% A at 27 min for reequilibration. (B) Negative mode ESI-MS of a uracil-containing oligomer with a base peak at [M- 5H]5- of 670.6m/z with other ionization states noted. (C) Negative mode ESI-MS of AP oligomer created by removing uracil with UDG and revealing a basepeak at [M- 5H]5- of 651.8m/z. Other ionization states are also noted. (D) Negative mode ESI-MS of NBHA-labeled AP oligomer with a basepeak at [M- 5H]5- of 681.8m/z. MS instrument parameters: capillary,-2.66 kV; cone,-40 V; hex 1, 17.7 V; aperture, 0.0 V; hex 2, 0.0 V;source temperature, 120°C; desolvation temperature, 250°C; cone gas flow, 90 L/h; desolvation gas flow, 290 L/h; LM 1 resolution, 15.0; HM1 resolution, 15.0; ion energy 1, 0.7; entrance, 50; collision, 2; exit, 50; LM 2 resolution, 15.0; HM 2 resolution, 15.0; ion energy, 21.9; andmultiplier, -669 V.
Figure 6. Results for the enzymatic digestion of the NBHA-labeled AP oligomer with DNase I, nuclease P1, and PDase I. (A) The top chromatogramshows the HPLC-UV results for the digested NBHA-labeled AP oligomer, where, along with the four unmodified mononucleotides, 5′-dRp-NBHAis clearly present at∼11 min in the chromatogram and has the same retention time as that of the 5′-dRp-NBHA standard (bottom chromatogram).HPLC-UV conditions are the same as those used in Figure 2. Inset: Online UV spectrum of the 11 min peak in the top chromatogram (solid line)clearly matching the standard (dotted line). (B) Negative mode ESI-MS/MS of the 11 min peak in the top chromatogram, which has the identicalMS/MS signature of the 5′-dRp-NBHA standard with an [M- H]- at 363.2 and characteristic fragments at 210, 97, and 79m/z. MS conditions areidentical to those used for Figure 3 data.
306 Chem. Res. Toxicol., Vol. 19, No. 2, 2006 Roberts et al.
(UDG) from a single-stranded uracil-oligo (11-mer), with thesequence 5′-GCCGT-U-AGGTA-3′ provided a defined sourceof an AP site within a sequence. Removal of uracil was completein less than 1 h using instructions provided by the manufacturer.As shown in Figure 5, MS was used to monitor the untreatedoligomer [M - 5H]5- at m/z 670.6 and following removal ofuracil, [M - 5H]5- at m/z 651.8, which matched exactly withthe calculated mass of the two oligomer species (3357.4 and3264.1 g/mol, respectively).
With an AP oligomer (5′-GCCGT-dR-AGGTA-3′) in place,NBHA labeling and enzymatic liberation of 5′-dRp-NBHAwere conducted and then monitored by HPLC-UV. As shownin part A of Figure 5, after 2 h under these conditions, labelingwas complete as evidenced by the loss of the AP oligomerchromatographic peak at 15.7 min and the formation of theNBHA-labeled AP oligomer peak at 17 min in the chromato-gram. Separation of the labeled and unlabeled oligomer wasafforded by utilizing HFIP and TEA as mobile phase additives.HFIP is purported to reduce the number of charged states onthe oligomer (30), while TEA aids in the chromatographicseparation of phosphate bearing molecules through an ion-pairing mechanism (31, 32). MS analysis of the HPLC-purifiedNBHA-AP oligomer product measured an [M- 5H]5- of 681.8,in agreement with the calculated value. MS results for the uracil-containing oligomer, AP oligomer, and the labeled AP oligomerare shown in Figure 5B-D, respectively.
Chromatographic results of the enzymatic digestion of theNBHA-labeled AP oligomer with DNase I (1.5 h), nuclease P1(3 h), and PDase I (10 h) are shown in Figure 6A. As shown,along with the four unmodified mononucleotides, 5′-dRp-NBHAis clearly present and has an identical retention time (11 min)to that of the 5′-dRp-NBHA standard. In addition, as shown inthe inset, the online UV spectrum (solid line) clearly matchesthat of the standard (dotted line), and MS/MS (part B) con-firms the identity of the 11 min peak as 5′-dRp-NBHA with an
[M - H]- at 365 and characteristic fragment ions atm/z 210,97, and 79.
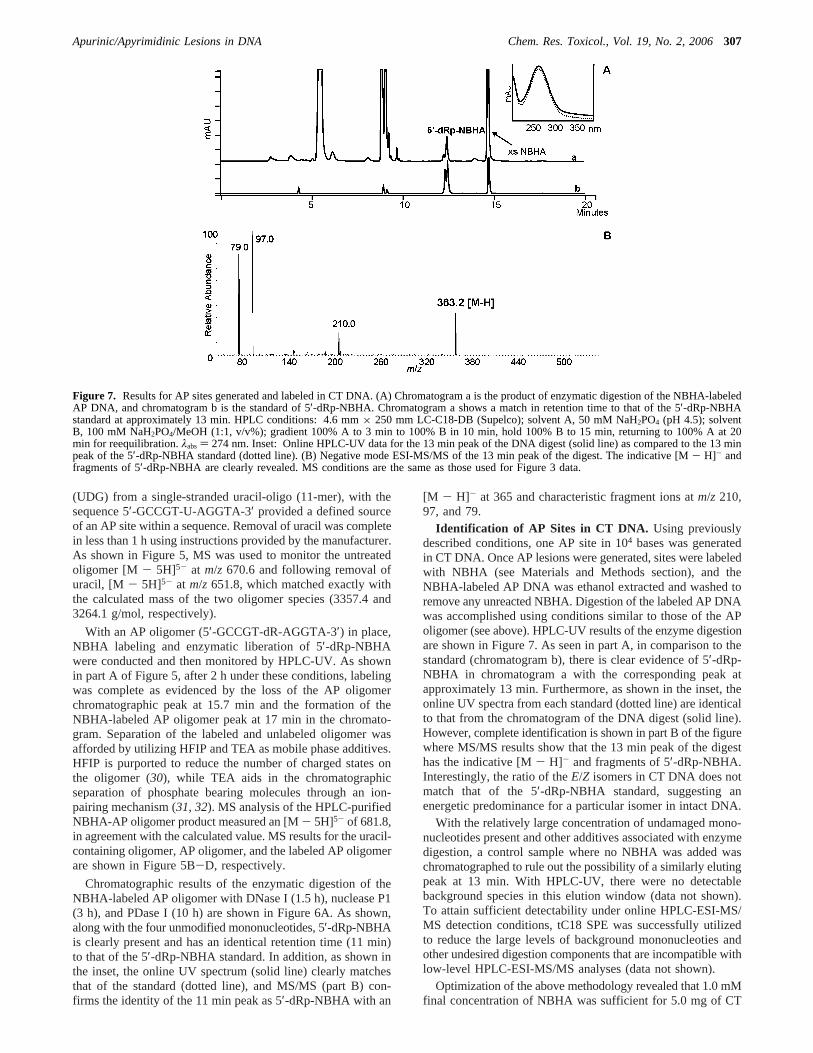
Identification of AP Sites in CT DNA. Using previouslydescribed conditions, one AP site in 104 bases was generatedin CT DNA. Once AP lesions were generated, sites were labeledwith NBHA (see Materials and Methods section), and theNBHA-labeled AP DNA was ethanol extracted and washed toremove any unreacted NBHA. Digestion of the labeled AP DNAwas accomplished using conditions similar to those of the APoligomer (see above). HPLC-UV results of the enzyme digestionare shown in Figure 7. As seen in part A, in comparison to thestandard (chromatogram b), there is clear evidence of 5′-dRp-NBHA in chromatogram a with the corresponding peak atapproximately 13 min. Furthermore, as shown in the inset, theonline UV spectra from each standard (dotted line) are identicalto that from the chromatogram of the DNA digest (solid line).However, complete identification is shown in part B of the figurewhere MS/MS results show that the 13 min peak of the digesthas the indicative [M- H]- and fragments of 5′-dRp-NBHA.Interestingly, the ratio of theE/Z isomers in CT DNA does notmatch that of the 5′-dRp-NBHA standard, suggesting anenergetic predominance for a particular isomer in intact DNA.
With the relatively large concentration of undamaged mono-nucleotides present and other additives associated with enzymedigestion, a control sample where no NBHA was added waschromatographed to rule out the possibility of a similarly elutingpeak at 13 min. With HPLC-UV, there were no detectablebackground species in this elution window (data not shown).To attain sufficient detectability under online HPLC-ESI-MS/MS detection conditions, tC18 SPE was successfully utilizedto reduce the large levels of background mononucleoties andother undesired digestion components that are incompatible withlow-level HPLC-ESI-MS/MS analyses (data not shown).
Optimization of the above methodology revealed that 1.0 mMfinal concentration of NBHA was sufficient for 5.0 mg of CT
Figure 7. Results for AP sites generated and labeled in CT DNA. (A) Chromatogram a is the product of enzymatic digestion of the NBHA-labeledAP DNA, and chromatogram b is the standard of 5′-dRp-NBHA. Chromatogram a shows a match in retention time to that of the 5′-dRp-NBHAstandard at approximately 13 min. HPLC conditions: 4.6 mm× 250 mm LC-C18-DB (Supelco); solvent A, 50 mM NaH2PO4 (pH 4.5); solventB, 100 mM NaH2PO4/MeOH (1:1, v/v%); gradient 100% A to 3 min to 100% B in 10 min, hold 100% B to 15 min, returning to 100% A at 20min for reequilibration.λabs) 274 nm. Inset: Online HPLC-UV data for the 13 min peak of the DNA digest (solid line) as compared to the 13 minpeak of the 5′-dRp-NBHA standard (dotted line). (B) Negative mode ESI-MS/MS of the 13 min peak of the digest. The indicative [M- H]- andfragments of 5′-dRp-NBHA are clearly revealed. MS conditions are the same as those used for Figure 3 data.
Apurinic/Apyrimidinic Lesions in DNA Chem. Res. Toxicol., Vol. 19, No. 2, 2006307
DNA and that labeling of AP sites was complete within 30 minwhen incubated at 37°C. In addition, it was evidenced thatoptimal recovery of 5′-dRp-NBHA was achieved under theseconditions (e.g., 5.0 mg of DNA) when the PDase I concentra-tion was increased by a factor of 10, from 0.4 units previouslyreported (29), to 4.0 units. This is likely due to the refractorynature of the 5′-dRp-NBHA subunit within the DNA structure.Moreover, increasing the PDase I digestion period from 10 to13 h further maximized the release of 5′-dRp-NBHA, althoughno increase was observed beyond 13 h. In addition, 5′-dRp-NBHA demonstrated no degradation under these conditionswhen digestions were carried out to 24 h (data not shown).
5′-dRp-NBHA Limit of Detection. In studies using com-mercial CT DNA starting material (5.0 mg), the backgroundlevel of AP sites detected in negative control samples (DNApretreated with methoxyamine or NaBH4 to mask preexistingAP sites) was two AP sites in 106 bases by HPLC-ESI-MS/MSusing 13C-5′-dRp-NBHA as the internal standard (data notshown). This background level of AP sites could be attributedto a variety of sources including ethanol precipitation/washingsteps used for removing the pretreatment agents, dissolvedoxygen in the reaction milieu, or from water hydrolysis duringthe 30 min of incubation with NBHA at 37°C. Attempts togenerate controls of commercial DNA with absolute zero levelsof AP sites were unsuccessful.
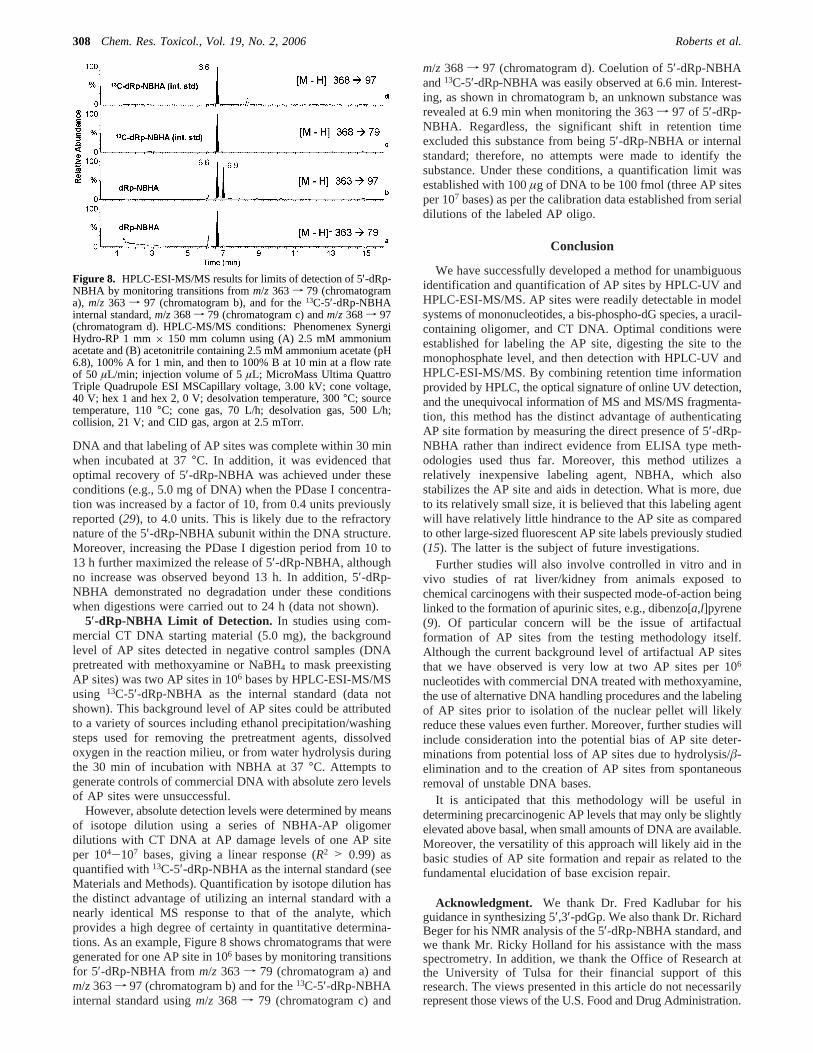
However, absolute detection levels were determined by meansof isotope dilution using a series of NBHA-AP oligomerdilutions with CT DNA at AP damage levels of one AP siteper 104-107 bases, giving a linear response (R2 > 0.99) asquantified with13C-5′-dRp-NBHA as the internal standard (seeMaterials and Methods). Quantification by isotope dilution hasthe distinct advantage of utilizing an internal standard with anearly identical MS response to that of the analyte, whichprovides a high degree of certainty in quantitative determina-tions. As an example, Figure 8 shows chromatograms that weregenerated for one AP site in 106 bases by monitoring transitionsfor 5′-dRp-NBHA from m/z 363 f 79 (chromatogram a) andm/z363f 97 (chromatogram b) and for the13C-5′-dRp-NBHAinternal standard usingm/z 368 f 79 (chromatogram c) and
m/z 368 f 97 (chromatogram d). Coelution of 5′-dRp-NBHAand13C-5′-dRp-NBHA was easily observed at 6.6 min. Interest-ing, as shown in chromatogram b, an unknown substance wasrevealed at 6.9 min when monitoring the 363f 97 of 5′-dRp-NBHA. Regardless, the significant shift in retention timeexcluded this substance from being 5′-dRp-NBHA or internalstandard; therefore, no attempts were made to identify thesubstance. Under these conditions, a quantification limit wasestablished with 100µg of DNA to be 100 fmol (three AP sitesper 107 bases) as per the calibration data established from serialdilutions of the labeled AP oligo.
Conclusion
We have successfully developed a method for unambiguousidentification and quantification of AP sites by HPLC-UV andHPLC-ESI-MS/MS. AP sites were readily detectable in modelsystems of mononucleotides, a bis-phospho-dG species, a uracil-containing oligomer, and CT DNA. Optimal conditions wereestablished for labeling the AP site, digesting the site to themonophosphate level, and then detection with HPLC-UV andHPLC-ESI-MS/MS. By combining retention time informationprovided by HPLC, the optical signature of online UV detection,and the unequivocal information of MS and MS/MS fragmenta-tion, this method has the distinct advantage of authenticatingAP site formation by measuring the direct presence of 5′-dRp-NBHA rather than indirect evidence from ELISA type meth-odologies used thus far. Moreover, this method utilizes arelatively inexpensive labeling agent, NBHA, which alsostabilizes the AP site and aids in detection. What is more, dueto its relatively small size, it is believed that this labeling agentwill have relatively little hindrance to the AP site as comparedto other large-sized fluorescent AP site labels previously studied(15). The latter is the subject of future investigations.
Further studies will also involve controlled in vitro and invivo studies of rat liver/kidney from animals exposed tochemical carcinogens with their suspected mode-of-action beinglinked to the formation of apurinic sites, e.g., dibenzo[a,l]pyrene(9). Of particular concern will be the issue of artifactualformation of AP sites from the testing methodology itself.Although the current background level of artifactual AP sitesthat we have observed is very low at two AP sites per 106
nucleotides with commercial DNA treated with methoxyamine,the use of alternative DNA handling procedures and the labelingof AP sites prior to isolation of the nuclear pellet will likelyreduce these values even further. Moreover, further studies willinclude consideration into the potential bias of AP site deter-minations from potential loss of AP sites due to hydrolysis/â-elimination and to the creation of AP sites from spontaneousremoval of unstable DNA bases.
It is anticipated that this methodology will be useful indetermining precarcinogenic AP levels that may only be slightlyelevated above basal, when small amounts of DNA are available.Moreover, the versatility of this approach will likely aid in thebasic studies of AP site formation and repair as related to thefundamental elucidation of base excision repair.
Acknowledgment. We thank Dr. Fred Kadlubar for hisguidance in synthesizing 5′,3′-pdGp. We also thank Dr. RichardBeger for his NMR analysis of the 5′-dRp-NBHA standard, andwe thank Mr. Ricky Holland for his assistance with the massspectrometry. In addition, we thank the Office of Research atthe University of Tulsa for their financial support of thisresearch. The views presented in this article do not necessarilyrepresent those views of the U.S. Food and Drug Administration.
Figure 8. HPLC-ESI-MS/MS results for limits of detection of 5′-dRp-NBHA by monitoring transitions fromm/z 363 f 79 (chromatograma), m/z 363 f 97 (chromatogram b), and for the13C-5′-dRp-NBHAinternal standard,m/z 368f 79 (chromatogram c) andm/z 368f 97(chromatogram d). HPLC-MS/MS conditions: Phenomenex SynergiHydro-RP 1 mm× 150 mm column using (A) 2.5 mM ammoniumacetate and (B) acetonitrile containing 2.5 mM ammonium acetate (pH6.8), 100% A for 1 min, and then to 100% B at 10 min at a flow rateof 50 µL/min; injection volume of 5µL; MicroMass Ultima QuattroTriple Quadrupole ESI MSCapillary voltage, 3.00 kV; cone voltage,40 V; hex 1 and hex 2, 0 V; desolvation temperature, 300°C; sourcetemperature, 110°C; cone gas, 70 L/h; desolvation gas, 500 L/h;collision, 21 V; and CID gas, argon at 2.5 mTorr.
308 Chem. Res. Toxicol., Vol. 19, No. 2, 2006 Roberts et al.
References
(1) Loeb, L. A., and Preston, B. D. (1986) Mutagenesis by apurinic/apyrimidinic sites.Annu. ReV. Genet. 20, 201-230.
(2) Lindahl, T. (1990) Repair of intrinsic DNA lesions.Mutat. Res. 238,305-311.
(3) Kow, Y. W., and Dare, A. (2000) Detection of abasic sites andoxidative DNA base damage using an ELISA- like assay.Methods(San Diego, CA, U.S.) 22, 164-169.
(4) Kunkel, T. A., Schaaper, R. M., James, E., and Loeb, L. A. (1983)Infidelity of DNA replication as a basis of mutagenesis.Basic LifeSci. 23, 63-82.
(5) Helbock, H. J., Beckman, K. B., Shigenaga, M. K., Walter, P. B.,Woodall, A. A., Yeo, H. C., and Ames, B. N. (1998) DNA oxidationmatters: The HPLC-electrochemical detection assay of 8-oxo-deoxy-guanosine and 8-oxo-guanine.Proc. Natl. Acad. Sci. U.S.A. 95, 288-293.
(6) Nakamura, J., and Swenberg, J. A. (1999) Endogenous apurinic/apyrimidinic sites in genomic DNA of mammalian tissues.CancerRes. 59, 2522-2526.
(7) Devanesan, P. D., RamaKrishna, N. V., Padmavathi, N. S., Higgin-botham, S., Rogan, E. G., Cavalieri, E. L., Marsch, G. A., Jankowiak,R., and Small, G. J. (1993) Identification and quantitation of 7,12-dimethylbenz[a]anthracene-DNA adducts formed in mouse skin.Chem.Res. Toxicol. 6, 364-371.
(8) Chakravarti, D., Mailander, P. C., Li, K.-M., Higginbotham, S., Zhang,H. L., Gross, M. L., Meza, J. L., Cavalieri, E. L., and Rogan, E. G.(2001) Evidence that a burst of DNA depurination in SENCAR mouseskin induces error-prone repair and forms mutations in the H-ras gene.Oncogene 20, 7945-7953.
(9) Chakravarti, D., Mailander, P. C., Cavalieri, E. L., and Rogan, E. G.(2000) Evidence that error-prone DNA repair converts dibenzo[a,l]-pyrene-induced depurinating lesions into mutations: formation, clonalproliferation and regression of initiated cells carrying H-ras oncogenemutations in early preneoplasia.Mutat. Res. 456, 17-32.
(10) Coombs, M. M., and Livingston, D. C. (1969) Reaction of apurinicacid with aldehyde reagents.Biochim. Biophys. Acta 174, 161-173.
(11) Talpaert-Borle, M., and Liuzzi, M. (1983) Reaction of apurinic/apyrimidinic sites with [14C]methoxyamine. A method for thequantitative assay of AP sites in DNA.Biochim. Biophys. Acta 740,410-416.
(12) Zhou, X., Liberman, R. G., Skipper, P. L., Margolin, Y., Tannenbaum,S. R., and Dedon, P. C. (2005) Quantification of DNA strand breaksand abasic sites by oxime derivatization and accelerator massspectrometry: Application toγ-radiation and peroxynitrite.Anal.Biochem. 343, 84-92.
(13) Weinfeld, M., Liuzzi, M., and Paterson, M. C. (1990) Response ofphage T4 polynucleotide kinase toward dinucleotides containingapurinic sites: Design of a 32P-postlabeling assay for apurinic sitesin DNA. Biochemistry 29, 1737-1743.
(14) Fkyerat, A., Demeunynck, M., Constant, J. F., Michon, P., andLhomme, J. (1993) A new class of artificial nucleases that recognizeand cleave apurinic sites in DNA with great selectivity and efficiency.J. Am. Chem. Soc. 115, 9952-9959.
(15) Boturyn, D., Constant, J. F., Defrancq, E., Lhomme, J., Barbin, A.,and Wild, C. P. (1999) A simple and sensitive method for in vitroquantitation of abasic sites in DNA.Chem. Res. Toxicol. 12, 476-482.
(16) Chen, B. X., Kubo, K., Ide, H., Erlanger, B. F., Wallace, S. S., andKow, Y. W. (1992) Properties of a monoclonal antibody for thedetection of abasic sites, a common DNA lesion.Mutat. Res. 273,253-261.
(17) Sun, H. B., Qian, L., and Yokota, H. (2001) Detection of abasic siteson individual DNA molecules using atomic force microscopy.Anal.Chem. 73, 2229-2232.
(18) Nakamura, J., Walker, V. E., Upton, P. B., Chiang, S. Y., Kow, Y.W., and Swenberg, J. A. (1998) Highly sensitive apurinic/apyrimidinicsite assay can detect spontaneous and chemically induced depurinationunder physiological conditions.Cancer Res. 58, 222.
(19) Nakamura, J., La, D. K., and Swenberg, J. A. (2000) 5′-nicked apurinic/apyrimidinic sites are resistant to beta-elimination by beta-polymeraseand are persistent in human cultured cells after oxidative stress.J.Biol. Chem. 275, 5323-5328.
(20) Atamna, H., Cheung, I., and Ames, B. N. (2000) A method fordetecting abasic sites in living cells: Age-dependent changes in baseexcision repair.Proc. Natl. Acad. Sci. U.S.A. 97, 686-691.
(21) Lin, P. H., Nakamura, J., Yamaguchi, S., La, D. K., Upton, P. B., andSwenberg, J. A. (2001) Induction of direct adducts, apurinic/apyri-midinic sites and oxidized bases in nuclear DNA of human HeLaS3 tumor cells by tetrachlorohydroquinone.Carcinogenesis 22, 635-639.
(22) Lin, P. H., Nakamura, J., Yamaguchi, S., Upton, P. B., La, D. K., andSwenberg, J. A. (2001) Oxidative damage and direct adducts in calfthymus DNA induced by the pentachlorophenol metabolites, tetra-chlorohydroquinone and tetrachloro- 1,4-benzoquinone.Carcinogenesis22, 627-634.
(23) Jeong, Y.-C., Sangaiah, R., Nakamura, J., Pachkowski, B. F., Ranas-inghe, A., Gold, A., Ball, L. M., and Swenberg, J. A. (2005) Analysisof M1G-dR in DNA by aldehyde reactive probe labeling and liquidchromatography tandem mass spectrometry.Chem. Res. Toxicol. 18,51-60.
(24) Malvy, C., Lefrancois, M., Bertrand, J. R., and Markovits, J. (2000)Modified alkaline elution allows the measurement of intact apurinicsites in mammalian genomic DNA.Biochimie 82, 717-721.
(25) Beger, R. D., and Bolton, P. H. (1998) Structures of apurinic andapyrimidinic sites in duplex DNAs.J. Biol. Chem. 273, 15565-15573.
(26) Goljer, I., Kumar, S., and Bolton, P. H. (1995) Refined solutionstructure of a DNA heteroduplex containing an aldehydic abasic site.J. Biol. Chem. 270, 22980-22987.
(27) Goljer, I., Withka, J. M., Kao, J. Y., and Bolton, P. H. (1992) Effectsof the presence of an aldehydic abasic site on the thermal stabilityand rates of helix opening and closing of duplex DNA.Biochemistry31, 11614-11619.
(28) Kubo, K., Ide, H., Wallace, S. S., and Kow, Y. W. (1992) A novel,sensitive, and specific assay for abasic sites, the most commonlyproduced DNA lesion.Biochemistry 31, 3703-3708.
(29) Lin, D., Kaderlik, K. R., Turesky, R. J., Miller, D. W., Lay, J. O., Jr.,and Kadlubar, F. F. (1992) Identification of N-(deoxyguanosin-8-yl)-2-amino-1-methyl-6-phenylimidazo[4,5-b]pyridine as the major adductformed by the food-borne carcinogen, 2-amino-1-methyl-6-phenylimi-dazo[4,5-b]pyridine, with DNA.Chem. Res. Toxicol. 5, 691-697.
(30) Apffel, A., Chakel, J. A., Fischer, S., Lichtenwalter, K., and Hancock,W. S. (1997) New procedure for the use of high-performance liquidchromatography-electrospray ionization mass spectrometry for theanalysis of nucleotides and oligonucleotides.J. Chromatogr. A 777,3-21.
(31) Witters, E., Roef, L., Newton, R. P., Van Dongen, W., Esmans, E.L., and Van Onckelen, H. A. (1996) Quantitation of cyclic nucleotidesin biological samples by negative electrospray tandem mass spec-trometry coupled to ion suppression liquid chromatography.RapidCommun. Mass Spectrom. 10, 225-231.
(32) Potier, N., Van Dorsselaer, A., Cordier, Y., Roch, O., and Bischoff,R. (1994) Negative electrospray ionization mass spectrometry ofsynthetic and chemically modified oligonucleotides.Nucleic Acids Res.22, 3895-3903.
TX0502589
Apurinic/Apyrimidinic Lesions in DNA Chem. Res. Toxicol., Vol. 19, No. 2, 2006309