determination of causal genetic variants involves vitamin dhera.ugr.es/tesisugr/25501598.pdf · gen...
TRANSCRIPT

The
gene
determi
es CYP27
Dr. Anton
ination o
7B1 and
SP
nio Alcina
Instit
of causal
VDR, an
P140, in
Moha
D
Madueño
tuto de Par
"López
Universi
Grana
l genetic
nd the in
Multiple
amad Kar
Directores
Dra
rasitología y
- Neyra"-
idad de Gr
da, October 2
c variant
nnate an
e Scleros
raky
a. Fuencisla
y Biomedic
CSIC
ranada
2015
ts involv
ntiviral r
sis.
a Matesanz
cina
ves vitam
response
del Barrio
min D
gene
o

Editor: Universidad de Granada.Tesis Doctorales Autor: Mohamad Karaky ISBN: 978-84-9125-315-0 URI: http://hdl.handle.net/10481/41017
INDEX
Abbreviations 4
Resumen 8
Introduction 12
Multiple sclerosis definition and history 13
Types of MS 13
Symptoms and Diagnostic 14
Pathology and treatment of MS 15 The immune system and MS 15 MS treatments 19
Environmental Factors in MS etiology 20 Infectious causes of MS 20 Vitamin D and MS risk 23 Tobacco smoke 31 Epigenetic consequences 31
MS Genetics 32 Genome investigation tools and methods 33 Genome Wide Association Studies (GWASs) of MS 34 MS genetic studies based on ImmunoChip 35 MS associated loci 39 eQTLs in GWAS analysis 40
Objectives and justification 44
Materials and Methods 45
Samples collection 46
Monocyte separation 46
LCLs culture 46
Cell stimulation 46
RNA extraction 46
Genotyping 47
PCR 47
Exon‐Trapping analysis 48
Statistical analysis 48
Results 49
Determination of the causal gene in the 12q13‐14 locus responsible for the association with MS 50
The MS‐GWAS associated variants correlate with the expression of several genes in the locus 50 Determination of the effect of the MS‐associated variant on the CYP27B1 expression 52
Effect of the genetic variants on the VDR expression 54
The effect of the genetic variants on the CYP24A1 expression 55

Genes correlation 57
Determination of MS/GWAS‐associated variants that are eQTLs from LCLs of European origin 57 Determination of the causal gene responsible for the association with MS in the 2q37.1 locus 59 Determination of eQTLs in the 2q37.1 locus 59 Colocalization of best‐GWAS variants and best‐eQTLs 60 Changes in the RNA isoform profile associated with disease 61 rs28445040 as a functional variant affecting the exon 7‐skipped RNA isoform 63 Confirmation of the genetic association by a case‐control study 64 SP140 in CD14 and LCLs 66 SP140 and Vitamin D 67
Determination of the causal gene responsible for the association with MS in the 12 p13.31 locus 67
Determination of eQTLs in the chr12 p13.31 locus 68 Colocalization of best‐GWAS variants and best‐eQTLs 69 Changes in the RNA isoform profile associated with disease 73 Analysis of the genetic association by a case‐control study 74
Discussion 77
MS and Vitamin D genes expression: CYP27B1, VDR and CYP24A1 78
MS and innate antiviral response: the SP140 gene in CLL, CD and MS 82
CLEC2D in MS 84
Conclusions 86
References 88

4
Abbreviations

5
1,25(OH)2D 1-alpha,25-dihydroxivytamin D3 , calcitriol
25(OH)D 25-hydroxyvitamin D3, calcifediol
ACB African Caribbeans in Barbados
AFR African
AI Autoimmune
AMR Ad Mixed American
APC Antigen representative cell
ASW Americans of African Ancestry in SW USA
BEB Bengali from Bangladesh
BM Bone marrow
CD Crohn's disease
CDX Chinese Dai in Xishuangbanna, China
CEU
Utah Residents (CEPH) with Northern and Western European Ancestry
CHB Han Chinese in Bejing, China
CHS Southern Han Chinese
CLL Chronic lymphocytic leukemia
CLM Colombians from Medellin, Colombia
CNS Central nervous system
CYP24A1 Cytochrome P450 monooxygenase
CYP27B1 Cytochrome P450 enzyme, 1a-hydroxylase
CYP2R1 Cytochrome P450 vitamin D 25 hydroxylase
DC Dendritic cell
EAE Experimental autoimmune encephalomyelitis
EAS East Asian
EBV Epstein–Barr Virus
eQTL Expression quantitative trait loci
ESN Esan in Nigeria
EUR European
FGF Fibroblast growth factor
FIN Finnish in Finland
GBR British in England and Scotland

6
GEUVADIS Genetic European variation in health and disease
GIH Gujarati Indian from Houston, Texas
GTEx Genotype-tissue expression
GWAS Genome wide association studies
GWD Gambian in Western Divisions in the Gambia
HHV Human herpesvirus
HLA Human leukocyte antigen
HTLV Human T-lymphotropic virus
IBD Inflammatory bowel disease
IBS Iberian Population in Spain
IFN Interferon
IL Interleukin
Indels Insertion or the deletion of bases
ITU Indian Telugu from the UK
JCV John Cunningham virus
JPT Japanese in Tokyo, Japan
Kb Kilo base pairs
KHV Kinh in Ho Chi Minh City, Vietnam
LCL Lymphoblastoid cell line
LD Linkage disequilibrium
LLT Lectin-like transcript
LPS Lipopolysaccharide
LWK Luhya in Webuye, Kenya
MAF Minor allele frequency
Mb Mega base pairs
MBP Myelin basic protein
MHC Major histocompatibility complex
MOG Myelin oligodendrocyte glycoprotein
MRI Magnetic resonance imaging
MS Multiple sclerosis
MSC Mesenchymal stem cell
MSL Mende in Sierra Leone

7
MXL Mexican Ancestry from Los Angeles USA
PBMC Peripheral blood mononuclear cells
PEL Peruvians from Lima, Peru
PJL Punjabi from Lahore, Pakistan
PLP Myelin proteolipid protein
PML Progressive multifocal leukoencephalopathy
PPMS Primary progressive multiple sclerosis
PRMS Progressive-relapsing multiple sclerosis
PTH parathyroid hormone
PUR Puerto Ricans from Puerto Rico
RA Rheumatoid arthritis
RRMS Relapsing–remitting multiple sclerosis
RXR Retinoid X receptor
SAS South Asian
SLE Systemic lupus erythematosus
SNP Single nucleotide polymorphisms
SPMS Secondary-progressive multiple sclerosis
SS Systemic scleroderma
STU Sri Lankan Tamil from the UK
T1D Type 1 diabetes
TNF Tumour necrosis factor
Treg Regulatory T cell
TSI Toscani in Italia
TTV Torque teno virus
VDR 1,25-Dihydroxyvitamin D3 receptor
VDRE Vitamin D response element
VZV Varicella–zoster virus
YRI Yoruba in Ibadan, Nigeria

8
Resumen

9
Antecedentes
La esclerosis múltiple (EM) es una enfermedad autoinmune que afecta al sistema nervioso central (SNC): el cerebro y la médula espinal, y que cursa principalmente con desmielinización neuronal. Como consecuencia, la capacidad de los nervios de transmitir los impulsos eléctricos desde el cerebro y al cerebro, se interrumpe y produce la aparición de los diferentes síntomas que aparecen y remiten, denominados “brotes”, o que progresan lentamente a lo largo del tiempo.
La Esclerosis Múltiple, como enfermedad compleja, está caracterizada por una moderada heredabilidad y por la interacción de factores genéticos y ambientales. La variabilidad genética es un determinante importante en la susceptibilidad y progresión de la Esclerosis Múltiple.
Recientemente han surgido nuevas tecnologías de estudios: los Estudios de Asociación del Genoma Completo (GWAS) que se basan en el análisis de variantes a lo largo de todo el genoma en grandes poblaciones y sin una hipótesis establecida. De este modo se buscan loci asociados a la enfermedad sin establecer una determinada función en la patología de la misma. Por medio de los GWAS se han determinado alrededor de 100 loci asociados a la susceptibilidad a padecer EM aunque en su mayoría se desconoce el gen causal de esta asociación y el efecto de la variante génica sobre la función de este gen que en último término es la causa de la asociación genética.
Objetivo
El principal objetivo de este trabajo es la determinación de las variantes causales de los loci asociados con la EM por estudios GWAS y revelar, por el análisis del efecto funcional de la variante causal, los genes implicados y su efecto en la enfermedad.
Metodología
En este trabajo hemos estudiado 4 loci que se han visto asociados a EM. Hemos analizado la correlación de los niveles de expresión de los distintos genes de los loci con las variantes de la región asociadas con EM. Para ello hemos empleado datos de expresión procedente de RNA-Seq de líneas linfoblastoides de población europea del proyecto GEUVADIS y GTEx y análisis de expresión por sistemas de cuantificación por qPCR a tiempo real con muestras de RNA de monocitos, con distintos tratamientos, de 109 individuos recogidos en el Biobanco de Andalucía. Hemos hechos estudios funcionales para identificar las variantes que afectan el splacing de genes y que se asocian con la enfermedad y hemos hecho estudios caso-control en una cohorte española de 4000 enfermos y 4000 controles para validar la asociación con la enfermedad de las variantes funcionales identificadas aquí frente a las descritas por el GWAS.

10
Resultados
La expresión del gen CYP27B1, enzima activadora de la vitamina D, en monocitos activados con LPS y IFNγ correlaciona con los genotipos del SNP rs10877013 que es la variante causal de la asociación con MS en el locus 12q13-14. Esta correlación no se observa en otro tipo celular como es las células LCLs en las que no se produce activación de la expresión del gen con LPS e IFNγ o vitamina D. La expresión del gen VDR, receptor de la vitamina D, que se localiza a 10Mb del gen CYP27B1 SNP también correlaciona con la variante rs10877013 en células LCL tratadas con vitamina D. En ambos casos el alelo de riesgo a EM se asocia con una baja expresión de los genes.
La variante rs2248359 que se ha visto asociada con EM en el locus 20q13.2 se localiza a 1 Kb del gen CYP24A1, enzima que degrada la vitamina D. Hemos determinado que este gen se expresa de forma inducible tras la activación con la forma activa de la vitamina D (1,25(OH)2D3), sin embargo no detectamos una correlación entre los niveles de expresión de este gen y los genotipos de la variante asociada a EM ni con otra localizada en la región.
Nuestros resultados indican que la desregulación en el splicing del gen SP140 es la causa de la asociación genética del locus 2q37.1 con EM. El alelo T del SNP rs28445040 que se asocia con aumento de riesgo de EM correlaciona con la aparición de un transcrito que no lleva el exón 7 y con una disminución del transcrito completo. La variante rs28445040 se localiza en el exón 7 y por análisis de minigén hemos demostrado que es la causa del splicing alternativo del exón 7. Con estudios caso-control en una cohorte española de 4000 pacientes de EM y 4000 controles hemos confirmado que este SNP se asocia a la enfermedad y apunta a que es la variante causal de la asociación.
Mediante estudios de colocalización de las variantes que se asocian a cambios de expresión de genes (expression quantitative trait loci: eQTLs) obtenidas del proyecto GEUVADIS y las variantes que se asocian a EM en el estudio de mapeo fino ImmunoChip observamos que ambos efectos confluyen en un grupo de variantes en total LD en el locus 12p13.31. Estos resultados apuntan a que la variante rs3764022, que produce un splicing alternativo del gen CLEC2D es la causa de la asociación con MS. Sin embargo, estudios de colocalización de las eQTLs de GEUVADIS con los datos de asociación del GWAS con 10000 pacientes y 30000 controles, indican que la variante causal correlaciona con cambios del gen CLECL1. El estudio caso-control entre las variantes mejor asociadas en el ImmunoChip y en el GWAS en nuestra cohorte española mostró que ninguna de las dos variantes se asocia con EM en la población española.
Conclusiones
El estudio de la correlación entre las variantes que se asocian con EM y aquellas que se asocian con cambios de expresión de genes en las mismas regiones nos ha permitido determinar que los cambios en la expresión de los genes CYP27B1, VDR y SP140 son la causa de la asociación de estos loci con la EM y hemos determinado sus respectivos mecanismos genético-moleculares asociados a la patotología.

11
Por otra parte, hemos observado que el sistema tiene limitaciones a la hora de determinar los genes causales como son la expresión específica de tejido o tipo de enfermedad, que nos ha llevado a buscar sistemas en los que se exprese el efecto de la variante como es el caso del gen CYP27B1 o VDR, que se manifiesta únicamente en condiciones de activación concretas. Esta metodología se está aplicando en otras enfermedades complejas lo que está permitiendo determinar los genes que están detrás de las asociaciones genéticas.
Una de las consecuencias que se derivan de esos resultados es la confluencia de factor genético y factor ambiental en el mismo locus. Por ejemplo, en el caso del CYP27B1, que activa la vitamina D, el alelo de riesgo para EM y otras enfermedades asociadas a este locus, es la variante T, que conlleva baja expresión del gen CYP27B1 en monocitos y, a su vez, baja expressión del receptor de vitamina D, VDR, en células B. Si estas personas, ademas de portar el genotipo de riesgo, no toman el sol ni suficientes alimentos o suplementos de vitamina D, conllevaría una deficiencia several de esta hormona.

12
Introduction

13
Multiple sclerosis definition and history
Multiple sclerosis (MS) is primarily an inflammatory disorder of the brain and spinal cord in
which leads to damage of myelin and axons (Compston A, 2008). The first illustration of MS
(Fig.1) was in 1838 by a young Scottish physician and artist, Dr Robert Carswell (1793–
1857). He spent years in the hospitals and mortuaries of Paris and Lyon painting watercolours
and pen and ink drawings of patients and post mortem preparations, he was looking for
creating an anatomy and pathology atlas. So, he drew 1034 paintings, 99 are of the brain and
spinal cord (Murray TJ, 2009). However, the first description of MS as a distinct disease was
in 1868 by Jean-Martin Charcot (1825 –1893), a French neurologist and professor
of anatomical pathology, he called it "sclérose en plaques"(Charcot J, 1868).
Figure 1. The spinal cord and pons illustration by Robert Carswell (1838) showing lesions of MS. Scattered hard, brown discoloured and atrophied patches were mentioned in the pons, medulla and cord. The lesions were in the white matter of the cord extended into the grey matter (Courtesy of the Wellcome Library, London).
Types of MS Neurologists identified 4 types of MS based on the course of the disease (Hauser and
Goodwin, 2008):
1- Relapsing–remitting MS (RRMS): is the most common form, affecting about 85% of MS
patients. It is marked by attacks of neurologic function "relapse" followed by partial or
complete recovery periods "remission", when symptoms improve or disappear.
2- Primary progressive MS (PPMS): affects approximately 10% of MS patients. Symptoms
continue to worsen gradually from the beginning. There are no distinct relapses or remissions.
This form of MS is more resistant to the drugs typically used to treat the disease.
3- Secondary progressive MS (SPMS): this type may develop in some patients with
relapsing–remitting disease. Most patients who are initially diagnosed with RRMS will
eventually transition to SPMS, which means that the disease course continues to worsen (not
necessarily more quickly) with or without relapses.

4- Prog
is prog
periods
SympAbout 2
ratio 3:
al., 200
33 per 1
MS dia
have so
multiple
The mo
neuritis
system
retentio
problem
Hohlfel
Figure 2MS symp3135 pati
gressive-rela
gressive from
of remissio
ptoms an2,5 million
1 (female:m
06). The glo
100 000 in 2
agnostic can
ome other
e strokes, v
ost common
s, diplopia),
(pain, hypo
on), and ne
ms (dysarth
ld, 2008) (F
. ptoms frequenients. (http://m
apsing MS (
m the begi
on.
nd Diagnpeople wor
male). Most
obal median
2013 accord
n be very di
condition t
itamin defic
n symptom
musculosk
oesthesias,
europsychol
hria), sexua
Fig.2).
ncy reported inmultiplesclero
(PRMS): is
inning, and
nostic rldwide we
t people are
n prevalence
ding to the M
ifficult as m
that mimic
ciency, and
ms include d
keletal system
paraesthesi
logical fun
al dysfunct
n the survey dsis.net/).
14
s a rare form
d occasiona
re registere
e diagnosed
e has been i
Multiple Sc
many as 10
s MS such
brain infec
disturbances
m (muscle
ias), bladde
ctioning. O
tion, and
done by MS H
m, affecting
al relapses
ed as diagno
between th
increased fr
clerosis Inte
% of peopl
h as inflam
tion.
s in the vis
weakness, s
er and bowe
Other symp
sleep diso
Health Union C
g fewer than
along the w
osed MS p
he ages of 2
rom 30 per
rnational Fe
le diagnose
mmation in
sual system
spasms, atax
el (incontin
ptoms inclu
rders (Rain
Community in
n 5% of pa
way. There
patients, wi
20 and 40 (
100 000 in
ederation (M
d with MS
the blood
m (nystagmu
xia), sensor
nence, frequ
ude fatigue,
ne, McFarl
n America in 2
atients. It
e are no
ith a sex
(Otron et
n 2008 to
MSIF).
actually
vessels,
us, optic
ry-tactile
uency or
, speech
land, &
2013 with

15
There is no single diagnostic test to MS. So the criteria for MS diagnosis are:
-Onset usually between 10 and 60 years of age
-Symptoms and signs indicating lesions of central nervous system (CNS) white matter
-Evidence of two or more lesions upon examination by
Magnetic resonance imaging (MRI) scan (Fig.3)
-Objective evidence of CNS disease on neurological
examination
-A course following one of two patterns: two or more
episodes lasting at least 24 hours and occurring at least one
month apart, or a progressive course of signs and symptoms
over at least six months
-No other explanation for the symptoms
Pathology and treatment of MS The primary cause of neuron damage in MS is an inflammation of CNS. However, the
specific elements that start this inflammation are still unknown. Studies have suggested that
genetic, epigenetic, environmental and infectious agents as factors influencing the
development of MS.
The immune system and MS
Numerous immunological studies have been done in human MS and in the animal model for
the disease, known as the experimental autoimmune encephalomyelitis (EAE). They
elucidated how the innate and the adaptive immune system are involved in MS pathology
(Fig.4). (Loma and Heyman, 2011)
The role of innate immune system in MS
The innate system plays opposite roles in MS; it is involved in MS pathology by promoting
Th1 and Th17 differentiation, generating inflammatory reactions. On the contrary the same
system can prevent the autoimmunity reaction by activation Treg cells and manage to repair
the CNS by secretion of neurotrophic factors (Gandhi et al., 2009).
Figure 3. MRI of 35-year-old man with RRMS, reveals the demyelinating lesions in the white matter.

16
Figure 4. Neuro-protective and neuro-destructive effects of innate immune system. Innate immune cells attack against the myeline via cytoxicity (oxygen species and perforins secretion by γ-δ T cells) or via direct interaction (Fas-FasL γ-δ T cells, phagocytose by mast cells and microglia). Innate immune cells also play a neuro-protective role by secretion of various neurotropic factors that help in promoting neurogenesis by NK cells (Gandhi et al., 2010).
Dendritic Cells (DCs)
In MS patients, DCs are in the active phenotype with high expression of the activation
markers CD40 and CD80, and with an increase in secretion of the proinflammatory cytokines.
This activated phenotype of DCs is accompanied by an enhanced pro-inflammatory T cell
response as defined by increased secretion of tumor necrosis factor alpha (TNFα) and
interferon gamma (IFNγ). Additionally, it has been demonstrated that monocyte-derived DCs
differentiated from MS patients, secrete more pro-inflammatory cytokines such as IFNγ,
TNFα (Th-1 bias cytokine), IL6 (Huang et al., 1999), and IL23 (Th-17 bias cytokine)
(Vaknin- Dembinsky et al., 2006) (Vaknin- Dembinsky et al., 2008).
Microglial/macrophage
Microglial cells constitue 10–20% of glial cells found in the CNS, where they are considered
as resident macrophages contributing to MS by their involvement in phagocytosis, antigen
presentation and production of cytokines. There are no markers distinguishing microglial
cells from blood-derived macrophages in the CNS. Microglial cells are rapidly activated in
response to injury, neuro-degeneration, infection, tumors and inflammation. In addition,
microglial cells express all known toll-like receptors TLRs (TLR 1–9), the importance of
these receptors in MS pathology is revealed in the increasing of their expression in brain
lesions in EAE and in MS (Andersson et al., 2008). Morever, microglial and macrophages
cells are involved in demyelination and phagocytosis of the degraded myelin which results in

17
augmentation of the expression of myeloperoxidases enzyme, causing neuronal damage
(Benveniste, 1997)
Natural Killer cells (NK cells)
It has been shown that NK cells have cytotoxic activity in vitro towards oligodendrocytes,
astrocytes and microglial cells during inflammation (Saikali et al., 2007). In addition, the
presence of NK cells in demyelinating lesions has been detected in MS patients (Traugott,
1985). However, NK cells from mice with EAE are able to produce nuerotrophic factors such
as brain-derived neurotrophic factor (BDNF) and neurotrophin-3 (NT-3), thus lead to repair
and protect the CNS (Hammarberg et al., 2000). Consequently, all these data show that NK
cells may play a regulatory role in MS (Gandhi et al., 2010)
Mast cells
Because of their presence in the brain, mast cells can interact with the myelin (Medic et al.,
2008), furthermore these cells can phagocyte myelin vesicles. An in vitro study by Johnson et
al. (1988) demonstrated that myelin proteins can stimulate mast cells which in turn liberate
the protease contained in the granules that at the end leads to myelin basic protein (MBP)
degradation.
NK-T cells
The number of total NK-T cells has shown to be decreased in MS. Nevertheless, these cells
produce more IL10 which induces the Treg cells (Sonoda et al., 2001) and more IL4 (Th2
bias). Accordingly, it has been suggested that NK-T cells play an "immunoregulatory" role
and might be involved in mediating the remission phase of MS (Araki et al., 2003).
Gamma-delta T cells ( γ-δ T cells)
In MS patients, γ-δ T cells have been detected in the MS lesions (Selmaj et al., 1991), their
number has also shown to be increased in the cerebrospinal fluid (CSF) (Shimonkevitz et al.,
1993). Additionally, the oligodendrocytes affected directly by γ-δ T cells cytotoxicity through
perforine secretion and/or Fas- Fas Ligand interaction in MS (Zeine et al., 1998).

18
The adaptive immune system in MS
B cells
Many studies have proved the critical role of B cells in MS immune pathology. The crucial
roles of antibody response in the development of CNS demyelination have been demonstrated
in EAE studies (Schluesener et al., 1987) (Genain et al., 1995). In addition, the antigen
presentation by B cells has been shown as an important step for autoimmune attack against
the myelin oligodendrocyte glycoprotein in CNS. (Molnarfi et al., 2013). However, not all B
cells participate in CNS attack. It has been demonstrated that the central B cells are intact in
MS patients. Conversely, the peripheral B cells are defected and this defect potentially
resulting from defective Treg function. (Kinnunen et al., 2013). These B cells shown to
produce high levels of IL6 (T cells stimulator) in MS patients compared with healthy
individuals. (Barr et al., 2012). In addition, myelin-reactive memory B-cells can be found in
the peripheral blood of MS patients (Harp et al., 2010). These memory B-cells express high
levels of CD20 in MS (Roll et al., 2006). The Igs secreted by B cells against minor myelin
components have also been shown. Anti-MOG (myelin oligodendrocyte glycoprotein)
antibodies are able to cause myelin destruction in EAE ( Schluesener et al., 1987;
Litzenburger et al.,1998) , in contrast to anti-MBP (myelin basic protein) or anti-PLP (myelin
proteolipid protein ) antibodies (Genain et al., 1995). Anti-MOG antibodies have also been
found in human MS lesions (Genain et al., 1999).
T cells
In the CNS, T-helper cells (Th, CD4+) recognize HLA class II antigens presented by antigen
presenting cells (APCs), B cells, DCs, microglia and macrophages, the antigens represented
by. However, cytotoxic T cells (CD8+) recognize HLA class I antigens, which are expressed
by all nucleated cells. Depend on the cytokines secreted, CD4+ cells polarized to differentiate
into effector T cells (Th1, Th2 and Th7). It has been demonstrated that in MS the cells
promoting the inflammation are the proinflammatory cells Th1 which produce cytokines such
as IFNγ and Th17 cells that secrete IL17, IL21, IL22 and IL26 (Miyama et al., 2006). A
migration of these cells has been detected from the periphery to the central nervous system
followed by demyelination and axonal loss (Gandhi et al., 2010). Another CD4+ T cells,
known as regulatory T cells (Treg), that regulate the effector T cells (Th1, Th2 and Th17),
also are involved in MS pathology. No difference has been found in total number of Treg
between MS patients and healthy individuals; however the function of these cells has shown
to be reduced in MS patients (Haas et al., 2005). Besides the CD4+T cells, CD8+T cells are

19
involved in MS pathogenesis. CD8+ T cells have been detected in MS lesions, these cytotoxic
cells act against CD4+T by perforin secreting leading to their inactivation; they also provoke
the death of oligodendrocyte and glial cells (Weber et al., 2007).
MS treatments
Currently, there is no cure for MS; the therapies for MS are either immunomodulatory or
immunosuppressive (Duddy, 2015). Most of these disease-modifying therapies are effective
in the relapsing–remitting stage by reducing the frequency of relapses, and decreasing the
formation of inflammatory lesions (Hauser et al., 2013); however they do not influence the
course of progressive MS and therefore are not sufficient enough to cure chronic neurological
disability. In addition, other medications are used to treat the symptoms of MS (symptomatic
treatment) improving the quality of patient life.
Disease-modifying therapies are used to reduce the frequency and severity of clinical attacks
and the accumulation of lesions within the brain and spinal cord seen on MRI and to slow
down the accumulation of disability. The 8 medication belonging to disease-modifying
therapies have been approved by the US Food and Drugs Administration (FDA), they are
classified as immunomodulators or immunosuppressants. The immunomodulators or receptor
modulators are indicated for the treatment of patients with relapsing forms of MS, such as the
interferon-beta (Avonex, Rebif, Betaseron and Extavia), glatiramer acetate (Copaxone) and
natalizumab (Tysabri) and Fingolimod (FTY720). These medications help to slow the
accumulation of physical disability and decrease the frequency of clinical exacerbations. On
the other hand the immunosuppressants are used for their ability to suppress immune
reactions such as Mitoxantrone (Novantrone), classified also as antineoplastic.
MS symptomatic treatments are aimed at maintaining function and improving quality of life
(Brunton et al., 2005). It is common practice to treat acute relapses of MS with a short course
typically 3 to 5 days. The first drug approved by the FDA was Dalfampridine (Ampyra,
Acorda) to improve walking in MS patients (Zivadinov et al., 2001).
Lately, stem cell therapy in axonal demyelination and neurological disability has had
promising results in animal models as well as in patient clinical treatment (Ben-Hur et al.,
2013). Stem cell therapies may serve as potential therapy for neurodegenerative disease.
Mesenchymal stem cells (MSCs) have the capacity to modulate the intensity of an immune
attack in MS by inhibiting antigen-specific T-cell proliferation and cytotoxicity and
promoting the generation of Tregs and by promoting self-tolerance by inhibiting the DC

20
ability to become antigen presenting cells. Recently, many clinical trials have been done on
MS patients treated with MSCs: In 2012, 10 SPMS patients received IV injection of
autologous BM-MSCs, and six months after treatment, the results have been shown to
improve in visual acuity and visual evoked response latency (Connick et al., 2012). In 2014, 9
RRMS patients have been treated with MSCs for 6 months, the results shown that this
treatment reduced the lesions visualized by MRI; however non-significant decrease of in Th1
cells in peripheral blood was observed (Llufriu et al., 2014). Therefore, these results proved
the neuroprotective effect of MSCs by promotion of endogenous oligodendrogenesis and
remyelination (Rivera et al., 2006).
Environmental Factors in MS etiology MS is a multifactorial disease. Its etiology likely to be an interplay of a variety of exogenous
and genetic factors. In addition, the increase in incidence rates in short time intervals and in
subgroups of patients suggests the strong action of environmental factors in developing and
modulating MS (Pugliatti M. et al., 2012)
Infectious causes of MS
Specific transmissible agents have been proposed as possible causes of MS such as human
herpesvirus (EBV and HHV-6), coronaviruses, JC virus, Varicella–Zoster virus, Torque Teno
virus and Chlamydia pneumonia.
EBV
Many studies have been suggested the relation between EBV infection and MS. Numerous
studies have shown that MS patients are almost universally seropositive for EBV, but not for
other viruses (Bray PF et al., 1983; Wandinger K-P et al., 2000). A meta-analysis of 13 case–
control studies has found out that 99.5% of MS patients were EBV seropositive compared
with 94.0% of controls, with EBV seronegativity (p<1E-9) (Ascherio A et al., 2007). It has
also demonstrated that among subjects not infected with EBV the risk of developing MS is
extremely low, but after EBV infection there is an important increase in risk (Levin LI et al.,
2010). Whereas most of these studies have suggested that EBV infection is a prerequisite for
developing MS, this infection is not sufficient, by itself, to cause MS because the great
majority of people infected with EBV do not develop the disease (Pakpoor J et al., 2013).
Recently the proposed role of EBV infection in the development of MS has been summarized
by Pender and Burrows (2014). During primary infection, EBV infects autoreactive naïve B

21
cells, and then these cells proliferate intensely and differentiate into latently infected
autoreactive memory B cells circulating in the blood. Proliferating and lytically EBV-infected
B cells attacked by EBV-specific cytotoxic CD8+ T cells. However EBV-infected
autoreactive memory B cells survived, so they enter the CNS where they take up residence
and produce oligoclonal IgG and pathogenic autoantibodies, which attack myelin and other
components of the CNS. In addition, in CNS, the autoreactive T cells activated by EBV-
infected autoreactive B cells presenting CNS peptides, they produce cytokines such as
interleukin-2 (IL2), IFNγ and TNFβ and orchestrate an autoimmune attack on the CNS with
resultant oligodendrocyte and myelin destruction.
HHV-6
HHV-6 DNA and antibody to the virus were detected in blood samples from patients with MS
but were not associated with clinical disease. (Liedtke et al.,1995) In addition, increased
concentrations of IgG to HHV-6 were found in blood samples from patients with relapsing-
remitting MS than in those with chronic-progressive MS, other neurological diseases, and
healthy controls. (Gutierrez et al., 2002) HHV-6 antigen was also found in oligodendrocytes
in 12 (80%) of 15 brain specimens from patients with MS. Other cells (neurons, astrocytes,
macrophages, ependymal cells, choroid plexus, and endothelial cells) were also positive in
brains from patients and controls; Overall, HHV-6 DNA and increased concentrations of
antibody to HHV-6 in blood and CSF have been found in only a minority of patients with
MS. Detection of HHV-6 DNA and antigen in brain might reflect HHV-6 reactivation from
latency in blood T cells trafficking through the brains of patients with inflammatory CNS
disease.
Coronaviruses
By use of in-situ hybridisation, Murray and colleagues (1992) detected coronavirus RNA in
brains of 12 of 22 patients with MS. Human coronavirus 229E RNA was detected by in four
of 11 patients with MS Stewart and colleagues (1992), but not in brains of six patients with
neurological disease or in the brains of five healthy people. (Dessau et al., 2001)
JC virus
Polyoma JC virus is the cause of progressive multifocal leukoencephalopathy (PML), the
only human demyelinating disease with a proven viral cause. The kidney is the only known
site of latent infection. JC virus was not found in the urine of 53 patients with clinically
definite MS or 53 controls matched for age and sex (Boerman et al., 1993). In a study of 37

22
patients with MS who were taking ciclosporin (Stoner et al., 1996), it was shown by PCR the
DNA of JC virus in the urine of 30 (81%). JC virus DNA was detected in the CSF of 9% of
patients with MS but not in any patients with other neurological diseases or in other controls
(Ferrante et al., 1998).
Varicella–zoster virus
VZV is the causative agent of chickenpox. Recent studies conducted by (Sotelo et al., 2007)
indicated the presence of VZV DNA in CSF and mononuclear blood cells of MS patients in
relapse, while VZV viral particles were observed by electron microscopy in patients' CSF
(Sotelo et al., 2008). Conversely, another study failed to show the presence of VZV virions or
DNA in the CSF or in the acute plaques of MS patients (Burgoon et al., 2009). Therefore, the
role of VZV in MS remains controversial.
Torque Teno virus
Not only pathogenic but also nonpathogenic infectious agents have been suggested to be
involved in exacerbation and/or induction of MS. A study by Sospedra et al., (2005)
determined the specificity of clonally expanded T cells from CSF of MS patients during
disease exacerbation. These T cells were shown to recognize poly-arginine regions of Torque
Teno virus (TTV) as well as evolutionary conserved motifs of other common viruses and
prokaryotes, suggesting a mechanism of misdirected autoantigen response as a result of
molecular mimicry. However, due to the paucity of data, the relation of TTV infection and
MS remains ill defined.
Chlamydia pneumonia
C. pneumoniae is a gram-negative bacterium recently implicated in MS, as C. pneumoniae
DNA and specific antibody has been detected in CSF of some patients with MS (Sriram et
al., 1999). In an analysis of the humoral immune responses to C. pneumoniae in paired serum
and CSF samples of patients with definite MS and other inflammatory and non-inflammatory
neurological disorders, no difference in seropositivity was found between the groups,
although titres of IgG specific for C. pneumoniae were substantially higher in the CSF of
patients with MS than in controls. 16 (31%) of 52 patients with MS who were seropositive
showed intrathecal synthesis of IgG specific for C. pneumoniae compared with only one (2%)
of 43 seropositive controls (Krametter, et al., 2001). Overall, many studies have assessed a
possible relation between C. pneumoniae and MS, however it is still not confirmed (Tsai and
Gilden, 2001).

23
Vitamin D and MS risk
Many studies have demonstrated a strong association between vitamin D levels and risk of
MS.
Vitamin D is a steroid vitamin (Margherita et al. 2015). Vitamin D3 is the primary form of
vitamin D, can be taken through the diet such as fish oils, or synthesized in the skin from 7-
dehydroxycholesterol upon exposure to ultraviolet B radiation (UVB, wavelength 290–
315 nm). Thus, vitamin D produced by UVB depends on seasons and latitude (Webb et al.,
1988). Also, many studies have demonstrated that sunscreen and clothes affected the
production of Vitamin D from 7-dehydroxycholesterol. (Matsuoka et al., 1987) (Matsuoka et
al., 1992).
In addition, it was confirmed that higher childhood and early adolescence sunlight exposure
associated with lower MS risk (Van der Mei et al., 2003; Islam et al., 2007). Month of birth
also was considered as a factor that influence MS susceptibility, fewer MS patients were born
in late spring in compare to who were born in fall.(Sadovnick et al., 2007). Geographic
distribution also influence MS prevalence, in the areas further away from the equator where
there is less sunshine MS is more common , which show a relationship between vitamin D
and the risk of developing MS (Rahnavard et al., 2010; Allison, 1960). It has been also
reported that the highest prevalence was in North America (140 per 100 000) and Europe
(108 per 100 000), however the lowest was in sub-Saharan Africa (2,1 per 100 000) and east
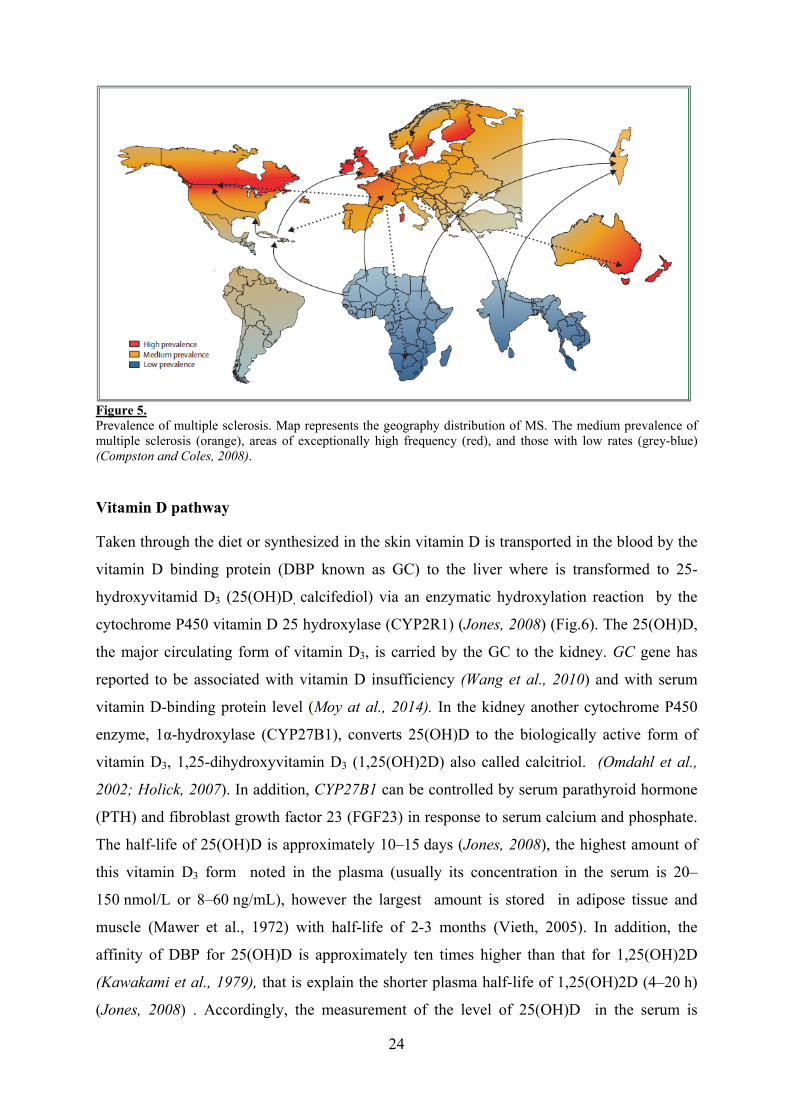
Asia (2,2 per 100 000) (Lazaros et al., 2015) (Fig.5).
It has been proved that MS patients have lower serum vitamin D levels than healthy
individuals and the intake of vitamin D from supplements had a protective effect against MS
(Munger et al., 2004; Munger et al., 2006; Ozgocmen et al., 2005). Additionally, in women
an increasing of 10 nmol/L of serum 1,25(OH)2D concentration was associated with a 20%
reduction in MS development possibility. The 25(OH)D serum level was considered as a
significant predictor of MS risk developing. (Kragt et al., 2009).
24
Figure 5. Prevalence of multiple sclerosis. Map represents the geography distribution of MS. The medium prevalence of multiple sclerosis (orange), areas of exceptionally high frequency (red), and those with low rates (grey-blue) (Compston and Coles, 2008).
Vitamin D pathway
Taken through the diet or synthesized in the skin vitamin D is transported in the blood by the
vitamin D binding protein (DBP known as GC) to the liver where is transformed to 25-
hydroxyvitamid D3 (25(OH)D, calcifediol) via an enzymatic hydroxylation reaction by the
cytochrome P450 vitamin D 25 hydroxylase (CYP2R1) (Jones, 2008) (Fig.6). The 25(OH)D,
the major circulating form of vitamin D3, is carried by the GC to the kidney. GC gene has
reported to be associated with vitamin D insufficiency (Wang et al., 2010) and with serum
vitamin D-binding protein level (Moy at al., 2014). In the kidney another cytochrome P450
enzyme, 1α-hydroxylase (CYP27B1), converts 25(OH)D to the biologically active form of
vitamin D3, 1,25-dihydroxyvitamin D3 (1,25(OH)2D) also called calcitriol. (Omdahl et al.,
2002; Holick, 2007). In addition, CYP27B1 can be controlled by serum parathyroid hormone
(PTH) and fibroblast growth factor 23 (FGF23) in response to serum calcium and phosphate.
The half-life of 25(OH)D is approximately 10–15 days (Jones, 2008), the highest amount of
this vitamin D3 form noted in the plasma (usually its concentration in the serum is 20–
150 nmol/L or 8–60 ng/mL), however the largest amount is stored in adipose tissue and
muscle (Mawer et al., 1972) with half-life of 2-3 months (Vieth, 2005). In addition, the
affinity of DBP for 25(OH)D is approximately ten times higher than that for 1,25(OH)2D
(Kawakami et al., 1979), that is explain the shorter plasma half-life of 1,25(OH)2D (4–20 h)
(Jones, 2008) . Accordingly, the measurement of the level of 25(OH)D in the serum is

25
considered as an indicator of vitamin D status. The monooxygenase cytochrome P450 protein
CYP24A1 can convert the 25(OH)D to an inactive component 24,25(OH)2D and able to
catalyze the active form of vitamin D3, 1,25(OH)2D to the inactive form 1,24,25(OH)2D
(Zimmerman et al., 2001; Plum and DeLuca, 2010).
Figure 6. Scheme of the vitamin D metabolism pathway (web: www.hcare.com).
1,25(OH)2D binds to the 1,25-dihydroxyvitamin D3 receptor (VDR) which is a nuclear
hormone receptor for vitamin D3, ligand-VDR forms heterodimer with retinoid X receptor
(RXR). This complex acts as an active transcription factor on the vitamin D3 response
element (VDRE) regulating the expression of genes that maintain mineral homeostasis and
skeletal health, as well as immune, renal, and cardio-vascular function.(Dusso, 2011) (Fig.7).
Furthermore, VDR can regulate between 500 to 1000 coding genes, that means it can bind to
up to 8000 loci in the human genome (Haussler et al., 2013).

Figure 7The mechheterodimor suppre Vitami
Vitamin
toleroge
the adap
Vitamin
1,25(OH
them to
stimulat
IL12 se
to inhib
Bone Increa
IntestIncreaand P
7. hanism of actmers bind to Vessing activity
n D and im
n D3 plays
enic cells in
ptive system
n D and the
H)2D can a
o tolerogeni
tory molecu
ecretion and
bit T cells cy
ases bone mi
tine ases absorpti
Pi
tion of 1,25(OVDREs and sy (modified fro
mmune syst
a crucial ro
n the innate
m that reflec
e Innate Im
alter functio
c cells. The
ule expressi
d increases I
ytokines su
ineralization
ion of Ca2+
OH)2D. Calcittart regulating
om Bikle, 2010
tem
ole in imm
e system an
cts how vita
mmune Syste
on and mo
ese cells hav
ion (CD40,
IL10, the to
ch as IL12
Immune syInhibits of cPromoting oReduces HL
26
triol binds to Vg the expressi0).
une system
nd controllin
amin D3 can
em
orphology o
ve been sho
CD80, CD
olerogenic in
and IL17 (B
stems cell proliferatof cells differLA expressio
VDR formingion of differen
m (Fig.8), tr
ng cell prol
n be benefit
of monocyte
own to decr
D86) that red
nteleukin. A
Banchereau
ArDe
TuInInIn
tion rentiation
on
g a heterodimnt genes that m
ransforming
liferation an
in autoimm
e-derived D
rease the MH
duces antig
Additionally
u and Steinm
rterial hypeecreases bloo
umor micronhibits angiognhibits cell prnduces differe
er with RXR.may have act
g immune c
nd different
mune reactio
DCs trans
HC class II
en presenta
y, 1,25(OH)
man, 1998;
ertension od pressure
oenvironmengenesis roliferation entiation
These ivating
cells into
tiation in
ons.
sforming
I and co-
ation and
)2D able
Rigby et
nt
27
al., 1990; Baeke et al., 2010). Another study has been demonstrated that a high dose of
1,25(OH)2D supplementation in healthy humans reduces significantly proinflammatory
cytokine IL6 produced by peripheral blood mononuclear cells (PBMC) (Müller et al., 1991).
Accordingly, all these effect favour induction of Treg, which have a critical role in the
immune responses control and autoreactivity development. (Steinman et al., 2003). However,
the effect of Vitamin D on NKT and NK cells still unclear. (Peelen et al., 2011). On the other
hand, 1,25(OH)2D able to induce the expression of CAMP gene which encode the
cathelicidin, antimicrobial peptide, that plays a critical role in mammalian innate immune
defence against invasive bacterial infection by binding to bacterial lipopolysaccharides LPS.
It also has an antifungal and antiviral activity (Zanetti , 2004). Furthermore, cathelicidin play
a role in cell chemotaxis, immune mediator induction, and inflammatory response regulation.
(Niyonsaba et al.,2002).
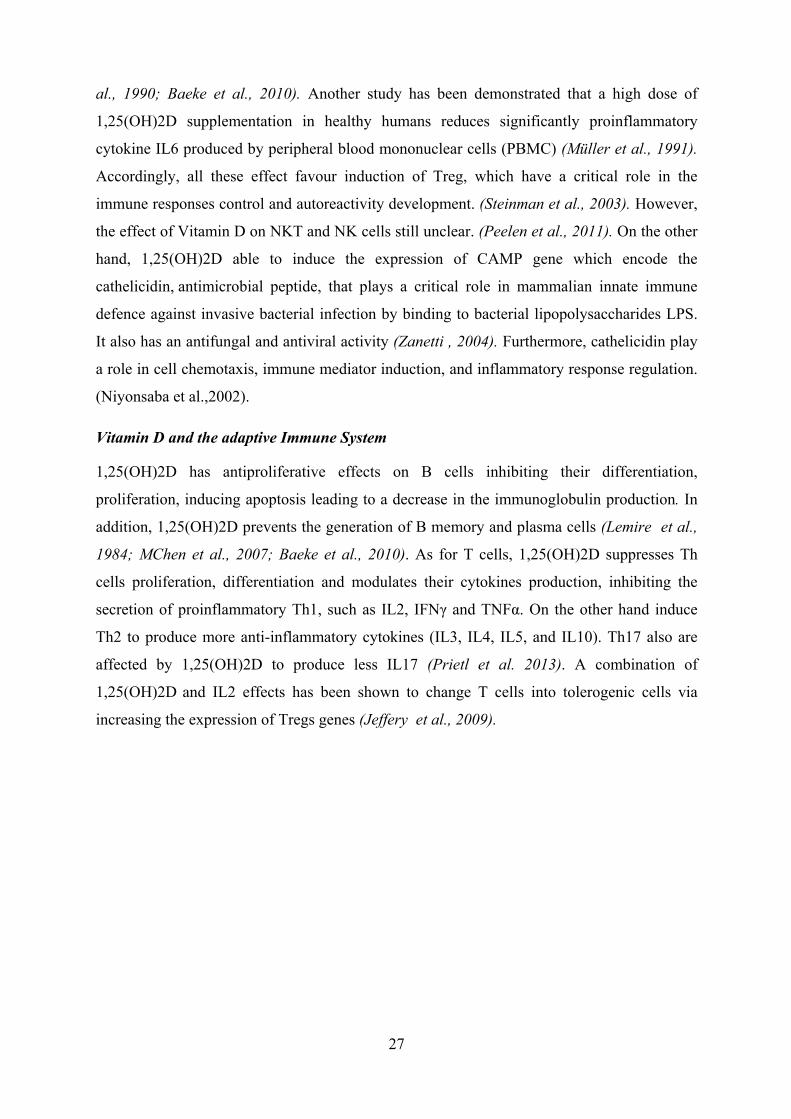
Vitamin D and the adaptive Immune System
1,25(OH)2D has antiproliferative effects on B cells inhibiting their differentiation,
proliferation, inducing apoptosis leading to a decrease in the immunoglobulin production. In
addition, 1,25(OH)2D prevents the generation of B memory and plasma cells (Lemire et al.,
1984; MChen et al., 2007; Baeke et al., 2010). As for T cells, 1,25(OH)2D suppresses Th
cells proliferation, differentiation and modulates their cytokines production, inhibiting the
secretion of proinflammatory Th1, such as IL2, IFNγ and TNFα. On the other hand induce
Th2 to produce more anti-inflammatory cytokines (IL3, IL4, IL5, and IL10). Th17 also are
affected by 1,25(OH)2D to produce less IL17 (Prietl et al. 2013). A combination of
1,25(OH)2D and IL2 effects has been shown to change T cells into tolerogenic cells via
increasing the expression of Tregs genes (Jeffery et al., 2009).

28
Figure 8. An overview of the overall effects of 1,25(OH)2D3 on monocytes, dendritic, T , NKT, NK and B cells in both immune systems. (Peelen et al., 2011).
Vitamin D with pro-inflammatory transcription factors and signaling pathways
1,25(OH)2D and its receptor complex VDR/RXR can interact with transcription factors such
as NF-κB, nuclear factor of activated T-cells (NFAT), or TGF-β receptor which leads to anti-
inflammatory effects (Fig.9)
NFκB
Active VDR inhibits NF-κB activation and signaling. NFκB is a ubiquitously expressed
transcription factor which represents a heterodimer. When NFκB is inactive it interacts with
IκB which keeps it in the cytosol (Karin and Lin, 2002). Upon cell activation by
proinflammatory stimuli, IκB is phosphorylated and subsequently ubiquitinylated, which
leads to proteasomal degradation of the IκB protein. Free NFκB translocates to the nucleus
where it activates transcription of proinflammatory cytokines, antiapoptotic factors as well as
of enzymes involved in the generation of proinflammatory mediators such as COX-2 (Karin
and Lin, 2002; Tsatsanis et al., 2006).
It has been shown in lymphocytes that 1,25(OH)2D down-regulates NF-κB levels (Yu et al.,
1995) and that the vitamin D analog TX 527 prevents NF-κB activation in monocytes (Stio et

29
al., 2007). NFκB activation by 1,25(OH)2D-mediated up-regulation of IκB expression was
reported in human peritoneal macrophages (Cohen-Lahav et al., 2006) (Fig. A). Additionally,
interference of vitamin D signaling with DNA binding of NFκB was found (Harant et al.,
1998).
In addition, it was shown that 1,25(OH)2D inhibits NF-κB activity in human MRC-5
fibroblasts but not translocation of its subunits p50 and p65. The partial inhibition of NFκB
DNA binding by 1,25(OH)2D was dependent on de novo protein synthesis, suggesting that
1,25(OH)2D may regulate expression of cellular factors which contribute to reduced DNA
binding of NFκB (Harant et al., 1998). Thus, it seems that vitamin D is able to inhibit NFκB
activation as well DNA binding (Fig9).
NFAT
Another interesting target for the anti-inflammatory signaling of vitamin D is transcription
factor NFAT (Fig. A). NFAT activated by dephosphorylation by calcineurin which leads to
translocation of this protein and transcriptional activation of proinflammatory genes such as
IL2 and cyclooxygenase-2 (Duque et al., 2005; Muller and Rao, 2010). In T-lymphocytes, it
was shown for the IL2 promoter that VDR-RXR heterodimers bind to an NFAT binding site
and thus inhibit NFAT activity (Takeuchi et al., 1998). Similar results were obtained for IL17
where 1,25(OH)2D blocked NFAT activity which contributed to repression of IL17A
expression in inflammatory CD4+ T cells by the hormone (Joshi et al., 2011).
TGF-β
TGF-β is a pleiotropic cytokine with a broad range of biologic effects, which is involved in
the regulation of inflammatory processes on several levels. A main mechanism in this respect
is the maintenance of T cell tolerance to self or innocuous antigens (Li and Flavell, 2008). In
cancer-associated inflammation, TGF-β suppresses the anti-tumor activity of diverse immune
cells, including T-cells, natural killer (NK) cells, neutrophils, monocytes and macrophages
(Bierie and Moses, 2010). A great number of studies focused on the role of TGF-β in fibrosis
and associated inflammation. In these diseases, TGF-β regulates influx and activation of
immune cells, as well as the actual fibrotic process, and thus the delicate balance between an
appropriate inflammatory response and the development of pathologic fibrosis (Flanders,
2004; Sheppard, 2006; Lan, 2011). TGF-β signaling has been attributed both to canonical
TGF-β signaling via the Smad proteins (signal-dependent transcription factors).
The influence of vitamin D on inflammation-related signaling via TGF-β and Smad has
mainly been investigated in models of fibrosis, and distinct mechanisms have been

30
elucidated. Activation of 1,25(OH)2D signaling by the natural ligand itself or its synthetic
analogs reduces TGF-β expression (Kim et al., 2013)
More than 104 genomic sites were found to be co-occupied by both VDR and SMAD3 in
hepatic stellate cells, and an analysis of the spatial relationships between the two transcription
factors revealed that the respective response elements were located within a range of 200 base
pairs (one nucleosomal window). Mechanistically, TGF-β signaling seems to deplete
nucleosomes from the co-occupied sites and thus allow access of VDR to these sites. Vitamin
D signaling on the other hand seems to limit TGF-β activation by inhibited coactivator
recruitment. Spatiotemporal analysis revealed that 1,25(OH)2D / TGF-β-induced VDR and
SMAD3 binding to the co-occupied sites were inversely correlated. The maximum of
SMAD3 binding occurred 1 h after treatment and was reduced by 70% after 4 h, when VDR
binding was maximal. Therefore, TGF-β signaling seems to change the chromatin
architecture in a way in which liganded VDR can reverse Smad activation.
Figure 9. SMAD, NFAT and NFκB signaling and modulation of these signaling pathways by 1α,25(OH)2D3-VDR/RXR. IκB phosphorylation after various cell stress signals leads to its ubiquitinylation and subsequent proteosomal degradation. After IκB degradation, NFκB is released and translocates into the nucleus where it binds to DNA and modulates gene expression. Activation of NFAT is mediated by the protein phosphatase calcineurin which dephosphorylates NFAT. After dephosphorylation, NFAT translocates into the nucleus, interacts with a variety of other transcription factors and modulates gene expression. Activation of TGFβ receptors leads to phosphorylation of SMAD2 and SMAD3 as well as subsequent translocation into the nucleus. SMAD3 forms a complex with SMAD4 and modulates gene expression of its target genes. After activation by 1α,25(OH)2D the VDR/RXR heterodimer can inhibit NFκB signaling either by induction of IκB or by interference with NFκB DNA binding. Also, inhibition of NFAT signaling was reported by prevention of NFAT binding to its response elements.

31
Tobacco smoke
Tobacco smoking is a well-established environmental risk factor for MS since many case-
control and meta-analysis studies had been done and demonstrated the association between
MS incidence and smoking in different population such as Canadian (Ghadirian et al. 2001) ,
European (Hedstrom et al. 2009) and Swedish (Carlens et al. 2010). Several other smaller
case–control or cohort studies have been published. Overall, most of them (Rodriguez Regal
et al. 2009; Pekmezovic et al. 2006; Hernan et al. 2005; Riise et al. 2003), but not all (Simon
et al. 2010; Silva et al. 2009; Russo et al. 2008) studies showed that smoking is associated
with increased MS susceptibility. Moreover, it has been showed that MS risk increased with
increasing duration of exposure (Hedstrom et al. 2011) as well as increasing with nicotinine
levels (Sundstrom et al. 2008). However, the mechanisms by which smoking might influence
the risk of MS and/or its clinical course are unclear (Wingerchuket al., 2012). It might
increase MS susceptibility through epigenetic modifications (Koch et al. 2013b).
Epigenetic consequences
Environmental exposures such as malnutrition, tobacco smoke, air pollutants, metals, organic
chemicals, sun exposure, sources of oxidative stress, and the microbiome may induce changes
in epigenetic state (Cortessis et al., 2012). Epigenetics represents all heritable or non-
heritable modification (DNA methylation, histone modifications and RNA interference) that
can alter the expression or translation of the gene with no modification in DNA sequences.
The epigenetics changes can be generated by the external and environmental factors that turn
genes on or off, such as vitamin D deficiency, sun exposure, smoking, chemicals poducts and
Ebstein–Barr virus. In addition, these changes are specific to tissues.
Many studies have been also proved that the risk of MS have increased in smoking
individuals (Herna´n et al. 2001). In addition, smoking has been shown to alter histone
modification, pattern of DNA methylation and miRNA expression and therefore might
potentially increase MS susceptibility through epigenetic modifications (Koch et al. 2013b).
Additionally, EBV causes chronic latent viral infection in lymphocytes and upregulates
DNMTs that play a mean role in cell proliferation and genome stability. Vitamin D also can
change the expression of genes that modify histones and thus might be a potential epigenetic
regulator in MS (Koch et al. 2013a).

MS GIt has b
recurren
(3%), p
addition
offsprin
The firs
1970s (
region
polymo
Howeve
hand, m
genes st
Figure 1Recurrenprobands(kindly p
Genetics been demon
nce in mono
parents (2%
n, recurrenc
ng of single
st genetic fa
(Jersild and
called ma
orphic cell-
er, HLA by
many non-M
tudied are r
0. nce risks for ms with multiplprepared by Si
nstrated tha
ozygotic tw
%), and child
ce is higher
affected (2
actor related
d Fog, 1972
ajor histoco
surface gly
y itself cann
MHC genes
related to im
multiple scleroe sclerosis. Poimon Broadley
at the famil
wins represe
dren (2%) t
r in the chi
%) (Fig.10)
d with MS w
2). This locu
ompatibility
ycoproteins
not explain
have been
mmune respo
osis in familieooled data froy) (Compston
32
ly history r
ents 35%. T
than for sec
ildren of co
) (Compston
was the hum
us is locate
y complex
that are k
n the whole
found to be
onse (McEl
es. Age adjusom populationn and Coles, 20
reveals pred
The age-adju
cond-degree
onjugal pair
n and Coles
man leukocy
d in the sho
x (MHC).
key compon
genetic co
e associated
lroy and Ok
ted recurrencn based survey002).
disposition
usted risk is
e and third-
rs with MS
s, 2002).
yte antigen
ort arm of c
MHC gen
nents of th
mponent of
d with MS.
ksenberg, 20
e risks for difys. Estimated
to MS. The
s higher for
-degree rela
S (20%) tha
(HLA) locu
chromosom
nes encode
he immune
f MS. On t
The majorit
011).
fferent relativ95% Cl are sh
e family
siblings
atives. In
an in the
us in the
me 6, in a
e highly
system.
the other
ty of the
ves of hown
33
Genome investigation tools and methods
New powerful tools for investigating the genetic architecture of human disease have been
developed recently such as Genome Wide Association Studies (GWAS), ImmuChip studies
and their meta-analysis. They have quickly become a fundamental part of modern genetic
studies playing a central role in the human genetics revolution. These studies are based on
data of genetic projects dedicated to provide detailed catalogue of human genetic variation:
HapMap and 1000 Genomes projects.
International HapMap Project
The International HapMap Project is a collaboration among researchers at academic centers,
non-profit biomedical research groups and private companies
in Canada, China, Japan, Nigeria, the United Kingdom, and the United States. The
International HapMap Consortium launched the International HapMap Project in 2001, to
develop a haplotype map (“HapMap”) of the human genome and to describe the common
patterns of human genetic variation. It comprised three phases.
In 2005, the International HapMap Consortium released the Phase I HapMap, a resource
consisting of over a million accurate and complete single nucleotide polymorphism (SNP)
genotypes generated in 269 individuals from four geographically diverse populations: the
Yoruba in Ibadan, Nigeria; Japanese in Tokyo, Japan; Han Chinese in Beijing, China; and the
CEPH (U.S. Utah residents with ancestry from northern and western Europe). The Phase I
HapMap includes data from ten 500-kb regions (the “HapMap ENCODE I regions”) that
were sequenced to assess the genotyping.
Phase II HapMap was released in 2007, which added over 2.1 million SNPs to the original
map in the same 269 individuals. The Phase II HapMap enables an improved choice of tag
SNPs. Phase III was finished in 2009; 1.6 million SNPs were genotyped in 1,184 reference
individuals from 11 global populations, and sequenced ten 100-kilobase regions in 692 of
these individuals. This integrated data set of common and rare alleles, called ‘HapMap 3’,
includes both SNPs and copy number polymorphisms (CNPs). Thus, the HapMap has become
an important tool for researchers to use to find genes that affect health / disease, and response
to drugs and environmental factors. All HapMap data are freely available to the public
through the database dbSNP. A graphical browser for HapMap genotypes is also available
at http://www.hapmap.org/cgi-perl/gbrowse/gbrowse.

34
Moreover, the B lymphocytes from all blood samples of project have been converted by the
non-profit Coriell Institute for Medical Research into lymphoblastoid cell lines (LCLs).
Therefore, Coriell provides purified DNA and different type of cell lines most of them are
LCLs, fibroblast and somatic cell hybrid for research projects that have been approved by the
appropriate ethics committees.
1000 Genomes Project
The 1000 Genomes Project, launched in January 2008, it was the first project to sequence the
genomes of a large number of people from 26 different ethnic populations to provide a
comprehensive resource on human genetic variation, using newly developed technologies
faster and less expensive. The goal of the 1000 Genomes Project was to find most genetic
variants that have frequencies of at least 1% in the populations studied. (Durbin et al., 2010).
1000 genomes project combined data from 2504 unrelated samples; in addition it released 84
millions variants, including SNPs, indels (insertion or the deletion of bases) and structural
variations such as deletions, duplications, copy-number variants, insertions, inversions and
translocations. These data not only include several new populations, but also include the
populations in the HapMap. It started with three Pilot projects, to provide data that help to
design the full-scale project: Pilot 1 sequenced lightly 179 samples from the HapMap CEU,
YRI, CHB, and JPT populations. Pilot 2 sequenced deeply two trios. First trios: CEU,
NA12878 (daughter) and mother NA12892 and father NA12891. Second trios: YRI,
NA19240 (daughter) and mother NA19238 and father NA19239. Pilot 3, sequenced deeply in
the exons of 906 genes, in 697 samples from the CEU, TSI, YRI, LWK, CHB, JPT, and CHD
HapMap III populations.
Genome Wide Association Studies (GWASs) of MS
GWAS is an approach that involves scanning of multiple markers across the entire genomes
of many people belonging to two big populations: cases (patients) and controls (healthy), to
find genetic variations associated with a particular disease. So the GWAS is a test for
statistical associations between common gene variants (SNPs) and a phenotype.
Besides the GWASs, there is a strong trend for studies to combine data from multiple GWAS
studies into a meta-analysis to validate previous findings, expand findings from single
populations to universal effects, and identify novel gene effects. Collectively, these analysis
have increased the power of the GWAS studies, reduced the numbers of false positives, and
enabled the detection of small genetic effects that are associated with a number of diseases.

35
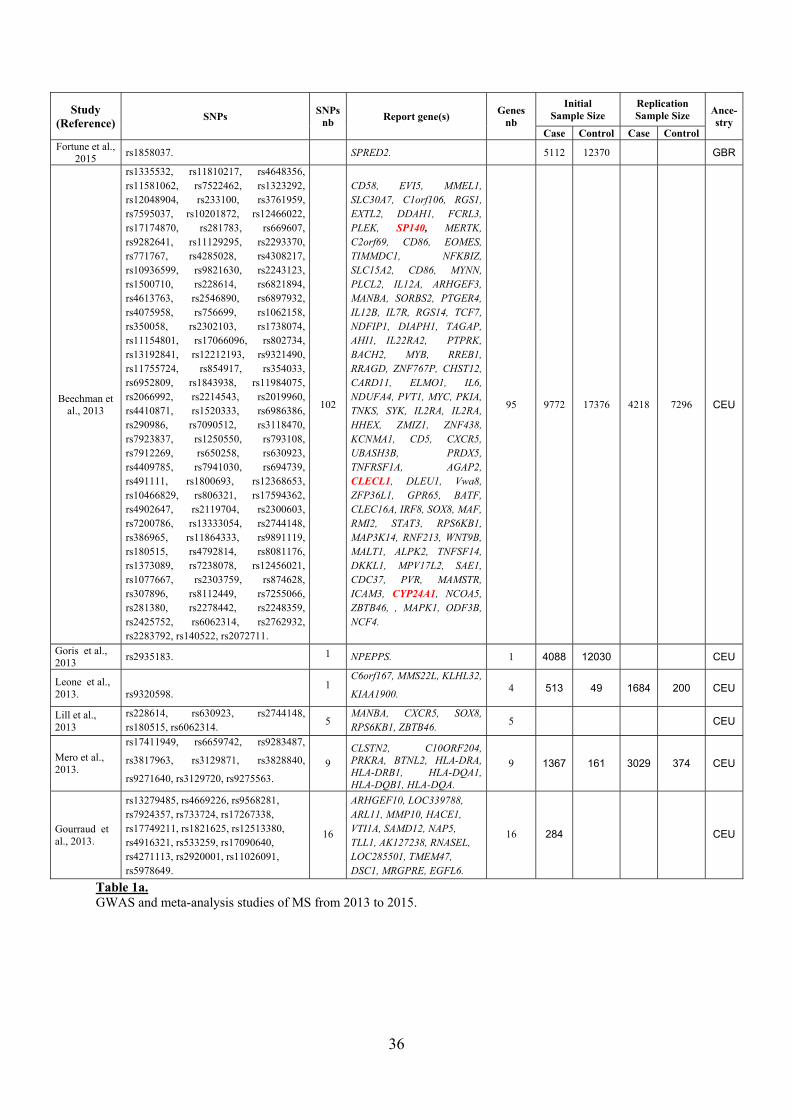
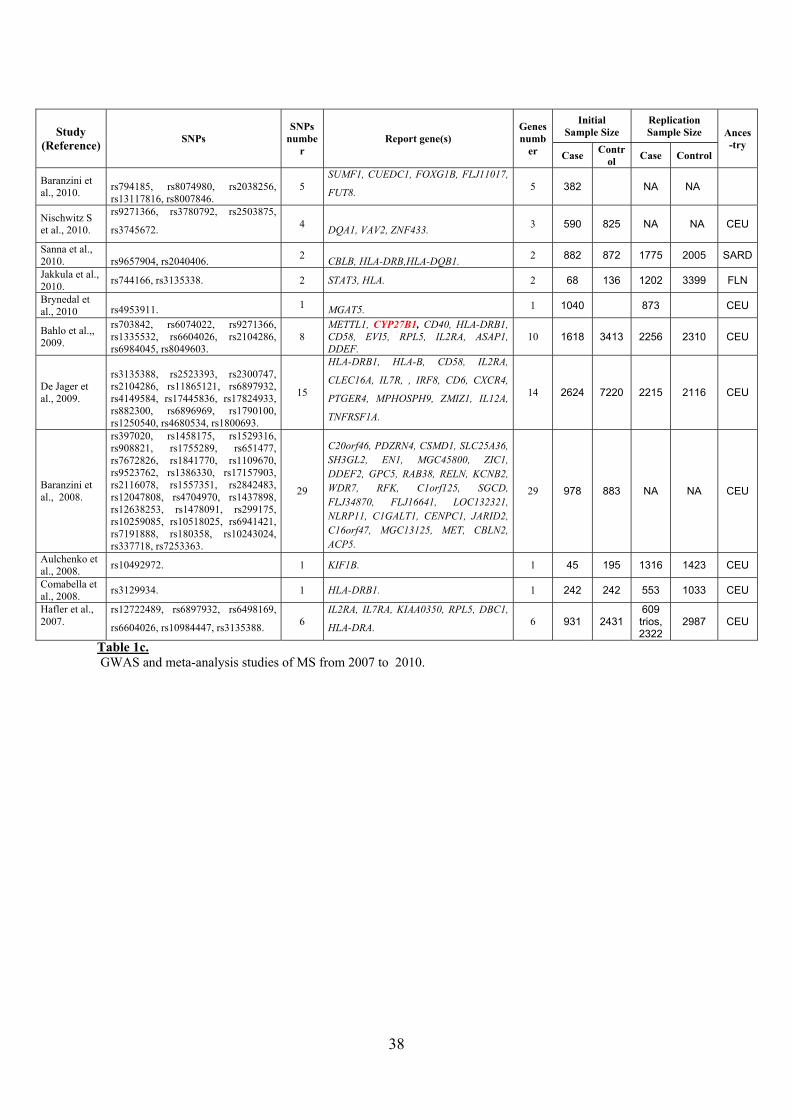
MS GWASs have detected hundreds of variants at genomic loci that are associated with this
disease in many human populations. Despite the fact that the determination of loci facilitates
the basic research in MS human genetics, the challenge is to identify causal genes in these
loci and to exploit subtle association signals. From 2007 to the present, 24 GWAS and meta-
analysis of MS have been published, these GWASs uncovered around 200 SNPs associated
with MS disease, and they also reported more than 100 loci as associated with MS (Table 1).
In general, the loci found to reach genome-wide significance have weak additive predictive
power for specific phenotypes, which for several traits limits their clinical relevance at
present. Most of the loci are noncoding, and many are far from discovered genes and, because
of linkage disequilibrium (LD), encompass many variants; therefore, they are not
immediately informative or biochemically tractable for experimental work. GWASs results
sometimes are not replicated across studies or populations (Nebert et al., 2008), revealing the
reports of false positives, that introduce the suspicion of the validity of novel associations,
especially when they involve non-coding sequence (Ward and Kellis, 2012).
MS genetic studies based on ImmunoChip
Deep replication of meta- GWASs and fine mapping of GWAS loci were done without the
filtering of SNPs on spacing or LD, as had been used in earlier GWAS.
The Immunochip is a consortium based custom Illumina Infinium SNP genotyping array,
specific to 12 immunologically related human diseases. The array design integrates relevant
1000Genomes data (CEU population), disease-specific resequencing data and known
immune-mediated disease loci identified by common variant GWAS. The probes on this array
interrogate 195,806 SNPs and 718 small insertion–deletions.
The final design incorporates 186 distinct loci containing markers meeting genome wide
significance criteria (P<5×10⁻⁸) from twelve such diseases (autoimmune thyroid disease,
ankylosing spondylitis, Crohn’s disease (CD), celiac disease (CCD), IgA deficiency, multiple
sclerosis, primary biliary cirrhosis, psoriasis, rheumatoid arthritis (RA), systemic lupus
erythematosus (SLE) , type 1 diabetes (T1D) and ulcerative colitis) (Parkes et al., 2013).
36
Table 1a. GWAS and meta-analysis studies of MS from 2013 to 2015.
Study (Reference) SNPs SNPs
nb Report gene(s) Genesnb
Initial Sample Size
Replication Sample Size Ance-
stry Case Control Case Control
Fortune et al., 2015 rs1858037. SPRED2. 5112 12370 GBR
Beechman et al., 2013
rs1335532, rs11810217, rs4648356, rs11581062, rs7522462, rs1323292, rs12048904, rs233100, rs3761959, rs7595037, rs10201872, rs12466022, rs17174870, rs281783, rs669607, rs9282641, rs11129295, rs2293370, rs771767, rs4285028, rs4308217, rs10936599, rs9821630, rs2243123, rs1500710, rs228614, rs6821894, rs4613763, rs2546890, rs6897932, rs4075958, rs756699, rs1062158, rs350058, rs2302103, rs1738074, rs11154801, rs17066096, rs802734, rs13192841, rs12212193, rs9321490, rs11755724, rs854917, rs354033, rs6952809, rs1843938, rs11984075, rs2066992, rs2214543, rs2019960, rs4410871, rs1520333, rs6986386, rs290986, rs7090512, rs3118470, rs7923837, rs1250550, rs793108, rs7912269, rs650258, rs630923, rs4409785, rs7941030, rs694739, rs491111, rs1800693, rs12368653, rs10466829, rs806321, rs17594362, rs4902647, rs2119704, rs2300603, rs7200786, rs13333054, rs2744148, rs386965, rs11864333, rs9891119, rs180515, rs4792814, rs8081176, rs1373089, rs7238078, rs12456021, rs1077667, rs2303759, rs874628, rs307896, rs8112449, rs7255066, rs281380, rs2278442, rs2248359, rs2425752, rs6062314, rs2762932, rs2283792, rs140522, rs2072711.
102
CD58, EVI5, MMEL1, SLC30A7, C1orf106, RGS1, EXTL2, DDAH1, FCRL3, PLEK, SP140, MERTK, C2orf69, CD86, EOMES, TIMMDC1, NFKBIZ, SLC15A2, CD86, MYNN, PLCL2, IL12A, ARHGEF3, MANBA, SORBS2, PTGER4, IL12B, IL7R, RGS14, TCF7, NDFIP1, DIAPH1, TAGAP, AHI1, IL22RA2, PTPRK, BACH2, MYB, RREB1, RRAGD, ZNF767P, CHST12, CARD11, ELMO1, IL6, NDUFA4, PVT1, MYC, PKIA, TNKS, SYK, IL2RA, IL2RA, HHEX, ZMIZ1, ZNF438, KCNMA1, CD5, CXCR5, UBASH3B, PRDX5, TNFRSF1A, AGAP2, CLECL1, DLEU1, Vwa8, ZFP36L1, GPR65, BATF, CLEC16A, IRF8, SOX8, MAF, RMI2, STAT3, RPS6KB1, MAP3K14, RNF213, WNT9B, MALT1, ALPK2, TNFSF14, DKKL1, MPV17L2, SAE1, CDC37, PVR, MAMSTR, ICAM3, CYP24A1, NCOA5, ZBTB46, , MAPK1, ODF3B, NCF4.
95 9772 17376 4218 7296 CEU
Goris et al., 2013 rs2935183. 1 NPEPPS. 1 4088 12030 CEU
Leone et al., 2013. rs9320598.
1 C6orf167, MMS22L, KLHL32,
KIAA1900. 4 513 49 1684 200 CEU
Lill et al., 2013
rs228614, rs630923, rs2744148, rs180515, rs6062314. 5
MANBA, CXCR5, SOX8, RPS6KB1, ZBTB46. 5 CEU
Mero et al., 2013.
rs17411949, rs6659742, rs9283487,
rs3817963, rs3129871, rs3828840,
rs9271640, rs3129720, rs9275563. 9
CLSTN2, C10ORF204, PRKRA, BTNL2, HLA-DRA, HLA-DRB1, HLA-DQA1, HLA-DQB1, HLA-DQA.
9 1367 161 3029 374 CEU
Gourraud et al., 2013.
rs13279485, rs4669226, rs9568281, rs7924357, rs733724, rs17267338, rs17749211, rs1821625, rs12513380, rs4916321, rs533259, rs17090640, rs4271113, rs2920001, rs11026091, rs5978649.
16
ARHGEF10, LOC339788, ARL11, MMP10, HACE1, VTI1A, SAMD12, NAP5, TLL1, AK127238, RNASEL, LOC285501, TMEM47, DSC1, MRGPRE, EGFL6.
16 284 CEU

37
Table 1b. GWAS and meta-analysis studies of MS in 2011 and 2012.
Study (Reference) SNPs SNPs
nb Report gene(s) Genesnb
Initial Sample Size
Replication Sample Size Ance-
stry Case Control Case Control
Matesanz F, 2012. rs9292777. 1 PTGER4. 1 2127 4558 2785 2940 CEU
Martinelli-Boneschi F, 2012. rs3129934. 1 C6orf10. 1 197 234 379 398 CEU
Patsopoulos NA, 2011.
rs170934, rs2150702, rs6718520,
rs2300747, rs9260489, rs3129889,
rs12722489, rs2293152, rs6074022,
rs2546890, rs8070463, rs10411936,
rs2681424, rs7592330, rs1738074,
rs1250542, rs7191700, rs9596270,
rs10866713.
19
EOMES, MLANA, THADA, CD58, HLA-B, HLA-DRB1, IL2RA, STAT3, CD40, KPNB1, TBKBP1, TBX21, EPS15L1, ILDR1, CD86, PLEK, FBXO48, C2orf13, TAGAP, ZMIZ1, TNP2, PRM3, PRM2, PRM1, C16orf75, IL12B.
25 5545 12153 NA NA CEU
Sawcer S, 2011.
rs12368653, rs11154801, rs12456021, rs12212193, rs2300603, rs7522462, rs2293370, rs650258, rs1335532, rs9282641, rs8112449, rs6952809, rs7200786, rs10466829, rs630923, rs2248359, rs233100, rs2303759, rs806321, rs11129295, rs11810217, rs3761959, rs2119704, rs7923837, rs2243123, rs2546890, rs17066096, rs7090512, rs6897932, rs13333054, rs17594362, rs386965, rs7238078, rs281380, rs228614, rs4792814, rs2283792, rs17174870, rs4648356, rs874628, rs9321490, rs4410871, rs10936599, rs12466022, rs669607, rs13192841, rs4409785, rs2425752, rs1062158, rs771767, rs140522, rs1520333, rs9821630, rs7595037, rs4613763, rs802734, rs7255066, rs2019960, rs1323292, rs4075958, rs180515, rs11755724, rs307896, rs11581062, rs2744148, rs10201872, rs9891119, rs290986, rs1738074, rs756699, rs1077667, rs6062314, rs4902647, rs1250550, rs793108, rs354033, rs12048904, rs4285028, rs4308217, rs3118470.
80
AGAP2, CYP27B1, AHI1, ALPK2, BACH2, BATF, C1orf106, KIF21B, C3orf1, TMEM39A, CD5, CD6, CDC37, TYK2, CHST12, CLEC16A, CLECL1, CXCR5, CYP24A1, DDAH1, DKKL1, DLEU1, EOMES, EVI5, EXTL2, FCRL3, GPR65, HHEX, IL12A, IL12B, IL22RA2, IRF8, KIAA0564, MAF, MALT1, MAMSTR, MANBA, NFKB1, MAP3K14, MAPK1, MERTK, MMEL1, MPV17L2, MYB, MYC, MYNN, OLIG3, NCOA5, CD40, NDFIP1, NFKBIZ, ODF3B, SCO2, PKIA, IL7, PLCL2, PLEK, , PTPRK, THEMIS, PVR, PVT1, RGS1, RGS14, RPS6KB1, RREB1, SAE1, SLC30A7, VCAM1, SOX8, SP140, SYK, TAGAP, TCF7, TNFSF14, ZBTB46, ZFP36L1, ZNF438, ZNF767, ZNF746, EXTL2, VCAM1, SLC15A2, CD86, CD86, DRB1.
85 9772 16849 4218 7296 CEU
Briggs FB, 2011.
rs12644284, rs17149161, rs7789940, rs758944, rs7779014, rs11962089.
6 TRIM2, YWHAG, POPDC3. 3 1470 NA NA NA CEU
Wang JH, 2011. rs4939490, rs12025416, rs931555. 3 CD6, CD58, IL7R. 3 2124 6720 1618 1988 CEU
38
Study (Reference) SNPs
SNPs numbe
r Report gene(s)
Genesnumb
er
Initial Sample Size
Replication Sample Size Ances
-try Case Contr
ol Case Control
Baranzini et al., 2010. rs794185, rs8074980, rs2038256,
rs13117816, rs8007846. 5
SUMF1, CUEDC1, FOXG1B, FLJ11017,
FUT8. 5 382 NA NA
Nischwitz S et al., 2010.
rs9271366, rs3780792, rs2503875,
rs3745672. 4 DQA1, VAV2, ZNF433. 3 590 825 NA NA CEU
Sanna et al., 2010. rs9657904, rs2040406. 2 CBLB, HLA-DRB,HLA-DQB1. 2 882 872 1775 2005 SARD
Jakkula et al., 2010. rs744166, rs3135338. 2 STAT3, HLA. 2 68 136 1202 3399 FLN
Brynedal et al., 2010 rs4953911. 1 MGAT5. 1 1040 873 CEU
Bahlo et al.,, 2009.
rs703842, rs6074022, rs9271366, rs1335532, rs6604026, rs2104286, rs6984045, rs8049603.
8 METTL1, CYP27B1, CD40, HLA-DRB1, CD58, EVI5, RPL5, IL2RA, ASAP1, DDEF.
10 1618 3413 2256 2310 CEU
De Jager et al., 2009.
rs3135388, rs2523393, rs2300747, rs2104286, rs11865121, rs6897932, rs4149584, rs17445836, rs17824933, rs882300, rs6896969, rs1790100, rs1250540, rs4680534, rs1800693.
15
HLA-DRB1, HLA-B, CD58, IL2RA,
CLEC16A, IL7R, , IRF8, CD6, CXCR4,
PTGER4, MPHOSPH9, ZMIZ1, IL12A,
TNFRSF1A.
14 2624 7220 2215 2116 CEU
Baranzini et al., 2008.
rs397020, rs1458175, rs1529316, rs908821, rs1755289, rs651477, rs7672826, rs1841770, rs1109670, rs9523762, rs1386330, rs17157903, rs2116078, rs1557351, rs2842483, rs12047808, rs4704970, rs1437898, rs12638253, rs1478091, rs299175, rs10259085, rs10518025, rs6941421, rs7191888, rs180358, rs10243024, rs337718, rs7253363.
29
C20orf46, PDZRN4, CSMD1, SLC25A36, SH3GL2, EN1, MGC45800, ZIC1, DDEF2, GPC5, RAB38, RELN, KCNB2, WDR7, RFK, C1orf125, SGCD, FLJ34870, FLJ16641, LOC132321, NLRP11, C1GALT1, CENPC1, JARID2, C16orf47, MGC13125, MET, CBLN2, ACP5.
29 978 883 NA NA CEU
Aulchenko et al., 2008. rs10492972. 1 KIF1B. 1 45 195 1316 1423 CEU
Comabella et al., 2008. rs3129934. 1 HLA-DRB1. 1 242 242 553 1033 CEU
Hafler et al., 2007.
rs12722489, rs6897932, rs6498169,
rs6604026, rs10984447, rs3135388. 6 IL2RA, IL7RA, KIAA0350, RPL5, DBC1,
HLA-DRA. 6 931 2431 609 trios, 2322
2987 CEU
Table 1c. GWAS and meta-analysis studies of MS from 2007 to 2010.

39
MS associated loci
HLA-locus
Many association studies based first on serological typing and newly on GWAS have been
associated MS and other autoimmune diseases with HLA-DR/DQ genes. However, it was
very difficult to detect the allele risk because of the strong LD across the HLA region. This
Class II association has been mapped to the DRB5*0101- DRB1*1501-DQA1*0102-
DQB1*0602 haplotype in the North European population (Fogdell et al., 1995). These alleles
are almost always present together in this population, making it impossible to distinguish the
primary association. The mechanism for the strong LD in these HLA haplotypes has been
shown to be consistent with a functional epistatic interaction
between DRB1*1501 and DRB5*0101 alleles. Also, this functional epistasis has been
demonstrated to be associated the EAE in mice (Gregersen et al., 2006).
Further, association studies in African-American populations have suggested that the
DRB1*1501 allele itself determines MS-associated susceptibility (McElroy et al., 2010).
However, in other populations, the risk allele or haplotype is different or does not
contain DRB1*1501 as in Sardinians where MS is associated with the DRB1*0301–
DQA1*0501–DQB1*0201 and DRB1*0405–DQA1*0501–DQB1*0301 haplotypes (Marrosu
et al 1998) , or in African–Brazilian MS patients where the strongest association was
observed with DQB1*0602 rather than DRB1*1501 (Caballero et al., 1999). In Caucasians,
heterogeneity at the DRB1 locus has also been found with respect to MS risk (Barcellos et al.,
2006). In Canadian MS families it has been observed that some DRB1*1501haplotypes
determine susceptibility while others do not (Chao et al., 2008) and
that DRB1, DQA1 and DQB1 alleles contribute to MS susceptibility through epistatic
interactions suggesting haplotypic rather than allelic HLA association (Lincoln et al., 2009).
As DRB1 alleles have different structural properties for antigen presentation according to their
amino acid sequence, MS-HLA association has been used to support the concept that disease
pathogenesis is the result of an autoimmune reaction, perhaps against myelin-related antigens
in the restricting context of DRB1*1501 (Smith et al., 1998). However, this structural theory
alone does not fully explain the association study results in MS. The description of
polymorphisms that alter HLA gene expression (Vincent et al., 1996) , identification of
several cis-acting genetic variants on expression of HLA class II genes (Schadt et al., 2008)
(Dixon et al., 2007) as well as the recent observation that vitamin D may

40
influence DRB1*1501 expression via a vitamin D response element (Ramagopalan et al.,
2009), makes it possible that association of HLA class II polymorphisms with MS may be
related to the levels of gene expression to the same or a greater extent than restriction of
antigen response.
The HLA represents the largest genetic association to MS susceptibility, however it is not yet
completely understood how can alert the risk developing of the disease. (Ramagopalan et al.,
2009; Handunnetthi et al., 2010)
Non-HLA loci
In the last few years, a large number of non-HLA loci have been associated with MS
(Baranzini et al., 2010). In 30% of the associated regions, the nearest gene to the associated
SNP is an immune system gene. Such as genes coding for cytokine pathway
(CXCR5, IL2RA, IL7R,IL7, IL12RB1, IL22RA2, IL12A, IL12B, IRF8, TNFRSF1A, TNFRSF14
, TNFSF14), co-stimulatory molecules (CD37,CD40, CD58, CD80, CD86, CLECL1) , signal
transduction molecules of immunological relevance
(CBLB, GPR65, MALT1, RGS1, STAT3,TAGAP, TYK2), genes encode protein related with
environmental risk factors of MS and implicated in the immune system response such as
vitamin D (CYP27B1, CYP24A1), genes encode immunological molecules implicated in the
MS therapies (VCAM1, IL2RA), genes involved in neurodegeneration independent of
inflammation (GALC, KIF21B) (Sawcer et al., 2011), and genes that may be involved in the
pathogenesis of acute promyelocytic leukemia and viral infection such as (SP140) (ANZgene,
2009; Pierrot-Deseilligny , Souberbielle, 2010).
eQTLs in GWAS analysis
GWASs have shown a large number of genetic variants associated with complex diseases.
The identification of the causal variant within an associated locus is complex task because
most of the GWAS loci contain multiple genes, or no genes at all, or they are often in a high
linkage disequilibrium (LD) . In addition, some trait associated SNPs have no effect on the
protein structure, or they are located in non-coding regions, such variants could have a
regulatory function. For these reasons it is difficult to identify the causal variant for each
locus through traditional fine-mapping methods (Westra and Franke, 2014).
So, in order to identify which genes are regulated by genetic variation, in 2001 it has been
introduced the concept of ‘genetical genomics’ (Jansen and Nap, 2001). This concept is

41
based on the correlation between the genetic variants and intermediate molecular quantitative
traits, such as gene expression levels, protein levels or methylation levels. It is possible to
identify quantitative trait loci (QTLs). The easiest to quantify is the mRNA levels by
microarrays and more recently by RNA sequencing (RNA-Seq), reflecting the profile of genes
expression. The genetic variants that affect gene expression levels are expression quantitative
trait loci "eQTLs"(Farrall, 2004)
In consequence, the new strategy to identify the candidate gene(s) is combining the QTL
information from all genes and gene products. It will indicate the portion of the genes
expression affected by the genes themselves (cis-eQTLs), or to other genomic location (trans-
eQTLs) (Jansen and Nap, 2001).
Many studies have recently analyzed such variants in the context of gene expression measured
in cells or tissues to understand inherited susceptibility to disease. These studies have
spawned a big field in human genetics studying expression quantitative trait loci (eQTLs).
The majority of human eQTL studies have been performed on blood-derived cells or cell
lines. The two biggest and most important projects in this field are GUEVADIS and GTEx
projects (Table 2).
GEUVADIS project
GEUVADIS (Genetic European Variation in Health and Disease) is an RNA-sequencing
project (Lappalainen et al. Nature 2013) which has combined transcriptome and genome
sequencing data by performing mRNA and small RNA sequencing on 465 lymphoblastoid
cell line samples from 5 populations of the 1000 Genomes Project: the CEPH (CEU), Finns
(FIN), British (GBR), Toscani (TSI) and Yoruba (YRI). Of these samples, 423 were part of
the 1000 Genomes Phase 1 dataset (Abecasis et al. Nature 2012) with low-coverage whole
genome and high-coverage exome sequencing data, and the remaining 42 are part of the later
phases of 1000 Genomes with Omni 2.5M SNP array data available at the time of this study;
these genotypes were imputed from the array data using Phase 1 as the reference.
Additionally, GEUVADIS project developed a browser
(http://www.ebi.ac.uk/Tools/geuvadis-das/) for visualization and download of exon and
transcript quantifications of protein-coding genes and miRNAs, and quantitative trait loci
(QTL) for exon expression levels (eQTL), transcript ratios (trQTL), and miRNA expression
levels (mirQLTs)

42
The GTEx Project
GTEx (Genotype-Tissue Expression) project studies the correlations between genotype and
tissue-specific gene expression. This project collected and analysed multiple human tissues
from donors (1421 RNAseq samples) who were also densely genotyped, to assess genetic
variation within their genomes. By analyzing global RNA expression within individual tissues
and treating the expression levels of genes as quantitative traits, 24339 significant eQTLs
were determined, between them 8930 unique genes. GTEx project used genome-wide
association studies (http://www.ebi.ac.uk/gwas) to identify genetic changes associated with
common human diseases.
The comprehensive identification of human eQTLs helped greatly to identify genes whose
expression was affected by genetic variation, and provided a valuable basis on which to study
the mechanism of gene regulation. This project provided a browser of its database
(http://www.gtexportal.org/) which allows users to view and download computed eQTL.

43
Table 2 The eQTL studies from 2007 to 2015.
Study reference Cell/Tissue Sample size Ancestry Method
GTEx Consortium, 2015
Adipose 113
Any racial and ethnic group
RNA-seq
Adrenal Gland 12 Artery 145 Brain 313 Breast Mammary tissue 27 LCLs 39 Fibroblasts 14 Colon Transverse 12 Esophagus 38 Fallopian tube 1 Heart 108 Kidney Cortex 3 Liver 5 Lung 119 Muscle Skeletal 138 Nerve Tibial 88 Ovary 6 Pancreas 19 Pituitary 13 Prostate 9 Skin Not sun exposed 23 Skin Sun exposed 96 Stomach 12 Testis 14
Thyroid 105
Uterus 7
Vagina 6 Whole blood 156
Fairfax et al., 2014 Monocytes (LPS and/or IFN-Y) 432 CEU RNA -Chip
Lappalainen et al, 2013 (GEUVADIS) LCLs 465 CEU, FIN, GBR, TSI
and YRI. RNA-seq
Pique-Regi et., al, 2012 LCLs 70 YRI DNase sensivity QTLs
Pickrell et al., 2010 LCLs 69 YRI RNA-seq
Gaffney et al., 2012 LCLs 210 CEU, CHB, JPT and YRI. RNA-Chip
Innocenti et al., 2010 Liver 266 AFR, CEU RNA-Chip Montgomery et al., 2010 LCLs 60 CEU RNA seq for transcript
QTL Zeller et al., 2010 Monocytes 1490 German RNA-Chip
Dimas et al., 2009 Fibroblasts 75 CEU
Veyrieras et al., 2008 LCLs 210 CEU, CHB, JPT, YRI and ASN.
Schast et al., 2007 Liver 427 CEU
Myres et al., 2007 Brain cortex 279 CEU
Stranger et al., 2007 LCLs 210 CEU, CHB, JPT and YRI.

44
Objectives and justification GWASs have shown a large number of genetic variants significantly associated with MS in
several loci. Though some of the variants identified may actually represent the genetic
alteration responsible for the disease association, most of these SNPs merely ‘tag’ an allele of
a nearby gene (or a haplotype of a genetic region), which is actually the base of the observed
disease relationship “the causal variant”. The identification of the causal variant within an
associated locus is complex task because most of the GWAS loci contain multiple genes, or
no genes at all, or they are often in high linkage disequilibrium (LD). Thus, the main
objective of this work was to determine the causal variants of the loci associated with MS by
GWAS studies and reveals, by the analysis of the functional effect of the causal variant, the
genes implicated and their effect in the disease.
Specific objectives:
1- To determine the functional effect of the MS causal variant in the 12q13-14 locus on the
transcription of the gene CYP27B1.
2- To determine the effect of MS associated variants on the transcription of genes implicated
in vitamin D function as vitamin D receptor (VDR) and vitamin D degradation (CYP24A1).
3- To determine the potential relation in expression of the different genes of the vitamin D
pathway under different conditions.
4- To determine which MS associated variants are eQTLs.
5- To determine the causative variant of the 2q37.1 locus.
6- To validate the effect of the MS causal variant at the 2q37.1 locus on the splicing of SP140
gene.
7- To validate this association in a Spanish cohort through case-control study.
8- To determine of the possible common causal variant at the 12p13.31 locus.

45
Materials and Methods

46
Samples collection 25 ml of Buffy coat (50ml of whole blood) were collected from 119 healthy individuals
subjects (voluntary blood donors: 67 females and 52 males) between the ages of 20–65.
Samples were collected from Spanish subjects.
109 LCLs (lymphoblastoid cell lines) from 94 CEU (Utah residents with Northern and
Western European ancestry from the CEPH collection, International Hapmap Project) and 15
TSI (Tuscan in Italy, 1000 Genomes and International Hapmap projects) were purchased
from Coriell cell repositories (Coriell Institute for Medical Research, NJ, USA).
Monocyte separation Peripheral blood mononuclear cells (PBMC) were obtained by density gradient
centrifugation, using Histopaque (Sigma), cells were washed two times in phosphate-buffered
saline (PBS) solution without Ca2+ and Mg2+. Then, monocytes were isolated from PBMC by
positive selection using anti-CD14 (MicroBeads, anti-human CD14 MACS, Miltenyi). This
method provides a sample of ~99% purity. 2.106 of purified CD14+ were rested overnight (12
hours) in 25cm2 flask (Cell Culture Treated Flasks, Thermo Scientific) at 37°C, 5% CO2 in
5ml RPMI 1640 complete medium (Supplemented with 10% fetal calf serum,
penicillin/streptomycin, and L-glutamine).
LCLs culture 1.106 cells per well were incubated in plates (Nunclon 12-Well PS MultiDish, Thermo
Scientific) at 37°C, 5% CO2 in 2ml RPMI 1640 complete medium, supplemented with 10%
fetal calf serum, penicillin/streptomycin, and L-glutamine.
Cell stimulation After overnight resting, CD14+ cells were stimulated with 2 ng/ml Interferon-gamma (IFNγ,
Roche) and 20 ng/ml Lipopolysaccharide (LPS, Sigma) for 24 hrs.
LCLs were treated with 200 nM 1α,25-dihydroxyvitamin D3 (1,25(OH)2D, Sigma) or with
500nM 25-hydroxyvitamin D3 monohydrate (25(OH)D, Sigma) for 24 hours.
RNA extraction Total RNA was extracted using the RNeasy Mini Kit from cells collected in the RLT buffer
following the manufacturer’s instruction (Qiagen). Then RNA was quantified and qualified

47
by the Experion automated electrophoresis system (Bio-Rad), the RNA quality indicator
(RQI) was 10 (intact RNA) for all RNA samples.
Genotyping Genomic DNA was isolated from 300 µL buffy coat samples of healhy controls used for
monocyte purificaion with FlexiGene DNA Kit (Qiagen). DNA was diluted to 10ng/ul with
RNase-/DNase-free water and analyzed by real-time PCR using the TaqMan Genotyping
Master Mix (Applied Biosystems) and primer sets (Life Technologies) for rs10877013
(CYP27B1), rs10466829 (CLECL1) and rs3764022 (CLEC2D). (Table 3)
The genotype data of 109 LCLs (CEU and TSI) were obtained from the 1000 GenomeS and
Hapmap projects database.
Table 3. TaqMan SNPs Genotyping Assay Data from Life Technology.
PCR cDNA was generated by reverse transcriptase PCR using Superscript III First-Strand
Synthesis SuperMix (Invitrogen) from 150 ng of total RNA. Then, CYP27B1, CYP24A1,
VDR, SP140 and CLE2D mRNA levels were quantified by real-time PCR using Go Taq
qPCR Master Mix (Promega) and normalized to UBE2D2 mRNA levels using 2-ΔCT method.
Reactions were run in triplicate. The primers sequences of studied genes were designed using
Primer3 browser (Table 4).
Gene primers Forward (5'-3') Reverse (5'-3') CYP27B1 CCAGACAGCACTCCACTCAG ACAGAGTGACCAGCGTATTT CYP24A1 CATCATGGCCATCAAAACAAT GCAGCTCGACTGGAGTGAC VDR TCCTCCTGCTCAGATCACTG AGGGTCACAGAAGGGTCATC SP140 E6:E8 CAGTTAGCTCTCCCAAAGGC CTGTGCTGTATGTCCTTGCC SP140 E6:E7_8 TGGTGGAGGAGATGCTGAAG CCGTTGCTTTCTAGAACTTC SP140 E6_8:E8 CTACCAGGTGGGGGAGTTCT TTCCCTCTGGACTCTCTTGG CLEC2D E1:E3 CATCTGAATTGCCTGCAAAC CAACCTGAGCAAGATCAGCA CLEC2D E1_3:E3 TTGCCTGCAAACCCAGCAAT CAACCTGAGCAAGATCAGCA UBE2D2 CAATTCCGAAGAGAATCCACAAGGAATTG GTGTTCCAACAGGACCTGCTGAACAC
Table 4 The primers sequences of studied genes.
SNP Gene Assay ID Context Sequence [VIC/FAM]
rs10877013 CYP27B1 C_25985808_10 AGAAGCATGAGAAGGTTGGTCACAC[C/T] ATTGCAGAAGTGGTACTGTGAGAGT
rs10466829 CLECL1 C_30127235_10 ACATGACCTGAAGCCATTGAAGAGT[A/G] AACAAAGCCAGACAGATTCTAGAGG
rs3764022 CLEC2D C_25992569_10 TTTTCAATAATTTTTTCCAGGTTGT[C/G] TGCATTCAAAAGAGCATTCTATTAA

48
Exon-Trapping analysis
Exon-Trapping analysis was performed as described by Desviat et al. (33). Briefly: PCR
amplification of a DNA fragment containing the exon 7 of SP140 gene (78bp) and the
flanking intronic sequences of 103bp at the 5’ and 75bp at the 3’ of the exon was done. The
primers for this amplification were: forward 5'- CCCGAATATTAGAGCTCAGCA-3' and
reverse 5'- TGGGAAGGGAGATGAAAGAG-3'. The amplification of the DNA fragment was
performed from the LCL NA12383 which is heterozygous for the rs28445040 variant. The
PCR product was cloned in TOPO-TA vector and sequenced to identify the clones carrying
each allele and to discard potential PCR errors. An EcoRI fragment from each TOPO vectors
was subcloned in the EcoRI site of the pSPL3 minigene plasmid and orientation checked by
sequencing. 1ug allele T and allele C pSPL3 (pC, pT) plasmids and plasmid without insert
(p) were transfected in HEK cells using jetPRIME (Polyplus) and harvested 24 h after
transfection. 10 ug from the same plasmids were transfected in 1,5.106 LCL cells by
electroporation using the Mirus Ingenio kit , Amaxa® Nucleofector® II Device with the
program M-013, 4 hours after, cells were activated with 200nM 1,25(OH)2Dfor 24 h. RNA
was extracted and amplified by RT-PCR using SD6 and SA2 primers. The PCR products
were visualized in 2% agarose gel electrophoresis and sequenced to confirm the DNA origin.
Statistical analysis
LD patterns between SNPs were analyzed with Haploview 4.2 (Barrett, J.C., 2005).
All real-time PCR mRNA expression was measured relative to UBED2D and, error margins
were calculated using the standard error.
Mean mRNA values from different experimental conditions were compared by using the
Student’s t test.
The association between gene expression and SNP was tested using Spearman’s rank
correlation test Sig. (2-tailed) .This method has been previously shown to produce robust
results and avoids the effect of outliers in gene expression values (Dimas AS , 2009).
The association between genes expression and genome loci was tested using Genetranassoc
software (http://bios.ugr.es/Genetranassoc/), the software to compute association (Spearman
correlation coefficient, including permutation test) using 1000 Genomes and Hapmap SNp
genotype data.
A direct link between the studied genes expressions was tested using Pearson’s linear
correlation.

49
Results
50
Determination of the causal gene in the 12q13-14 locus responsible for the association with MS
The MS-GWAS associated variants correlate with the expression of several genes in the locus
For many risk loci, the association signals do not directly implicate a single gene and the
causative role for candidate genes in the region can only be speculated. One of these loci is
12q13–14 which has been associated in GWAS with rheumatoid arthritis (RA) (Okada Y et
al., 2014; Orozco G et al.2014; Zhernakova et al., 2011; Raychaudhuri et al. 2014), celiac
disease (CD) (Zhernakova et al., 2011) and MS (Sawcer et al., 2011) (Bahlo et al., 2009)).
However, different genes have been suggested in each study based on the main associated
signal. A meta-analysis of two published GWAS totalling 3393 RA cases and 12 462 healthy
controls identified an association at rs1678542 localised in the KIF5A intronic region
(Raychaudhuri et al., 2008). Another meta-analysis of two published GWAS on CD (4533
cases and 10 750 controls) and RA (5539 cases and 17 231 controls) described the association
of both diseases at rs10876993 localized in the intergenic region between B4GALNT1 and
OS9 genes (Zhernakova et al., 2011). Association at this locus was also described in a MS
GWAS performed by the Australian and New Zealand Multiple Sclerosis Genetics
Consortium (ANZgene) in 1618 MS-cases. In this case, an associated SNP (rs703842) was
located at the 3' untranslated region (3' UTR) of the METTL1 gene (Bahlo et al., 2009). The
last GWAS performed by the International Multiple Sclerosis Genetics Consortium (IMSGC)
with 10 000 MS patients also reported the association with this region at rs12368653 in
theAGAP2 gene (Sawcer et al., 2011). In candidate gene studies, the KIF5A variant was
demonstrated to be associated to MS (Raychaudhuri et al., 2008) and type 1 diabetes (Fung et
al., 2009). Also rare variants in the CYP27B1 gene have been associated with MS
(Ramagopalan et al., 2011). Other candidate-gene studies had demonstrated association of
variants located at the CYP27B1 gene with type 1 diabetes (Bailey et al. 2007) and MS
(Sundqvist et al., 2010). In previous work we performed a fine mapping of the 12q13.3–
12q14.1 region by a Tag-SNP approach determining a functional variant which alters the
enhancer activity of a regulatory element in the locus affecting the expression of several
genes and explains the association of the 12q13.3–12q14.1 region with MS (Fig.11). This
SNP, rs10877013, was in total LD with other polymorphisms that associated with the
expression levels of FAM119B, AVIL, TSFM, TSPAN31 and CYP27B1 genes in different
eQTL studies.

51
Figure 11. Enhancer-suppressor activity of the rs10877013 variant. (A) Schematic illustration to show the localization of the six tagged SNPs (in red) in potential regulatory regions (in black, I to VI) as indicated by ENCODE for the GM12878 lymphoblastoid cell line and the genes present in the region: Enhancer H3K4Me1 track shows where modification of histone proteins is suggestive of enhancer; Promoter H3K4Me3 track shows a histone mark associated with promoters; Layered H3K4Me3 track shows histone mark associated with promoters that are active or poised to be activated; DNase Clusters track shows regions where chromatin is hypersensitive to DNase I enzyme; Txn Factor ChIP track shows DNA regions where transcription factors
bind to DNA as assayed by chromatin immunoprecipitation (ChIP) with antibodies specific to the transcription factor followed by sequencing of the precipitated DNA (ChIP-Seq). (B) Luciferase activity of the different constructs corresponding to the six regions (I to VI) with potential regulatory activity, containing tagged polymorphisms transfected into Raji B cells. Four clones for each region bearing the different alleles (allele m, minor and M, major) and in both orientations (Forward and Reverse) from three independent transfection experiments are represented. Luciferase activity levels are referred to the level of the control plasmid containing only the basic promoter and the Renilla activity. (C) Expression of different genes in the 12q13.3-12q14.1 region correlate with rs10877013 SNPs .In the plot are represented the media and standard deviation respect to genotypes of rs10877013, for FAM119B,TSFM, AVIL and TSPAN31 genes obtained by Zeller et al. from monocytes obtained from 1490 German individuals.

52
Determination of the effect of the MS-associated variant on the CYP27B1 expression
Given that the variant associated with MS in the region is correlated with the expression of
various genes in the locus, it is difficult to determine which of those genes is implicated in the
pathology. However, given the critical role of Vitamin D in MS pathology, the candidate gene
with high potency in the region would be CYP27B1. This enzyme catalyses the conversion of
25(OH)D to 1,25(OH)2D.
The CYP27B1 gene is expressed in proximal tubule cells of the kidney and the disease-
activated macrophages, which are the major source of CYP27B1 (Adams and Hewison,
2012). In order to determine the potential connection between the variant genotypes, gene
expression and MS disease, we studied the relationship between the rs10877013 genotypes
and the expression of CYP27B1 when in immune cells were challenged by inflammatory
stimuli as IFNγ and LPS, or active form of vitamin D (1,25(OH)2D).
For this study we used CD14+ monocytes, genotyped for the rs10877013, purified from blood
of 119 individuals and 109 LCLs of the HapMap-1000 Genomes collection with known
genotypes.
CD14 monocytes did not express CYP27B1 gene after extraction. However when CD14
stimulated with LPS (2 ng/ml) and IFNγ (20 ng/ml), CYP27B1 was highly up-regulated
(P<0.0005) (Fig.12A) reaching a peak after 24-36 h of stimulation (Fig.11B). CYP27B1
mRNA expression levels was associated with the rs10877013 genotypes in 119 samples of
stimulated CD14+ monocytes. High expression of CYP27B1 was clearly associated with the
MS protective genotype (rs10877013-T allele), consequently the low level was associated
with the MS risk allele rs10877013-C (Spearman correlation rho= 0.4, P=5.0E-6) as shown in
(Fig.12C).
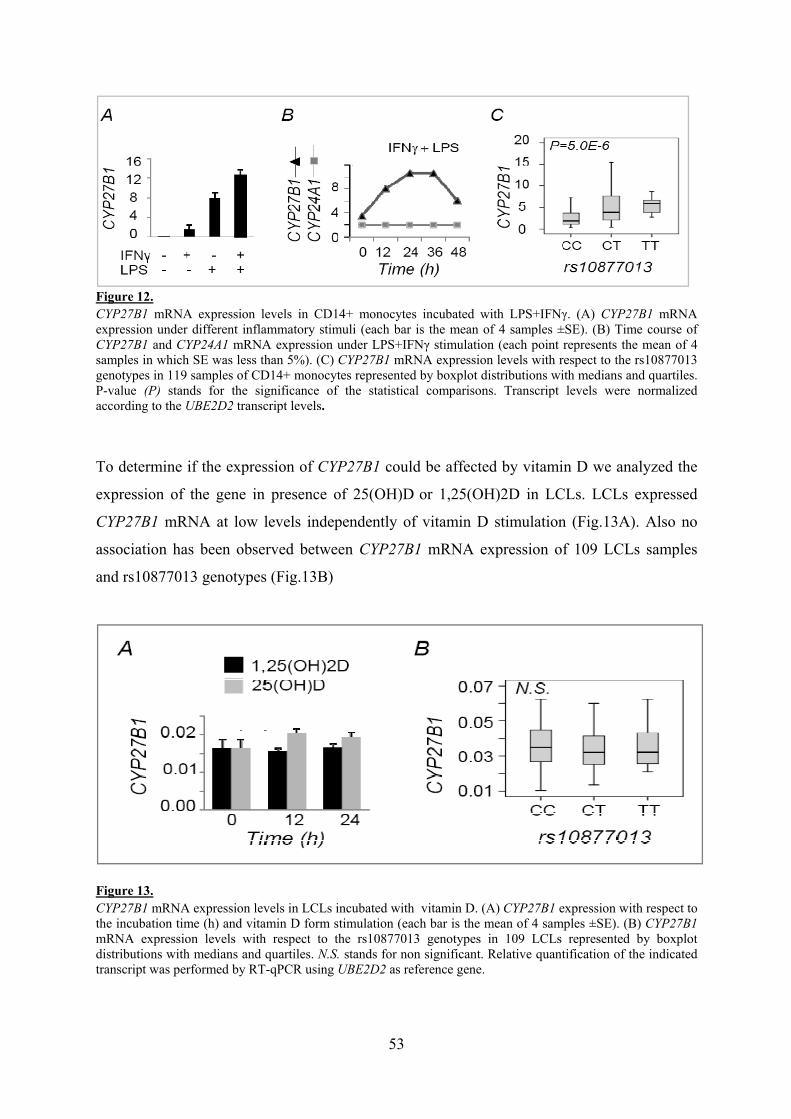
53
Figure 12. CYP27B1 mRNA expression levels in CD14+ monocytes incubated with LPS+IFNγ. (A) CYP27B1 mRNA expression under different inflammatory stimuli (each bar is the mean of 4 samples ±SE). (B) Time course of CYP27B1 and CYP24A1 mRNA expression under LPS+IFNγ stimulation (each point represents the mean of 4 samples in which SE was less than 5%). (C) CYP27B1 mRNA expression levels with respect to the rs10877013 genotypes in 119 samples of CD14+ monocytes represented by boxplot distributions with medians and quartiles. P-value (P) stands for the significance of the statistical comparisons. Transcript levels were normalized according to the UBE2D2 transcript levels.
To determine if the expression of CYP27B1 could be affected by vitamin D we analyzed the
expression of the gene in presence of 25(OH)D or 1,25(OH)2D in LCLs. LCLs expressed
CYP27B1 mRNA at low levels independently of vitamin D stimulation (Fig.13A). Also no
association has been observed between CYP27B1 mRNA expression of 109 LCLs samples
and rs10877013 genotypes (Fig.13B)
Figure 13. CYP27B1 mRNA expression levels in LCLs incubated with vitamin D. (A) CYP27B1 expression with respect to the incubation time (h) and vitamin D form stimulation (each bar is the mean of 4 samples ±SE). (B) CYP27B1 mRNA expression levels with respect to the rs10877013 genotypes in 109 LCLs represented by boxplot distributions with medians and quartiles. N.S. stands for non significant. Relative quantification of the indicated transcript was performed by RT-qPCR using UBE2D2 as reference gene.

EffecVDR ge
Figure 1Localisat
VDR m
stimulat
(P<0.00
in 119 s
Figure 1VDR mRmRNA ethe rs108quartiles.a referen
VDR m
observe
of incub
with rs1
t of the gene is locate
4. tion of VDR an
mRNA expre
ted with IFN
005). Howe
samples of C
15. RNA expressioexpression (ea877013 genoty. N.S. stands fce gene.
mRNA was
ed in LCLs
bation (Fig.
10877013 g
genetic ved on the ch
nd CYP27B1
essed at low
Nγ+LPS, VD
ever, VDR m
CD14+ mon
on levels in Cach bar is the mypes in 119 afor non signifi
s transcribe
treated with
16A). In ad
genotypes in
variants hr12 approx
genes respect
w level in un
VDR express
mRNA was
nocytes, as
CD14+ monocmean of 4 samactivated monficant. Relative
ed at low l
h 200 nM o
ddition, VDR
n 109 LCLs
54
on the Vximately 10
t to the functio
nstimulated
sion was hig
not associa
shown in (F
cytes incubatedmples ±SE). nocytes represe quantificatio
level in un
of 1,25(OH)
R mRNA ex
(Spearman
VDR expMb from C
onal variant rs
d CD14+ m
ghly up-regu
ated with rs
Fig.15B).
d with LPS+ (B) VDR mRNsented by boxon was perfor
ntreated LC
)2Dafter 12h
xpression sh
n's rho=0.32
pression CYP27B1 (F
s10877013 on
monocytes (F
ulated after
s10877013 g
IFNγ for 24hNA expressioxplot distributrmed by RT-q
CLs. A sig
h (P<0.005)
howed a sig
28, P=6.03E
Fig.14).
chr 12.
Fig.15A) wh
r 24 h of stim
genotypes (
. (A) Inductioon levels with tions with me
qPCR using UB
gnificant in
) and 24 h (
gnificant ass
E-4) (Fig.16B
hen they
mulation
(P=0.34)
on of VDR respect to
edians and UBE2D2 as
ncreasing
(P<0.05)
sociation
B).

55
Figure 16. VDR mRNA expression in LCLs incubated with both forms of vitamin D. (A) VDR expression with respect to the incubation time (h) and vitamin D form stimulation (each bar is the mean of 4 samples ±SE). (B) VDR expression levels with respect to the rs10877013 genotypes in 109 LCLs treated with 200nM 1,25(OH)2D represented by boxplot distributions with medians and quartiles. P stands for significance. Relative quantification was performed by RT-qPCR using UBE2D2 as a reference gene.
The effect of the genetic variants on the CYP24A1 expression CYP24A1 gene is located on the locus 20q13.2 between PFDN4 gene and BCAS1 gene
(Homo sapiens breast carcinoma amplified sequence 1). rs2248359 has been associated to
MS (risk allele, rs2248359-C) (Sawcer S, 2011), it is located 1Kbp upstream of CYP24A1
(Fig.17) In addition this locus was associated to bipolar disorder (BD) and schizophrenia
(SCZ) with rs2276498 (Wang et al., 2010), IgG glycosylation with rs6064045 (Lauc et al.,
2013), calcium level (CaL) with rs1570669 (O´Seaghdha et al., 2013), atopic dermatitis (AD)
with rs16999165 (Hirota et al., 2012) and Obesity related trait with rs2585417 (Comuzzie et
al., 2012).
Figure 17. Schematic representation of the 20q1.2 locus (chr20:52469742-53162587), from the UCSC Genome Browser on Human Feb. 2009 (GRCh37/hg19) Assembly. Trait GWAS from GWAS catalog. rs2248359 MS was associated with MS in GWAS. UCSC Genes (RefSeq, GenBank, CCDS, Rfam, tRNAs & Comparative Genomics).

56
CYP24A1 was characterized as a highly cell-specific and stimulus-specific inducible gene.
CD14+ monocytes did not express CYP24A1 in unstimulated CD14+ or in incubated CD14+
with several inflammatory stimuli, including IFNγ+LPS (Fig.12B). On the other hand, LCLs
expressed CYP24A1 only after stimulation with the active form of vitamin D (1,25(OH)2D).
In order to determine the most optimal vitamin D concentration to induce CYP24A1, LCLs
were incubated with different concentrations of 1,25(OH)2D or 25(OH)D. (Fig.18A).
1,25(OH)2D(200nM) stimulation led to a significant induction of CYP24A1 expression at 12
h (p<0.005) and 24h (P<0.0005). However, 25(OH)D (500nM) didn’t modify the
transcription level of CYP24A1 (Fig. 18B). Additionally, adding both of vitamins D forms
had the same effect as 1,25(OH)2D (no significant difference) (Fig.18C).
Furthermore, CYP24A1 mRNA levels were analyzed depend on the SNPs genotypes in the
region chr20:52561127-53253972. However, no association was observed between the
expression levels and the SNPs genotypes in this region including the GWAS MS-associated
rs2248359 (p=0.81) (Fig.18D)
Figure 18. CYP24A1 mRNA expression in LCLs incubated with both forms of vitamin D. (A) mRNA expression with respect to different vitamin D concentration [VitD] and (B) incubation time (h) (each bar is the mean of 4 samples ±SE). (C) The effect of both vitamin D forms on CYP24A1 expression. (D) mRNA expression levels with respect to the rs2248359 genotypes in 109 LCLs treated with 1,25(OH)2D represented by boxplot distributions with medians and quartiles. N.S., stands for non significant. Relative quantification was performed by RT-qPCR using UBE2D2 as a reference gene.
C D
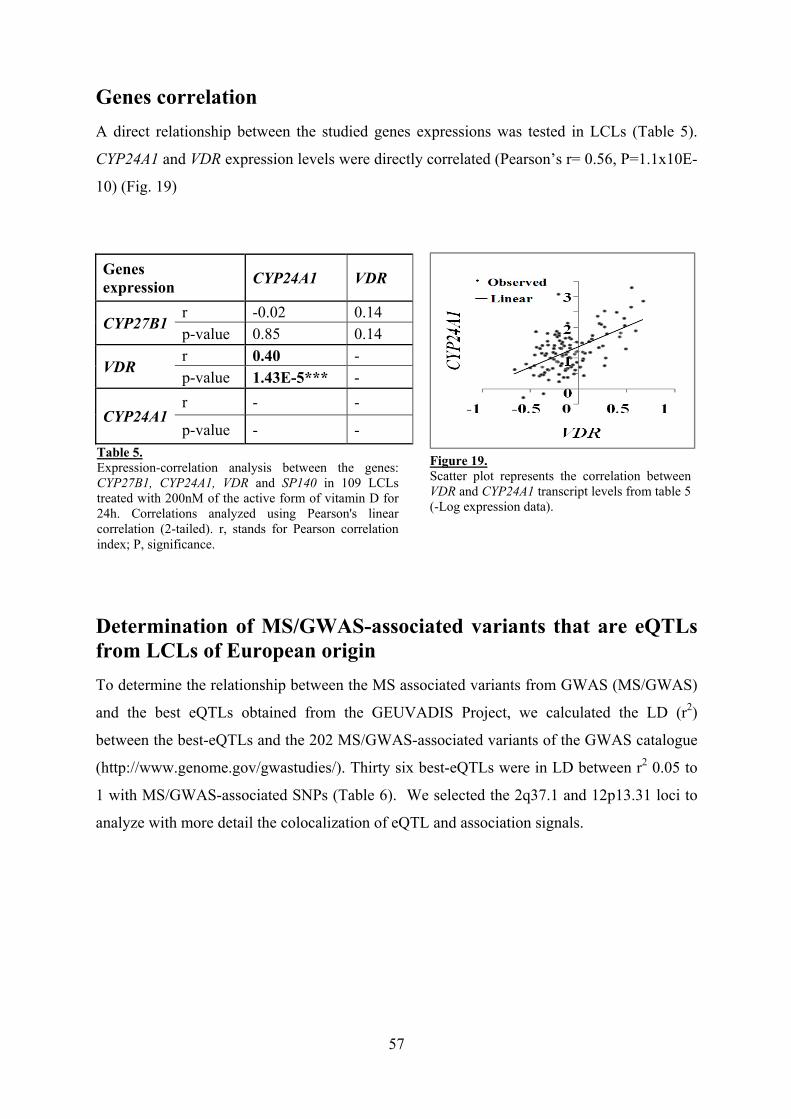
57
Genes correlation A direct relationship between the studied genes expressions was tested in LCLs (Table 5).
CYP24A1 and VDR expression levels were directly correlated (Pearson’s r= 0.56, P=1.1x10E-
10) (Fig. 19)
Determination of MS/GWAS-associated variants that are eQTLs from LCLs of European origin To determine the relationship between the MS associated variants from GWAS (MS/GWAS)
and the best eQTLs obtained from the GEUVADIS Project, we calculated the LD (r2)
between the best-eQTLs and the 202 MS/GWAS-associated variants of the GWAS catalogue
(http://www.genome.gov/gwastudies/). Thirty six best-eQTLs were in LD between r2 0.05 to
1 with MS/GWAS-associated SNPs (Table 6). We selected the 2q37.1 and 12p13.31 loci to
analyze with more detail the colocalization of eQTL and association signals.
Genes expression CYP24A1 VDR
CYP27B1 r -0.02 0.14 p-value 0.85 0.14
VDR r 0.40 - p-value 1.43E-5*** -
CYP24A1 r - -
p-value - - Table 5. Expression-correlation analysis between the genes: CYP27B1, CYP24A1, VDR and SP140 in 109 LCLs treated with 200nM of the active form of vitamin D for 24h. Correlations analyzed using Pearson's linear correlation (2-tailed). r, stands for Pearson correlation index; P, significance.
Figure 19. Scatter plot represents the correlation between VDR and CYP24A1 transcript levels from table 5 (-Log expression data).

58
Table 6. LD between the GWAS associated variants and the best-eQTLs for the EUR LCLs. rho: for Spearman correlation between the transcript expression level and the eQTL allele.
Study (Reference) chr MS-SNP position eQTL position LD
(r2) Transcript Gene rho
(Patsopoulos et al., 2011) chr16 rs7191700 11406802 rs918737 11439638 0,12 ENST00000381820 RMI2 0,39
(Sawcer et al., 2011)
chr2 rs10201872 231106723 rs6705808 231091340 0,97 ENST00000392045 SP140 0,48 chr2 rs10201872 231106723 rs35540610 231121828 0,68 ENST00000343805 SP140 0,50 chr2 rs10201872 231106723 rs10498245 230246707 0,45 ENST00000350136 SP140 0,40 chr3 rs4285028 121660663 rs9808981 121429560 0,66 ENST00000273668 EAF2 0,35 chr3 rs4285028 121660663 rs6780316 121544090 0,34 ENST00000349820 IQCB1 0,34 chr4 rs228614 103578636 rs223473 103693620 0,41 ENST00000273986 CISD2 0,34 chr4 rs228614 103578636 rs223413 103732865 0,25 ENST00000226578 MANBA 0,33 chr4 rs228614 103578636 rs223363 103767338 0,46 ENST00000394801 UBE2D3 0,47 chr6 rs9321490 135494874 rs9471935 42840317 0,06 ENST00000493763 RPL7L1 0,44 chr8 rs1520333 79401037 rs2953477 79624604 0,25 ENST00000263849 ZC2HC1A 0,50 chr8 rs1520333 79401037 rs10093113 79585247 0,26 ENST00000520351 RP11-578O24.2 0,63
chr12 rs10466829 9876090 rs2080210 9838051 0,13 ENST00000444971 CLEC2D 0,33 chr12 rs10466829 9876090 rs11052604 9862547 0,47 ENST00000261339 CLEC2D 0,41 chr12 rs10466829 9876090 rs7977720 9866348 0,86 ENST00000542530 CLECL1 0,54 chr12 rs10466829 9876090 rs2080206 9867965 0,69 ENST00000540988 CLECL1 0,45 chr12 rs10466829 9876090 rs9634110 9543483 0,19 ENST00000229402 KLRB1 0,37 chr12 rs10466829 9876090 rs11051176 9626489 0,20 ENST00000518709 RP11-726G1.1 0,54 chr12 rs10466829 9876090 rs10843723 9566301 0,19 ENST00000540982 RP11-599J14.2 0,32 chr12 rs12368653 58133255 rs2291617 58166402 0,40 ENST00000300209 METTL21B 0,39 chr12 rs12368653 58133255 rs701008 58117644 0,29 ENST00000323833 TSFM 0,34 chr12 rs12368653 58133255 rs238517 58117736 0,72 ENST00000389146 OS9 0,39 chr12 rs12368653 58133255 rs10431506 58311523 0,26 ENST00000300145 XRCC6BP1 0,42 chr12 rs12368653 58133255 rs12368653 58133256 0,50 ENST00000552423 OS9 0,41 chr12 rs703842 58162738 rs2291617 58166402 0,97 ENST00000300209 METTL21B 0,39 chr12 rs703842 58162738 rs701008 58117644 0,75 ENST00000323833 TSFM 0,34 chr12 rs703842 58162738 rs238517 58117736 0,31 ENST00000389146 OS9 0,39 chr12 rs703842 58162738 rs10431506 58311523 0,17 ENST00000300145 XRCC6BP1 0,42 chr12 rs703842 58162738 rs701006 58106836 0,62 ENST00000552423 OS9 0,41 chr14 rs2119704 88487688 rs1372362 88467872 0,12 ENST00000261304 GALC 0,39 chr19 rs2303759 49869050 rs1864142 49854221 0,09 ENST00000426897 CD37 0,33 chr22 rs140522 50971265 rs131752 51023423 0,14 ENST00000423069 CPT1B 0,34
(Briggs et al., 2011) chr6 rs11962089 105612219 rs6905641 105795405 0,09 ENST00000448705 PREP 0,41
(De Jager et al., 2009)
chr12 rs1790100 123656724 rs4275659 123447927 0,66 ENST00000315580 ARL6IP4 0,50 chr12 rs1790100 123656724 rs4759416 123746356 0,92 ENST00000538446 CDK2AP1 0,31 chr12 rs1790100 123656724 rs28855757 123885936 0,89 ENST00000544658 CDK2AP1 0,33 chr12 rs1790100 123656724 rs28659953 123912212 0,16 ENST00000280571 RILPL2 0,32
(Baranzini et al., 2008)
chr1 rs12047808 179469313 rs479094 179842106 0,05 ENST00000271583 TOR1AIP1 0,48 chr2 rs1109670 9250037 rs35132160 9239634 0,06 ENST00000471753 MBOAT2 0,40
(Aulchenko et al., 2008) chr1 rs10492972 10353111 rs2506892 10598215 0,21 ENST00000492696 PEX14 0,31

59
Determination of the causal gene responsible for the association with MS in the 2q37.1 locus
The 2q37.1 locus locus has been reported to be associated to MS (rs10201872, risk allele A)
(Sawcer et al., 2011) and to two other diseases after different GWAS. rs13397985 (G risk
allele) has been showed to be associated with Chronic lymphocytic leukemia (CLL) in four
GWAS. (Di Bernardo et al., 2008) (Slager et al., 2012) (Berndt et al., 2013) (Speedy et al.,
2014). rs7423615, rs6716753 with T and C as risk alleles respectively, have been associated
to Chorn's disease (Franke et al., 2010) (Jostins et al., 2012) (Fig.20).
Figure 20. Schematic representation of the the 2q37.1 locus (chr2:231090445-231123336) 33Mb, from the UCSC Genome Browser on Human Feb. 2009 (GRCh37/hg19) Assembly. UCSC indicate the position of SP140 gene .GWAS catalog shows the 2 SNPs rs7423615 and rs6716753 associated with seven CD (Chorn's disease), the SNP associated with CLL rs13397985 and the MS SNP rs1022001872. Ensembl genes represent three trascripts of SP140: ENST00000350136, ENST00000392045 and ENST00000343805. Best-eQTLs for ENST00000392045 and ENST00000343805 transcripts of the SP140 gene, which correlated with the best MS-associated variants in the Immunochip.
Determination of eQTLs in the 2q37.1 locus
In order to determine the causal polymorphisms of the association with the different disease
we determined the variants that correlate with expression of different genes in the locus that
colocalize with the disease associated variants. We first identified at this locus the eQTLs in
LCLs from European origin from the GEUVADIS Project (Lappalainen et al., 2013). The
selection of the eQTLs at coordinates chr2:230856224-231357223, 250 Mb flanking each
side of the SNP associated with MS, unrevealed 4 eQTLs, one associated with a transcript of

60
the SP100 gene and three with transcripts of the SP140 gene (Table 7). The SNPs that best
correlated with each of the four transcripts (best-eQTLs) were different ones, but those for the
transcripts ENST00000343805 and ENST00000392045 of the SP140 gene were in strong LD
(r2 =0.99) in European population.
Table 7. Linkage disequilibrium (LD) between the eQTLs at the chr2:230856224-231357223 locus and the GWAS associated variants for different diseases in the region. (1) Spearman's rho correlations between RNA expression levels and genotypes; (2) the LD has been calculated with the EUR population of 1000 Genomes Project; MS, multiple sclerosis; CD Crohn's disease; CLL, chronic lymphocytic leukemia.
Colocalization of best-GWAS variants and best-eQTLs
To determine whether the GWAS-variants in the 2q37.1 locus colocalized with the eQTLs,
we calculated the LD between the best-eQTLs and the best-associated SNP for each disease
(Table 7). The best-eQTLs for the SP140 transcripts ENST00000343805 and
ENST00000392045 were in almost total LD with the best GWAS-variants of MS, CD, and
CLL (Fig. 20A and Table 6). These variants belong to a LD block including 18 variants with
r2 ranging between 0.94 and 1, as calculated from EUR populations of the 1000 Genomes
Project. To verify the colocalization between eQTLs and association signals, we examined
data of the Immunochip project for MS (Beechman et al. 20013). This dataset provides high
genotyping density for this region in a large cohort of 14277 cases and 23605 controls. Given
that both eQTLs and Immunochip have the 1000 Genomes as base of design, the data of MS
association and the eQTLs were available for the same SNPs. Thus, we integrated both
signals to determine whether they shared the causative variant (Fig. 21). Complete
colocalization was observed between the best MS-associated SNPs and the best-eQTLs for
the transcripts ENST00000343805 and ENST00000392045 of the SP140 gene (Fig. 21A).
However, there was no colocalization with the best-eQTLs for the other SP140 transcript
ENST00000350136 and the SP100 transcripts. In the locuszoom graphs (Fig. 21B), we
observed that the best associated variant in the Immunochip data for MS, rs9989735, is in
total LD with a group of SNPs that are those top correlated with the transcription levels of
ENST00000392045 and ENST00000343805, but not with transcript ENST00000350136.
LD between eQTLs and associated SNP (r2) (2) CLL MS CD CD
Gene Transcript rho (1) P value FDR_P
value eQTL rs13397985 rs10201872 rs6716753 rs7423615
SP100 ENST00000452345 0.32 1.37E-07 5.974E-05 rs1649884 0.009 0.005 0.013 0.009 SP140 ENST00000350136 -0.35 2.87E-09 1.54E-06 rs10498245 0.492 0.449 0.509 0.449 SP140 ENST00000343805 -0.49 3.26E-17 6.18E-14 rs13426106 0.991 0.899 0.959 1 SP140 ENST00000392045 0.44 5.81E-14 7.603E-11 rs13397985 1 0.891 0.967 0.991

61
Figure 21. (A) Scatter plots representing the expression correlation coefficient (absolute value of Spearman's rho coefficient) for each indicated transcript versus the MS-association values (-log P). Determination of eQTLs in the region was performed in this work using the RNA sequencing data from GEUVADIS Project, together with the genotype information from the 1000 Genomes Project. In each plot, the best MS-associated SNP and the best-eQTL are indicated. (B) LocusZoom plots showing the expression-correlation levels of variants in the region. The best MS-associated SNP in the locus from the Immunochip dataset is in purple and indicated with an arrow. Colours scale represents the linkage disequilibrium (r2 values) respect to this variant obtained from the 1000 Genomes EUR population.
Changes in the RNA isoform profile associated with disease
The expression levels of the two SP140 RNA isoforms showed opposite correlations with the
genotypes of the best MS-associated variant (Fig. 22A). The main difference between these
two RNA isoforms was the alternative splicing of exon 7. In the LD block, one of the best
associated variants rs28445040 was located in exon 7, at 5 bases downstream of the splicing
acceptor site. To explore whether the skipping of exon 7 is the functional cause of the
association, we turned to eQTL exon-level analysis of the SP140 for the European (EUR, n=
373) and African-Yoruba (YRI, n= 89) populations of the GEUVADIS Project (Lappalainen
et al., 2013). For YRI population, we observed that the best eQTL for SP140 exon 7 was
rs28445040 with a PICS score of 0.6429, much higher than the next one, rs13426106, with a
PICS score of 0.0715. For the EUR population the results indicated that rs28445040 was an
eQTL for all SP140 exons, except for exons 24 and 25, albeit a significantly higher
correlation coefficient was observed for exon 7 (Fig. 22B). It seemed that the reduction of the
expression levels of the ENST00000392045 transcript was compensated by the increase in
the ENST00000343805 isoform except for exon 7, not present in the latter.
A
B

62
Figure 22. (A) Box plots represent the mRNA levels from RNA-Seq (GEUVADIS Project) of both SP140 transcripts ENST00000392045 and ENST00000343805 in 344 LCLs versus the rs28445040 genotype. Spearman's correlation index (rho) and p-value are indicated inside the plots. (B) Spearman's correlation index (rho-values) between each SP140 exon and the rs28445040 genotypes.
To confirm these data experimentally, we analyzed SP140 RNA levels by a reverse
transcriptase (RT)-PCR in LCLs from individuals carrying the different genotypes of
rs28445040 (NA12004: CC; NA20766: CT; NA20518: TT) (Fig. 23A) using primers that
hybridized in the flanking exon 6 and exon 8. The PCR products were visualized by
polyacrylamide-gel electrophoresis. The samples from TT and TC carries showed a band
corresponding in size to a fragment lacking exon 7, and with a T-allele dose effect that was
absent in the CC carriers.
In order to quantify the expression levels of the two spliced variants and to validate the data
obtained from the RNA-Seq from GEUVADIS, we studied SP140 expression levels in 59
LCLs (32 CC, 22 CT and 5 TT for rs28445040) using a bridge primer that hybridized
between exons 6 and 8 for the transcript with skipped-exon 7 and another qPCR with a bridge
primer between exon 7 and 8 for the full-length transcript, as shown in (Fig. 23B). After
Sperman's rho correlation test of expression levels respect to the rs28445040 genotypes, we
observed that the expression of the exon 7-skipped transcript was highly correlated with the
T-allele dose while the full-length transcript, containing exon 7, was inversely correlated (Fig.
23C).

63
Figure 23. (A) Schema of the positions of 5' forward and 3' reverse primers in exon 6 and 8 respectively (SP140 E6:E8) and the position of rs28445040 in exon 7 in SP140 gene. The Polyacrylamide gel electrophoresis (PAGE) showing the results of the RT-PCR amplification of RNA from LCLs with different rs28445040 genotypes (cell lines: NA12004: CC, NA20766: CT, NA20518: TT). The Lane m is the molecular weight marker. (B) Schema of the specific primers SP140 E6:E7_8 used to amplify the full length transcript (exon 7 included) and SP140 E6_8:E8 to amplify the exon7-skipped transcript of the gene SP140. (C) Box plots represent the SP140 mRNA levels of the full length and exon7-skipped transcripts respect to rs28445040 genotypes measured by real time qPCR from 59 LCLs . Spearman's correlation index (rho) and p-value are indicated inside the plots stand for the significance of the statistical comparisons by Spearman’s rank correlation test Sig. (2-tailed). Relative quantification was performed by RT-qPCR using UBE2D2 as a reference gene using 2-ΔCT method.
rs28445040 as a functional variant affecting the exon 7-skipped RNA isoform
To confirm that rs28445040 is the causal variant of the splicing alteration observed in the
SP140 transcript profile, we used an alternative splicing strategy by cloning the exon 7 and its
flanking sequences carrying the two alleles into the pSPL3 plasmid (Fig. 24A). After
transfection in HEK cells, RNA purification, RT-PCR amplification, analysis of the RNA
products by agarose-gel

64
electrophoresis and sequencing, we determined that the exon 7- T allele was spliced in about
60% of the molecules and the C allele was spliced in < 10% of the molecules. These data
were in agreement with the results shown in (Fig. 24B) confirming that the rs28445040-T
allele produced splicing alterations by exon 7-skipping.
Figure 24. Alternative splicing of SP140 exon 7. (A) ) Genomic DNA construct showing the cloned sequence within the pSPL3 vector in the multi-cloning site position (MCS). The scheme represents the size in bp of the different exons corresponding to the vector, containing a cryptic exon, and the recombinant fragment of the SP140 exon 7 with intron flanking sequences. The position of the rs28445040 variant (C/T) and the primers for RT-PCR amplification are also indicated. (B) Agarose gel electrophoresis of RT-PCR from HEK cells RNA transfected with pSPL3- rs28445040 C allele insert (pC), T allele insert (pT) or with no insert as control plasmid (p). Lane m is the molecular weight marker.
Confirmation of the genetic association by a case-control study
We focused our attention on rs28445040 as the causal variant due to its location in the SP140
exon 7 and its high LD with the variant best associated with MS risk by GWAS rs10201872.
Initially we studied the LD using the Haploview program version 4.2. with SNPs data of CUE
and TSI populations from 1000 genome project, a very high correlation between the causal
SNP rs28445040 and the MS variant rs10201872 has been reported (D’: 0.951 r2=0.9). In
addition, we observed that all risk alleles of GWAS SNPs associated with MS, CLL and CD
traits, form one LD block (haplotype) with the T allele of the causal variant rs28445040
which induces the splicing of SP140 gene. The frequency of the haplotype is 0.187 (Fig. 25).
Then, the LD between these two SNPs was calculated from the CEU and TSI populations of
the 1000 Genomes Project (r2=0.96); however, when the LD was analyzed in other
populations we observed that holds great variability. In African populations the LD between
these two variants is lower than in the CEU population, ranging from 0.6 to 0.64, and in
Asiatic populations both variants are missing. The highest LD, though with differences, was
observed in the Amerindian and European populations (Table 8).
A B

65
Therefore, we considered important to estimate the LD and to discern the primary association
signal in our Caucasian Spanish population. Thus, we performed a case-control study with
4384 patients and 3197 controls to confirm the association of this functional variant
(rs28445040) with MS and to compare it with the best associated variant from GWAS
(rs10201872). Results shown in Table 9 indicated that both variants were in strong LD
(r2=0.93) and evidenced similar MS risk association p-values (MAF (T allele) p-values, odds
ratios: 1.9 E-9, OR=1.35 [1.22-1.49] and 4.9 E-10, OR=1.37 [1.24-1.51], respectively). After
logistic regression analyses, we found that the dominant model was the one that best fitted the
data for both SNPs.
rs28445040 causal variant
rs10201872 MS-GWAS
Populations LD (r2) MAF (T) MAF ( T) ASW 0.64 0.156 0.107
LWK 0.63 0.16 0.108
YRI 0.6 0.108 0.068
CLM 1 0.192 0.192
MXL 0.92 0.106 0.098
PUR 1 0.127 0.127
TSI 0.89 0.179 0.163
GBR 0.83 0.208 0.18
FIN 0.82 0.14 0.118
CEU 0.96 0.206 0.2
CHB 0 0
CHS 0 0
JPT 0 0
Figure 25. LD plot represented by r-square in a gray-scale and haplotypes for the CEU and TSI populations for the GWAS SNPs and the functional SNP. Visualized using default settings (MAF 0.1 %) in Haploview version 4.2
Table 8. Linkage disequilibrium between the functional variant (rs28445040) and the GWAS variant (rs10201872) in different human populations and the minor allele frequency (MAF) for each variant.

66
MS patients Control Dominant model Genotypes
SNPs TT CT CC TT CT CC p-value OR (CI 0.95)
rs10201872 158 (3.6)
1390 (31.7)
2836 (64.7)
88 (2.7)
824 (25.8)
2285 (71.5) 4.9 E-10 1.37 (1.24-1.51)
rs28445040 167 (3.8)
1434 (32.7)
2783 (63.5)
99 (3.1)
857 (26.8)
2241 (70.1) 1.9 E-9 1.35 (1.22-1.49)
Table 9. MS-association of the best GWAS-MS variant (rs10201872) and the functional variant described in this work (rs28445040) by logistic regression analysis. Genotype distributions are shown as the number (%); odds ratio (OR), 95% confidence interval (CI), and p-values were determined by logistic regression analysis with dominant model.
SP140 in CD14 and LCLs
In CD14 monocytes, SP140 mRNA expression was increased significantly (P<0.005) when
cells were stimulated with LPS (20 ng/ml) and IFNγ (2 ng/ml) for 24h (Fig. 26A). However,
any significant change in SP140 expression level was observed in LCLs when they were
treated with 1,25(OH)2D200nM for 24h (Fig. 26B). While comparing between the SP140
expression levels in CD14 and LCL, low level of SP140 mRNA expressed by CD14
monocytes was observed. However, in LCLs SP140 is expressed at high level. Furthermore,
SP140 mRNA expression level in LCLs showed a significant association with the MS-GWAS
rs10201872 (Spearman's rho=0.50, p=3.2E-05) (Fig. 26C). Low expression level of SP140
was clearly associated with the MS risk allele rs10201872-T. Thus, the high level was
associated with the MS protective allele rs10201872- C.
Figure 26. SP140 mRNA expression in CD14+ monocytes and LCLs. (A) Induction of SP140 expression in CD14+ stimulated with LPS (20 ng/ml) and IFNγ (2 ng/ml) for 24h. ***P<0.0005 compared with the positive control (cells not stimulated). (B) SP140 mRNA expression in LCLs control and LCLs incubated with 200nM of 1,25(OH)2Dfor 24h. Each bar is the mean of eight samples ±SE. (C) SP140 mRNA expression levels respect to the rs10201872 genotypes in 59 LCLs represented by boxplot distributions with medians and quartiles. p-value= 3.2E-05 stands for the significance of the statistical comparisons by Spearman’s rank correlation test Sig. (2-tailed). Relative quantification was performed by RT-qPCR using UBE2D2 as a reference gene using 2-ΔCT
method.

67
SP140 and Vitamin D
In order to study the effect of vitamin D on SP140 in LCL we tranfected LCL cells with
pSPL3-rs28445040 (p, pC and pT). Then the cells were incubated with 200nM of
1,25(OH)2Dfor 24 h. The PCR products amplified the plasmid inserts using the specific
primers (SD6 and SA2) run in agarose gel. No difference was observed between control and
vitamin D treated cells (Fig. 27).
Figure 27. Agarose gel electrophoresis of RT-PCR from LCL-C as control and LCL-A cells incubated with 1,25(OH)2D200nM for 24h transfected with pSPL3-rs28445040 C allele insert (pC), T allele insert (pT) or with no insert as control plasmid (p). Lane m is the molecular weight marker.
Determination of the causal gene responsible for the association with MS in the 12 p13.31 locus The 12p13.31 locus (Fig. 28) has been associated to MS in GWAS by the variant rs10466829
(risk allele A) (Sawcer S et al., 2011) which is located in the first intron of CLECL1 gene. In
addition, this region has been associated with the autoimmune disease type 1 diabetes by 2
different GWAS by the variants rs3764021, rs11052552 (WTCCC et al., 2007) and rs4763879
(Barrett et al., 2009). Then the p13.31 locus was associated with N-glycosylation of human
immunoglobulin G, interestedly, most of the loci associated with this trait have been strongly
associated with autoimmune and inflammatory conditions (Lauc et al., 2013). On the other
hand, this locus has been also associated with Obesity-related traits (Comuzzie et al., 2012).
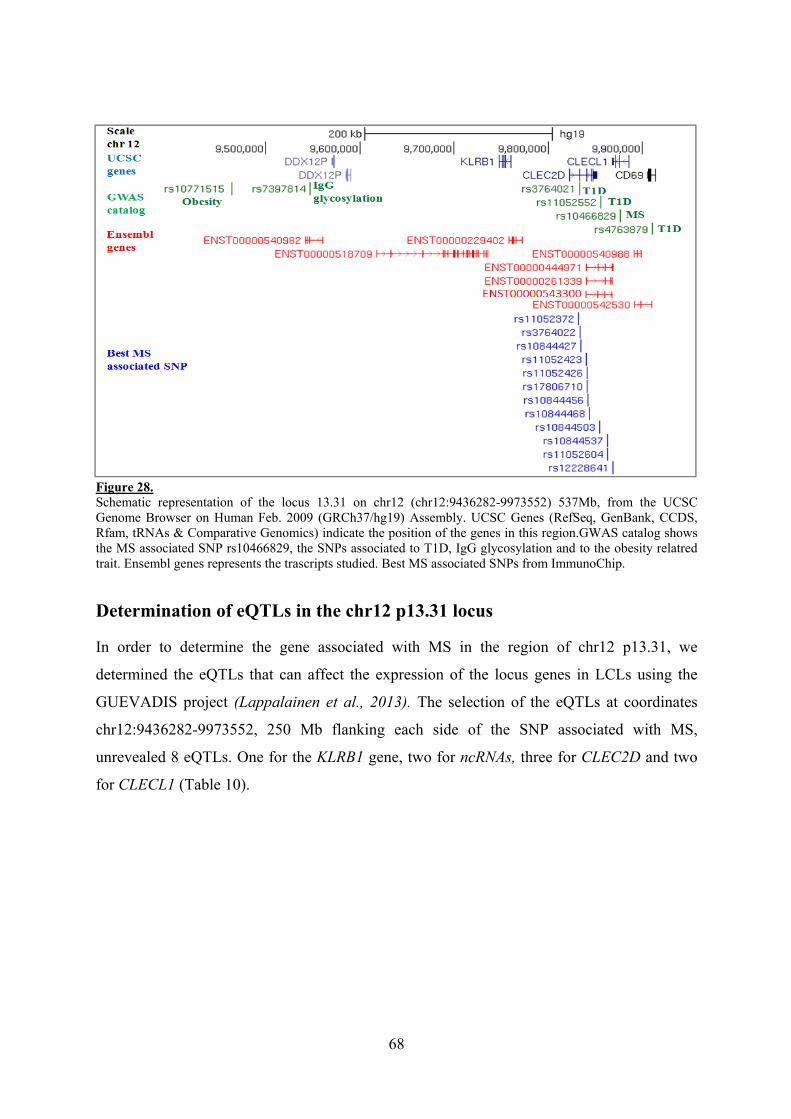
68
Figure 28. Schematic representation of the locus 13.31 on chr12 (chr12:9436282-9973552) 537Mb, from the UCSC Genome Browser on Human Feb. 2009 (GRCh37/hg19) Assembly. UCSC Genes (RefSeq, GenBank, CCDS, Rfam, tRNAs & Comparative Genomics) indicate the position of the genes in this region.GWAS catalog shows the MS associated SNP rs10466829, the SNPs associated to T1D, IgG glycosylation and to the obesity relatred trait. Ensembl genes represents the trascripts studied. Best MS associated SNPs from ImmunoChip.
Determination of eQTLs in the chr12 p13.31 locus
In order to determine the gene associated with MS in the region of chr12 p13.31, we
determined the eQTLs that can affect the expression of the locus genes in LCLs using the
GUEVADIS project (Lappalainen et al., 2013). The selection of the eQTLs at coordinates
chr12:9436282-9973552, 250 Mb flanking each side of the SNP associated with MS,
unrevealed 8 eQTLs. One for the KLRB1 gene, two for ncRNAs, three for CLEC2D and two
for CLECL1 (Table 10).

69
Gene Transcript
Best
eQTL
eQTL
correlation(1)
MS
association(2)
Best MS
SNP(3)
eQTL
correlation(1) MS
association(2)
KLRB1 ENST00000229402 rs7137213 0.30 1.85 rs10844503 0.14 8.22
RP11599J14.2 ENST00000540982 rs7137213 0.23 1.85 0.11 8.22
RP11726G1.1 ENST00000518709 rs10771920 0.52 3.30 0.23 8.22
CLEC2D ENST00000444971 rs2401388 0.33 0.62 0.10 8.22
CLEC2D ENST00000261339 rs2401394 0.41 7.91 0.40 8.22
CLEC2D ENST00000543300 rs4763283 0.38 6.67 0.31 8.22
CLECL1 ENST00000542530 rs7977720 0.52 6.92 0.43 8.22
CLECL1 ENST00000540988 rs2080206 0.45 6.62 0.38 8.22
Table 10. Comparison of transcript level correlations and MS-association P-values between best eQTLs and best MS-associated SNPs at the chr12 p13.31 locus. (1) Spearman's rho correlations between RNA expression levels and genotypes. (2) Data obtained from ImmunoChip as -Log P-values. (3) Best MS associated SNP from ImmunoChip.
Colocalization of best-GWAS variants and best-eQTLs
To verify the colocalization between eQTLs and association signals in the chr12 p13.31
locus, we examined data of the Immunochip project for MS (Beecham et al., 2013). This
dataset provides high genotyping density for this region in a large cohort of 14277 cases and
23605 controls. Given that both eQTLs and Immunochip have the 1000 Genomes as base of
design, the data of MS association and the eQTLs were available for the same SNPs. Thus,
we integrated both signals to determine whether they shared the causative variant (Fig. 29).
Complete colocalization was observed between the best MS-associated SNPs and the best
eQTLs for the transcript ENST00000261339, and ENST00000543300 corresponding to the
CLEC2D gene (C-type lectin domain family 2, member D). However, as observed in the
Figure 29, there was no colocalization between the best eQTLs for other RNA isoforms in the
same locus, corresponding to CLECL1, KLRB1, CLEC2D and two long non-coding RNA
(lncRNA), and the best MS-associated variants.
The best eQTLs and the best MS associated SNPs were not unique but rather they were a
group of several SNPs in almost total LD (Fig. 29). Although, both datasets were obtained
from Caucasian populations, there were some differences between the SNPs that integrated
the groups of best MS variants and the ones obtained from the eQTL analysis. These
divergences were reflected in differences of LD between cohorts, as can be observed in the
locuszoom graphs (Fig. 30).

70
Since the best eQTL for CLECL1 and CLEC2D were in high LD, we wanted to discarded
possible error using a second set of data from the GWAS of the IMSGC. In this case when we
represented the data by LocusZoom, taking a reference the best associated variant of the
GWAS (rs10466829), we observed that these data colocalize better with the CLECL1
eQTLsENST00000542530 (Fig. 30A).
Figure 29. Scatter plots representing the expression correlation coefficient (absolute value of Spearman's rho coefficient) versus the MS-association values (-log P) of the SNPs for each indicated transcript. Data for MS-association was obtained from the ImmunoChip Project at http://www.immunobase.org/. Determination of eQTLs in the region was performed in this work using the RNA sequencing data from GEUVADIS Project together with the genotype information from the 1000 Genomes Project. In each plot, the green square frames the best eQTLs for the indicated transcripts and the red square frames the best MS-associated SNPs.

71
Figure 30 A. LocusZoom plots showing the expression-correlation levels of variants in the region chr12: 9700000-1000000. The best MS-associated SNP from the Immunochip dataset rs10844503 in the locus is in purple and indicated with arrow. Colours scale represents the linkage disequilibrium (r2 values) respect to this variant obtained from the 1000 Genomes EUR population.

72
Figure 30 B. LocusZoom plots showing the expression-correlation levels of variants in the region chr12: 9700000-1000000. The best MS-associated SNP rs10466829 from GWAS is in purple and indicated with arrow. Colours scale represents the linkage disequilibrium (r2 values) respect to this variant obtained from the 1000 Genomes EUR population.

73
Changes in the RNA isoform profile associated with disease
Using the GEUVADIS data, we got that the expression levels of the two CLEC2D RNA
isoforms (ENST00000261339 and ENST00000543300) showed opposite correlations with
the genotypes of the best MS-associated variant (Fig. 31). The main difference between these
two RNA isoforms was the alternative splicing of exon 2. In the LD block, one of the best
associated variants rs3764022 was located to 6 bases of the splicing acceptor site of exon 2. It
seemed that the reduction of the expression levels of the ENST00000543300 transcript was
compensated by the increase in the ENST00000261339 isoform.
Figure 31. Box plots represent the mRNA levels from RNA-Seq (GEUVADIS Project) of both CLEC2D transcripts ENST00000261339 and ENST00000543300 in 344 LCLs versus the rs3764022 genotype. Spearman's correlation index (rho) and p-value are indicated inside the plots. To have an experimental confirmation, we performed RT-PCR using primers that hybridized
in the flanking exon 1 and exon 3 (CLEC2D E1:E3) with LCLs carrying the different
genotypes of the rs3764022 (Fig. 32). The cell lines bearing the CG and GG genotypes
showed a band corresponding in size to a fragment lacking exon 2 and with a G allele doses
effect.
Figure 32. Schema of the positions of 5' forward and 3' reverse primers in exon 1 and 3 respectively (CLEC2D E1:E3) and the position of rs3764022 in exon 2 in CLEC2D gene. The Polyacrylamide gel electrophoresis (PAGE) showing the results of the RT-PCR amplification of mRNA from LCLs with different rs3764022 genotypes CC, CG and GG. the Lane m is the molecular weight marker.
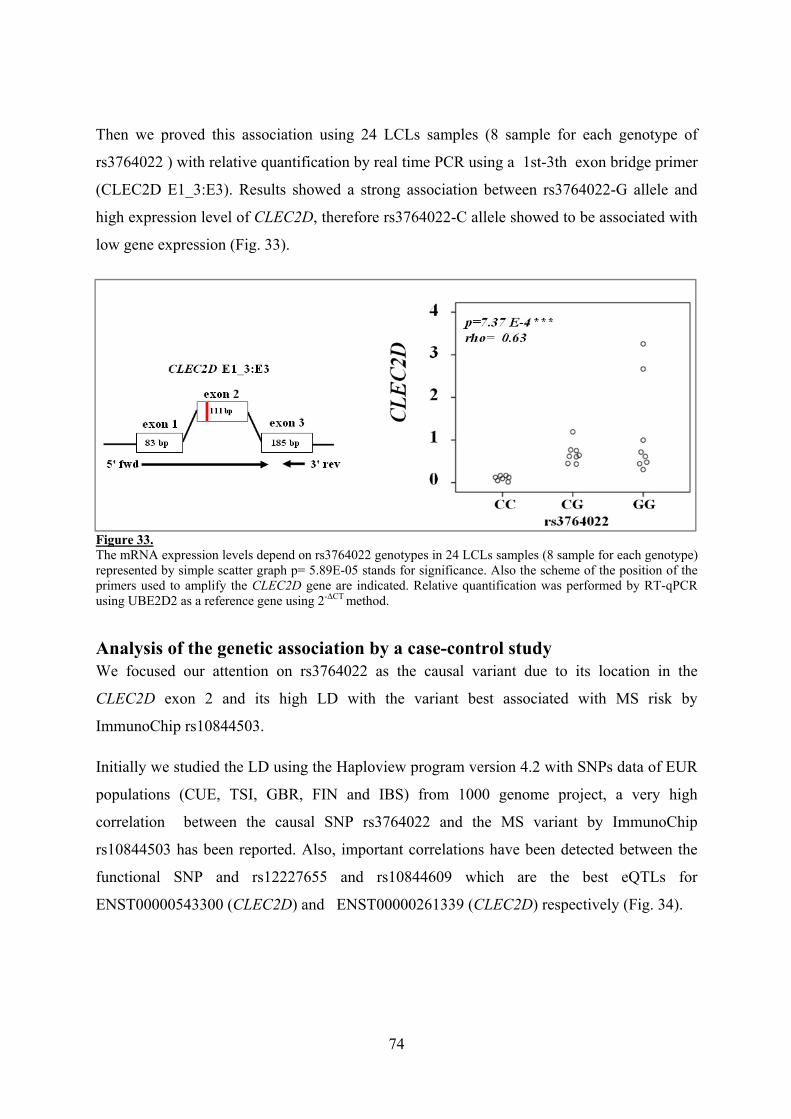
74
Then we proved this association using 24 LCLs samples (8 sample for each genotype of
rs3764022 ) with relative quantification by real time PCR using a 1st-3th exon bridge primer
(CLEC2D E1_3:E3). Results showed a strong association between rs3764022-G allele and
high expression level of CLEC2D, therefore rs3764022-C allele showed to be associated with
low gene expression (Fig. 33).
Figure 33. The mRNA expression levels depend on rs3764022 genotypes in 24 LCLs samples (8 sample for each genotype) represented by simple scatter graph p= 5.89E-05 stands for significance. Also the scheme of the position of the primers used to amplify the CLEC2D gene are indicated. Relative quantification was performed by RT-qPCR using UBE2D2 as a reference gene using 2-ΔCT method.
Analysis of the genetic association by a case-control study We focused our attention on rs3764022 as the causal variant due to its location in the
CLEC2D exon 2 and its high LD with the variant best associated with MS risk by
ImmunoChip rs10844503.
Initially we studied the LD using the Haploview program version 4.2 with SNPs data of EUR
populations (CUE, TSI, GBR, FIN and IBS) from 1000 genome project, a very high
correlation between the causal SNP rs3764022 and the MS variant by ImmunoChip
rs10844503 has been reported. Also, important correlations have been detected between the
functional SNP and rs12227655 and rs10844609 which are the best eQTLs for
ENST00000543300 (CLEC2D) and ENST00000261339 (CLEC2D) respectively (Fig. 34).

75
To try to determine which of the eQTLs, the one for CLECL1 or for CLEC2D, is the actual
causal variant of the MS association we performed a case-control study with 4046 patients
and 3120 controls with the functional variant (rs3764022) that affect CLEC2D slicing or the
best associated variant from GWAS (rs10466829). Results shown in Table 11A indicate that
both variants were not associated with the disease in our cohort. Also, a meta-analysis study
has been done with Caucasian Spanish population and German populations (Table 11B).
Figure 34. LD plot represented by r-square in a gray-scale and the haplotypes for the EUR populations for the GWAS and Immunochip SNPs, the functional SNP and for the best eQTLS for CLECL1 and CLEC2D transcripts mentioned above. Visualized using default settings (MAF 0.1 %) in Haploview version 4.2

76
Table11. (A). MS-association of the functional variant (rs3764022) and the best GWAS-MS variant (rs10466829) by logistic regression analysis.(B) Results of the meta-analysis study. A: minor allele. A2: major allele. TEST: type of test, GENO (genotypes), TREND (Cochran-Armitage test), ALLELIC, DOM (dominant), REC (recessive). OR: Odds ratio. Q: p-value for Cochrane's Q statistic.
SNP A1/A2 TEST MS patients Control P-value
rs3764022 G/C
GENO 497/1881/1620 358/1461/1269 0.5542 TREND 2875/5121 2177/3999 0.3774 ALLELIC 2875/5121 2177/3999 0.3841 DOM 2378/1620 1819/1269 0.6257
REC 497/3501 358/2730 0.2829
rs10466829 G/A
GENO 833/2001/1212 682/1507/931 0.3998 TREND 3667/4425 2871/3369 0.4118
ALLELIC 3667/4425 2871/3369 0.4087 DOM 2834/1212 2189/931 0.9155
REC 833/3213 682/2438 0.1915
SNP A1/A2 p-value OR Q rs3764022 G/C 0.3831 1.0262 0.8098
rs10466829 G/A 0.08139 0.9568 0.4693

77
Discussion
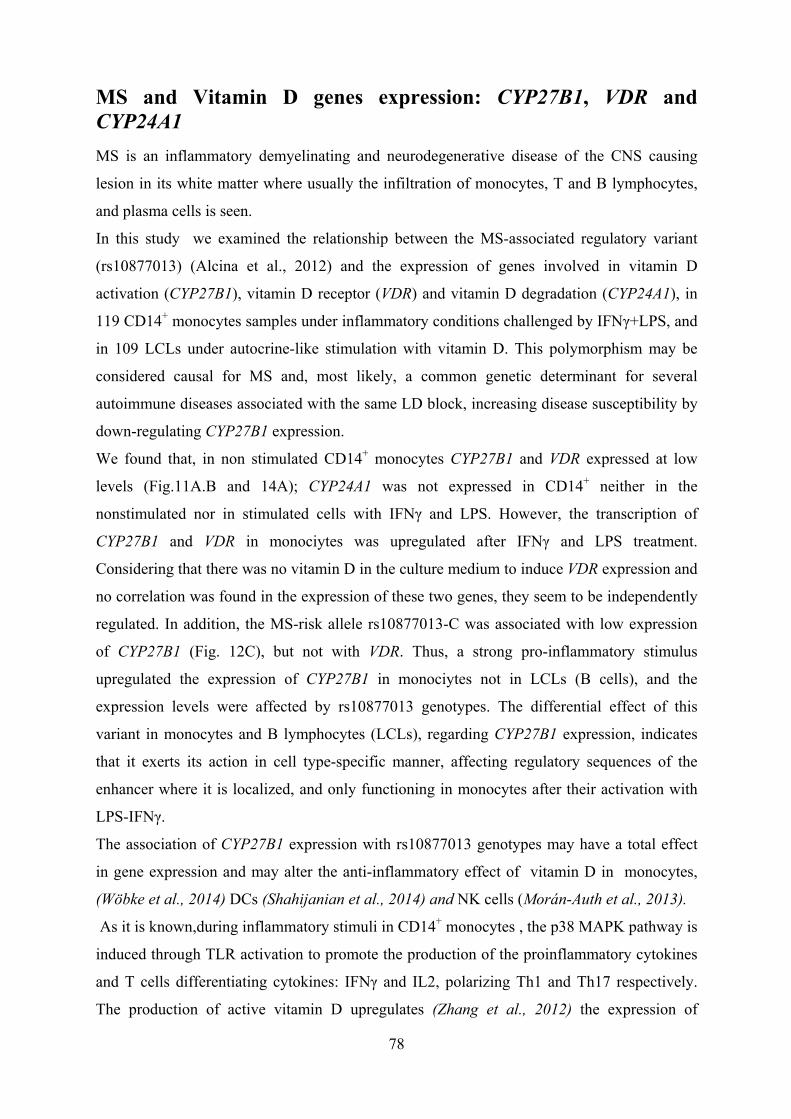
78
MS and Vitamin D genes expression: CYP27B1, VDR and CYP24A1 MS is an inflammatory demyelinating and neurodegenerative disease of the CNS causing
lesion in its white matter where usually the infiltration of monocytes, T and B lymphocytes,
and plasma cells is seen.
In this study we examined the relationship between the MS-associated regulatory variant
(rs10877013) (Alcina et al., 2012) and the expression of genes involved in vitamin D
activation (CYP27B1), vitamin D receptor (VDR) and vitamin D degradation (CYP24A1), in
119 CD14+ monocytes samples under inflammatory conditions challenged by IFNγ+LPS, and
in 109 LCLs under autocrine-like stimulation with vitamin D. This polymorphism may be
considered causal for MS and, most likely, a common genetic determinant for several
autoimmune diseases associated with the same LD block, increasing disease susceptibility by
down-regulating CYP27B1 expression.
We found that, in non stimulated CD14+ monocytes CYP27B1 and VDR expressed at low
levels (Fig.11A.B and 14A); CYP24A1 was not expressed in CD14+ neither in the
nonstimulated nor in stimulated cells with IFNγ and LPS. However, the transcription of
CYP27B1 and VDR in monociytes was upregulated after IFNγ and LPS treatment.
Considering that there was no vitamin D in the culture medium to induce VDR expression and
no correlation was found in the expression of these two genes, they seem to be independently
regulated. In addition, the MS-risk allele rs10877013-C was associated with low expression
of CYP27B1 (Fig. 12C), but not with VDR. Thus, a strong pro-inflammatory stimulus
upregulated the expression of CYP27B1 in monociytes not in LCLs (B cells), and the
expression levels were affected by rs10877013 genotypes. The differential effect of this
variant in monocytes and B lymphocytes (LCLs), regarding CYP27B1 expression, indicates
that it exerts its action in cell type-specific manner, affecting regulatory sequences of the
enhancer where it is localized, and only functioning in monocytes after their activation with
LPS-IFNγ.
The association of CYP27B1 expression with rs10877013 genotypes may have a total effect
in gene expression and may alter the anti-inflammatory effect of vitamin D in monocytes,
(Wöbke et al., 2014) DCs (Shahijanian et al., 2014) and NK cells (Morán-Auth et al., 2013).
As it is known,during inflammatory stimuli in CD14+ monocytes , the p38 MAPK pathway is
induced through TLR activation to promote the production of the proinflammatory cytokines
and T cells differentiating cytokines: IFNγ and IL2, polarizing Th1 and Th17 respectively.
The production of active vitamin D upregulates (Zhang et al., 2012) the expression of
79
mitogen-activated protein kinase phosphatases-1 MKP-1, which in turn inhibits p38 MAPK,
thus preventing the proinflammatory cytokine production in monocytes / macrophages and
enhancing the apoptotic death of inflammatory CD4+ T cells in experimental EAE (Pedersen
et al., 2007) (Fig. 34). In addition, it has been demonstrated that he p38 MAPK expression
was 5 fold elevated in MS lesion (Lock et al., 2002). As we have proved in our study that the
MS risk allele rs10877013-C is associated with low expression of CYP27B1 in monocytes so
it means to be associated with reduction in vitamin D active form (1,25(OH)2D3).
Consequently, minimal inhibition of the proinflammmatory pathway p38 MAPK by MKP-
1could lead to CNS damage directly or indirectly (Fig. 35). So Vitamin D plays the role of
immunomodulator in inflammmatory responses.
Consistent with previous studies, these data support the hypothesis that low vitamin D level is
more a cause than a consequence of illness (Pakpoor and Ramagopalan, 2014; Autier et al.,
2014; Gillie et al., 2014).
Figure 35. Inhibition of the p38 MAP kinase pathway by 1,25(OH)2Dand a mechanism for the synergistic anti-inflammatory effects of 1,25(OH)2Dand glucocorticoids. Proinflammatory stimuli lead to p38 MAP kinase phosphorylation and activation which subsequently induces expression of many proinflammatory proteins such as IL-6 and TNFα. 1α,25(OH)2D3 induces MKP1 expression which dephosphorylates and inactivates p38 MAP kinase. 1,25(OH)2Dstimulates glucocorticoid-induced MKP1 expression via enhanced expression of Med14.
CYP27B1 and VDR are expressed constitutively in LCLs, however CYP24A1 is not
expressed. We observed that 1,25(OH)2Dhas no effect on CYP27B1 expression in LCL,
however 25(OH)D3 induces slightly the CYP27B1 (not significantly). On the other hand, VDR

80
being upregulated by both vitamin D forms, even it is thought to be induced more
significantly when cells are treated with 1,25(OH)2D3. We also found that the VDR
transcription, but not of the CYP27B1, was associated with the MS-risk allele in 109 LCLs
stimulated with 1,25(OH)2D3. The cause of this association is unknown. VDR is located at
approximately 10 Mb from the variant site (Fig.14) , close to CYP27B1, with a high potential
of regulating over long distances in the same chromosome, since chromatin interaction
between promoters and promoter-enhancer of many genes have been described. (Chepelev et
al., 2012) (Li et al., 2012).
Referring to our data, CYP24A1 was not expressed in CD14+ monocytes even after treatment
with several stimuli, but it was specifically upregulated by 1,25(OH)2D3 in LCLs, and its
expression correlated with the expression of VDR. The MS-GWAS associated variant in the
region (Sawcer et al., 2011) has been associated with CYP24A1 expression in the brain
tissue of frontal cortex and temporal cortex, rs2248359-G risk allele is associated with high
expression level of CYP24A1 (Ramasam et al., 2014). CYP24A1 encodes the enzyme
responsible for initiating of the 1,25(OH)2D3 degradation (the physiologically active form of
vitamin D3) proving the possible pathogenic role for low levels of 1,25(OH)2D3 in MS.
However, in our study, neither the MS-GWAS associated variant in the CYP24A1 region
(rs2248359) nor any other variant located in 1 Mb around the CYP24A1 from the 1000
Genome Project database, seemed to associate with its expression levels after vitamin D
activation.
Additionally, studying the gene expression in LCLs stimulated with 1,25(OH)2D , we found
that the expression levels of VDR and CYP24A1 were directly correlated. The VDR activated
by vitamin D can induce the transcription of CYP24A1 which in turn inactivates 1,25(OH)2D3
by hydroxylation. The important role of VDR in MS can be explained through the results
concerning that VDR directly interacts with enhancer and promoter elements and likely
modifies their action. In addition, VDR binding is also more likely to occur within MS-
related regions when compared with the rest of the genome and more than 60% of MS-related
regions are bound by the VDR. These include the genomic regions containing the MS-GWAS
reported genes EVI5, VCAM1, CXCR4, SP140, TME M39A, CD86, NFKB1, CXCR5,
TNFRSF1A, CLECL1, CYP27B1, CLEC16A, IRF8, STAT3, TNFSF14, TYK2,
CD40 and TNFRSF6B.. (Disanto G et al., 2012)
Many studies suggested that childhood or early adolescence is the crucial time period for
vitamin D-dependent MS risk. The interactions of genetic and other environmental risk
factors, contributing to the onset of disease, appear to occur later in life (Goodin, 2012). In

81
such a context, the relevance of our findings is based on the regulatory role that the
polymorphism rs10877013 exert on two vitamin D metabolism genes (CYP27B1 and VDR) in
two different immune cell types (monocytes and B cells).
Thus, the rs10877013 C allele is a "low producer" of CYP27B1 in activated monocytes (CC
genotype carriers express about a third of TT) as well as a "low producer" of VDR in B cells
(LCLs) (CC genotype carriers express about a half of TT). This genetic constitution, in
combination with a potential vitamin D deficit in the early years of life, caused by low
sunlight exposure or low vitamin D intake, could produce a synergistic effect, leaving these
individuals unable of efficiently process different infectious agents or inflammatory situation
that could occur in adolescence or later in life. The inflammatory stimulus could be alone or
in a combination of infectious agents: Epstein Barr virus (EBV), Human Herpes virus type 6
(HHV-6), endogenous retroviruses, etc, all of them MS risk candidates. Monocytes could
carry out a special role in innate immunity, by inducing the expression of CYP27B1, and with
the encoding enzyme, converting the serum vitamin D (25(OH)D3) into active vitamin D
(1,25(OH)2D3) intracellularly and mounting an efficient immune response against pathogens.
In clinically definitive MS, active vitamin D (1,25(OH)2D3) may reduce differentiation of
monocytes to DCs and proliferation, thus decreasing T-cell stimulation; controling T-cell
activation and inhibiting T-cell proliferation. At the same time, it promotes activity of the
Th2 phenotype cells (with a protective role), resulting in an anti-inflammatory effect and
enhances the production of the anti-inflammatory cytokine IL10 (Munger et al., 2011 and
2014; Schwalfenberg et al., 2011; Wöbke et al., 2014). The regulatory effect of the
rs10877013, depending on the genotype, can alter the expression of CYP27B1 in monocytes
and VDR in B cells (LCLs), and consequently interfering with these anti-inflammatory
processes (for instance, an infectious agent). So the CC genotype carriers, "low producers",
have less capability of mount an anti-inflammatory response.
In conclusion, these findings confirm associations of vitamin D activity with diverse
inflammatory pathways in monocytes, (Shahijanian et al., 2014) although the magnitude of
this connection is largely and differentially is influenced by the rs10877013 genotypes,
suggesting the importance of the genetic component in the final result of vitamin D system
network (Hossein-nezhad et al., 2013a; Barry et al., 2014 ; Ahn et al., 2010).
Additional elucidation of the regulatory mechanisms of this causal variant in CYP27B1 and
VDR, including potential epigenetic regulation in different cellular types and tissues, may be
relevant for many diseases associated with vitamin D deficit or with sunlight exposure deficit
during childhood (Schwalfenberg et al., 2011). We consider also important to determine

82
regulatory allelic variants that may be in the DNA regions interacting with vitamin D receptor
in target genes since they could influence the efficacy of vitamin D treatment in diverse
clinical trials (Hossein-nezhad et al., 2013b; Kuhle et al., 2015).
MS and innate antiviral response: the SP140 gene in CLL, CD and MS Referring to our results, we identified that rs28445040 is the causal SNP for the association of
the SP140 locus with MS susceptibility. To identify this SNP causality we followed strategy
of integration of the high density map of SNPs associated with MS-risk available from the
ImmunoChip Project (Parkes et al., 2013) and the high density map of eQTLs generated in
our study using RNA sequences from the GEUVADIS Project (Lappalainen, et al., 2013),
which have been obtained from the LCLs of the 1000 Genomes Project (Abecasis et al.,
2012).
We have demonstrated that this variant responsible of the splicing of the exon 7 of the SP140
gene is leading to a decrease of the full length transcript, and, as a consequence, the reduction
of the produced protein in blood cells.
Moreover, this causal SNP of the SP140 association with MS rs28445040 is in strong LD
with the variants associated with CLL and CD obtained by different GWAS (Fig.24). Both
autoimmune diseases CD and MS have been repetitively associated with the same
susceptibility loci in many studies (Voight and Cotsapas, 2012). Even though CLL is not an
autoimmune disease, it has been associated with autoimmune susceptibility loci such as: IRF4
locus associated with rheumatoid arthritis (RA) (Okada et al., 2014) and the IRF8 locus
associated with MS (Sawcer et al., 2011), RA ( Okada et al., 2012), systemic lupus
erythematosus (SLE) ( Martin et al., 2013)), inflammatory bowel disease (IBD) (Jostins et
al., 2012) and systemic scleroderma (SS) (Martin et al., 2013). So, the common characteristic
between the pathologies of AI diseases and CLL could be the immunological tolerance failure
(Garcia-Munoz et al., 2015).
Because of different density of markers used in GWAS and eQTLs studies, the colocalization
of both signals in a locus does not always indicate a common origin of effects (Battle and
Montgomery, 2014). In addition, the high LD between variants prevents the identification of a
unique SNP as the causal variant of eQTL and risk association. This is the case for the SP140
locus in which 18 SNPs, with r2 ranging between 0.965 and 1, are potential causal variants,
and therefore, the identification of the causal one had required functional studies.

83
The opposite effects of the eQTLs on the levels of expression of two SP140 transcripts,
differing in the presence or absence of exon 7, and the localization of the variant rs28445040
one of the 18 associated SNPs, were suggestive of rs28445040 as the causal SNP. We have
demonstrated by alternative splicing construct experiments that rs28445040 is the responsible
of the alternative splicing of exon7. Morevere, referring to our collaborators results, they
found by western blot that there was a T-allele dependent reduction in full-length protein
expression. Therefore, the ultimate effect of the exon-skipping seems to be the reduction of
the SP140 protein.
The association assay performed in an Spanish cohort with the best MS variant from the
GWAS (Lappalainen, et al., 2013) and the rs28445040 did not allow distinguishing which
one was the primary signal of the association due to the strong LD between them (Malo et al.,
2008). Nevertheless, our collaboratores have confirmed the association of the locus in the
Spanish cohort, showing that the T carriers, producing lower expression of the protein, had a
higher MS risk. The use of eQTL data from an African population, having different LD
pattern in the SP140 locus respect to the EUR population, resulted in an important help to
narrow down the causal variant. Thus, data of YRI eQTLs, obtained from the GEUVADIS
Project (Lappalainen, et al., 2013), pointed to rs28445040 as the most likely functional
variant affecting the splicing of SP140 exon 7.
It is so difficult to envisage the pathogenic relevance of the reduction of SP140 protein
expression in any of the associated diseases because of the limited knowledge of the
functional activity of SP140. To explain this we considered two plausible, non exclusive,
hypotheses. First, due to its strong sequence homology with the autoimmune regulator AIRE,
a transcriptional activator which plays an important role in immunity by regulating the
expression of autoantigens and negative selection of autoreactive T-cells in the thymus, we
see that the implication of SP140 in MS and other immune-mediated diseases could be related
with the process of immune self-tolerance acquisition, potentially contributing to the
autoimmune component of MS, CLL and CD. The second hypothesis is based on the
potential role of SP140 as an antiviral component of nuclear bodies induced by interferons as
showed our results in monocytes (Fig.25A). SP140 protein is implicated in innate immune
response to HIV-1 by its interaction with the virus Vif protein. As we know that one of the
putative risk factors for MS is infection with Epstein-Barr virus (EBV) (Tzartos et al., 2012) .
The “low producer” of SP140, rs28445040-T carriers, could have lower effective antiviral
response against viruses potentially implicated in MS and in the other SP140-associated
diseases.

84
Moreover, 1,25(OH)2D3 seems to activate slightly the expression of SP140 in LCLs with no
effect on the alternative allele-depending splicing (Fig.25A and Fig.26). These results can be
explained by the role of VDR activated by vitamin D that can bind the promoter element of
SP140 gene (Disanto G et al., 2012).
CLEC2D in MS The same strategy as SP140 has been followed with the locus of CLEC2D to determine the
causal SNP of the association in the region. So, we determined the best eQTLs for the
transcripts of each gene in the locus, we integrated the high density map of SNPs associated
with MS-risk available from the Immunochip Project (Parkes et al., 2013), and the high
density map of eQTLs generated in our study using RNA sequences from the GEUVADIS
Project (Lappalainen, et al., 2013), which in turn have been obtained from the LCLs of the
1000 Genomes Project (Abecasis et al., 2012). This strategy has pointed to rs3764022 as the
causative variant of the association.
Then we have demonstrated that this variant responsible of the exon 2 splicing of the
CLEC2D gene, leading to a decrease of the full length transcript. The variant rs3764022 ,
suggested as the causal SNP, has the opposite effects on the expression levels of two
CLEC2D transcripts, differing in the presence or absence of exon 2 and the localization of
this eQTLs. Therefore, the ultimate effect of the exon-skipping seems to be the reduction of
the CLEC2D protein.
Our results indicate the association between the risk MS variant and the increase of the
expression of one specific RNA of CLEC2D isoform, which lacked the exon2. CLEC2D
encodes a member of the natural killer cell receptor C-type lecitin, it's also called lectin-like
NK cell receptor or lectin-like transcript 1 (LLT1). This receptor protects target cells against
natural killer cell-mediated lysis. Also, it is able to discriminate between the self and non-self
and modulate the IFNγ production. (Zelensky and Gready, 2005)
LLT1 contains a transmembrane domain near the N-terminus as well as the C-type lectin-like
extracellular domain. The protein translated from the RNA exon2-skipped lacks the entire
transmembrane region (Germain et al., 2011) and so it accumulates in the endoplasmic
reticulum where it forms homodimers or heterodimers with the full length protein. Thus, we
would expect a lower expression of LLT1 protein on the cell surface of the individuals
carrying the G allele of the eQTL rs3764022. At the same time, G variant is the risk allele for

85
MS; therefore, the increased expression of the short protein seems to be the cause of the
association with MS.
However, when we followed the same strategy using the GWAS SNP instead the
Immunibase, CLEC1L would be the gene associated with MS (Fig. 28B). This difference may
be due to the number of markers used by GWAS and Immunochip.
Moreover, no association has been detected between best MS variant from the GWAS
rs10466829 and the rs3764022 as in the association assay study performed in Spanish cohort
as in the meta-analysis that has been done with Spanish and German populations. These
unexpected results can be owing to the difference ancestry between controls and cases in the
populations studied, that affected the genotypes distribution.

86
Conclusions

87
1. The risk variant of the association of the 12q13-14 locus with MS (rs10877013) correlates
with lower expression of CYP27B1 and VDR genes in cell and activation dependent manner,
pointing to the rs10877013 variant as a genetic determinant that affects the function of
vitamin D system linking environmental and genetic factors.
2. The SNP associated with MS in the 20q13.2 locus is close to the CYP24A1gene but it does
not seem to correlate with the expression of the gene even after vitamin D expression
induction.
3- VDR and CYP24A1 expression levels are directly correlated.
4-Low vitamin D level is more a cause than a consequence of MS disease.
5- rs28445040 explain the association in the SP140 locus as the functional variant in this
region. Risk allele is the responsible for exon-7 splicing of SP140 genes. Thus, the reduction
in the full length transcript gene expression.
6- rs3764022 is the causal variant in the locus 12p13.31. The risk allele rs3764022-G is the
responsible for exon-2 splicing of CLEC2D gene, so the decrease of the full length transcript
gene expression level.

88
References

89
Abecasis, G.R., Auton, A., Brooks, L.D., DePristo, M.A., Durbin, R.M., Handsaker, R.E.,
Kang, H.M., Marth, G.T. and McVean, G.A. (2012) An integrated map of genetic variation
from 1,092 human genomes. Nature, 491, 56-65.
Adams JS, Hewison M. Extrarenal expression of the 25-hydroxyvitamin D-1-hydroxylase.
Arch Biochem Biophys 2012;523:95–102
Aggarwal, S.; Pittenger, M.F. Human mesenchymal stem cells modulate allogeneic immune
cell responses. Blood 2005, 105, 1815–1822.
Ahn J, Yu K, Stolzenberg-Solomon R, et al. Genome-wide association study of circulating
vitamin D levels. Hum Mol Genet 2010; 19: 2739-45.
Allison RS. Geographic distribution of multiple sclerosis. Preliminary notes on a comparative
study of prevalence in Charleston, S.C. and Halifax, N.S. Acta Psychiatr Scand Suppl. 1960;
35(147):18-22.
Andersson A, Covacu R, Sunnemark D, Danilov AI, Dal Bianco A, Khademi M, Wallstrom
E, Lobell A, Brundin L, Lassmann H, Harris RA. Pivotal advance: HMGB1 expression in
active lesions of human and experimental multiple sclerosis. J Leukoc Biol 2008;84:1248–
1255.
Angelini DF, Borsellino G, Poupot M, Diamantini A, Poupot R, Bernardi G, Poccia F,
Fournie JJ, Battistini L. FcgammaRIII discriminates between 2 subsets of Vgamma9Vdelta2
effector cells with different responses and activation pathways. Blood 2004;104:1801–1807.
Araki M, Kondo T, Gumperz JE, Brenner MB, Miyake S, Yamamura T. Th2 bias of CD4+
NKT cells derived from multiple sclerosis in remission. Int Immunol 2003;15:279–288.
Ascherio A, Munger KL. Environmental risk factors for multiple sclerosis. Part I: The role of
infection. Ann Neurol. 2007;61:288–299.
Aulchenko YS et al. Genetic variation in the KIF1B locus influences susceptibility to
multiple sclerosis. Nat Genet. 2008-11-09.
Aulchenko YS, Hoppenbrouwers IA, Ramagopalan SV, Broer L, Jafari N, Hillert J, Link J,
Lundström W, Greiner E, Dessa Sadovnick A, Goossens D, Van Broeckhoven C, Del-Favero
J, Ebers GC, Oostra BA, van Duijn CM, Hintzen RQ. Genetic variation in the KIF1B locus
influences susceptibility to multiple sclerosis. Nat Genet. 2008 Dec;40(12):1402-3.

90
Australia and New Zealand Multiple Sclerosis Genetics Consortium (ANZgene). Genome-
wide association study identifies new multiple sclerosis susceptibility loci on chromosomes
12 and 20. Nat Genet. 2009 Jul;41(7):824-8.
Autier P, Boniol M, Pizot C and Mullie P. Vitamin D status and ill health: a systematic
review. Lancet Diabetes Endocrinol 2014; 2: 76-89.
Baeke F, Takiishi T, Korf H, Gysemans C, Mathieu C Vitamin D: modulator of the immune
system. Curr Opin Pharmacol. 2010 Aug; 10(4):482-96.
Baeke F, Takiishi T, Korf H, Gysemans C. Mathieu C Vitamin D: modulator of the immune
system.Curr Opin Pharmacol. 2010 Aug; 10(4):482-96.
Bahlo M, Booth DR, Broadley SA, Brown MA, Foote SJ, Griffiths LR, et al. Genome-wide
association study identifies new multiple sclerosis susceptibility loci on chromosomes 12 and
20. Nat Genet. 2009;41:824–828.
Bailey R, Cooper JD, Zeitels L, Smyth DJ, Yang JH, Walker NM, Hyppönen E, Dunger DB,
Ramos-Lopez E, Badenhoop K, Nejentsev S, Todd JA. Association of the vitamin D
metabolism gene CYP27B1 with type 1 diabetes. Diabetes 2007;56:2616–21
Banchereau J, Steinman RM. Dendritic cells and the control of immunity. Nature. 1998 Mar
19; 392(6673):245-52.
Baranzini SE et al. Genome-wide association analysis of susceptibility and clinical phenotype
in multiple sclerosis. Hum Mol Genet. 2008-11-14.
Baranzini SE, Srinivasan R, Khankhanian P, Okuda DT, Nelson SJ, Matthews PM, Hauser
SL, Oksenberg JR, Pelletier D. Genetic variation influences glutamate concentrations in
brains of patients with multiple sclerosis. Brain. 2010 Sep;133(9):2603-11.
Baranzini SE, Wang J, Gibson RA, Galwey N, Naegelin Y, Barkhof F, Radue EW, Lindberg
RL, Uitdehaag BM, Johnson MR, Angelakopoulou A, Hall L, Richardson JC, Prinjha RK,
Gass A, Geurts JJ, Kragt J, Sombekke M, Vrenken H, Qualley P, Lincoln RR, Gomez R,
Caillier SJ, George MF, Mousavi H, Guerrero R, Okuda DT, Cree BA, Green AJ, Waubant E,
Goodin DS, Pelletier D, Matthews PM, Hauser SL, Kappos L, Polman CH, Oksenberg JR.
Genome-wide association analysis of susceptibility and clinical phenotype in multiple
sclerosis. Hum Mol Genet. 2009 Feb 15;18(4):767-78.

91
Barbara Prietl, Gerlies Treiber, Thomas R. Pieber, and Karin Amrein. Vitamin D and Immune
Function Nutrients. 2013 Jul; 5(7): 2502–2521.
Barcellos LF, Sawcer S, Ramsay PP, Baranzini SE, Thomson G, et al. Heterogeneity at the
HLA-DRB1 locus and risk for multiple sclerosis. Hum Mol Genet. 2006;15:2813–2824.
Barr TA, Shen P, Brown S, et al: B cell depletion therapy ameliorates autoimmune disease
through ablation of IL-6-producing B cells. J Exp Med 2012;209:1001-1010.
Barrett JC, Clayton DG, Concannon P, Akolkar B, Cooper JD, Erlich HA, Julier C, Morahan
G, Nerup J, Nierras C, Plagnol V, Pociot F, Schuilenburg H, Smyth DJ, Stevens H, Todd JA,
Walker NM, Rich SS; Type 1 Diabetes Genetics Consortium. Genome-wide association study
and meta-analysis find that over 40 loci affect risk of type 1 diabetes. Nat Genet. 2009
Jun;41(6):703-7. doi: 10.1038/ng.381. Epub 2009 May 10.
Barrett JC, Clayton DG, Concannon P, Akolkar B, Cooper JD, Erlich HA, Julier C, Morahan
G, Nerup J, Nierras C, Plagnol V, Pociot F, Schuilenburg H, Smyth DJ, Stevens H, Todd JA,
Walker NM, Rich SS; Type 1 Diabetes Genetics Consortium. Genome-wide association study
and meta-analysis find that over 40 loci affect risk of type 1 diabetes. Nat Genet. 2009
Jun;41(6):703-7.
Barry EL, Rees JR, Peacock JL, et al. Genetic variants in CYP2R1, CYP24A1, and VDR
modify the efficacy of vitamin D3 supplementation for increasing serum 25-hydroxyvitamin
D levels in a randomized controlled trial. J Clin Endocrinol Metab 2014; 99: E2133-7.
Bartel, D. P. MicroRNAs: Genomics, biogenesis, mechanism, and function. Cell 2004; 116,
281–297.
Battle, A. and Montgomery, S.B. (2014) Determining causality and consequence of
expression quantitative trait loci. Hum Genet, 133, 727-35.
Beecham, A.H. and Patsopoulos, N.A. and Xifara, D.K. and Davis, M.F. and Kemppinen, A.
and Cotsapas, C. and Shah, T.S. and Spencer, C. and Booth, D. and Goris, A. et al. (2013)
Analysis of immune-related loci identifies 48 new susceptibility variants for multiple
sclerosis. Nat Genet, 45, 1353-60.
Ben-Hur, T.; Fainstein, N.; Nishri, Y. Cell-based reparative therapies for multiple sclerosis.
Curr. Neurol. Neurosci. Rep. 2013, 13, 397.

92
Benveniste EN. Cytokines: influence on glial cell gene expression and function. Chem
Immunol 1997;69:31–75.
Berndt SI, Skibola CF, Joseph V, Camp NJ, Nieters A, Wang Z et al. Genome-wide
association study identifies multiple risk loci for chronic lymphocytic leukemia. Nat Genet.
2013 Aug;45(8):868-76.
Bielekova B, et al. Effect of anti-CD25 antibody daclizumab in the inhibition of
inflammation and stabilization of disease progression in multiple sclerosis. Arch Neurol.
2009;66:483–489.
Bikle DD. Vitamin D: newly discovered actions require reconsideration of physiologic
requirements. Trends Endocrinol Metab 2010, 21:375-384.
Bloch DB, de la Monte SM, Guigaouri P, Filippov A, Bloch KD. Identification and
characterization of a leukocyte-specific component of the nuclear body. J Biol Chem. 1996
Nov 15;271(46):29198-204.
Boerman RH, Bax JJ, Beekhuis-Brussee JA, et al. JC virus and multiple sclerosis: a
refutation?. Acta Neurol Scand, 87 (1993), pp. 353–355
Bray PF, Bloomer LC, Salmon VC, Bagley MH, Larsen PD. Epstein-Barr virus infection and
antibody synthesis in patients with multiple sclerosis. Arch Neurol. 1983;40:406–408.
Briggs FB et al. Genome-wide association study of severity in multiple sclerosis. Genes
Immun. 2011-06-09.
Brunton LL. Immunomodulators. In: Lazo JS, Parker KL, editors. Goodman & Gilman’s The
Pharmacological Basis of Therapeutics. 11th ed. New York: McGraw-Hill Medical; 2005. pp.
1424–1427.
Brynedal B1, Wojcik J, Esposito F, Debailleul V, Yaouanq J, Martinelli-Boneschi F, Edan G,
Comi G, Hillert J, Abderrahim H. MGAT5 alters the severity of multiple sclerosis. J
Neuroimmunol. 2010 Mar 30;220(1-2):120-4.
Burgoon M.P., Cohrs R.J, Bennett J.L.,. Anderson S.W, Ritchie A.M., Cepok S., Hemmer B.,
Gilden D., Owens G.P.. Varicella zoster virus is not a disease-relevant antigen in multiple
sclerosis. Annals of Neurology, 65 (2009), pp. 474–479

93
Caballero A, Alvés-León S, Papais-Alvarenga R, Fernández O, Navarro G, et al. DQB1*0602
confers genetic susceptibility to multiple sclerosis in Afro-Brazilians. Tissue Antigens.
1999;54:524–526.
Caplan, A.I. Mesenchymal stem cells. J. Orthop. Res. 1991, 9, 641–650.
Carlens C, Hergens MP, Grunewald J, Ekbom A, Eklund A, Höglund CO, Askling J.
Smoking, use of moist snuff, and risk of chronic inflammatory diseases. Am J Respir Crit
Care Med. 2010 Jun 1; 181(11):1217-22.
Chang, T. C., & Mendell, J. T. (2007). microRNAs in vertebrate physiology and human
disease. Annual Review of Genomics and Human Genetics 2007; 8, 215–239.
Chao MJ, Barnardo MC, Lincoln MR, Ramagopalan SV, Herrera BM, et al. HLA class I
alleles tag HLA-DRB1*1501 haplotypes for differential risk in multiple sclerosis
susceptibility. Proc Natl Acad Sci U S A. 2008;105:13069–13074.
Charcot, J. Histologiede la sclerose en plaues. Gazette des hopitaux, Paris 1868, 41, 554-5.
Chepelev I, Wei G, Wangsa D, Tang Q, Zhao K.Characterization of genome-wide enhancer-
promoter interactions reveals co-expression of interacting genes and modes of higher order
chromatin organization. Cell Res 2012; 22: 490-503.
Christy AL, Brown MA. The multitasking mast cell: positive and negative roles in the
progression of autoimmunity. J Immunol 2007;179:2673–2679.
Cohen J, Barkhof F, Comi G, Hartung HP, Khatri BO, Montalban X, Pelletier J, Capra R,
Gallo P, Izquierdo G, Tiel-Wilck K, de Vera A, Jin J, Stites T, Wu S, Aradhye S, Kappos L.
and TRANSFORMS Study Group. Oral fingolimod or intramuscular interferon for relapsing
multiple sclerosis. N. Engl. J. Med.2010;362:402–415.
Comabella M, Craig DW, Camiña-Tato M, Morcillo C, Lopez C, Navarro A, Rio J;
BiomarkerMS Study Group, Montalban X, Martin R. Identification of a novel risk locus for
multiple sclerosis at 13q31.3 by a pooled genome-wide scan of 500,000 single nucleotide
polymorphisms. PLoS One. 2008;3(10):e3490.
Compston A, Coles A. Multiple sclerosis. Lancet. 2008;372:1502–1517.
Compston A, Coles A. Multiple sclerosis. The Lancet 2002 , Volume 360, Issue 9333, Page
648.

94
Comuzzie AG, Cole SA, Laston SL, Voruganti VS, Haack K, Gibbs RA, Butte NF. Novel
genetic loci identified for the pathophysiology of childhood obesity in the Hispanic
population. PLoS One. 2012;7(12):e51954.
Connick, P.; Kolappan, M.; Crawley, C.; Webber, D.J.; Patani, R.; Michell, A.W.; Du, M.Q.;
Luan, S.L.; Altmann, D.R.; Thompson, A.J.; et al. Autologous mesenchymal stem cells for
the treatment of secondary progressive multiple sclerosis: An open-label phase 2a proof-of-
concept study. Lancet Neurol. 2012, 11, 150–156.
Cortessis VK, Thomas DC, Levine AJ, et al. Environmental epigenetics: prospects for
studying epigenetic mediation of exposure–response relationships. Human Genetics.
2012;131(10):1565-1589.
D Krametter, G Niederwieser, A Berghold, et al. Chlamydia pneumoniae in multiple
sclerosis: humoral immune responses in serum and cerebrospinal fluid and correlation with
disease activity marker. Mult Scler, 7 (2001), pp. 13–18
De Jager PL et al. Meta-analysis of genome scans and replication identify CD6, IRF8 and
TNFRSF1A as new multiple sclerosis susceptibility loci. Nat Genet. 2009-06-14.
De Jager PL1, Jia X, Wang J, de Bakker PI, Ottoboni L, Aggarwal NT, Piccio L,
Raychaudhuri S, Tran D, Aubin C, Briskin R, Romano S; International MS Genetics
Consortium, Baranzini SE, McCauley JL, Pericak-Vance MA, Haines JL, Gibson RA,
Naeglin Y, Uitdehaag B, Matthews PM, Kappos L, Polman C, McArdle WL, Strachan DP,
Evans D, Cross AH, Daly MJ, Compston A, Sawcer SJ, Weiner HL, Hauser SL, Hafler DA,
Oksenberg JR. Meta-analysis of genome scans and replication identify CD6, IRF8 and
TNFRSF1A as new multiple sclerosis susceptibility loci. Nat Genet. 2009 Jul;41(7):776-82.
Degner JF, Pai AA, Pique-Regi R, et al. DNaseI sensitivity QTLs are a major determinant of
human expression variation. Nature. 2012;482(7385):390-394.
Dessau RB, Lisby G, Frederiksen JL. Coronaviruses in brain tissue from patients with
multiple sclerosis. Acta Neuropathol (Berl), 101 (2001), pp. 601–604
Dhib-Jalbut S, Marks S. Interferon-beta mechanisms of action in multiple sclerosis.
Neurology. 2010; 74:S17–S24.
95
Di Bernardo MC1, Crowther-Swanepoel D, Broderick P, Webb E, Sellick G et al. A genome-
wide association study identifies six susceptibility loci for chronic lymphocytic leukemia. Nat
Genet. 2008 Oct;40(10):1204-10
Dimas AS, Deutsch S, Stranger BE, et al. Common regulatory variation impacts gene
expression in a cell type dependent manner. Science (New York, NY). 2009;325(5945):1246-
1250.
Dixon AL, Liang L, Moffatt MF, Chen W, Heath S, et al. A genome-wide association study
of global gene expression. Nat Genet. 2007;39:1202–1207.
Duddy, M. NICE approval of dimethyl fumarate could benefit thousands living with
Durbin, R. M.; Abecasis, G. R.; Altshuler, R. M.; Auton, G. A. R.; Brooks, D. R.; Durbin, A
et al. A map of human genome variation from population-scale sequencing. Nature 2010;
467 (7319): 1061–1073
Dusso AS. Kidney disease and vitamin D levels: 25-hydroxyvitamin D, 1,25-
dihydroxyvitamin D, and VDR activation. Kidney inter., Suppl. 2011; 1: 136–141.
Fairfax BP, Humburg P, Makino S, et al. Innate Immune Activity Conditions the Effect of
Regulatory Variants upon Monocyte Gene Expression. Science (New York, NY).
2014;343(6175):1246949.
Farh, K.K., Marson, A., Zhu, J., Kleinewietfeld, M., Housley, W.J., Beik, S., Shoresh, N.,
Whitton, H., Ryan, R.J., Shishkin, A.A. et al. (2015) Genetic and epigenetic fine mapping of
causal autoimmune disease variants. Nature, 518, 337-43.
Farrall M. Quantitative genetic variation: a post-modern view. Hum Mol Genet. 2004 Apr
1;13 Spec No 1:R1-7
Fatemi, M., Pao, M. M., Jeong, S., Gal-Yam, E. N., Egger, G., Weisenberger, D. J., et al.
Footprinting of mammalian promoters: Use of a CpG DNA methyltransferase revealing
nucleosome positions at a single molecule level. Nucleic Acids Research 005; 33, e176.
Ferrante P, Omodeo-Zorini E, Caldarelli-Stefano R, et al. Detection of JC virus DNA in
cerebrospinal fluid from multiple sclerosis patients. Mult Scler, 4 (1998), pp. 49–54
Fogdell A, Hillert J, Sachs C, Olerup O. The multiple sclerosis- and narcolepsy-associated
HLA class II haplotype includes the DRB5*0101 allele. Tissue Antigens. 1995;46:333–336.

96
Fortune MD, Guo H, Burren O, Schofield E, Walker NM, Ban M, Sawcer SJ, Bowes J,
Worthington J, Barton A, Eyre S, Todd JA, Wallace C. Statistical colocalization of genetic
risk variants for related autoimmune diseases in the context of common controls. Nat Genet.
2015 Jul;47(7):839-46.
Franke A, McGovern DP, Barrett JC, Wang K, Radford-Smith GL et al. Genome-wide meta-
analysis increases to 71 the number of confirmed Crohn's disease susceptibility loci. Nat
Genet. 2010 Dec;42(12):1118-25.
Fraser KB, Millar JHD, Haire M, McCrea S. Increased tendency to spontaneous in-vitro
lymphocyte transformation in clinically active multiple sclerosis. Lancet. 1979;314:715–717.
Fung EY, Smyth DJ, Howson JM, Cooper JD, Walker NM, Stevens H, Wicker LS, Todd JA.
Analysis of 17 autoimmune disease-associated variants in type 1 diabetes identifies
6q23/TNFAIP3 as a susceptibility locus. Genes Immun 2009;10:188–91
Gaffney DJ, Veyrieras J-B, Degner JF, et al. Dissecting the regulatory architecture of gene
expression QTLs. Genome Biology. 2012;13(1):R7.
Gandhi R, Laroni A, Weiner HL. Role of the innate immune system in the pathogenesis of
multiple sclerosis. J Neuroimmunol2010; 221:7–14.
Gandhi, R., Laroni, A., Weiner, H.L. Role of the innate immune system in the pathogenesis
of multiple sclerosis. J. Neuroimmunol., 2009, 221, 7-14.
Garcia-Munoz, R., Feliu, J. and Llorente, L. (2015) The top ten clues to understand the origin
of chronic lymphocytic leukemia (CLL). J Autoimmun, 56, 81-6.
Genain CP, Cannella B, Hauser SL, Raine CS. 1999. Identification of autoantibodies
associated with myelin damage in multiple sclerosis. Nat. Med. 5:170–75
Genain CP, Nguyen MH, Letvin NL, et al: Antibody facilitation of multiple sclerosis-like
lesions in a nonhuman primate. J Clin Invest 1995;96:2966-2974.
Genain CP, NguyenMH,Letvin NL, Pearl R, Davis RL, et al. 1995. Antibody facilitation of
multiple sclerosis-like lesions in a nonhuman primate. J. Clin. Invest. 96: 2966–74
Germain, C., Meier, A., Jensen, T., Knapnougel, P., Poupon, G., Lazzari, A., Neisig, A.,
Håkansson, K., Dong, T., Wagtmann, N., et al. (2011). Induction of lectin-like transcript 1

97
(LLT1) protein cell surface expression by pathogens and interferon-γ contributes to modulate
immune responses. J. Biol. Chem. 286, 37964-37975.
Ghadirian P, Dadgostar B, Azani R, Maisonneuve P. A case-control study of the association
between socio-demographic, lifestyle and medical history factors and multiple sclerosis.Can J
Public Health. 2001 Jul-Aug; 92(4):281-5.
Gillie O. Controlled trials of vitamin D, causality and type 2 statistical error. Public Health
Nutr 2014.
Giovannoni G, Comi G, Cook S, Rammohan K, Rieckmann P, Soelberg SP, Vermesch P,
Greenberg S. and CLARITY Study Group. A placebo-controlled trial of oral cladribine for
relapsing multiple sclerosis.N. Engl. J. Med. 2010;362:416–426.
Goodin DS. The genetic and environmental bases of complex human-disease: extending the
utility of twin-studies. PLoS One 2012; 7:e47875.
Goris A, van Setten J, Diekstra F, Ripke S, Patsopoulos NA, Sawcer SJ; International
Multiple Sclerosis Genetics Consortium, van Es M; Australia and New Zealand MS Genetics
Consortium, Andersen PM, Melki J, Meininger V, Hardiman O, Landers JE, Brown RH Jr,
Shatunov A, Leigh N, Al-Chalabi A, Shaw CE, Traynor BJ, Chiò A, Restagno G, Mora G,
Ophoff RA, Oksenberg JR, Van Damme P, Compston A, Robberecht W, Dubois B, van den
Berg LH, De Jager PL, Veldink JH, de Bakker PI.No evidence for shared genetic basis of
common variants in multiple sclerosis and amyotrophic lateral sclerosis.Hum Mol Genet.
2014 Apr 1;23(7):1916-22.
Gourraud PA, Sdika M, Khankhanian P, Henry RG, Beheshtian A, Matthews PM, Hauser SL,
Oksenberg JR, Pelletier D, Baranzini SE. A genome-wide association study of brain lesion
distribution in multiple sclerosis. Brain. 2013 Apr;136(Pt 4):1012-24.
Gregersen JW, Kranc KR, Ke X, Svendsen P, Madsen LS, et al. Functional epistasis on a
common MHC haplotype associated with multiple sclerosis. Nature. 2006;443:574–577.
GTEx Consortium. Human genomics. The Genotype-Tissue Expression (GTEx) pilot
analysis: multitissue gene regulation in humans. Science. 2015 May 8;348(6235):648-60.
Gutierrez J, Vergara MJ, Guerrero M, et al. Multiple sclerosis and human herpesvirus 6.
Infection, 30 (2002), pp. 145–149

98
Haas, J., Hug, A., Veihover, A., Fritzching, B., Falk, C.S, Filser, A., Vetter, T., Milkova L,
Korporal, M., Fritz, B., Storch- Hagenlocher, B., Krammer, P.H., Suri-Payer, E., Wildeman,
B. Reduced suppressive effect of CD4+CD25 high regulatory T cells on the T cell immune
response against myelin oligodendrocyte glycoprotein in patients with multiple sclerosis. Eur.
J. Immunol., 2005, 35, 3343-3352.
Hammarberg H, Lidman O, Lundberg C, Eltayeb SY, Gielen AW, Muhallab S, Svenningsson
A, Linda H, van Der Meide PH, Cullheim S, Olsson T, Piehl F. Neuroprotection by
encephalomyelitis: rescue of mechanically injured neurons and neurotrophin production by
CNS infiltrating T and natural killer cells. J Neurosci 2000;20:5283–5291.
Handunnetthi L, Ramagopalan SV, Ebers GC, Knight JC. Regulation of major
histocompatibility complex class II gene expression, genetic variation and disease. Genes
Immun. 2010;11:99–112.
Hannah SS, Norman AW. 1 alpha,25(OH)2 vitamin D3-regulated expression of the
eukaryotic genome. Nutr Rev. 1994 Nov;52(11):376-82.
Harp CT, Ireland S, Davis LS, et al: Memory B cells from a subset of treatment-naïve
relapsing-remitting multiple sclerosis patients elicit CD4(+) T-cell proliferation and IFN-γ
production in response to myelin basic protein and myelin oligodendrocyte glycoprotein. Eur
J Immunol 2010;40:2942-2956.
Hauser S, Waubant E, Arnold D, Vollmer T, Antel J, Fox R, Bar-Or A, Panzara M, Sarkar N,
Agarwal S, Langer-Gould M, Smith C. and Hermes Trial Group. B-cell depletion with
rituximab in relapsing remitting multiple sclerosis. N. Engl. J. Med. 2008;358:676–688.
Hauser SL, Goodwin DS. Multiple sclerosis and other demyelinating diseases. In: Fauci AS,
Braunwald E, Kasper DL, Hauser SL, editors. Harrison’s Principles of Internal Medicine.
17th ed. II. New York: McGraw-Hill Medical; 2008. pp. 2611–2621.
Hauser, S.L.; Chan, J.R.; Oksenberg, J.R. Multiple sclerosis: Prospects and promise. Ann.
Neurol. 2013, 74, 317–327.
Haussler MR, Whitfield GK, Kaneko I, Haussler CA, Hsieh D, Hsieh JC, Jurutka PW.
Molecular mechanisms of vitamin D action. Calcif Tissue Int. 2013 Feb;92(2):77-98.
Hawkes CH. Is multiple sclerosis a sexually transmitted infection?. J Neurol Neurosurg
Psychiatry, 73 (2002), pp. 439–443

99
Hayday AC. [gamma][delta] cells: a right time and a right place for a conserved third way of
protection. Annu Rev Immunol 2000;18:975–1026.
Hedström AK, Bäärnhielm M, Olsson T, Alfredsson L. Exposure to environmental tobacco
smoke is associated with increased risk for multiple sclerosis. Mult Scler. 2011 Jul;
17(7):788-93.
Hedström AK, Bäärnhielm M, Olsson T, Alfredsson L. Tobacco smoking, but not Swedish
snuff use, increases the risk of multiple sclerosis. Neurology. 2009 Sep 1; 73(9):696-701.
Hernán MA, Jick SS, Logroscino G, Olek MJ, Ascherio A, Jick H. Cigarette smoking and the
progression of multiple sclerosis. Brain. 2005 Jun; 128(Pt 6):1461-5.
Hohlfeld R. Multiple Sclerosis: A Comprehensive Text. Saunders/Elsevier, 2008.
Holick MF . Vitamin D deficiency. N Engl J Med 2007; 357: 266–81.
Hossein-nezhad A and Holick MF. Vitamin D for health: a global perspective. Mayo Clin
Proc 2013b; 88: 720-55.
Hossein-nezhad A, Spira A and Holick MF. Influence of vitamin D status and vitamin D3
supplementation on genome wide expression of white blood cells: a randomized double-blind
clinical trial. PLoS One 2013a; 8: e58725.
Huang YM, Xiao BG, Ozenci V, Kouwenhoven M, Teleshova N, Fredrikson S, Link H.
Multiple sclerosis is associated with high levels of circulating dendritic cells secreting pro-
inflammatory cytokines. J Neuroimmunol 1999;99:82–90.
Innocenti F, Cooper GM, Stanaway IB, et al. Identification, Replication, and Functional Fine-
Mapping of Expression Quantitative Trait Loci in Primary Human Liver Tissue. Storey JD,
ed. PLoS Genetics. 2011;7(5):e1002078.
International Multiple Sclerosis Genetics Consortium. Genome-wide association study of
severity in multiple sclerosis. Genes Immun. 2011 Dec;12(8):615-25.
International Multiple Sclerosis Genetics Consortium1, Hafler DA, Compston A, Sawcer S,
Lander ES, Daly MJ, De Jager PL, de Bakker PI, Gabriel SB, Mirel DB, Ivinson AJ, Pericak-
Vance MA, Gregory SG, Rioux JD, McCauley JL, Haines JL, Barcellos LF, Cree B,
Oksenberg JR, Hauser SL. Risk alleles for multiple sclerosis identified by a genomewide
study. N Engl J Med. 2007 Aug 30;357(9):851-62. Epub 2007 Jul 29.

100
International Multiple Sclerosis Genetics, C., Wellcome Trust Case Control, C., Sawcer, S.,
Hellenthal, G., Pirinen, M., Spencer, C. C., Patsopoulos, N. A., Moutsianas, L., Dilthey, A.,
Su, et al. (2011) Genetic risk and a primary role for cell-mediated immune mechanisms in
multiple sclerosis. Nature. 2011 Aug 10;476(7359):214-9.
Islam T, Gauderman WJ, Cozen W, Mack TM. Neurology. Childhood sun exposure
influences risk of multiple sclerosis in monozygotic twins. 2007 Jul 24; 69(4):381-8.
Jakkula E1, Leppä V, Sulonen AM, Varilo T, Kallio S, Kemppinen A, Purcell S, Koivisto K,
Tienari P, Sumelahti ML, Elovaara I, Pirttilä T, Reunanen M, Aromaa A, Oturai AB,
Søndergaard HB, Harbo HF, Mero IL, Gabriel SB, Mirel DB, Hauser SL, Kappos L, Polman
C, De Jager PL, Hafler DA, Daly MJ, Palotie A, Saarela J, Peltonen L. Genome-wide
association study in a high-risk isolate for multiple sclerosis reveals associated variants in
STAT3 gene. Am J Hum Genet. 2010 Feb 12;86(2):285-91.
Jansen R.C., Nap J.P. Genetical genomics: the added value from segregation. Trends Genet.,
17 (2001), pp. 388–391
Jeffery L.E., Burke F., Mura M., Zheng Y., Qureshi O.S., Hewison M., Walker L.S.K.,
Lammas D.A., Raza K., Sansom D.M. 1,25-Dihydroxyvitamin D3 and IL-2 combine to
inhibit T cell production of inflammatory cytokines and promote development of regulatory T
cells expressing CTLA-4 and FoxP3. J. Immunol. 2009;183:5458–5467.
Jersild C, Fog T. Histocompatibility (HL-A) antigens associated with multiple sclerosis. Acta
Neurol Scand Suppl. 1972;51:377.
Jocher R, Rethwilm A, Kappos L, Meulen V ter. Search for retroviral sequences in peripheral
blood mononuclear cells and brain tissue of multiple sclerosis patients. J Neurol, 237 (1990),
pp. 352–355.
Johnson D, Seeldrayers PA, Weiner HL. The role of mast cells in demyelination. 1. Myelin
proteins are degraded by mast cell proteases and myelin basic protein and P2 can stimulate
mast cell degranulation. Brain Res 1988;444:195–198.
Jones G . Pharmacokinetics of vitamin D toxicity. Am J Clin Nutr 2008; 88: 582S–6S.
Joseph K. Pickrell, John C. Marioni, Athma A. Pai, Jacob F. Degner, Barbara E. Engelhardt,
Everlyne Nkadori , Jean-Baptiste Veyrieras, Matthew Stephens , Yoav Gilad & Jonathan K.

101
Pritchard. Understanding mechanisms underlying human gene expression variation with RNA
sequencing. Nature. 2010; 464, 768-772
Jostins L, Ripke S, Weersma RK, Duerr RH, McGovern DP et al.Host-microbe interactions
have shaped the genetic architecture of inflammatory bowel disease. Nature. 2012 Nov
1;491(7422):119-24.
Jostins, L., Ripke, S., Weersma, R.K., Duerr, R.H., McGovern, D.P., Hui, K.Y., Lee, J.C.,
Schumm, L.P., Sharma, Y., Anderson, C.A. et al. (2012) Host-microbe interactions have
shaped the genetic architecture of inflammatory bowel disease. Nature, 491, 119-24.
Kawakami M , Imawari M , Goodman DS . Quantitative studies of the interaction of
cholecalciferol (vitamin D3) and its metabolites with different genetic variants of the serum
binding protein for these sterols. Biochem J 1979; 179: 413–23.
Kinnunen T, Chamberlain N, Morbach H, et al: Specific peripheral B cell tolerance defects in
patients with multiple sclerosis. J Clin Invest 2013;123:2737-2741.
Koch, M. W., Metz, L. M., & Kovalchuk, O. Epigenetic changes in patients with multiple
sclerosis. Nature Reviews Neurology 2013b; 9, 35–43.
Koch, M. W., Metz, L. M., & Kovalchuk, O. Epigenetics and miRNAs in the diagnosis and
treatment of multiple sclerosis. Trends in Molecular Medicine 2013a; 19, 23–30.
Kouzarides, T. Chromatin modifications and their function. Cell 2007; 128, 693–705.
Kragt J, van Amerongen B, Killestein J, Dijkstra C, Uitdehaag B, Polman Ch, Lips P. Higher
levels of 25-hydroxyvitamin D are associated with a lower incidence of multiple sclerosis
only in women. Mult Scler. 2009 Jan; 15(1):9-15.
Krementsov DN, Thornton TM, Teuscher C, Rincon M. The emerging role of p38 mitogen-
activated protein kinase in multiple sclerosis and its models. Mol Cell Biol. 2013
Oct;33(19):3728-34.
Kuhle J, Disanto G, Dobson R, et al. Conversion from clinically isolated syndrome to
multiple sclerosis: A large multicentre study. Mult Scler 2015.
Lappalainen T, Sammeth M, Friedländer MR, et al. Transcriptome and genome sequencing
uncovers functional variation in humans. Nature. 2013;501(7468):506-511.

102
Lappalainen, T., Sammeth, M., Friedlander, M.R., t Hoen, P.A., Monlong, J., Rivas, M.A.,
Gonzalez-Porta, M., Kurbatova, N., Griebel, T., Ferreira, P.G. et al. (2013) Transcriptome
and genome sequencing uncovers functional variation in humans. Nature, 501, 506-11.
Lappalainen, T., Sammeth, M., Friedlander, M.R., t Hoen, P.A., Monlong, J., Rivas, M.A.,
Gonzalez-Porta, M., Kurbatova, N., Griebel, T., Ferreira, P.G. et al. (2013) Transcriptome
and genome sequencing uncovers functional variation in humans. Nature, 501, 506-11.
Lappalainen, T., Sammeth, M., Friedlander, M.R., t Hoen, P.A., Monlong, J.,
Lappalainen, T., Sammeth, M., Friedlander, M.R., t Hoen, P.A., Monlong, J.,Rivas, M.A.,
Gonzalez-Porta, M., Kurbatova, N., Griebel, T., Ferreira, P.G. et al. Transcriptome and
genome sequencing uncovers functional variation in humans. Nature,2013; 501, 506-11.
Lauc G, Huffman JE, Pučić M, Zgaga L, Adamczyk B, Mužinić A, Novokmet M, Polašek O,
Gornik O, Krištić J, Keser T, Vitart V, Scheijen B, Uh HW, Molokhia M, Patrick AL,
McKeigue P, Kolčić I, Lukić IK, Swann O, van Leeuwen FN, Ruhaak LR, Houwing-
Duistermaat JJ, Slagboom PE, Beekman M, de Craen AJ,Deelder AM, Zeng Q, Wang W,
Hastie ND, Gyllensten U, Wilson JF, Wuhrer M, Wright AF, Rudd PM, Hayward C,
Aulchenko Y, Campbell H, Rudan I. Loci associated with N-glycosylation of human
immunoglobulin G show pleiotropy with autoimmune diseases and haematological cancers.
PLoS Genet. 2013;9(1):e1003225.
Lazaros Belbasis, Vanesa Bellou, Evangelos Evangelou, John P A Ioannidis, Ioanna
Tzoulaki. Environmental risk factors and multiple sclerosis: an umbrella review of systematic
reviews and meta-analyses . Lancet Neurol. 2015 Mar;14(3):263-73.
Lemire JM, Adams JS, Sakai R, Jordan SC. 1 alpha,25-dihydroxyvitamin D3 suppresses
proliferation and immunoglobulin production by normal human peripheral blood
mononuclear cells. J Clin Invest. 1984 Aug; 74(2):657-61.
Leone MA, Barizzone N, Esposito F, Lucenti A, Harbo HF, Goris A, Kockum I, Oturai AB,
Celius EG, Mero IL, Dubois B, Olsson T, Søndergaard HB, Cusi D, Lupoli S, Andreassen
BK; International Multiple Sclerosis Genetics Consortium; Wellcome Trust Case Control
Consortium 2, Myhr KM, Guerini FR; PROGEMUS Group; PROGRESSO Group, Comi G,
Martinelli-Boneschi F, D'Alfonso S. Association of genetic markers with CSF oligoclonal
bands in multiple sclerosis patients. PLoS One. 2013 Jun 13;8(6):e64408.

103
Levin LI, Munger KL, O'Reilly EJ, Falk KI, Ascherio A. Primary infection with the Epstein-
Barr virus and risk of multiple sclerosis. Ann Neurol. 2010;67:824–830.
Li G, Ruan X, Auerbach RK, et al. Extensive promoter-centered chromatin interactions
provide a topological basis for transcription regulation. Cell 2012; 148: 84-98.
Liedtke W, Malessa R, Faustmann PM, Eis-Hubinger AM. Human herpesvirus 6 polymerase
chain reaction findings in human immunodeficiency virus associated neurological disease and
multiple sclerosis. J Neurovirol, 1 (1995), pp. 253–258
Lincoln MR, Ramagopalan SV, Chao MJ, Herrera BM, Deluca GC, et al. Epistasis among
HLA-DRB1, HLA-DQA1, and HLA-DQB1 loci determines multiple sclerosis susceptibility.
Proc Natl Acad Sci U S A. 2009;106:7542–7547.
Litzenburger T, Fassler R, Bauer J, Lassmann H, Linington C, et al. 1998. B lymphocytes
producing demyelinating autoantibodies: development and function in gene-targeted
transgenic mice. J. Exp. Med. 188:169–80
Liu J, Wang L, Zhan S, Tan J, Xia Y. Daclizumab for relapse remitting multiple sclerosis.
Cochrane Database Syst. Rev. 2007;6:CD008127.
Llufriu, S.; Sepulveda, M.; Blanco, Y.; Marin, P.; Moreno, B.; Berenguer, J.; Gabilondo, I.;
Martinez-Heras, E.; Sola-Valls, N.; Arnaiz, J.A.; et al. Randomized placebo-controlled phase
II trial of autologous mesenchymal stem cells in multiple sclerosis. PLoS ONE 2014, 9,
e113936.
Loma I, Heyman R. Multiple sclerosis: Pathogenesis and treatment. Curr Neuropharmacol.
2011;3:409–16.
Lowe KE, Maiyar AC, Norman AW. Vitamin D-mediated gene expression. Crit Rev
Eukaryot Gene Expr. 1992;2(1):65-109.
Maccario, R.; Podesta, M.; Moretta, A.; Cometa, A.; Comoli, P.; Montagna, D.; Daudt, L.;
Ibatici, A.; Piaggio, G.; Pozzi, S.; et al. Interaction of human mesenchymal stem cells with
cells involved in alloantigen-specific immune response favors the differentiation of CD4+ T-
cell subsets expressing a regulatory/suppressive phenotype. Haematologica 2005, 90, 516–
525.

104
Madani N, Millette R, Platt EJ, Marin M, Kozak SL, Bloch DB & Kabat D. Implication of the
lymphocyte-specific nuclear body protein Sp140 in an innate response to human
immunodeficiency virus type 1. J Virol. 2002 Nov;76(21):11133-8
Malaviya R, Twesten NJ, Ross EA, Abraham SN, Pfeifer JD. Mast cells process bacterial Ags
through a phagocytic route for class I MHC presentation to T cells. J Immunol
1996;156:1490–1496.
Malo, N., Libiger, O. and Schork, N.J. (2008) Accommodating linkage disequilibrium in
genetic-association analyses via ridge regression. Am J Hum Genet, 82, 375-85.
Margherita T. Cantorna, Lindsay Snyder, Yang-Ding Lin, and Linlin Yang. Vitamin D and
1,25(OH)2D Regulation of T cells. Nutrients. 2015 Apr; 7(4): 3011–3021.
Marrosu MG, Murru MR, Costa G, Murru R, Muntoni F, et al. DRB1-DQA1-DQB1 loci and
multiple sclerosis predisposition in the Sardinian population. Hum Mol Genet. 1998;7:1235–
1237.
Martin, J.E., Assassi, S., Diaz-Gallo, L.M., Broen, J.C., Simeon, C.P., Castellvi, I., Vicente-
Rabaneda, E., Fonollosa, V., Ortego-Centeno, N., Gonzalez-Gay, M.A. et al. (2013) A
systemic sclerosis and systemic lupus erythematosus pan-meta-GWAS reveals new shared
susceptibility loci. Hum Mol Genet, 22, 4021-9.
Martinelli-Boneschi F1, Esposito F, Brambilla P, Lindström E, Lavorgna G, Stankovich J,
Rodegher M, Capra R, Ghezzi A, Coniglio G, Colombo B, Sorosina M, Martinelli V, Booth
D, Oturai AB, Stewart G, Harbo HF, Kilpatrick TJ, Hillert J, Rubio JP, Abderrahim H,
Wojcik J, Comi G. A genome-wide association study in progressive multiple sclerosis. Mult
Scler. 2012 Oct;18(10):1384-94. Epub 2012 Mar 28.
Matesanz F1, González-Pérez A, Lucas M, Sanna S, Gayán J, Urcelay E, Zara I, Pitzalis M,
Cavanillas ML, Arroyo R, Zoledziewska M, Marrosu M, Fernández O, Leyva L, Alcina A,
Fedetz M, Moreno-Rey C, Velasco J, Real LM, Ruiz-Peña JL, Cucca F, Ruiz A, Izquierdo G.
Genome-wide association study of multiple sclerosis confirms a novel locus at 5p13.1. PLoS
One. 2012;7(5):e36140.
Matsuoka LY, Ide L, Wortsman J, et al. Sunscreens suppress cutaneous vitamin D3 synthesis.
J Clin Endocrinol Metab. 1987;64:1165–8.

105
Matsuoka LY, Wortsman J, Dannenberg MJ, et al. Clothing prevents ultraviolet-B radiation-
dependent photosynthesis of vitamin D3. J Clin Endocrinol Metab. 1992;75:1099–103.
Mawer EB , Backhouse J , Holman CA , Lumb GA , Stanbury SW . The distribution and
storage of vitamin D and its metabolites in human tissues. Clin Sci 1972; 43: 413–31.
Mazerski J, Martelli S, Borowski E."The geometry of intercalation complex of antitumor
mitoxantrone and ametantrone with DNA: molecular dynamics simulations. Acta Biochim.
Pol. 1998; 45 (1): 1–11
McElroy JP, Cree BA, Caillier SJ, Gregersen PK, Herbert J, et al. Refining the association of
MHC with multiple sclerosis in African Americans. Hum Mol Genet. 2010;19:3080–3086
McElroy JP, Oksenberg JR. Multiple sclerosis genetics. Neurol Clin. 2011 May;29(2):219-31.
MChen S, Sims GP, Chen XX, Gu YY, Chen S, Lipsky PE odulatory effects of 1,25-
dihydroxyvitamin D3 on human B cell differentiation. J Immunol. 2007 Aug 1; 179(3):1634-
47.
Medic N, Vita F, Abbate R, Soranzo MR, Pacor S, Fabbretti E, Borelli V, Zabucchi G. Mast
cell activation by myelin through scavenger receptor. J Neuroimmunol 2008;200:27–40.
Mero IL, Gustavsen MW, Sæther HS, Flåm ST, Berg-Hansen P, Søndergaard HB, Jensen PE,
Berge T, Bjølgerud A, Muggerud A, Aarseth JH; International Multiple Sclerosis Genetics
Consortium, Myhr KM, Celius EG, Sellebjerg F, Hillert J, Alfredsson L, Olsson T, Oturai
AB, Kockum I, Lie BA, Andreassen BK, Harbo HF. Oligoclonal band status in Scandinavian
multiple sclerosis patients is associated with specific genetic risk alleles. PLoS One.
2013;8(3):e58352.
Minagar A, Alexander S, Sharain M, Zivadinov R. Alemtuzumab and multiple sclerosis:
therapeutic application. Expert Opin. Biol. Ther. 2010;10:421–429.
Minghetti PP, Norman AW . 1,25(OH)2-vitamin D3 receptors: gene regulation and genetic
circuitry. FASEB J. 1988 Dec;2(15):3043-53.
Miyama, K.J., Nakae, S., Matsuki, T., Nambu, A., Ishigame, H, Kakuta, S., Sudo, K.,
Iwakura, Y. IL-17 plays an important role in the development of experimental autoimmune
encephalomyelitis. J. Immunol., 2006, 177, 566-573.

106
Molnarfi N, Schulze-Topphoff U, Weber MS, et al: MHC class II-dependent B cell APC
function is required for induction of CNS autoimmunity independent of myelin-specific
antibodies. J Exp Med 2013;210:2921-2937.
Montgomery SB, Sammeth M, Gutierrez-Arcelus M, Lach RP, Ingle C, Nisbett J, Guigo R,
Dermitzakis ET. Transcriptome genetics using second generation sequencing in a Caucasian
population. Nature. 2010 Apr 1;464(7289):773-7.
Morán-Auth Y, Penna-Martinez M, Shoghi F, Ramos-Lopez E, Badenhoop K. Vitamin D
status and gene transcription in immune cells. J Steroid Biochem Mol Biol 2013; 136: 83-5.
Moretta A, Marcenaro E, Parolini S, Ferlazzo G, Moretta L. NK cells at the interface between
innate and adaptive immunity. Cell Death Differ 2008;15:226–233.
Moy KA, Mondul AM, Zhang H, Weinstein SJ, Wheeler W, Chung CC, Männistö S, Yu K,
Chanock SJ, Albanes D. Genome-wide association study of circulating vitamin D-binding
protein. Am J Clin Nutr. 2014 Jun;99(6):1424-31.
Müller K, Diamant M, Bendtzen K. Inhibition of production and function of interleukin-6 by
1,25-dihydroxyvitamin D3. Immunol Lett. 1991 May; 28(2):115-20.
Munger KL and Ascherio A. Prevention and treatment of MS: studying the effects of vitamin
D. Mult Scler 2011; 17: 1405-11.
Munger KL, Köchert K, Simon KC, et al. Molecular mechanism underlying the impact of
vitamin D on disease activity of MS. Ann Clin Transl Neurol 2014; 1: 605-17.
Munger KL, Levin LI, Hollis BW, Howard NS, Ascherio A. Serum 25-hydroxyvitamin D
levels and risk of multiple sclerosis. JAMA. 2006;296(23):2832-8.
Munger KL, Zhang SM, O’Reilly E, et al. Vitamin D intake and incidence of multiple
sclerosis.Neurology. 2004;62(1):60–5
Murray RS, Brown B, Brain D, Cabirac GF. Detection of coronavirus RNA and antigen in
multiple sclerosis brain. Ann Neurol, 31 (1992), pp. 525–533
Murray TJ. Robert Carswell: the first illustrator of MS. Int MS J. 2009 Sep;16(3):98–101.
Myers AJ, Gibbs JR, Webster JA, Rohrer K, Zhao A, Marlowe L, Kaleem M, Leung D,
Bryden L, Nath P, Zismann VL, Joshipura K, Huentelman MJ, Hu-Lince D,Coon KD, Craig
DW, Pearson JV, Holmans P, Heward CB, Reiman EM, Stephan D, Hardy J.A survey of

107
genetic human cortical gene expression. Nat Genet. 2007 Dec;39(12):1494-9. Epub 2007 Nov
4.
Nebert, D.W., Zhang, G. & Vesell, E.S. From human genetics and genomics to
pharmacogenetics and pharmacogenomics: past lessons, future directions. Drug Metab. Rev.
40, 187–224 (2008).
Nebert, D.W., Zhang, G. & Vesell, E.S. From human genetics and genomics to
pharmacogenetics and pharmacogenomics: past lessons, future directions. Drug Metab. Rev.
40, 187–224 (2008).
Nischwitz S, Cepok S, Kroner A, Wolf C, Knop M, Müller-Sarnowski F, Pfister H, Roeske
D, Rieckmann P, Hemmer B, Ising M, Uhr M, Bettecken T, Holsboer F, Müller-Myhsok B,
Weber F. Evidence for VAV2 and ZNF433 as susceptibility genes for multiple sclerosis. J
Neuroimmunol. 2010 Oct 8;227(1-2):162-6.
Niyonsaba F., Iwabuchi K., Someya A., Hirata M., Matsuda H., Ogawa H., and Nagaoka I. A
cathelicidin family of human antibacterial peptide LL-37 induces mast cell
chemotaxis.Immunology. 2002 May; 106(1): 20–26.
Okada, Y., Terao, C., Ikari, K., Kochi, Y., Ohmura, K., Suzuki, A., Kawaguchi, T., Stahl,
E.A., Kurreeman, F.A., Nishida, N. et al. (2012) Meta-analysis identifies nine new loci
associated with rheumatoid arthritis in the Japanese population. Nat Genet, 44, 511-6.
Okada, Y., Wu, D., Trynka, G., Raj, T., Terao, C., Ikari, K., Kochi, Y., Ohmura, K., Suzuki,
A., Yoshida, S. et al. (2014) Genetics of rheumatoid arthritis contributes to biology and drug
discovery. Nature, 506, 376-81.
Omdahl JL , Morris HA , May BK . Hydroxylase enzymes of the vitamin D pathway:
expression, function, and regulation. Annu Rev Nutr 2002; 22: 139–66.
Orozco G, Viatte S, Bowes J, Martin P, Wilson AG, Morgan AW, Steer S, Wordsworth P,
Hocking LJ; UK Rheumatoid Arthritis Genetics Consortium; Wellcome Trust Case Control
Consortium; Biologics in Rheumatoid Arthritis Genetics and Genomics Study Syndicate
Consortium, Barton A, Worthington J, Eyre S. Novel rheumatoid arthritis susceptibility locus
at 22q12 identified in an extended UK genome-wide association study. Arthritis Rheumatol.
2014 Jan;66(1):24-30.

108
Orton SM, Herrera BM, Yee IM, et al. Sex ratio of multiple sclerosis in Canada: a
longitudinal study. Lancet Neurol 2006; 5: 932–936.
Ozgocmen S, Bulut S, Ilhan N, Gulkesen A, Ardicoglu O, Özkan Y. Vitamin D deficiency
and reduced bone mineral density in multiple sclerosis: effect of ambulatory status and
functional capacity. Journal of Bone and Mineral Metabolism. 2005;23(4):309–13
Pakpoor J, Disanto G, Gerber JE, Dobson R, Meier UC, Giovannoni G, et al. The risk of
developing multiple sclerosis in individuals seronegative for Epstein-Barr virus: a meta-
analysis. Mult Scler.2013;19:162–166.
Pakpoor J, Ramagopalan S. Evidence for an Association Between Vitamin D and Multiple
Sclerosis. Curr Top Behav Neurosci 2014.
Parkes M, Cortes A, van Heel DA, Brown MA. Genetic insights into common pathways and
complex relationships among immune-mediated diseases. Nat Rev Genet. 2013
Sep;14(9):661-73.
Parkes, M., Cortes, A., van Heel, D.A. and Brown, M.A. (2013) Genetic insights into
common pathways and complex relationships among immune-mediated diseases. Nat Rev
Genet, 14, 661-73.
Patsopoulos NA et al. Genome-wide meta-analysis identifies novel multiple sclerosis
susceptibility loci. Ann Neurol. 2011-12-01
Patsopoulos NA1; Bayer Pharma MS Genetics Working Group; Steering Committees of
Studies Evaluating IFNβ-1b and a CCR1-Antagonist; ANZgene Consortium; GeneMSA;
International Multiple Sclerosis Genetics Consortium, Esposito F, Reischl J, Lehr S, Bauer D,
Heubach J et al. Genome-wide meta-analysis identifies novel multiple sclerosis susceptibility
loci. Ann Neurol. 2011 Dec;70(6):897-912.
Pedersen LB, Nashold FE, Spach KM, Hayes CE. 1,25-dihydroxyvitamin D3 reverses
experimental autoimmune encephalomyelitis by inhibiting chemokine synthesis and
monocyte trafficking. J Neurosci Res 2007; 85: 2480-90.
Peelen E, Knippenberg S, Muris AH, Thewissen M, Smolders J, Tervaert JW, Hupperts R,
Damoiseaux J. Effects of vitamin D on the peripheral adaptive immune system: a review.
Autoimmun Rev. 2011 Oct;10(12):733-43.

109
Pekmezovic T, Drulovic J, Milenkovic M, Jarebinski M, Stojsavljevic N, Mesaros S, Kisic D,
Kostic J. Lifestyle factors and multiple sclerosis: A case-control study in Belgrade.
Neuroepidemiology. 2006; 27(4):212-6.
Pender MP, Burrows SR. Epstein–Barr virus and multiple sclerosis: potential opportunities
for immunotherapy. Clinical & Translational Immunology. 2014;3(10)
Pierrot-Deseilligny C, Souberbielle JC. Is hypovitaminosis D one of the environmental risk
factors for multiple sclerosis? Brain. 2010;133:1869–1888
Plum LA , DeLuca HF . Vitamin D, disease and therapeutic opportunities. Nat Rev Drug
Discov 2010; 9: 941–55.
Preiningerova J. Oral laquinomod therapy in relapse remitting multiple sclerosis. Expert
Opin. Investig. Drugs. 2009;18:985–989.
Pugliatti M, Harbo HF, Holmøy T, Kampman MT, Myhr KM, Riise T, Wolfson C.
Environmental risk factors in multiple sclerosis.Acta Neurol Scand Suppl. 2008;188:34-40.
R.M. Steinman, D. Hawiger, M.C. Nussenzweig. Tolerogenic dendritic cells. Annu Rev
Immunol, 21 (2003), pp. 685–711
Racke M, Lovett-Racke A, Krandikar N. The mechanism of action of glatiramer acetate
treatment in multiple sclerosis. Neurology. 2010;74:S25–S30.
Rahnavard Z, Eybpoosh S, Homami MR, Meybodi HA, Azemati B, Heshmat R, Larijani B.
Vitamin d deficiency in healthy male population: results of the Iranian multi- center
osteoporosis study. Iran J Public Health. 2010; 39(3):45-52.
Ramagopalan SV, Dyment DA, Cader MZ, Morrison KM, Disanto G, Morahan JM,
Berlanga-Taylor AJ, Handel A, De Luca GC, Sadovnick AD, Lepage P, Montpetit A, Ebers
GC. Rare variants in the CYP27B1 gene are associated with multiple sclerosis. Ann Neurol
2011;70:881–6
Ramagopalan SV, Knight JC, Ebers GC. Multiple sclerosis and the major histocompatibility
complex.Curr Opin Neurol. 2009;22:219–225.
Ramagopalan SV, Maugeri NJ, Handunnetthi L, Lincoln MR, Orton SM, et al. Expression of
the multiple sclerosis-associated MHC class II Allele HLA-DRB1*1501 is regulated by
vitamin D. PLoS Genet. 2009;5:e1000369.

110
Raychaudhuri S, Remmers EF, Lee AT, Hackett R, Guiducci C, Burtt NP, Gianniny L,
Korman BD, Padyukov L, Kurreeman FA, Chang M, Catanese JJ, Ding B, Wong S, van der
Helm-van Mil AH, Neale BM, Coblyn J, Cui J, Tak PP, Wolbink GJ, Crusius JB, van der
Horst-Bruinsma IE, Criswell LA, Amos CI, Seldin MF, Kastner DL, Ardlie KG, Alfredsson
L, Costenbader KH, Altshuler D, Huizinga TW, Shadick NA, Weinblatt ME, de Vries N,
Worthington J, Seielstad M, Toes RE, Karlson EW, Begovich AB, Klareskog L, Gregersen
PK, Daly MJ, Plenge RM. Common variants at CD40 and other loci confer risk of
rheumatoid arthritis. Nat Genet 2008;40:1216–23
Razin, A. CpG methylation, chromatin structure and gene silencing-a three-way connection.
EMBO Journal 1998; 17, 4905–4908.
Reik, W., Dean, W., & Walter, J. Epigenetic reprogramming in mammalian development.
Science 2001; 293, 1089–1093.
relapsing–remitting multiple sclerosis. Neurodegener. Dis. Manag. 2015, 5, 7–10.
Rice GP, Oger J, Duquette P, et al. Treatment with interferon beta-1b improves quality of life
in multiple sclerosis. Can J Neurol Sci 1999;26:276–282.
Riise T, Nortvedt MW, Ascherio A. Smoking is a risk factor for multiple sclerosis.
Neurology. 2003 Oct 28; 61(8):1122-4
Rivas, M.A., Gonzalez-Porta, M., Kurbatova, N., Griebel, T., Ferreira, P.G. et al. (2013)
Transcriptome and genome sequencing uncovers functional variation in humans. Nature, 501,
506-11.
Rivera, F.J.; Couillard-Despres, S.; Pedre, X.; Ploetz, S.; Caioni, M.; Lois, C.; Bogdahn, U.;
Aigner, L. Mesenchymal stem cells instruct oligodendrogenic fate decision on adult neural
stem cells. Stem Cells 2006, 24, 2209–2219.
Rodríguez Regal A, del Campo Amigo M, Paz-Esquete J, Martínez Feijoo A, Cebrián E,
Suárez Gil P, Mouriño MA. A case-control study of the influence of the smoking behaviour
in multiple sclerosis. Neurologia. 2009 Apr; 24(3):177-80.
Roll P, Palanichamy A, Kneitz C, Dorner T, Tony HP: Regeneration of B cell subsets after
transient B cell depletion using anti-CD20 antibodies in rheumatoid arthritis. Arthritis Rheum
2006;54:2377-2386.

111
Rose JW, Burns JB, Bjorklund J, Klein J, Watt HE, Carlson NG. Daclizumab phase II trial in
relapsing and remitting multiple sclerosis: MRI and clinical results". Neurology. 2007; 69 (8):
785–789.
Rozniecki JJ, Hauser SL, Stein M, Lincoln R, Theoharides TC. Elevated mast cell tryptase in
cerebrospinal fluid of multiple sclerosis patients. Ann Neurol 1995;37:63–66.
Russo C, Morabito F, Luise F, Piromalli A, Battaglia L, Vinci A, Trapani Lombardo V, de
Marco V, Morabito P, Condino F, Quattrone A, Aguglia U. Hyperhomocysteinemia is
associated with cognitive impairment in multiple sclerosis. J Neurol. 2008 Jan; 255(1):64-9.
S Sriram, CW Stratton, S Yao, et al. Chlamydia pneumoniae infection of the central nervous
system in multiple sclerosis. Ann Neurol, 46 (1999), pp. 6–14
Sadovnick AD, Duquette P, Herrera B, Yee IM, Ebers GC. A timing-of-birth effect on
multiple sclerosis clinical phenotype. Neurology. 2007 Jul 3; 69(1):60-2.
Saikali P, Antel JP, Newcombe J, Chen Z, Freedman M, Blain M, Cayrol R, Prat A, Hall JA,
Arbour N. NKG2D-mediated cytotoxicity toward oligodendrocytes suggests a mechanism for
tissue injury in multiple sclerosis. J Neurosci 2007;27:1220–1228.
Sanna S1, Pitzalis M, Zoledziewska M, Zara I, Sidore C, Murru R, Whalen MB, Busonero F,
Maschio A, Costa G, Melis MC, Deidda F, Poddie F, Morelli L, Farina G, Li Y, Dei M, Lai
S, Mulas A, Cuccuru G, Porcu E, Liang L, Zavattari P, Moi L, Deriu E, Urru MF, Bajorek M,
Satta MA, Cocco E, Ferrigno P, Sotgiu S, Pugliatti M, Traccis S, Angius A, Melis M, Rosati
G, Abecasis GR, Uda M, Marrosu MG, Schlessinger D, Cucca F. Variants within the
immunoregulatory CBLB gene are associated with multiple sclerosis. Nat Genet. 2010
Jun;42(6):495-7.
Sawcer S et al. Genetic risk and a primary role for cell-mediated immune mechanisms in
multiple sclerosis. Nature. 2011-08-11.
Sawcer S, Franklin RJ, Ban M. Multiple sclerosis genetics. Lancet Neurol. 2014;13:700–709.
Schadt EE, Molony C, Chudin E, et al. Mapping the Genetic Architecture of Gene Expression
in Human Liver. Abecassis G, ed. PLoS Biology. 2008;6(5):e107.
Schadt EE, Molony C, Chudin E, Hao K, Yang X, et al. Mapping the genetic architecture of
gene expression in human liver. PLoS Biol. 2008;6:e107.

112
Schluesener HJ, Sobel RA, Linington C, Weiner HL. 1987.Amonoclonal antibody against a
myelin oligodendrocyte glycoprotein induces relapses and demyelination in central nervous
system autoimmune disease. J. Immunol. 139:4016–21
Schluesener HJ, Sobel RA, Linington C, Weiner HL: A monoclonal antibody against a
myelin oligodendrocyte glycoprotein induces relapses and demyelination in central nervous
system autoimmune disease. J Immunol 1987;139:4016-4021.
Schwalfenberg GK. A review of the critical role of vitamin D in the functioning of the
immune system and the clinical implications of vitamin D deficiency. Mol Nutr Food Res
2011; 55: 96-108.
Schwalfenberg GK. A review of the critical role of vitamin D in the functioning of the
immune system and the clinical implications of vitamin D deficiency. Mol Nutr Food Res.
2011 Jan;55(1):96-108.
Selmaj K, Brosnan CF, Raine CS. Colocalization of lymphocytes bearing gamma delta T-cell
receptor and heat shock protein hsp65+ oligodendrocytes in multiple sclerosis. Proc Natl
Acad Sci U S A 1991;88:6452–6456.
Shahijanian F, Parnell GP, McKay FC, et al. The CYP27B1 variant associated with an
increased risk of autoimmune disease is underexpressed in tolerizing dendritic cells. Hum
Mol Genet 2014; 23: 1425-34.
Shimonkevitz R, Colburn C, Burnham JA, Murray RS, Kotzin BL. Clonal expansions of
activated gamma/delta T cells in recent-onset multiple sclerosis. Proc Natl Acad Sci U S A
1993;90:923– 927.
Silva KR, Alvarenga RM, Fernandez Y Fernandez O, Alvarenga H, Thuler LC. Potential risk
factors for multiple sclerosis in Rio de Janeiro: a case-control study. Arq Neuropsiquiatr.
2009 Jun; 67(2A):229-34.
Simon JH, Jacobs LD, Campion M, et al. Magnetic resonance studies of intramuscular
interferon beta-1a for relapsing multiple sclerosis. Ann Neurol 1998;43:79–87.
Simon KC, van der Mei IA, Munger KL, Ponsonby A, Dickinson J, Dwyer T, Sundström P,
Ascherio A. Combined effects of smoking, anti-EBNA antibodies, and HLA-DRB1*1501 on
multiple sclerosis risk. Neurology. 2010 Apr 27; 74(17):1365-71.

113
Slager SL1, Skibola CF, Di Bernardo MC, Conde L, Broderick P et al. Common variation at
6p21.31 (BAK1) influences the risk of chronic lymphocytic leukemia. Blood. 2012 Jul
26;120(4):843-6.
Smith KJ, Pyrdol J, Gauthier L, Wiley DC, Wucherpfennig KW. Crystal structure of HLA-
DR2 (DRA*0101, DRB1*1501) complexed with a peptide from human myelin basic protein.
J Exp Med.1998;188:1511–1520.
Sonoda KH, Faunce DE, Taniguchi M, Exley M, Balk S, Stein-Streilein J. NK T cell-derived
IL-10 is essential for the differentiation of antigen-specific T regulatory cells in systemic
tolerance. J Immunol 2001;166:42–50
Sospedra M., Zhao Y., zur Hausen H., Muraro P.A., Hamashin C., de Villiers E.M., Pinilla
C., Martin R. Recognition of conserved amino acid motifs of common viruses and its role in
autoimmunity. PLoS Pathogens, 1 (2005)
Sotelo J., Ordoñez G., Pineda B.. Varicella–zoster virus at relapses of multiple sclerosis.
Journal of Neurology, 254 (2007), pp. 493–500
Sotelo J.,. Martínez-Palomo A, Ordoñez G., Pineda B.. Varicella–zoster virus in cerebrospinal
fluid at relapses of multiple sclerosis. Annals of Neurology, 63 (2008), pp. 303–311
Speedy HE, Di Bernardo MC, Sava GP, Dyer MJ, Holroyd A et al. A genome-wide
association study identifies multiple susceptibility loci for chronic lymphocytic leukemia. Nat
Genet. 2014 Jan;46(1):56-60.
Steinman L. A molecular trio in relapse and remission in multiple sclerosis. Nat Rev
Immunol.2009;9:440–447.
Stelekati E, Orinska Z, Bulfone-Paus S. Mast cells in allergy: innate instructors of adaptive
responses. Immunobiology 2007;212:505–519.
Stewart JN, Mounir S, Talbot PJ.Human coronavirus gene expression in the brains of
multiple sclerosis patients. Virology, 191 (1992), pp. 502–505
Stoner GL, Agostini HT, Ryschkewitsch CF, et al. Characterization of JC virus DNA
amplified from urine of chronic progressive multiple sclerosis patients. Mult Scler, 1 (1996),
pp. 193–199

114
Stranger BE, Nica AC, Forrest MS, et al. Population genomics of human gene expression.
Nature genetics. 2007;39(10):1217-1224.
Sumaya CV, Myers LW, Ellison GW. Epstein-Barr virus antibodies in multiple sclerosis.
Arch Neurol. 1980;37:94–96.
Sundqvist E, Bäärnhielm M, Alfredsson L, Hillert J, Olsson T, Kockum I. Confirmation of
association between multiple sclerosis and CYP27B1. Eur J Hum Genet 2010;18:1349–52
Sundström P, Nyström L, Hallmans G. Smoke exposure increases the risk for multiple
sclerosis. Eur J Neurol. 2008 Jun; 15(6):579-83.
Tennakoon DK, Mehta RS, Ortega SB, Bhoj V, Racke MK, Krandikar NJ. Therapeutic
induction of regulatory cytotoxic, CD8 T cells in multiple sclerosis. J. Immunol.
2006;176:7119–7129.
The International Multiple Sclerosis Genetics A high-density screen for linkage in multiple
sclerosis. Am J Hum Genet. 2005; 77, 454–467.
Toms R, Weiner HL, Johnson D. Identification of IgE-positive cells and mast cells in frozen
sections of multiple sclerosis brains. J Neuroimmunol 1990;30:169–177.
Traugott U. Characterization and distribution of lymphocyte subpopulations in multiple
sclerosis plaques versus autoimmune demyelinating lesions. Springer Semin Immunopathol
1985;8:71–95.
Tupin E, Kronenberg M. Activation of natural killer T cells by glycolipids. Methods Enzymol
2006;417:185–201.
Tzartos, J.S., Khan, G., Vossenkamper, A., Cruz-Sadaba, M., Lonardi, S., Sefia, E., Meager,
A., Elia, A., Middeldorp, J.M., Clemens, M. et al. (2012) Association of innate immune
activation with latent Epstein-Barr virus in active MS lesions. Neurology, 78, 15-23.
Urdinguio, R. G., Sanchez-Mut, J. V., & Esteller, M. Epigenetic mechanisms in neurological
diseases: Genes, syndromes, and therapies. Lancet Neurology 2009; 8, 1056–1072.
Vaknin-Dembinsky A, Balashov K, Weiner HL. IL-23 is increased in dendritic cells in
multiple sclerosis and down-regulation of IL-23 by antisense oligos increases dendritic cell
IL-10 production. J Immunol 2006;176:7768–7774.

115
Vaknin-Dembinsky A, Murugaiyan G, Hafler DA, Astier AL, Weiner HL. Increased IL-23
secretion and altered chemokine production by dendritic cells upon CD46 activation in
patients with multiple sclerosis. J Neuroimmunol 2008;195:140–145.
Van der Mei IA, Ponsonby AL, Dwyer T, Blizzard L, Simmons R, Taylor BV, Butzkueven
H, Kilpatrick T. Past exposure to sun, skin phenotype, and risk of multiple sclerosis: case-
control study.BMJ. 2003 Aug 9; 327(7410):316.
Veyrieras J-B, Kudaravalli S, Kim SY, et al. High-Resolution Mapping of Expression-QTLs
Yields Insight into Human Gene Regulation. Gibson G, ed.PLoS Genetics.
2008;4(10):e1000214.
Vieth R , ed. The Pharmacology of Vitamin D, Including Fortification Strategies. 2nd edn.
London: Elsevier, 2005.
Vincent R, Louis P, Gongora C, Papa I, Clot J, et al. Quantitative analysis of the expression
of the HLA-DRB genes at the transcriptional level by competitive polymerase chain reaction.
J Immunol.1996;156:603–610.
Voight, B.F. and Cotsapas, C. (2012) Human genetics offers an emerging picture of common
pathways and mechanisms in autoimmunity. Curr Opin Immunol, 24, 552-7.
Vollmer T, Stewart T, Baxter N. Mitoxantrone and cytotoxic drugs' mechanisms of action.
Neurology. 2010;74:S41–S46
Vollmer T, Stewart T, Baxter N. Mitoxantrone and cytotoxic drugs' mechanisms of action.
Neurology. 2010;74:S41–S46
W.F. Rigby, M. Waugh, R.F. Graziano. Regulation of human monocyte HLA-DR and CD4
antigen expression, and antigen presentation by 1,25-dihydroxyvitamin D3. Blood, 76 (1990),
pp. 189–197
Wandinger K-P, Jabs W, Siekhaus A, Bubel S, Trillenberg P, Wagner H-J, et al. Association
between clinical disease activity and Epstein-Barr virus reactivation in MS.
Neurology.2000;55:178–184.
Wang JH1, Pappas D, De Jager PL, Pelletier D, de Bakker PI, Kappos L, Polman CH;
Australian and New Zealand Multiple Sclerosis Genetics Consortium (ANZgene), Chibnik
LB, Hafler DA, Matthews PM, Hauser SL, Baranzini SE, Oksenberg JR. Modeling the

116
cumulative genetic risk for multiple sclerosis from genome-wide association data. Genome
Med. 2011 Jan 18;3(1):3.
Wang S. Epidemiology of vitamin D in health and disease. Nutr Res Rev 2009; 22(2): 188-
203.
Wang TJ, Zhang F, Richards JB, et al. Common genetic determinants of vitamin D
insufficiency: a genome-wide association study. Lancet. 2010 Jul 17;376(9736):180-8.
Ward LD and Kellis M. Interpreting noncoding genetic variation in complex traits and human
disease. Nature Biotechnology, 2012; 30, 1095–1106.
Webb AR, Kline L, Holick MF. Influence of season and latitude on the cutaneous synthesis
of vitamin D3: exposure to winter sunlight in Boston and Edmonton will not promote vitamin
D3 synthesis in human skin. J Clin Endocrinol Metab. 1988;67:373–8.
Weber, M.S., Prod'homme, T., Youssef, S., Dunn, S.E, Rundle, C., Lee, L., Patarroyo, J.C.,
Stuve, O., Sobel, R.A., Steinman, L., Zamvil, S.S. Type II monocytes modulate T cell
mediated central nervous system autoimmune disease. Nat. Med., 2007, 13, 935-943.
Wellcome Trust Case Control Consortium et) al Genome-wide association study of 14,000
cases of seven common diseases and 3,000 shared controls. Nature. 2007 Jun 7; 447(7145):
661–678.
Wellcome Trust Case Control Consortium. Genome-wide association study of 14,000 cases
of seven common diseases and 3,000 shared controls. Nature. 2007 Jun 7;447(7145):661-78.
Westra H.-J., Franke L. From genome to function by studying eQTLs. Biochim. Biophys.
Acta (2014), pp. 1896–1902.
Wingerchuk DM. Smoking: effects on multiple sclerosis susceptibility and disease
progression. Therapeutic Advances in Neurological Disorders. 2012;5(1):13-22.
Wöbke TK, Sorg BL and Steinhilber D.Vitamin D in inflammatory diseases. Front Physiol
2014; 5: 244.
Xiao J, Yang R, Biswas S, Qin X, Zhang M, Deng W. Mesenchymal Stem Cells and Induced
Pluripotent Stem Cells as Therapies for Multiple Sclerosis. Int J Mol Sci. 2015 Apr
24;16(5):9283-9302.

117
Zanetti M . Cathelicidins, multifunctional peptides of the innate immunity. Journal of
Leukocyte Biology 2004; 75 (1): 39–48.
Zeine R, Pon R, Ladiwala U, Antel JP, Filion LG, Freedman MS. Mechanism of gammadelta
T cellinduced human oligodendrocyte cytotoxicity: relevance to multiple sclerosis. J
Neuroimmunol 1998;87:49–61.
Zeller T, Wild P, Szymczak S, et al. Genetics and Beyond – The Transcriptome of Human
Monocytes and Disease Susceptibility. Bochdanovits Z, ed. PLoS ONE. 2010;5(5):e10693.
Zhang H, Shih DQ, Zhang X. Mechanisms underlying effects of 1,25-Dihydroxyvitamin D3
on the Th17 cells. Eur J Microbiol Immunol (Bp) 2013 Dec; 3(4): 237–240.
Zhang Y, Leung DY, Richers BN, et al. Vitamin D inhibits monocyte/ macrophage
proinflammatory cytokine production by targeting MAPK phosphatase-1. J Immunol 2012;
188: 2127-35.
Zhernakova A, Stahl EA, Trynka G, Raychaudhuri S, Festen EA, Franke L, Westra HJ,
Fehrmann RS, Kurreeman FA, Thomson B, Gupta N, Romanos J, McManus R, Ryan AW,
Turner G, Brouwer E, Posthumus MD, Remmers EF, Tucci F, Toes R, Grandone E, Mazzilli
MC, Rybak A, Cukrowska B, Coenen MJ, Radstake TR, van Riel PL, Li Y, de Bakker PI,
Gregersen PK, Worthington J, Siminovitch KA, Klareskog L, Huizinga TW, Wijmenga C,
Plenge RM. Meta-analysis of genome-wide association studies in celiac disease and
rheumatoid arthritis identifies fourteen non-HLA shared loci. PLoS Genet 2011;7:e1002
Zimmerman DR , Reinhardt TA , Kremer R , Beitz DC , Reddy GS , Horst RL . Calcitroic
acid is a major catabolic metabolite in the metabolism of 1 alpha-dihydroxyvitamin D(2).
Arch Biochem Biophys 2001; 392: 14–22.
Zivadinov R, Rudick R, De Masi R, Nasuelli D, Ukmar M, Pozzi–Mucelli R, Grop A,
Cazzato G, Zorzon M. Effects of IV methylprednisolone on brain atrophy in relapsing-
remitting multiple sclerosis.Neurology. 2001;573:1239–1247.

118