determination of chloride and sulfate in water and...
TRANSCRIPT
Determination of Chloride and Sulfate in Water and Soil Manali Aggrawal and Jeffrey RohrerThermo Fisher Scientific, Sunnyvale, CA, USA
Ap
plicatio
n N
ote 1113
Key WordsDionex IonPac AS22 Column, Dionex IonPac AS18-4µm Column, Suppressed Conductivity, Humic Acid, Dionex OnGuard II P Cartridges, Ion Chromatography (IC)
IntroductionIon chromatography (IC) is well established as a routine technique for the determination of ionic analytes in environmental samples such as natural waters, tap water, drinking water, and soil. In fact, one of the earliest applications of IC was the assay of inorganic ions in soils. The ability of IC to quantify different metal oxidation states and stable metal complexes in soil extracts is beneficial in ascertaining the fate, transport, and toxicity of metals in soil.1 The determination of total nitrogen, phosphorus, sulfur, and their corresponding oxide anions (i.e., nitrite, nitrate, phosphate, and sulfate) is also important in assessing soil condition and fertility.
Water quality in the U.S. is legislated by the Environmental Protection Agency (EPA) through the Safe Drinking Water Act (SDWA) and Clean Water Act (CWA). The SDWA ensures the integrity and safety of U.S. drinking water, whereas the goal of the CWA is to reduce the discharge of pollutants into U.S. waters. The EPA’s National Primary Drinking Water Regulations specify a maximum contaminant level (MCL) for a number of common inorganic anions to minimize potential health effects stemming from the ingestion of these anions in drinking water. For example, high levels of fluoride can cause dental and skeletal fluorosis.
Chloride and sulfate anions are considered secondary contaminants; thus, instead of being federally regulated, the EPA has given them a Secondary Maximum Contaminant Level (SMCL) classification. The SMCL parameters serve as guidelines for state water authorities and are based on aesthetic problems with water, not a specific acute or chronic health concern.2 Therefore, many states have adopted their own enforceable regulations governing such anions.
The U.S. EPA has set the SMCL for chloride at 250 mg/L because of potential aesthetic problems associated with the water’s taste and also because elevated levels can facilitate the corrosion of piping and fixtures. The SMCL for sulfate is 250 mg/L because that concentration can impart a bitter-to-salty taste to the water; at a concentration >500 mg/L sulfate can have a laxative effect.
The determination of chloride and sulfate in water and soil is also important because these anions can have a corrosive impact on concrete structures. For instance, a sulfate anion carried through rain water can attack concrete by reacting with hydrated compounds in the hardened cement paste. These reactions can induce sufficient pressure to disintegrate concrete. Therefore, the California Department of Transportation has established two separate methods for the determination of chloride and sulfate content in soil and water.3-4
2 System SelectionIn this study, the determination of chloride and sulfate in soil and water samples is demonstrated using two systems: an integrated Thermo Scientific™ Dionex™ ICS-2100 system that operates as a Reagent-Free™ IC (RFIC™) system and a Dionex ICS-5000+ HPIC™ system that is capable of supporting high-pressure IC and is also a RFIC system. This study shows that these applications can be easily executed using a Dionex ICS system and performed more efficiently and quickly by high-pressure IC using the Dionex ICS-5000+ HPIC system.
The separation is achieved using a Thermo Scientific™ Dionex™ IonPac™ AS22 Analytical column or, when using high-pressure IC, a Dionex IonPac AS18-4µm Analytical column. The Dionex IonPac AS22 column is recommended for determination of common anions when using carbonate/bicarbonate eluents because of the ease of eluent preparation. The Dionex IonPac AS18-4µm column is recommended for determination of common anions when using a hydroxide eluent, which can be electrolytically generated using a Thermo Scientific Dionex EGC 500 Potassium Hydroxide (KOH) Eluent Generator Cartridge, thereby eliminating eluent preparation. The Dionex IonPac AS18-4µm column uses smaller resin particles for more efficient separations, which enables faster run times, more accurate peak integration, and more reliable results. For both methods, the separated analytes are detected using suppressed conductivity detection.
Goal
To develop IC methods for the determination of chloride and sulfate in soil and water samples, including a high-pressure IC method to reduce analysis time
EquipmentSystem 1 • Dionex ICS-2100 system (includes pump, degasser,
eluent generator, and conductivity detector)
• Thermo Scientific Dionex AS-AP Autosampler with 250 µL syringe (P/N 074306) and 1.2 mL buffer line assembly (P/N 074989)
• Dionex EGC III Potassium Carbonate (K2CO3) Eluent Generator Cartridge (P/N 074536)
• Dionex EPM III Electrolytic pH Modifier (P/N 080136)
• Dionex EGC Carbonate Mixer Kit, 2 mm (P/N 063443)
• Vial Kit, polystyrene with caps and blue septa, 10 mL (P/N 074228)
• Thermo Scientific™ Dionex™ AERS™ 500 Anion Electrolytically Regenerated Suppressor, 2 mm (P/N 082541)
• Thermo Scientific™ Dionex™ Chromeleon™ Chromatog-raphy Data System (CDS) software, version 7.2
System 2• Dionex ICS-5000+ HPIC system, including:
– DP Dual Pump – EG Eluent Generator – DC Detector/Chromatography Compartment
• Dionex AS-AP Autosampler with 250 µL syringe (P/N 074306) and 1.2 mL buffer line assembly (P/N 074989)
• Dionex EGC 500 KOH Eluent Generator Cartridge (P/N 075778)
• Thermo Scientific Dionex CR-ATC 500 Continuously Regenerated Anion Trap Column (P/N 075550)
• Vial Kit, polystyrene with caps and blue septa, 10 mL (P/N 074228)
• Dionex AERS 500 Anion Electrolytically Regenerated Suppressor, 2 mm (P/N 082541)
• Chromeleon CDS software, version 7.2
Reagents and Standards• Deionized (DI) water, Type I reagent grade, 18 MΩ-cm
resistance or better
• Chloride Standard (1000 mg/L), 100 mL (P/N 037159)
• Sulfate Standard (1000 mg/L), 100 mL (P/N 037160)
• Hydrochloric Acid (HCl, Optima™) (Fisher Scientific P/N A466)
• O-Phosphoric Acid, 85% (Certified ACS), (Fisher Scientific P/N A242-1)
• Acetonitrile (Optima LC/MS) (Fisher Scientific P/N A955-500)
• Humic Acid Sodium Salt (Sigma-Aldrich® P/N H16752)
• Dionex IonPac AS22 Eluent Concentrate, 100×, 250 mL (P/N 063965)
• Sodium and Potassium Salts, A.C.S. reagent grade, for preparing the Quality Assurance Report (QAR) standard mix
Consumables• Thermo Scientific™ Nalgene™ Syringe Filters, PES,
0.2 µm (Fisher Scientific P/N 09-740-61A)
• AirTite All-Plastic Norm-Ject Syringes, 5 mL, sterile (Fisher Scientific P/N 14-817-28)
• Thermo Scientific™ Dionex™ OnGuard™ II P Cartridges, 1 cc (P/N 057087)
• Dionex OnGuard Sample Prep Workstation (P/N 039599), optional
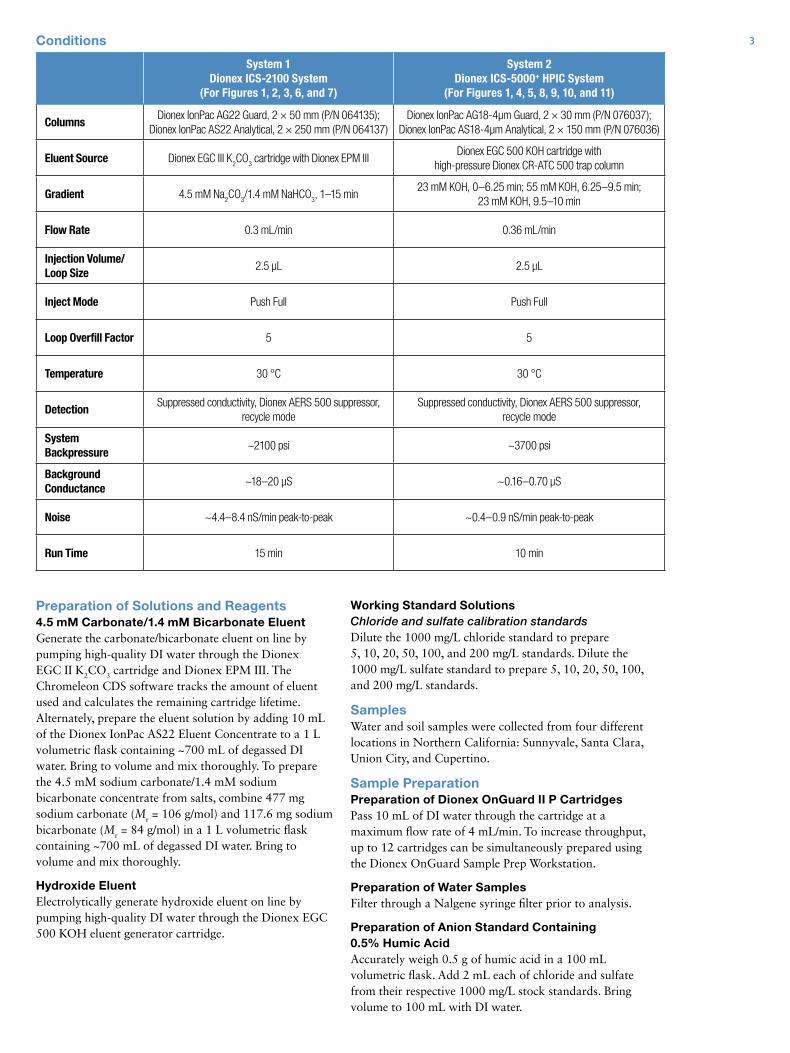
3Conditions
System 1 Dionex ICS-2100 System
(For Figures 1, 2, 3, 6, and 7)
System 2 Dionex ICS-5000+ HPIC System
(For Figures 1, 4, 5, 8, 9, 10, and 11)
ColumnsDionex IonPac AG22 Guard, 2 × 50 mm (P/N 064135);
Dionex IonPac AS22 Analytical, 2 × 250 mm (P/N 064137)Dionex IonPac AG18-4µm Guard, 2 × 30 mm (P/N 076037);
Dionex IonPac AS18-4µm Analytical, 2 × 150 mm (P/N 076036)
Eluent Source Dionex EGC III K2CO
3 cartridge with Dionex EPM III
Dionex EGC 500 KOH cartridge with high-pressure Dionex CR-ATC 500 trap column
Gradient 4.5 mM Na2CO
3/1.4 mM NaHCO
3, 1–15 min
23 mM KOH, 0–6.25 min; 55 mM KOH, 6.25–9.5 min; 23 mM KOH, 9.5–10 min
Flow Rate 0.3 mL/min 0.36 mL/min
Injection Volume/Loop Size
2.5 µL 2.5 µL
Inject Mode Push Full Push Full
Loop Overfill Factor 5 5
Temperature 30 °C 30 °C
DetectionSuppressed conductivity, Dionex AERS 500 suppressor,
recycle modeSuppressed conductivity, Dionex AERS 500 suppressor,
recycle mode
System Backpressure
~2100 psi ~3700 psi
Background Conductance
~18–20 µS ~0.16–0.70 µS
Noise ~4.4–8.4 nS/min peak-to-peak ~0.4–0.9 nS/min peak-to-peak
Run Time 15 min 10 min
Preparation of Solutions and Reagents 4.5 mM Carbonate/1.4 mM Bicarbonate EluentGenerate the carbonate/bicarbonate eluent on line by pumping high-quality DI water through the Dionex EGC II K2CO3 cartridge and Dionex EPM III. The Chromeleon CDS software tracks the amount of eluent used and calculates the remaining cartridge lifetime. Alternately, prepare the eluent solution by adding 10 mL of the Dionex IonPac AS22 Eluent Concentrate to a 1 L volumetric flask containing ~700 mL of degassed DI water. Bring to volume and mix thoroughly. To prepare the 4.5 mM sodium carbonate/1.4 mM sodium bicarbonate concentrate from salts, combine 477 mg sodium carbonate (Mr = 106 g/mol) and 117.6 mg sodium bicarbonate (Mr = 84 g/mol) in a 1 L volumetric flask containing ~700 mL of degassed DI water. Bring to volume and mix thoroughly.
Hydroxide EluentElectrolytically generate hydroxide eluent on line by pumping high-quality DI water through the Dionex EGC 500 KOH eluent generator cartridge.
Working Standard SolutionsChloride and sulfate calibration standardsDilute the 1000 mg/L chloride standard to prepare 5, 10, 20, 50, 100, and 200 mg/L standards. Dilute the 1000 mg/L sulfate standard to prepare 5, 10, 20, 50, 100, and 200 mg/L standards.
SamplesWater and soil samples were collected from four different locations in Northern California: Sunnyvale, Santa Clara, Union City, and Cupertino.
Sample PreparationPreparation of Dionex OnGuard II P CartridgesPass 10 mL of DI water through the cartridge at a maximum flow rate of 4 mL/min. To increase throughput, up to 12 cartridges can be simultaneously prepared using the Dionex OnGuard Sample Prep Workstation.
Preparation of Water SamplesFilter through a Nalgene syringe filter prior to analysis.
Preparation of Anion Standard Containing 0.5% Humic AcidAccurately weigh 0.5 g of humic acid in a 100 mL volumetric flask. Add 2 mL each of chloride and sulfate from their respective 1000 mg/L stock standards. Bring volume to 100 mL with DI water.
4 System Preparation and ConfigurationSystem 1: Dionex ICS-2100 SystemInstall and configure the Dionex AS-AP Autosampler in Push Full mode. Follow the instructions in the Dionex AS-AP Autosampler Operator’s Manual (Document No. 065361) to calibrate the sample transfer line, thereby ensuring accurate and precise sample injections.
Prepare the Dionex AERS 500 suppressor for use by hydrating the internal membrane. Push 3 mL of DI water through the Eluent Out port and 5 mL of DI water through the Regen In port. Allow the suppressor to sit for 20 min to ensure complete hydration before installing it in the system.
For information on installation and conditioning of the Dionex EGC III K2CO3 cartridge and Dionex EPM III, consult Thermo Scientific Application Note 1052 and the Eluent Generator Cartridges Product Manual (Document No. 065018-04).5
Install the Dionex IonPac AG22 and AS22 columns. Verify that the system pressure displayed by the pump is between 2000 and 2300 psi when pumping eluent under the method conditions; this will enable the degas assembly to effectively remove electrolysis gases from the eluent. If necessary, install backpressure coils supplied with the Dionex EGC cartridge ship kit to adjust the system pressure. Because the system pressure can rise over time, trim the backpressure coil as necessary to maintain system pressure under 2300 psi.
Equilibrate the column with eluent for 30 min and run a system blank. The system will display the background conductance and noise listed under Conditions. Inject the QAR standard mix into the Dionex IonPac AS22 column. The column will be equilibrated when three consecutive injections of this standard produce the same retention times (RTs) for all analytes.
Confirm that the resulting chromatogram resembles that in the QAR that comes with the column. Note that the chromatogram shown in the QAR is generated without the guard column; therefore, analyte RTs should be longer than those shown in the QAR.
System 2: Dionex ICS-5000+ HPIC SystemInstall and configure the Dionex AS-AP Autosampler and prepare the Dionex AERS 500 suppressor as previously described. Condition the EGC 500 KOH cartridge before first use by running 50 mM KOH at 1 mL/min for 45 min. For more information on installation and operation of the Dionex EGC 500 KOH cartridge, consult the Product Manual (Document No. 065018-04).
Preparation of Original Soil SamplesStep 1. Accurately weigh 6.0 g of soil sample into a 50 mL
centrifuge tube with a cap.
Step 2. Add 18 mL of DI water, cap, and vigorously shake for 15 min.
Step 3. Centrifuge the solution for 30 min at 5500 rpm and decant the liquid.
Step 4. Optional to remove or reduce humic acid: acidify the liquid from Step 3 to pH 5 using 0.1 M phosphoric acid prior to filtering through a Dionex OnGuard II P cartridge.
Step 5. Filter the liquid (from Step 3 or if used, Step 4) through a Nalgene syringe filter prior to analysis.
Preparation of Soil Samples Containing Humic AcidAfter Step 1, spike an additional 0.05% of humic acid into some of the soil samples and analyze using the Dionex IonPac AS18-4µm column.
Note: The soil samples used here did not have a significant amount of humic acid; therefore, an additional 0.05% of humic acid was spiked into some of the Sunnyvale and Santa Clara soil samples to assess the effect of pretreatment of the soil sample using a Dionex OnGuard II P cartridge.
Step 1. Accurately weigh 6.67 g of soil sample into a 50 mL centrifuge tube with a cap.
Step 2. Weigh and add 10 mg humic acid (Sigma Aldrich Humic Acid Sodium Salt) into the tube.
Step 3. Add 20 mL of DI water, cap, and vigorously shake for 15 min.
Step 3. Centrifuge the solution for 30 min at 5500 rpm and decant the liquid.
Step 4. Optional to remove or reduce humic acid: acidify the liquid from Step 3 to pH 5 using 0.1 M phosphoric acid prior to filtering through a Dionex OnGuard II P cartridge.
Step 5. Filter the liquid (from Step 3 or if used, Step 4) through a Nalgene syringe filter prior to analysis.
Pretreatment of Soil Samples Using a Dionex OnGuard II P CartridgeAfter acidifying the sample as described under Preparation of Soil Samples, pass 10 mL of the sample through the cartridge and discard the initial 3 mL. Collect the remaining 7 mL and pass through a Nalgene filter prior to analysis.
Preparation for Recovery StudiesFor water samples, spike known amounts of the standards at ~100% of the native concentrations into the samples before the filtration described above.
For soil samples, spike known amounts of the standards at ~100% of the native concentrations into the samples before Step 2. Pass the spiked samples through a Dionex OnGuard II P cartridge prior to injection.
5
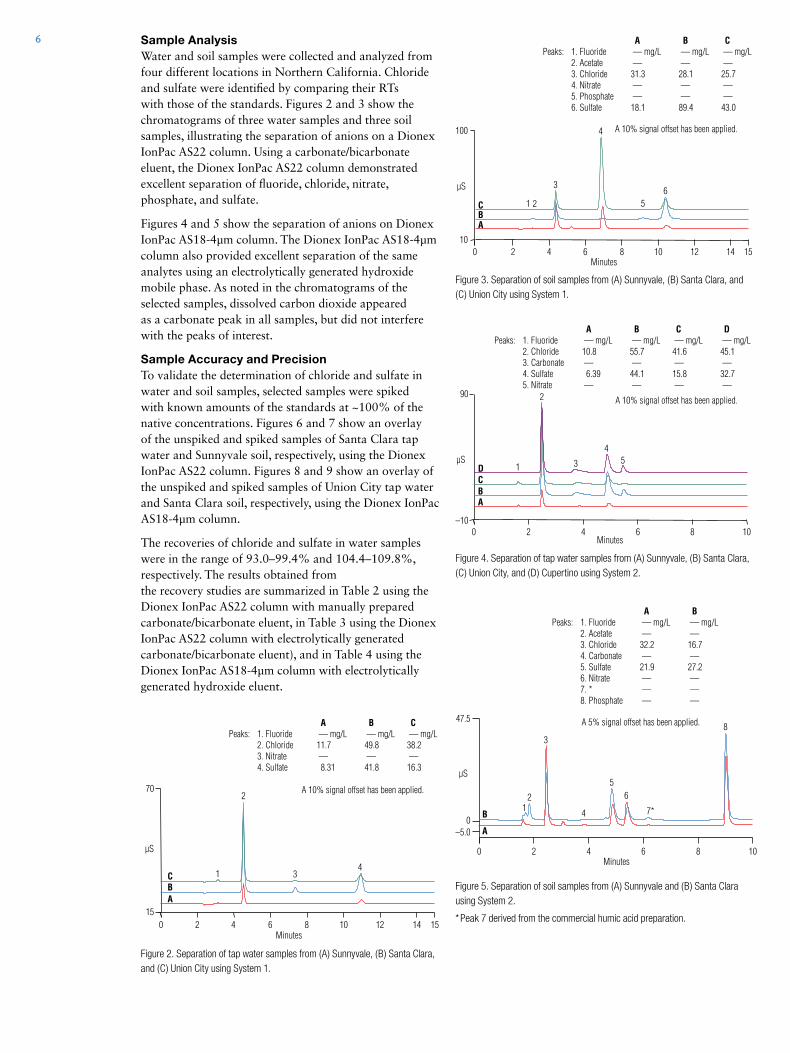
Figure 1. The QAR anion standard mix (A) for the Dionex IonPac AS22 column on System 1 and (B) for the Dionex IonPac AS18-4 µm column on System 2.
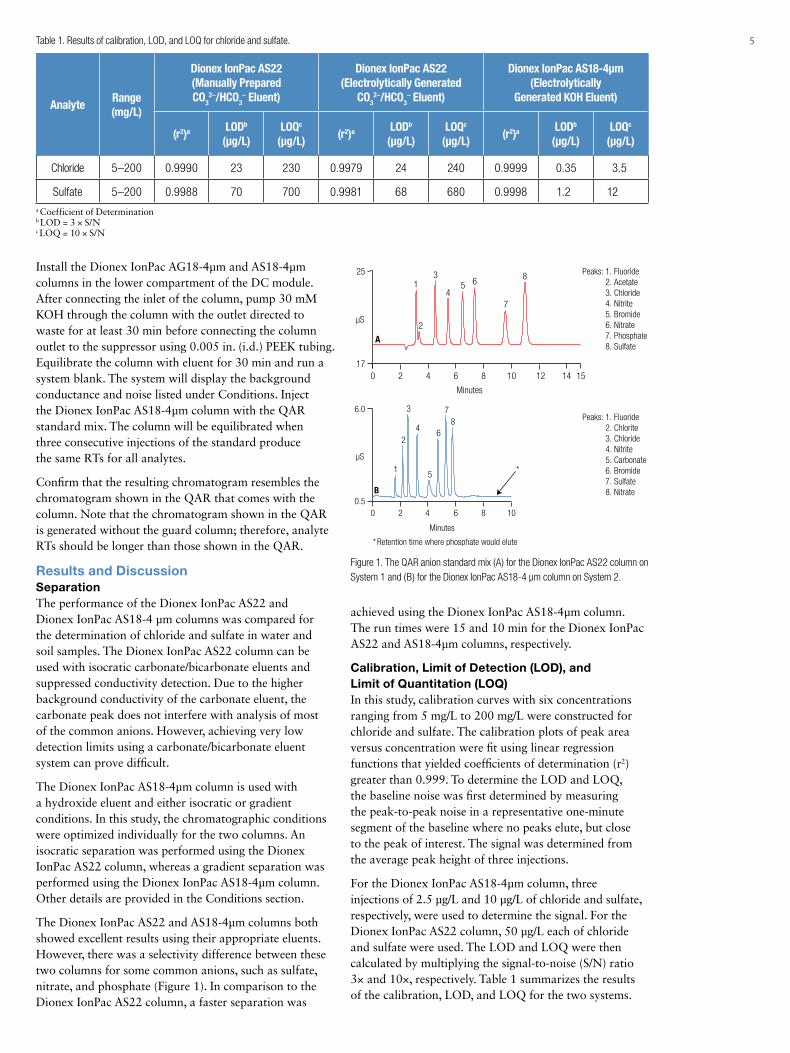
Table 1. Results of calibration, LOD, and LOQ for chloride and sulfate.
Install the Dionex IonPac AG18-4µm and AS18-4µm columns in the lower compartment of the DC module. After connecting the inlet of the column, pump 30 mM KOH through the column with the outlet directed to waste for at least 30 min before connecting the column outlet to the suppressor using 0.005 in. (i.d.) PEEK tubing. Equilibrate the column with eluent for 30 min and run a system blank. The system will display the background conductance and noise listed under Conditions. Inject the Dionex IonPac AS18-4µm column with the QAR standard mix. The column will be equilibrated when three consecutive injections of the standard produce the same RTs for all analytes.
Confirm that the resulting chromatogram resembles the chromatogram shown in the QAR that comes with the column. Note that the chromatogram shown in the QAR is generated without the guard column; therefore, analyte RTs should be longer than those shown in the QAR.
Results and DiscussionSeparation The performance of the Dionex IonPac AS22 and Dionex IonPac AS18-4 µm columns was compared for the determination of chloride and sulfate in water and soil samples. The Dionex IonPac AS22 column can be used with isocratic carbonate/bicarbonate eluents and suppressed conductivity detection. Due to the higher background conductivity of the carbonate eluent, the carbonate peak does not interfere with analysis of most of the common anions. However, achieving very low detection limits using a carbonate/bicarbonate eluent system can prove difficult.
The Dionex IonPac AS18-4µm column is used with a hydroxide eluent and either isocratic or gradient conditions. In this study, the chromatographic conditions were optimized individually for the two columns. An isocratic separation was performed using the Dionex IonPac AS22 column, whereas a gradient separation was performed using the Dionex IonPac AS18-4µm column. Other details are provided in the Conditions section.
The Dionex IonPac AS22 and AS18-4µm columns both showed excellent results using their appropriate eluents. However, there was a selectivity difference between these two columns for some common anions, such as sulfate, nitrate, and phosphate (Figure 1). In comparison to the Dionex IonPac AS22 column, a faster separation was
achieved using the Dionex IonPac AS18-4µm column. The run times were 15 and 10 min for the Dionex IonPac AS22 and AS18-4µm columns, respectively.
Calibration, Limit of Detection (LOD), and Limit of Quantitation (LOQ)In this study, calibration curves with six concentrations ranging from 5 mg/L to 200 mg/L were constructed for chloride and sulfate. The calibration plots of peak area versus concentration were fit using linear regression functions that yielded coefficients of determination (r2) greater than 0.999. To determine the LOD and LOQ, the baseline noise was first determined by measuring the peak-to-peak noise in a representative one-minute segment of the baseline where no peaks elute, but close to the peak of interest. The signal was determined from the average peak height of three injections.
For the Dionex IonPac AS18-4µm column, three injections of 2.5 µg/L and 10 µg/L of chloride and sulfate, respectively, were used to determine the signal. For the Dionex IonPac AS22 column, 50 µg/L each of chloride and sulfate were used. The LOD and LOQ were then calculated by multiplying the signal-to-noise (S/N) ratio 3× and 10×, respectively. Table 1 summarizes the results of the calibration, LOD, and LOQ for the two systems.
AnalyteRange (mg/L)
Dionex IonPac AS22 (Manually Prepared CO3
2–/HCO3– Eluent)
Dionex IonPac AS22 (Electrolytically Generated
CO32–/HCO3
– Eluent)
Dionex IonPac AS18-4µm (Electrolytically
Generated KOH Eluent)
(r2)a LODb (µg/L)
LOQc (µg/L)
(r2)a LODb (µg/L)
LOQc (µg/L)
(r2)a LODb (µg/L)
LOQc (µg/L)
Chloride 5–200 0.9990 23 230 0.9979 24 240 0.9999 0.35 3.5
Sulfate 5–200 0.9988 70 700 0.9981 68 680 0.9998 1.2 12a Coefficient of Determinationb LOD = 3 × S/Nc LOQ = 10 × S/N
Peaks: 1. Fluoride 2. Acetate 3. Chloride 4. Nitrite 5. Bromide 6. Nitrate 7. Phosphate 8. Sulfate
Peaks: 1. Fluoride 2. Chlorite 3. Chloride 4. Nitrite 5. Carbonate 6. Bromide 7. Sulfate 8. Nitrate
0 2 4 6 8 100.5
6.0
Minutes
* Retention time where phosphate would elute
*
2
3
4
51
6
78
B
0 2 4 6 8 10 12 14 1517
25
µS
µS
Minutes
2
3
451 6
7
8
A
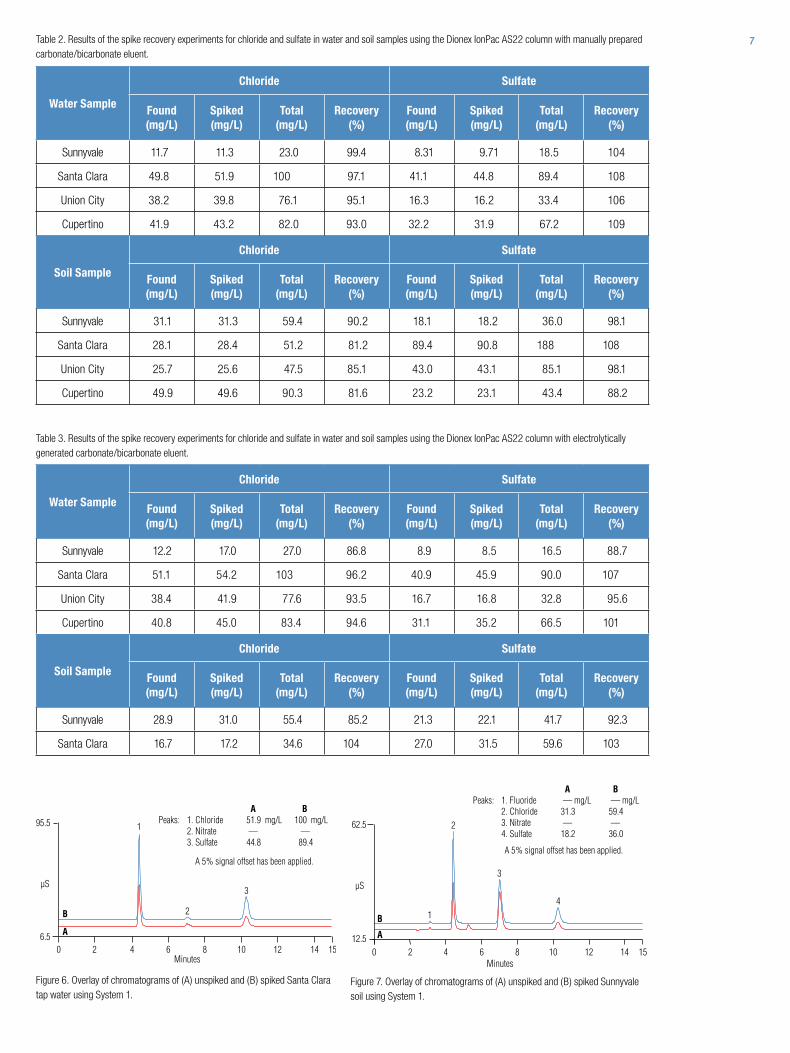
6 Sample AnalysisWater and soil samples were collected and analyzed from four different locations in Northern California. Chloride and sulfate were identified by comparing their RTs with those of the standards. Figures 2 and 3 show the chromatograms of three water samples and three soil samples, illustrating the separation of anions on a Dionex IonPac AS22 column. Using a carbonate/bicarbonate eluent, the Dionex IonPac AS22 column demonstrated excellent separation of fluoride, chloride, nitrate, phosphate, and sulfate.
Figures 4 and 5 show the separation of anions on Dionex IonPac AS18-4µm column. The Dionex IonPac AS18-4µm column also provided excellent separation of the same analytes using an electrolytically generated hydroxide mobile phase. As noted in the chromatograms of the selected samples, dissolved carbon dioxide appeared as a carbonate peak in all samples, but did not interfere with the peaks of interest.
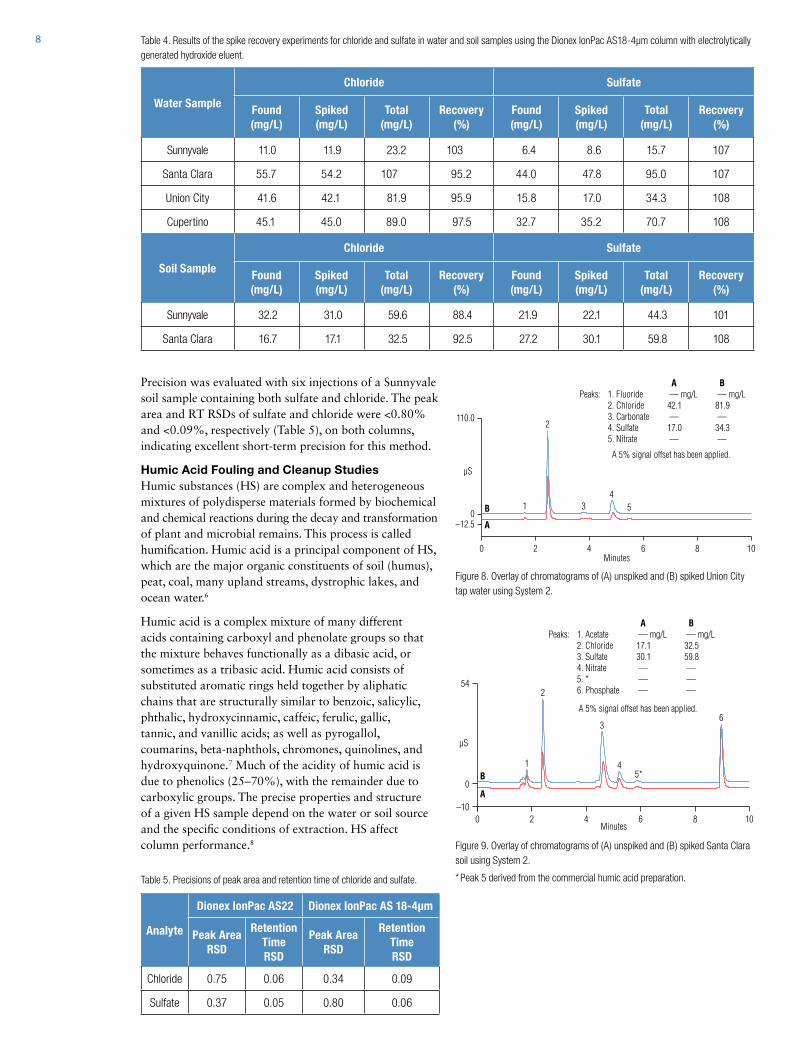
Sample Accuracy and PrecisionTo validate the determination of chloride and sulfate in water and soil samples, selected samples were spiked with known amounts of the standards at ~100% of the native concentrations. Figures 6 and 7 show an overlay of the unspiked and spiked samples of Santa Clara tap water and Sunnyvale soil, respectively, using the Dionex IonPac AS22 column. Figures 8 and 9 show an overlay of the unspiked and spiked samples of Union City tap water and Santa Clara soil, respectively, using the Dionex IonPac AS18-4µm column.
The recoveries of chloride and sulfate in water samples were in the range of 93.0–99.4% and 104.4–109.8%, respectively. The results obtained from the recovery studies are summarized in Table 2 using the Dionex IonPac AS22 column with manually prepared carbonate/bicarbonate eluent, in Table 3 using the Dionex IonPac AS22 column with electrolytically generated carbonate/bicarbonate eluent), and in Table 4 using the Dionex IonPac AS18-4µm column with electrolytically generated hydroxide eluent.
Figure 2. Separation of tap water samples from (A) Sunnyvale, (B) Santa Clara, and (C) Union City using System 1.
Figure 3. Separation of soil samples from (A) Sunnyvale, (B) Santa Clara, and (C) Union City using System 1.
Figure 4. Separation of tap water samples from (A) Sunnyvale, (B) Santa Clara, (C) Union City, and (D) Cupertino using System 2.
Figure 5. Separation of soil samples from (A) Sunnyvale and (B) Santa Clara using System 2.
* Peak 7 derived from the commercial humic acid preparation.
µS
A B CPeaks: 1. Fluoride — mg/L — mg/L — mg/L 2. Chloride 11.7 49.8 38.2 3. Nitrate — — — 4. Sulfate 8.31 41.8 16.3
A 10% signal offset has been applied.
0 2 4 6 8 10 12 14 1515
70
Minutes
A B C 1
2
34
µS
A B CPeaks: 1. Fluoride — mg/L — mg/L — mg/L 2. Acetate — — — 3. Chloride 31.3 28.1 25.7 4. Nitrate — — — 5. Phosphate — — — 6. Sulfate 18.1 89.4 43.0
0 2 4 6 8 10 12 14 1510
100
1 2
3
56
4
Minutes
A B C
A 10% signal offset has been applied.
µS
A B C DPeaks: 1. Fluoride — mg/L — mg/L — mg/L — mg/L 2. Chloride 10.8 55.7 41.6 45.1 3. Carbonate — — — — 4. Sulfate 6.39 44.1 15.8 32.7 5. Nitrate — — — —
A 10% signal offset has been applied.
A BC D
0 2 4 6 8 10–10
90
Minutes
1
2
453
µS
A BPeaks: 1. Fluoride — mg/L — mg/L 2. Acetate — — 3. Chloride 32.2 16.7 4. Carbonate — — 5. Sulfate 21.9 27.2 6. Nitrate — — 7. * — — 8. Phosphate — —
0 2 4 6 8 10
–5.0 0
12
3
56
8
Minutes
7*
A
B 4
47.5 A 5% signal offset has been applied.
7
Figure 6. Overlay of chromatograms of (A) unspiked and (B) spiked Santa Clara tap water using System 1.
Figure 7. Overlay of chromatograms of (A) unspiked and (B) spiked Sunnyvale soil using System 1.
Table 2. Results of the spike recovery experiments for chloride and sulfate in water and soil samples using the Dionex IonPac AS22 column with manually prepared carbonate/bicarbonate eluent.
Water Sample
Chloride Sulfate
Found (mg/L)
Spiked (mg/L)
Total (mg/L)
Recovery (%)
Found (mg/L)
Spiked (mg/L)
Total (mg/L)
Recovery (%)
Sunnyvale 11.7 11.3 23.0 99.4 8.31 9.71 18.5 104
Santa Clara 49.8 51.9 100 97.1 41.1 44.8 89.4 108
Union City 38.2 39.8 76.1 95.1 16.3 16.2 33.4 106
Cupertino 41.9 43.2 82.0 93.0 32.2 31.9 67.2 109
Soil Sample
Chloride Sulfate
Found (mg/L)
Spiked (mg/L)
Total (mg/L)
Recovery (%)
Found (mg/L)
Spiked (mg/L)
Total (mg/L)
Recovery (%)
Sunnyvale 31.1 31.3 59.4 90.2 18.1 18.2 36.0 98.1
Santa Clara 28.1 28.4 51.2 81.2 89.4 90.8 188 108
Union City 25.7 25.6 47.5 85.1 43.0 43.1 85.1 98.1
Cupertino 49.9 49.6 90.3 81.6 23.2 23.1 43.4 88.2
Table 3. Results of the spike recovery experiments for chloride and sulfate in water and soil samples using the Dionex IonPac AS22 column with electrolytically generated carbonate/bicarbonate eluent.
Water Sample
Chloride Sulfate
Found (mg/L)
Spiked (mg/L)
Total (mg/L)
Recovery (%)
Found (mg/L)
Spiked (mg/L)
Total (mg/L)
Recovery (%)
Sunnyvale 12.2 17.0 27.0 86.8 8.9 8.5 16.5 88.7
Santa Clara 51.1 54.2 103 96.2 40.9 45.9 90.0 107
Union City 38.4 41.9 77.6 93.5 16.7 16.8 32.8 95.6
Cupertino 40.8 45.0 83.4 94.6 31.1 35.2 66.5 101
Soil Sample
Chloride Sulfate
Found (mg/L)
Spiked (mg/L)
Total (mg/L)
Recovery (%)
Found (mg/L)
Spiked (mg/L)
Total (mg/L)
Recovery (%)
Sunnyvale 28.9 31.0 55.4 85.2 21.3 22.1 41.7 92.3
Santa Clara 16.7 17.2 34.6 104 27.0 31.5 59.6 103
µS
A BPeaks: 1. Chloride 51.9 mg/L 100 mg/L 2. Nitrate — — 3. Sulfate 44.8 89.4
A 5% signal offset has been applied.
4 6 8 10 12 14 15
2
3
0 26.5
95.5
Minutes
A
B
1
µS
A BPeaks: 1. Fluoride — mg/L — mg/L 2. Chloride 31.3 59.4 3. Nitrate — — 4. Sulfate 18.2 36.0
A 5% signal offset has been applied.
2 4 6 8 10 12 14 15
1
2
3
4
0 12.5
62.5
A
B
Minutes
8
Precision was evaluated with six injections of a Sunnyvale soil sample containing both sulfate and chloride. The peak area and RT RSDs of sulfate and chloride were <0.80% and <0.09%, respectively (Table 5), on both columns, indicating excellent short-term precision for this method.
Humic Acid Fouling and Cleanup StudiesHumic substances (HS) are complex and heterogeneous mixtures of polydisperse materials formed by biochemical and chemical reactions during the decay and transformation of plant and microbial remains. This process is called humification. Humic acid is a principal component of HS, which are the major organic constituents of soil (humus), peat, coal, many upland streams, dystrophic lakes, and ocean water.6
Humic acid is a complex mixture of many different acids containing carboxyl and phenolate groups so that the mixture behaves functionally as a dibasic acid, or sometimes as a tribasic acid. Humic acid consists of substituted aromatic rings held together by aliphatic chains that are structurally similar to benzoic, salicylic, phthalic, hydroxycinnamic, caffeic, ferulic, gallic, tannic, and vanillic acids; as well as pyrogallol, coumarins, beta-naphthols, chromones, quinolines, and hydroxyquinone.7 Much of the acidity of humic acid is due to phenolics (25–70%), with the remainder due to carboxylic groups. The precise properties and structure of a given HS sample depend on the water or soil source and the specific conditions of extraction. HS affect column performance.8
Table 4. Results of the spike recovery experiments for chloride and sulfate in water and soil samples using the Dionex IonPac AS18-4µm column with electrolytically generated hydroxide eluent.
Table 5. Precisions of peak area and retention time of chloride and sulfate.
Figure 9. Overlay of chromatograms of (A) unspiked and (B) spiked Santa Clara soil using System 2.
* Peak 5 derived from the commercial humic acid preparation.
Water Sample
Chloride Sulfate
Found (mg/L)
Spiked (mg/L)
Total (mg/L)
Recovery (%)
Found (mg/L)
Spiked (mg/L)
Total (mg/L)
Recovery (%)
Sunnyvale 11.0 11.9 23.2 103 6.4 8.6 15.7 107
Santa Clara 55.7 54.2 107 95.2 44.0 47.8 95.0 107
Union City 41.6 42.1 81.9 95.9 15.8 17.0 34.3 108
Cupertino 45.1 45.0 89.0 97.5 32.7 35.2 70.7 108
Soil Sample
Chloride Sulfate
Found (mg/L)
Spiked (mg/L)
Total (mg/L)
Recovery (%)
Found (mg/L)
Spiked (mg/L)
Total (mg/L)
Recovery (%)
Sunnyvale 32.2 31.0 59.6 88.4 21.9 22.1 44.3 101
Santa Clara 16.7 17.1 32.5 92.5 27.2 30.1 59.8 108
Analyte
Dionex IonPac AS22 Dionex IonPac AS 18-4µm
Peak Area RSD
Retention Time RSD
Peak Area RSD
Retention Time RSD
Chloride 0.75 0.06 0.34 0.09
Sulfate 0.37 0.05 0.80 0.06
Figure 8. Overlay of chromatograms of (A) unspiked and (B) spiked Union City tap water using System 2.
µS
A BPeaks: 1. Fluoride — mg/L — mg/L 2. Chloride 42.1 81.9 3. Carbonate — — 4. Sulfate 17.0 34.3 5. Nitrate — —
A 5% signal offset has been applied.
0 2 4 6 8 10
–12.5 0
110.0 2
34
51
Minutes
A
B
µS
A BPeaks: 1. Acetate — mg/L — mg/L 2. Chloride 17.1 32.5 3. Sulfate 30.1 59.8 4. Nitrate — — 5. * — — 6. Phosphate — —
A 5% signal offset has been applied.
0 2 4 6 8 10–10
0
54
1
2
3
45*
6
Minutes
A
B
9
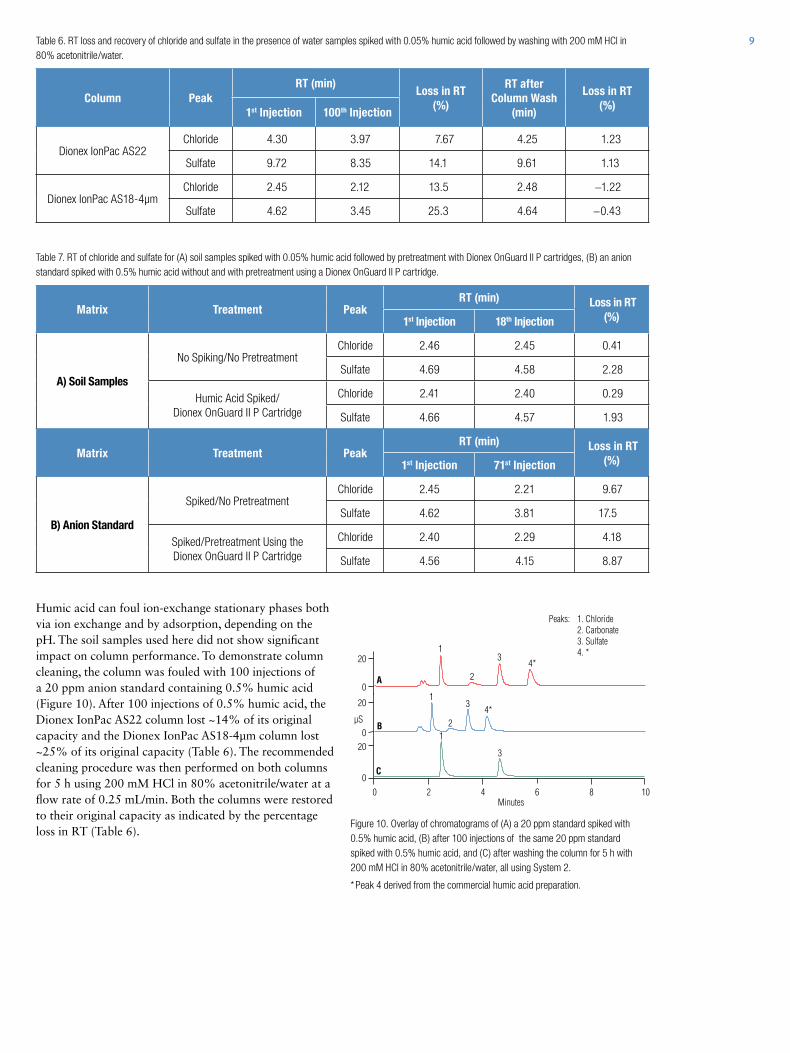
Humic acid can foul ion-exchange stationary phases both via ion exchange and by adsorption, depending on the pH. The soil samples used here did not show significant impact on column performance. To demonstrate column cleaning, the column was fouled with 100 injections of a 20 ppm anion standard containing 0.5% humic acid (Figure 10). After 100 injections of 0.5% humic acid, the Dionex IonPac AS22 column lost ~14% of its original capacity and the Dionex IonPac AS18-4µm column lost ~25% of its original capacity (Table 6). The recommended cleaning procedure was then performed on both columns for 5 h using 200 mM HCl in 80% acetonitrile/water at a flow rate of 0.25 mL/min. Both the columns were restored to their original capacity as indicated by the percentage loss in RT (Table 6).
Figure 10. Overlay of chromatograms of (A) a 20 ppm standard spiked with 0.5% humic acid, (B) after 100 injections of the same 20 ppm standard spiked with 0.5% humic acid, and (C) after washing the column for 5 h with 200 mM HCl in 80% acetonitrile/water, all using System 2.
* Peak 4 derived from the commercial humic acid preparation.
Table 6. RT loss and recovery of chloride and sulfate in the presence of water samples spiked with 0.05% humic acid followed by washing with 200 mM HCl in 80% acetonitrile/water.
Table 7. RT of chloride and sulfate for (A) soil samples spiked with 0.05% humic acid followed by pretreatment with Dionex OnGuard II P cartridges, (B) an anion standard spiked with 0.5% humic acid without and with pretreatment using a Dionex OnGuard II P cartridge.
Column PeakRT (min)
Loss in RT (%)
RT after Column Wash
(min)
Loss in RT (%)
1st Injection 100th Injection
Dionex IonPac AS22Chloride 4.30 3.97 7.67 4.25 1.23
Sulfate 9.72 8.35 14.1 9.61 1.13
Dionex IonPac AS18-4µmChloride 2.45 2.12 13.5 2.48 −1.22
Sulfate 4.62 3.45 25.3 4.64 −0.43
Matrix Treatment PeakRT (min) Loss in RT
(%)1st Injection 18th Injection
A) Soil Samples
No Spiking/No PretreatmentChloride 2.46 2.45 0.41
Sulfate 4.69 4.58 2.28
Humic Acid Spiked/ Dionex OnGuard II P Cartridge
Chloride 2.41 2.40 0.29
Sulfate 4.66 4.57 1.93
Matrix Treatment PeakRT (min) Loss in RT
(%)1st Injection 71st Injection
B) Anion Standard
Spiked/No PretreatmentChloride 2.45 2.21 9.67
Sulfate 4.62 3.81 17.5
Spiked/Pretreatment Using the Dionex OnGuard II P Cartridge
Chloride 2.40 2.29 4.18
Sulfate 4.56 4.15 8.87
µS
Peaks: 1. Chloride 2. Carbonate 3. Sulfate 4. *
0 2 4 6 8 100
201 0
201
2
3 4*
0
201
2
3 4*
A
B
C
3
Minutes
10
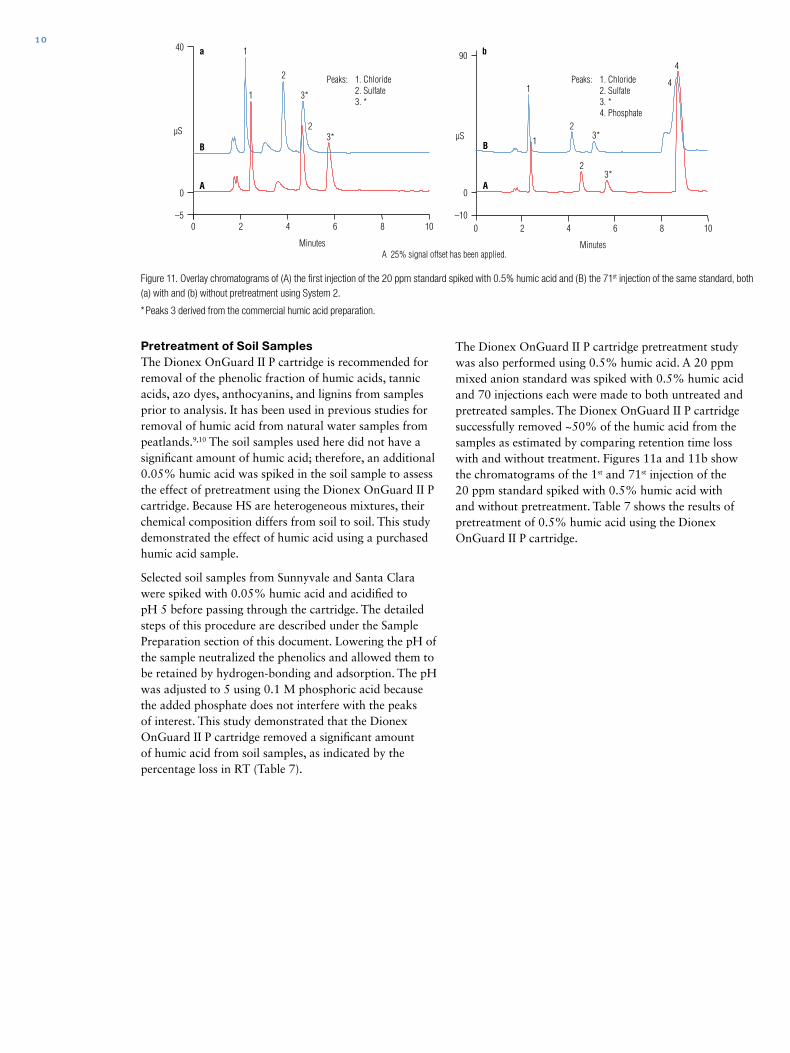
The Dionex OnGuard II P cartridge pretreatment study was also performed using 0.5% humic acid. A 20 ppm mixed anion standard was spiked with 0.5% humic acid and 70 injections each were made to both untreated and pretreated samples. The Dionex OnGuard II P cartridge successfully removed ~50% of the humic acid from the samples as estimated by comparing retention time loss with and without treatment. Figures 11a and 11b show the chromatograms of the 1st and 71st injection of the 20 ppm standard spiked with 0.5% humic acid with and without pretreatment. Table 7 shows the results of pretreatment of 0.5% humic acid using the Dionex OnGuard II P cartridge.
Pretreatment of Soil SamplesThe Dionex OnGuard II P cartridge is recommended for removal of the phenolic fraction of humic acids, tannic acids, azo dyes, anthocyanins, and lignins from samples prior to analysis. It has been used in previous studies for removal of humic acid from natural water samples from peatlands.9,10 The soil samples used here did not have a significant amount of humic acid; therefore, an additional 0.05% humic acid was spiked in the soil sample to assess the effect of pretreatment using the Dionex OnGuard II P cartridge. Because HS are heterogeneous mixtures, their chemical composition differs from soil to soil. This study demonstrated the effect of humic acid using a purchased humic acid sample.
Selected soil samples from Sunnyvale and Santa Clara were spiked with 0.05% humic acid and acidified to pH 5 before passing through the cartridge. The detailed steps of this procedure are described under the Sample Preparation section of this document. Lowering the pH of the sample neutralized the phenolics and allowed them to be retained by hydrogen-bonding and adsorption. The pH was adjusted to 5 using 0.1 M phosphoric acid because the added phosphate does not interfere with the peaks of interest. This study demonstrated that the Dionex OnGuard II P cartridge removed a significant amount of humic acid from soil samples, as indicated by the percentage loss in RT (Table 7).
Figure 11. Overlay chromatograms of (A) the first injection of the 20 ppm standard spiked with 0.5% humic acid and (B) the 71st injection of the same standard, both (a) with and (b) without pretreatment using System 2.
* Peaks 3 derived from the commercial humic acid preparation.
µSµS
Peaks: 1. Chloride 2. Sulfate 3. *
Peaks: 1. Chloride 2. Sulfate 3. * 4. Phosphate
A 25% signal offset has been applied.
0 2 4 6 8 10–5
0
40
1
2 3*
1
2
3*
A
B
Minutes
0 2 4 6 8 10–10
0
90
1
2
4
3*
1
2
4
3*
A
B
Minutes
a b
Ap
plicatio
n N
ote 1113
AN71389-EN 08/16
4. California Test 417. Method of Testing Soils and Waters for Sulfate Content. State of California— Business, Transportation and Housing Agency: Sacramento, CA, 2013. [Online] www.dot.ca.gov/hq/esc/ctms/pdf/CT_417_March2013.pdf (accessed Oct 28, 2014).
5. Thermo Scientific Application Note 1052: Determina-tion of Chloride and Sulfate in Gasoline-Denatured Ethanol. Sunnyvale, CA, 2013. [Online] www.thermoscientific.com/content/dam/tfs/ATG/CMD/CMD%20Documents/AN-1052-Determination-of-Chloride-and-Sulfate-in-Gas-Denatured-Ethanol-AN-70387.pdf (accessed Oct 28, 2014).
6. Shotyk, W. Ion Chromatography of Organic-Rich Natural Waters from Peatlands, I. Cl−, NO2
−, Br−, NO3
−, HPO42−, SO4
2− and Oxalate. J. Chromatogr. A 1993, 640, 309–316.
7. Sutton, R.; Sposito, G. Molecular Structure in Soil Humic Substances: The New View. Environ. Sci. Technol. 2005, 39, 9009–9015.
8. Marko-Varga, G.; Csiky, I.; Joensson, J.A. Ion Chromatographic Determination of Nitrate and Sulfate in Natural Waters Containing Humic Substances. Anal. Chem. 1984, 56 (12), 2066–2069.
9. Steinmann, P.; Shotyk, W. Ion Chromatography of Organic-Rich Natural Waters from Peatlands, III. Improvements for Measuring Anions and Cations. J. Chromatogr. A 1995, 706, 281–286.
10. Steinmann, P.; Shotyk, W. Ion chromatography of organic-rich natural waters from peatlands IV. Dissolved free sulfide and acid-volatile sulfur J. Chromatogr. A 1995, 706, 287–292.
ConclusionThis study demonstrates the successful determination of chloride and sulfate anions in soil and water samples using either the Dionex IonPac AS22 column or the Dionex IonPac AS18-4µm column. Either method successfully fulfills method requirements for the determination of chloride and sulfate in soil and water as specified in the California Department of Transportation's Tests 422 and 417,3-4 although the Dionex IonPac AS18-4μm column completes the sample analysis in significantly less time with no compromise in performance. Humic acid fouling and cleanup studies demonstrate the ruggedness of both columns and also that both columns can be restored to 100% of their original capacity by performing the recommended washing procedure. Pretreatment of soil samples using the Dionex OnGuard II P cartridge successfully removed a significant amount of humic acid from the soil sample, substantially reducing loss of column capacity and thus lengthening the time between column washings.
References1. Schnell, S.; Ratering, S.; Jansen, K. Simultaneous
Determination of Iron (III), Iron (II), and Manganese (II) in Environmental Samples by Ion Chromatography. Environ. Sci. Technol. 1998, 32, 1530–1537.
2. U.S. Environmental Protection Agency. Secondary Drinking Water Regulations: Guidance for Nuisance Chemicals. [Online] water.epa.gov/drink/contaminants/ secondarystandards.cfm (accessed Oct 29, 2014).
3. California Test 422. Method of Testing Soils and Waters for Chloride Content. State of California—Business, Transportation and Housing Agency: Sacramento, CA, 2013. [Online] www.dot.ca.gov/hq/esc/ctms/pdf/CT_422_March2013.pdf (accessed Oct 28, 2014).
Africa +43 1 333 50 34 0Australia +61 3 9757 4300Austria +43 810 282 206Belgium +32 53 73 42 41Brazil +55 11 3731 5140Canada +1 800 530 8447China 800 810 5118 (free call domestic)
400 650 5118
Denmark +45 70 23 62 60Europe-Other +43 1 333 50 34 0Finland +358 9 3291 0200France +33 1 60 92 48 00Germany +49 6103 408 1014India +91 22 6742 9494Italy +39 02 950 591
Japan +81 6 6885 1213Korea +82 2 3420 8600Latin America +1 561 688 8700Middle East +43 1 333 50 34 0Netherlands +31 76 579 55 55 New Zealand +64 9 980 6700 Norway +46 8 556 468 00
Russia/CIS +43 1 333 50 34 0Singapore +65 6289 1190Sweden +46 8 556 468 00 Switzerland +41 61 716 77 00Taiwan +886 2 8751 6655UK/Ireland +44 1442 233555USA +1 800 532 4752
www.thermofisher.com/chromatography©2016 Thermo Fisher Scientific Inc. All rights reserved. Sigma-Aldrich is a registered trademark of Sigma-Aldrich Co. LLC. All other trademarks are the property of Thermo Fisher Scientific and its subsidiaries. This information is presented as an example of the capabilities of Thermo Fisher Scientific products. It is not intended to encourage use of these products in any manners that might infringe the intellectual property rights of others. Specifications, terms and pricing are subject to change. Not all products are available in all countries. Please consult your local sales representative for details.