determination of free and total sulfites in wine using an
TRANSCRIPT

HAL Id: hal-00572617https://hal.archives-ouvertes.fr/hal-00572617
Submitted on 2 Mar 2011
HAL is a multi-disciplinary open accessarchive for the deposit and dissemination of sci-entific research documents, whether they are pub-lished or not. The documents may come fromteaching and research institutions in France orabroad, or from public or private research centers.
L’archive ouverte pluridisciplinaire HAL, estdestinée au dépôt et à la diffusion de documentsscientifiques de niveau recherche, publiés ou non,émanant des établissements d’enseignement et derecherche français ou étrangers, des laboratoirespublics ou privés.
Determination of Free and Total Sulfites in Wine usingan Automatic Flow Injection Analysis System with
Voltammetric DetectionLuís Moreira Gonçalves, João Grosso Pacheco, Paulo Jorge Magalhães, José
António Rodrigues, Aquiles Araújo Barros
To cite this version:Luís Moreira Gonçalves, João Grosso Pacheco, Paulo Jorge Magalhães, José António Rodrigues,Aquiles Araújo Barros. Determination of Free and Total Sulfites in Wine using an Automatic FlowInjection Analysis System with Voltammetric Detection. Food Additives and Contaminants, 2009, 27(02), pp.175-180. �10.1080/19440040903261547�. �hal-00572617�

For Peer Review O
nly
Determination of Free and Total Sulfites in Wine using an Automatic Flow Injection Analysis System with
Voltammetric Detection
Journal: Food Additives and Contaminants
Manuscript ID: TFAC-2009-154.R1
Manuscript Type: Original Research Paper
Date Submitted by the Author:
14-Aug-2009
Complete List of Authors: Gonçalves, Luís; Faculdade de Ciências da Universidade do Porto, Departamento de Química Pacheco, João; Faculdade de Ciências da Universidade do Porto, Departamento de Química Magalhães, Paulo; Faculdade de Ciências da Universidade do Porto, Departamento de Química Rodrigues, José; Faculdade de Ciências da Universidade do Porto, Departamento de Química Barros, Aquiles; Faculdade de Ciências da Universidade do Porto, Departamento de Química
Methods/Techniques: Analysis - Polagraphy, Method validation, Stripping Voltammetry
Additives/Contaminants: Sulfite
Food Types: Wine
http://mc.manuscriptcentral.com/tfac Email: [email protected]
Food Additives and Contaminants

For Peer Review O
nly
Determination of Free and Total Sulfites in Wine using an Automatic Flow 1
Injection Analysis System with Voltammetric Detection 2
Luís Moreira Gonçalves,* João Grosso Pacheco, Paulo Jorge Magalhães, José António 3
Rodrigues and Aquiles Araújo Barros 4
REQUIMTE – Departamento de Química da Faculdade de Ciências da Universidade do Porto (FCUP), 5
Porto, Portugal 6
7
9
An automated Flow Injection Analysis (FIA) system based on a initial analyte separation 10
by gas-diffusion and subsequent determination by square-wave voltammetry (SWV) in a 11
flow cell is proposed for the determination of total and free content of sulphur dioxide 12
(SO2) in wine. The proposed method was compared with two iodometric methodologies 13
(the Ripper method and a simplified method commonly used by the wine industry). The 14
developed method shown repeatability (RSD lower than 6%) and linearity (between 10 to 15
250 mg·L-1) as well as suitable LOD. (3 mg·L-1) and LOQ (9 mg·L-1). A major advantage 16
of this system is that SO2 is directly detected by flow SWV. 17
Keywords: Wine; Sulphur dioxide; Sulfites; Gas-diffusion; Square-wave voltammetry; 18
Flow injection analysis (FIA); Food analysis; Food additives; Analytical chemistry 19
20
Introduction 21
SO2 and its source compounds, such as sulfite salts, are widely used as preservatives in 22
the food industry. They are added to foods and beverages, in order to prevent undesirable 23
microbial growth, discoloration and oxidation processes, consequently improving the 24
quality and final appearance of the products. In wine, sulphur dioxide is usually found 25
either free (as HSO3-, SO3
2- and SO2, depending on the sample’s pH), or bound to carbonyl 26
and unsaturated compounds and/or phenol derivatives (Barbe et al. 2000). 27
The relevance of SO2 determination in food analysis is widely established; in the 28
particular case of wine, its control is essential not only because at high levels it produces an 29
unpleasant aroma and taste but also because of health hazards especially for hypersensitive 30
people (Decnop-Weever et al. 1997). SO2 levels should be checked before bottling in order 31
to be adjusted for a suitable aging and at the end-product to comply with existing legal 32
limits (Segundo et al. 2001). In the EU the maximum level of total SO2 permitted is 160 33
Page 1 of 19
http://mc.manuscriptcentral.com/tfac Email: [email protected]
Food Additives and Contaminants
123456789101112131415161718192021222324252627282930313233343536373839404142434445464748495051525354555657585960

For Peer Review O
nly
mg·L-1 for red wines and 210 mg·L-1 for white and rosé wines (EC 1999). 34
There are many alternative methods proposed for the determination of free and total SO2 35
in wine. Nevertheless, voltammetric methodologies appear to be the most accurate ones 36
(Bruno et al. 1979, Cardwell et al. 1991, Sarudi et al. 1998). The EU recommended method 37
(EC 1990) is based on the classical Monier-Williams procedure (Monier-Williams 1927) 38
which involves a sample distillation under an inert atmosphere (e.g. nitrogen). Then the 39
analyte is collected in a hydrogen peroxide solution producing sulphuric acid, which can be 40
determined by titration using sodium hydroxide. In spite of its general applicability, the 41
long time required for the analysis precludes a more extensive use of the Monier-Williams 42
method, especially in routine analysis. The Ripper method is a direct iodometric titration 43
which is prone to interferences from iodine-reactive compounds and has been strongly 44
criticized (Maquieira et al. 1993). In general, iodometric methods (rather common 45
simplifications of the Ripper method) are preferred by the wine industry (Azevedo et al. 46
1999). For the determination of free SO2, the sample is acidified and is titrated with a 47
standard iodine solution, using starch as the indicator. For the determination of total SO2, 48
the sample is previously treated with sodium hydroxide to release the bound SO2. The 49
results should be interpreted with caution because of the solutions’ poor stability, the 50
possible occurrence of parallel reactions and additional difficulties associated with the end 51
point observation, especially in the case of the red wines (Azevedo et al. 1999). 52
During the last years FIA methods have been developed (Dvořák et al. 2006, Oliveira et 53
al. 2009, Ruiz-Capillas et al. 2009). To overcome the problems caused by the colored 54
complex matrix and interferences, some authors proposed manifolds where it is possible to 55
separate the analyte from the wine, by means of gas-diffusion (Araújo et al. 2005, 56
Chinvongamorn et al. 2008, Silva et al. 1998), microdistillation (Maquieira et al. 1993), 57
pervaporation (Mataix et al. 1998) or by using a gas generating and purging device (Zhi et 58
al. 1995), followed by a wide variety of detection methods (Isaac et al. 2006). 59
The aim of the present work was the development and validation of a rapid and reliable 60
procedure for identification and determination of total and free SO2 in wine samples based 61
on an automatic flow voltammetric system. The direct voltammetric determination of SO2 in 62
wine is difficult because of matrix interference. To develop an on-line analytical method, a 63
separation step has to be employed. Gas-diffusion was used as the separation technique. In 64
this technique there are two distinct chambers separated by a gas permeable hydrophobic 65
membrane. The volatile or semi-volatile analytes are released from the donor chamber, go 66
through the membrane and are collected in the upper chamber where a proper acceptor 67
solution takes them to the instrumental detection. Detection was performed in a patented 68
flow voltammetric cell (Figure 1) that has several advantages, being the most important one 69
the possibility of using high frequency square-waves in flow without oxygen interference 70
Page 2 of 19
http://mc.manuscriptcentral.com/tfac Email: [email protected]
Food Additives and Contaminants
123456789101112131415161718192021222324252627282930313233343536373839404142434445464748495051525354555657585960

For Peer Review O
nly
(Barros et al. 1999). 71
72
Materials and methods 73
Instrumentation 74
Voltammetric measurements (parameters are described in Table 1) were performed with 75
a Metrohm 663 VA Voltammetric Stand (Herisau, Switzerland) equipped with a hanging 76
mercury drop electrode with glassy carbon auxiliary electrode and reference AgCl/Ag (3M 77
KCl) electrode. The system was connected to an Autolab PGSTAT 10 Voltammetric System 78
(Eco Chemie, Utrecht, The Netherlands). All measurements were made at room 79
temperature. 80
The voltammetric flow cell was manufactured in our laboratory and has been described 81
previously (Barros et al. 2001, 2002, Rodrigues et al. 2001, Rodrigues et al. 2002). 82
A home-made Perspex gas-diffusion module was used with PTFE membranes, 5.0 µm 83
pore size and 47 mm diameter, from Pall Corporation (Ann Arbor, U.S.A.). 84
The FIA system is depicted in Figure 2: it includes several three way solenoid valves, a 85
peristaltic pump and PTFE tubing. The sample flow reacts on-line with an acid solution, in 86
the “Y” connection in order to turn all sulfites into SO2; then it goes through a thermostated 87
coil that has the function of pre-heating the donor flow before entering the gas-diffusion 88
module; the SO2 passes through the hydrophobic membrane and is received by the acceptor 89
flow (acetate buffer) that takes it to be instrumentally detected. 90
The FIA system was incorporated in a prototype (Figure 3). This equipment works 91
automatically with its own purposely designed control software. A GPES 4.9 Software 92
project was developed for automatic voltammetric data acquisition, data saving, and signal 93
processing. It was possible to interconnect both software using a signal trigger transmission. 94
Chemicals and wine samples 95
All reagents used were of p.a. grade and were used without further purification. Ultra-96
pure water from a Millipore Simplicity 185 water purification system (Millipore, Billerica, 97
U.S.A.) was used. The supporting electrolyte (acceptor solution) consisted of acetate buffer 98
pH 4.0 (0.1 mol·L-1), sodium acetate was purchased from Merck (Darmstadt, Germany). 99
The buffer’s pH was adjusted with hydrochloric acid, 6 mol·L-1, from Prolabo (Fontenay-100
sous-Bois, France). Na2SO3 (Sigma, St. Louis, U.S.A.) was used as a source of SO2. Ethanol 101
was also purchased from Merck. 102
Some of the wine samples were bought in regular supermarkets in Porto while others 103
were kindly supplied by the Instituto dos Vinhos do Douro e Porto (IVDP). 104
Sample preparation 105
Page 3 of 19
http://mc.manuscriptcentral.com/tfac Email: [email protected]
Food Additives and Contaminants
123456789101112131415161718192021222324252627282930313233343536373839404142434445464748495051525354555657585960

For Peer Review O
nly
For the determination of free SO2 no sample preparation was required. For the 106
determination of total SO2 an alkaline pre-treatment was essential to destroy the adducts 107
(SO2 bounded to several aldehydes and ketones) formed in wine (Sarudi et al. 1998). For 108
that purpose 10 g of sodium hydroxide were added per liter of sample. The sample was 109
homogenized and left to rest for about 20 min. 110
Results and discussion 111
On-line acidification 112
The wine sample must be acidified prior to gas diffusion in order to turn all sulfites into 113
SO2, and the pH must be very low (pka1 = 1.77 and pka2 = 7.22). On-line acidification with 114
sulfuric acid was achieved using a “Y” shaped connection that helped mixing together the 115
sample flow with the acid flow. 116
The acid concentration was optimized, knowing that it should be as low as possible to 117
save chemical resources and to prevent the equipment’s corrosion but still strong enough to 118
accomplish its objective. After several experiments (Figure 4) concentration chosen was 1 119
mol·L-1. 120
Voltammetric analysis of SO2 121
Research on the electrochemical reduction of SO2 in aqueous solution with dropping 122
mercury electrode has reported two waves in acidic medium and no waves in neutral or 123
slightly alkaline media. There has been much disagreement in the interpretation of 124
polarographic reduction of aqueous sulphur dioxide at pH 4 (Streeter et al. 2005). A one-125
electron reduction of HSO3- has been suggested (1) (Reynolds et al. 1986) along with the 126
possibility that HSO3- becomes SO2 at the drop’s surface, and it is this species reduced in 127
the electrode (2) (Tolmachev et al. 1999). 128
HSO3- + H+ + e- → SO2
- + H2O (1) 129
SO2 + e- → SO2- (2) 130
Due to matrix effect, standard additions were used to quantify the level of SO2 in the 131
different wine samples (Figure 5). Since the linearity was quite good for routine analysis 132
one single addition was enough. 133
Two separate determinations must be done for each wine, one for the free sulphur content 134
and another for the total, the difference lays on previous sample treatment with sodium 135
hydroxide for the second case. 136
Study of interferences 137
The level of ethanol in wine varies to a large degree and consequently the influence of 138
Page 4 of 19
http://mc.manuscriptcentral.com/tfac Email: [email protected]
Food Additives and Contaminants
123456789101112131415161718192021222324252627282930313233343536373839404142434445464748495051525354555657585960

For Peer Review O
nly
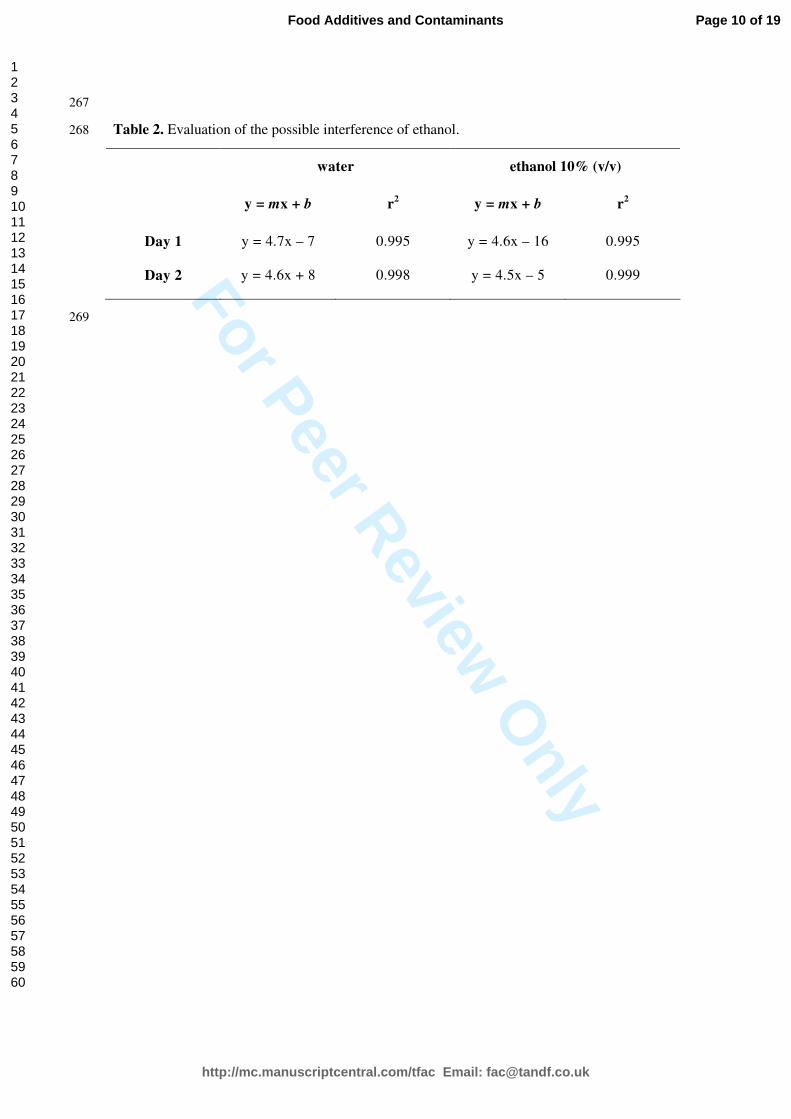
ethanol concentration was studied. With that purpose, two SO2 calibrations curves (10 to 139
100 mg·L-1) were compared: one in water and the other one in ethanol 10% (v/v), 140
replicating ethanol concentration in wine. As can be perceived in Table 2, ethanol showed 141
no influence in the analysis. 142
Carbon dioxide is normally found in wine in the concentration range of 1 to 2 g·L-1 due to 143
the fermentation process (Santos et al. 2006). Previous studies showed that this compound 144
does not interfere in the analytical procedures that make use of gas-diffusion (Santos et al. 145
2006, Segundo et al. 2001). 146
Method comparison 147
The determination of sulfite concentrations in the different wine samples by the 148
developed flow procedure was compared with the reference “Ripper” method and its 149
simplified version generally used in the wine industry (Figure 6). 150
The “Ripper” method was performed according to the Portuguese regulation (IPQ 1987) 151
based in a procedure from the Organisation Internationale de la Vigne et du Vin (OIV 152
2007). 153
The wine industry normally uses a simple iodometric methodology for routine analysis: 154
instead of the four titrations in the “Ripper” method (one for the free SO2, two for the total 155
SO2 and one for the interferences) only two are carried out (one for the free and another one 156
for the total SO2). The methodology consists on iodometric titrations of an acidified wine 157
sample. For the free SO2 determination, 5 mL of 1:4 H2SO4 are added immediately before 158
the titration. To determine the total SO2 content, 25 mL of 1 mol·L-1 NaOH are added 15 159
minutes prior to analysis, in order to perform alkaline hydrolysis, and then 10 mL of 1:4 160
H2SO4 just before the titration. 161
Method performance characteristics 162
Method performance was established by plotting a calibration curve with eight different 163
standards, from 10 to 250 mg·L-1, with six repeated measurements of each point (n = 6) 164
(Table 3). LOD and LOQ (Eurachem 1998) were adequate to wine analysis, though they can 165
be easily decreased with a slight time-consuming change in the procedure. The buffer 166
solution can be stopped and isolated at the upper chamber by this way allowing an 167
incremented quantity of SO2 passage to the upper chamber and consequently an increase in 168
the analytical signal, i.e. the LOD can be lowered by increasing the time needed for each 169
analysis (Figure 7). This makes it possible to analyze matrices with low sulfite content such 170
as beer, juices and other food products. In the present configuration the prototype is able to 171
analyze 15 samples per hour. 172
Conclusions 173
Page 5 of 19
http://mc.manuscriptcentral.com/tfac Email: [email protected]
Food Additives and Contaminants
123456789101112131415161718192021222324252627282930313233343536373839404142434445464748495051525354555657585960

For Peer Review O
nly
In this paper a new automatic FIA system for the determination of SO2 in wine is 174
described and evaluated. The developed system shows several advantages when compared 175
to other analytical methodologies: voltammetry directly measures SO2 which means a more 176
accurate result; it is especially advantageous with red wines when compared to all the 177
iodometric procedures; it is very versatile, i.e. it can be used with other matrices like beer or 178
juices among others. This analytical procedure was characterized by a good precision, an 179
ample linear application range, an adequate limit of detection and quantification which can 180
be easily lowered if necessary. Good agreement was observed between the proposed new 181
methodology and the one currently used in wine quality control laboratories. 182
Acknowledgments 183
The authors thank the IVDP, particularly Eng. Natália Ribeiro and Eng. Maria José 184
Mirão, for gently supplying us with wine samples and helping us understand the wine 185
industry needs. The authors also wish to thank the European Regional Development Fund 186
(ERDF), the Portuguese Programa Operacional Ciência Tecnologia Inovação (POCTI) and 187
the Portuguese Programa Operacional da Economia (POE) for all the financial support 188
given to project “BEERVOLT” (POCI 2010 – IDEIA, project no. 13-02-03-FDR-01252). 189
L.M.G. (SFRH/BD/36791/2007), P.J.M. (SFRH/BD/27834/2006) and J.G.P. 190
(SFRH/BD/30279/2006) wish to acknowledge Portuguese Fundação para a Ciência e a 191
Tecnologia (FCT) for their PhD studentships. 192
References 193
Araújo C, Carvalho J, Mota D, Araújo C, Coelho N. 2005. Determination of sulphite and acetic acid in 194
foods by gas permeation flow injection analysis. Food Chem. 92: 765-770. 195
Azevedo C, Araki K, Toma H, Angnes L. 1999. Determination of sulfur dioxide in wines by gas-diffusion 196
flow injection analysis utilizing modified electrodes with electrostatically assembled films of 197
tetraruthenated porphyrin. Anal Chim Acta. 387: 175-180. 198
Barbe J, Revel G, Joyeux A, Lonvaud-Funel A, Bertrand A. 2000. Role of carbonyl compounds in SO2 199
binding phenomena in musts and wines from botrytized grapes. J. Agric. Food Chem. 48: 3413-3419. 200
Barros A, Rodrigues J, Almeida P, Guido L, Rodrigues P. 2001. Processo para a determinação 201
voltamétrica, célula voltamétrica e dispositivo para determinação em fluxo. Port. Patent 102608. 202
Barros A, Rodrigues J, Almeida P, Guido L, Rodrigues P. 2002. Process and cell for voltammetric 203
measurement. Eur. Patent 1258725. 204
Barros A, Rodrigues J, Almeida P, Rodrigues P, Fogg A. 1999. Voltammetry of compounds confined at 205
the hanging mercury drop electrode surface. Anal Chim Acta. 385: 315-323. 206
Bruno P, Caselli M, Fano A, Traini A. 1979. Fast and simple polarographic method for the determination 207
of free and total sulphur dioxide in wines and other common beverages. Analyst. 104: 1083-1087. 208
Page 6 of 19
http://mc.manuscriptcentral.com/tfac Email: [email protected]
Food Additives and Contaminants
123456789101112131415161718192021222324252627282930313233343536373839404142434445464748495051525354555657585960

For Peer Review O
nly
Cardwell T, Cattrall R, Chen G, Scollary G, Hamilton I. 1991. Determination of free sulphur dioxide in 209
red wine by alternating current voltammetry. Analyst. 116: 253-256. 210
Chinvongamorn C, Pinwattana K, Praphairaksit N, Imato T, Chailapakul O. 2008. Amperometric 211
determination of sulfite by gas diffusion-sequential injection with boron-doped diamond electrode. 212
Sensors. 8: 1846-1857. 213
Decnop-Weever L, Kraak J. 1997. Determination of sulphite in wines by gas-diffusion flow injection 214
analysis utilizing spectrophotometric pH-detection. Anal Chim Acta. 337: 125-131. 215
Dvořák J, Dostálek P, Štěrba K, Čejka P, Kellner V, Čulík J, Beinrohr E. 2006. Determination of total 216
sulphur dioxide in beer samples by flow-through chronopotentiometry. J Inst Brew. 112: 308-313. 217
European Union Council. 1990. Methods for the analysis of wines. Off J Eur Commun. L272 218
European Union Council. 1999. Common organisation of the market in wine. Off J Eur Commun. L179 219
Eurachem. 1998. The fitness for purpose of analytical methods - A laboratory guide to method validation 220
and related topics. 221
Instituto Português de Qualidade. 1987. Alcoholic and spirituous beverages. Free, combined and total 222
sulphur dioxide content determination. Portuguese Norm 2220 223
Isaac A, Davis J, Livingstone C, Wain A, Compton R. 2006. Electroanalytical methods for the 224
determination of sulfite in food and beverages. Trends Anal Chem. 25: 589-598. 225
Maquieira A, Casamayor F, Puchades R, Sagrado S. 1993. Determination of total and free sulphur 226
dioxide in wine with a continuous-flow microdistillation system. Anal Chim Acta. 283: 401-407. 227
Mataix E, Castro M. 1998. Determination of total and free sulfur dioxide in wine by pervaporation–flow 228
injection. Analyst. 123: 1547-1549. 229
Moinier-Williams G. 1927. Ministry of Health. The determination of sulphur dioxide in foods. Analyst. 230
52: 343-344. 231
Organisation Internationale de la Vigne et du Vin. 2007. Compendium of international methods of wine 232
and must analysis. MA-E-AS323-304-DIOSOU 233
Oliveira S, Lopes T, Tóth I, Rangel A. 2009. Development of a gas diffusion multicommuted flow 234
injection system for the determination of sulfur dioxide in wines, comparing malachite green and 235
pararosaniline chemistries. J Agric Food Chem. 57: 3415-3422. 236
Reynolds W, Yuan Y. 1986. Polarographic reduction of aqueous sulfur dioxide. Polyhedron. 5: 1467-237
1473. 238
Rodrigues J, Barros A, Almeida P, Rodrigues P, Fogg A. 2001. Flow injection square wave cathodic 239
stripping voltammetric determination at a hanging mercury drop electrode of rapidly reduced compounds: 240
Determination of diacetyl in wine as 2,3-dimethylquinoxaline. Anal Chim Acta. 449: 119-127. 241
Rodrigues P, Rodrigues J, Barros A, Lapa R, Lima J, Cruz J, Ferreira A. 2002. Automatic flow system 242
with voltammetric detection for diacetyl monitoring during brewing process. J Agric Food Chem. 50: 243
3647-3653. 244
Ruiz-Capillas C, Jiménez-Colmenero F. 2009. Application of flow injection analysis for determining 245
sulphites in food and beverages: A review. Food Chem. 112: 487-493. 246
Page 7 of 19
http://mc.manuscriptcentral.com/tfac Email: [email protected]
Food Additives and Contaminants
123456789101112131415161718192021222324252627282930313233343536373839404142434445464748495051525354555657585960

For Peer Review O
nly
Santos J, Korn M. 2006. Exploiting sulphide generation and gas diffusion separation in a flow system for 247
indirect sulphite determination in wines and fruit juices. Microchim Acta. 153: 87-94. 248
Sarudi I, Kelemen J. 1998. Determination of sulphur and total sulphur dioxide in wines by an ICP-AES 249
method. Talanta. 45: 1281-1284. 250
Segundo M, Rangel A. 2001. A gas diffusion sequential injection system for the determination of sulphur 251
dioxide in wines. Anal Chim Acta. 427: 279-286. 252
Silva R, Silva C, Nóbrega J, Neves E. 1998. Flow injection spectrophotometric determination of free and 253
total sulfite in wines based on the induced oxidation of manganese(II). Anal Lett. 31: 2195-2208. 254
Streeter I, Wain A, Davis J, Compton R. 2005. Cathodic reduction of bisulfite and sulfur dioxide in 255
aqueous solutions on copper electrodes: an electrochemical ESR study. J Phys Chem B. 109: 18500-256
18506. 257
Tolmachev Y, Scherson D. 1999. Electrochemical reduction of bisulfite in mildly acidic buffers: kinetics 258
of sulfur dioxide and bisulfite interconversion. J Phys Chem A. 103: 1572-1578. 259
Zhi Z, Ríos A, Valcárcel M. 1995. Direct determination of free sulfur dioxide in wine and dried apple 260
samples by using a gas generating and purging device coupled to a continuous flow (injection) system. 261
Analyst. 120: 2013-2018. 262
263
264
Page 8 of 19
http://mc.manuscriptcentral.com/tfac Email: [email protected]
Food Additives and Contaminants
123456789101112131415161718192021222324252627282930313233343536373839404142434445464748495051525354555657585960

For Peer Review O
nly
Table 1. SWV parameters. 265
Initial potential - 400 mV Final potential - 850 mV
Step potential 2.5 mV Amplitude 25 mV
Frequency 300 Hz Drop size 0.024 mm3
266
Page 9 of 19
http://mc.manuscriptcentral.com/tfac Email: [email protected]
Food Additives and Contaminants
123456789101112131415161718192021222324252627282930313233343536373839404142434445464748495051525354555657585960
For Peer Review O
nly
267
Table 2. Evaluation of the possible interference of ethanol. 268
water ethanol 10% (v/v)
y = mx + b r2
y = mx + b r2
Day 1 y = 4.7x – 7 0.995 y = 4.6x – 16 0.995
Day 2 y = 4.6x + 8 0.998 y = 4.5x – 5 0.999
269
Page 10 of 19
http://mc.manuscriptcentral.com/tfac Email: [email protected]
Food Additives and Contaminants
123456789101112131415161718192021222324252627282930313233343536373839404142434445464748495051525354555657585960

For Peer Review O
nly
270
Table 3. Method performance characteristics, I = f ([SO2]). 271
Linear dynamic range RSD (n = 6) r2 LOD LOQ
10 to 250 mg·L-1 6% 0.9999 2.7 mg·L-1 9.2 mg·L-1
272
Page 11 of 19
http://mc.manuscriptcentral.com/tfac Email: [email protected]
Food Additives and Contaminants
123456789101112131415161718192021222324252627282930313233343536373839404142434445464748495051525354555657585960
For Peer Review O
nly
273
Figure 1. Voltammetric flow cell (Barros et al. 2001, 2002). 274
275
Figure 2. Flow system scheme. A – acceptor circuit; B – donor circuit; solid lines – permanent 276
pathway; dashed lines – load step pathway (2 min.); dotted lines – injecting step pathway (2 277
min.); PP – peristaltic pump (all with flow rates of 1 mL·min.-1); V – three-way solenoid valve; 278
H – heating element (both working at 90 ºC). 279
280
Figure 3. FIA system prototype. V – three-way solenoid valves; PP – peristaltic pump; H – 281
heating elements; GDM – gas-diffusion module. 282
283
Figure 4. Signal variation with the sulphuric acid concentration. The sample used in this assay 284
contained a high sulfite level and had endured an alkaline pre-treatment, i.e. reproducing the 285
determination of the total SO2 content. 286
287
Figure 5. Voltammograms obtained in the analysis of several standard solutions of SO2. Inset: 288
the calibration curve plotted with the voltammograms’ peak height. 289
290
Figure 6. Method comparison for the determination of free and total sulphites, three 291
replicates were performed for each method. 292
293
Figure 7. Signal variation with the stopped flow time in the upper chamber of the gas-diffusion 294
module. Results were acquired with a standard 20 mg·L-1 SO2 solution. 295
296
Page 12 of 19
http://mc.manuscriptcentral.com/tfac Email: [email protected]
Food Additives and Contaminants
123456789101112131415161718192021222324252627282930313233343536373839404142434445464748495051525354555657585960

For Peer Review O
nly
75x75mm (150 x 150 DPI)
Page 13 of 19
http://mc.manuscriptcentral.com/tfac Email: [email protected]
Food Additives and Contaminants
123456789101112131415161718192021222324252627282930313233343536373839404142434445464748495051525354555657585960

For Peer Review O
nly
240x111mm (150 x 150 DPI)
Page 14 of 19
http://mc.manuscriptcentral.com/tfac Email: [email protected]
Food Additives and Contaminants
123456789101112131415161718192021222324252627282930313233343536373839404142434445464748495051525354555657585960

For Peer Review O
nly
127x109mm (150 x 150 DPI)
Page 15 of 19
http://mc.manuscriptcentral.com/tfac Email: [email protected]
Food Additives and Contaminants
123456789101112131415161718192021222324252627282930313233343536373839404142434445464748495051525354555657585960

For Peer Review O
nly
149x121mm (150 x 150 DPI)
Page 16 of 19
http://mc.manuscriptcentral.com/tfac Email: [email protected]
Food Additives and Contaminants
123456789101112131415161718192021222324252627282930313233343536373839404142434445464748495051525354555657585960

For Peer Review O
nly
154x113mm (150 x 150 DPI)
Page 17 of 19
http://mc.manuscriptcentral.com/tfac Email: [email protected]
Food Additives and Contaminants
123456789101112131415161718192021222324252627282930313233343536373839404142434445464748495051525354555657585960

For Peer Review O
nly
152x132mm (150 x 150 DPI)
Page 18 of 19
http://mc.manuscriptcentral.com/tfac Email: [email protected]
Food Additives and Contaminants
123456789101112131415161718192021222324252627282930313233343536373839404142434445464748495051525354555657585960

For Peer Review O
nly
149x119mm (150 x 150 DPI)
Page 19 of 19
http://mc.manuscriptcentral.com/tfac Email: [email protected]
Food Additives and Contaminants
123456789101112131415161718192021222324252627282930313233343536373839404142434445464748495051525354555657585960