determination of neutralization potential for...
TRANSCRIPT
DETERMINATION OF
NEUTRALIZATION POTENTIAL FOR ACID ROCK DRAINAGE
PREDICTION
MEND Project 1.16.3
This work was done on behalf of MEND and sponsored by Hudson Bay Mining and Smelting and
Environment Canada
July 1996

DETERMINATION OF NEUTRALIZATION POTENTIAL FOR ACID ROCK DRAINAGE PREDICTION
A Report of Laboratory Investigations prepared for: Environment Canada and Hudson Bay Mining and Smelting Thompson, Manitoba MINING AND MINERAL PROCESS ENGINEERING UNIVERSITY OF BRITISH COLUMBIA July 31, 1996
DETERMINATION OF NEUTRALIZATION POTENTIAL FOR ACID ROCK DRAINAGE PREDICTION
A Report of Laboratory Investigations prepared for: Environment Canada and Hudson Bay Mining and Smelting Report prepared by: Richard W. Lawrence and Ying Wang Department of Mining and Mineral Process Engineering University of British Columbia 6350 Stores Road Vancouver, B.C. V6T 1Z4 July 31, 1996 Ying Wang M.A.Sc. Candidate
Richard W. Lawrence Associate Professor Chair, Mining and the Environment
Page i
TABLE OF CONTENTS
ACKNOWLEDGMENTS IV
SUMMARY 1
SOMMAIRE 3
1 INTRODUCTION 5
1.1 Objectives and Scope of Investigation 5 1.2 Background to Static Prediction Testing 6 1.3 Standard Acid Base Accounting - Principals and Application 8
1.3.1 Determination of the Acid Potential 8 1.3.2 Determination of the Neutralization Potential 8 1.3.2 The Fizz Test 9
1.4 Modified Acid Base Accounting and Other Static Tests 10 1.5 Interpretation of Static Prediction Tests 11
2 EXPERIMENTAL PROCEDURES 13
2.1 Samples and Sample Preparation 13 2.2 Neutralization Potential using the Sobek Method 13
2.2.1 Standard Sobek Method 13 2.2.2 Use of a Different Fizz Rating in the Standard Sobek Method 13 2.2.3 Back Titration Curves for the Sobek Tests 14
2.3 Neutralization Potential by Modified Acid Base Accounting 14 2.4 Neutralization Potential by Analysis of Carbonate 14 2.5 Neutralization Potential by the Lapakko Method 15 2.7 Other Analyses 15
2.7.1 Mineralogical Analysis by X-Ray Diffraction 15 2.7.2 Sulfur Analyses 15 2.7.3 Whole Rock Analysis 16 2.7.4 Analysis of Sobek Digestion Leachates 16
2.8 Calculation of Mineralogy and NP from Whole Rock Chemistry 16
Page ii
3 RESULTS AND DISCUSSION 18
3.1 Comparison of NP by Standard Sobek, Modified and Carbonate Methods 18 3.2 NP by the Lapakko Method 20 3.3 Effect of a Different Fizz Rating on NP Determined by the Sobek Method 21 3.4 Effect of Method of NP Determination on Net NP and NP:AP Ratio 24 3.5 Interpretation of Back Titration Curves 25 3.6 Mineralogical Analysis by XRD and its Use In Static Test Data Interpretation 27 3.7 Calculation of Mineralogy and NP from Whole Rock Chemistry 28 3.8 Acid Base Accounting for the Reference Standard NBM-1 30
4 CONCLUSIONS AND RECOMMENDATIONS FOR STATIC TESTING 32
5 REFERENCES 37
FIGURES 39
TABLES 48
APPENDIX I 70
Modified Acid Base Accounting Procedure 70 MODIFIED ACID BASE ACCOUNTING PROCEDURE 71
Samples 71 Fizz Test 71 Determination of Neutralization Potential (NP) 71 Determination of Acid Potential (AP) 71 Calculation of Net NP and NP:AP Ratio 72 Reporting of Results 72 References 72
APPENDIX II 73
Regression Analysis of Experimental 73 and Calculated NP Values 73

Page iii
APPENDIX III
Back Titration Curves for Sobek Tests
APPENDIX IV
X-ray Diffraction Data for Selected Samples
Page iv
ACKNOWLEDGMENTS
The authors of this report would like to acknowledge Benoit Godin, Section Head, Environmental Contaminants Division, Environmental Protection, Yukon Division, Environment Canada, for his assistance and enthusiasm in initiating this study and for his continued interest and input throughout the work. Thanks are also given to Elizabeth Sherlock, former graduate student in the Department of Mining and Mineral Process Engineering, UBC, for her interest and many useful discussions. The assistance of Shannon Shaw, graduate student, and Mike Sheske, undergraduate student, in the Department of Earth Sciences, UBC, with performing ARD analyses and the derivation of calculated mineralogical data respectively is also acknowledged. The XRD analysis of five samples by Dr. Dogan Paktunc, CANMET, is also appreciated. The financial support of Environment Canada and the Hudson Bay Mining and Smelting Company is gratefully acknowledged. Part of the work was also made possible due to the financial assistance of a research operating grant provided by the Natural Sciences and Engineering Research Council of Canada.

Page 1
SUMMARY
A study has been carried out to evaluate static test methods for determining the neutralization potential, NP, of mining waste as part of prediction testing for acid rock drainage. In particular, results of the widely used Sobek method under standard and altered conditions have been assessed and compared with those obtained from the Modified procedure of Lawrence and with those based on the inorganic carbon content (Carbonate NP). The method of Lapakko has also been assessed for selected samples. Special attention has been given to the effect of mineralogical composition in interpreting NP results. A supplemental method to determine NP based on a calculated mineralogical composition and mineral reactivity has been proposed and results compared with the empirical methods of determination. 120 samples of waste rock or tailings from 12 mines were used in the study. The principal findings and conclusions were as follows: • The Sobek method provides NP values which are significantly higher than those obtained by
the Modified or Carbonate NP methods.
• NP values obtained by the Modified procedure were nominally higher than those obtained by the Carbonate NP method.
• A limited number of tests using the Lapakko procedure gave NP values similar to the Carbonate NP method. The method is time consuming and is not recommended for routine assessments.
• Misinterpretation or misuse of the fizz test, used to determine the quantity of acid added in the Sobek procedure, can lead to significant variations in the NP values obtained by the procedure. The degree of excess acidity at the end of the digestion stage was found to be greater as the fizz rating is increased. NP values increased correspondingly.
• Increased acidity in the Sobek digestion procedure resulted in an increased dissolution of silicate minerals as evidenced by a corresponding increase in silicate mineral cation concentrations. Therefore, the higher values of NP obtained by the Sobek method relative to the Modified and Carbonate procedures are overestimates of the neutralization capacity that will be available under field conditions.
• The Modified procedure is considered to provide practical NP values by accounting for only the most reactive of the silicate minerals in addition to the carbonate minerals.
• Variations in NP values for the same sample as determined by different methods or by using procedural variations for the same method can result in wide variations of Net NP or, more importantly, the NP:AP ratio used to classify wastes as ‘safe’ or ‘requiring further testing or requiring ARD control’. For a significant number of samples, both classifications were shown to be possible, depending on the NP values used.
• Plotting the back titration curve in the determination of the remaining acidity at the end of the Sobek digestion procedure has been shown to be a reliable indicator of NP overestimation for the majority of samples. The shape of the curve indicates if significant silicate mineral dissolution has occurred in the test.

Page 2
• The impact of test method on NP and NP:AP ratio was found to be particularly significant for the reference standard material NBM-1. NP:AP ratios of 1.7 to 10.2 were obtained for this material.
• A method of calculating NP based on whole rock chemistry, a CIPW normative calculation, and relative reactivities of component minerals gave NP values which correlated well with values from the Modified procedure. The method is considered to have a good potential as a routine method of NP determination following calibration with empirically determined values for specific lithological units.
• Reliable and confident determination of the practical NP value of a waste cannot be achieved by a single test. In all cases, mineralogy is the key parameter which must be evaluated and considered in a waste characterization program. The Modified procedure is considered to provided the most reliable static test for providing a practical NP value. Other analyses and supplemental tests are recommended, some or all of which might be applicable for a specific program.
• Static test procedures, with or without other analyses and tests, must, however, be used as a preliminary method of classification. For many applications, kinetic test methods will be required to establish the rate and extent of the depletion of neutralization potential over a wide range of conditions which might be encountered in the waste disposal facility.
Page 3
SOMMAIRE
Une étude a été menée pour évaluer les méthodes d’essai statiques servant à déterminer le potentiel de neutralisation (PN) des déchets miniers dans le cadre d’essais visant à prévoir l’acidification du drainage rocheux acide (DRA). En particulier, on a évalué et comparé les résultats de la méthode Sobek largement utilisée dans des conditions normales et altérées avec ceux obtenues par la méthode modifiée de Lawrence et avec ceux basés sur la teneur en carbone inorganique (PN des carbonates). La méthode de Lapakko a également été évaluée sur des échantillons choisis. Une attention spéciale a été portée à l’effet de la composition minéralogique dans l’interprétation des résultats du PN. On a proposé une méthode supplémentaire pour déterminer le PN en se fondant sur une composition minéralogique calculé et la réactivité minérale et l’on a comparé les résultats avec les méthodes de détermination empiriques. Pour cette étude, on a utilisé 120 échantillons de stériles ou de résidus provenant de 12 mines. Voici les principales conclusions:
• La méthode Sobek donne des valeurs PN significativement plus élevées que celles obtenues par la méthode modifiée ou la méthode du PN des carbonates.
• Les valeurs PN obtenues par la méthode modifiée ont été nominalement plus élevées que celles obtenues par la méthode du PN des carbonates.
• Un nombre limité d’essais selon le procédé Lapakko donnent des valeurs PN semblables à la méthode du PN des carbonates. La méthode exige beaucoup de temps et n’est pas recommandée pour les essais courants.
• Une mauvaise interprétation ou utilisation du test d’effervescence servant à déterminer la quantité d’acide ajoutée dans l’essai selon la méthode Sobek peut donner lieu à des variations significatives des valeurs PN obtenues par le procédé. Le degré d’acidité excédentaire à la fin de l’étape de digestion s’est avéré plus élevé à mesure que l’on augmentait le taux d’effervescence. Les valeurs du PN ont augmenté tout autant.
• Une augmentation de l’acidité dans le procédé de digestion Sobek s’est traduite par une dissolution accrue des minéraux silicatés comme en témoigne une hausse correspondante des concentrations de cations de minéraux silicatés. Par conséquent, les valeurs plus élevées du PN obtenues par la méthode Sobek par rapport à la méthodes modifiée et à celle des carbonates donnent une surestimation de la capacité de neutralisation dans les conditions qui existent sur le terrain.
• La méthode modifiée est considérée comme donnant des valeurs pratiques du PN en ne tenant compte que des minéraux silicatés les plus réactifs en plus des minéraux carbonatés.
• Les variations des valeurs du PN du même échantillon telles que déterminées par différentes méthodes ou par des variations de protocole de la même méthode peuvent produire des grandes variations du PN net ou, fait plus important encore, du rapport PN/PA servant à classifier les déchets selon qu’ils sont sans danger ou qu’ils nécessitent des essais supplémentaires ou un contrôle pour le DRA. Pour un nombre significatif d’échantillons, les deux classifications sont possibles, selon les valeurs du PN utilisées.

Page 4
• Le tracé de la courbe du titrage dans la détermination de l’acidité résiduelle à la fin du procédé de digestion Sobek est un indicateur fiable de la surestimation du PN pour la majorité des échantillons. La forme de la courbe indique s’il s’est produit une dissolution significative des minéraux silicatés dans l’essai.
• L’effet de la méthode d’essai sur le PN et le rapport PN/PA s’est révélé particulièrement significatif pour l’étalon de référence NBM-1. On a obtenu des rapports PN/PA de 1,7 à 10,2 pour ce matériau.
• Une méthode de calcul du PN basée sur la composition chimique de roches entières, un calcul de la norme CIPW et les réactivités relatives des minéraux a donné des valeurs du PN qui sont en bonne corrélation avec les valeurs obtenues par la méthode modifiée. Cette méthode offre des possibilités intéressantes comme méthode systématique de la détermination du PN après étalonnage avec les valeurs empiriques déterminées sur des unités lithologiques spécifiques.
• La détermination fiable et sûre de la valeur pratique du PN de déchets donnés ne peut pas être établie par un test unique. Dans tous les cas, la minéralogie est le paramètre clé qu’il faut évaluer et considérer dans un programme de caractérisation des déchets miniers. La méthode modifiée est la plus fiable procedés d’essai des statiques pour déterminer la valeur pratique du PN. On recommande d’autres analyses et des essais supplémentaires, dont certains ou tous peuvent s’appliquer à un programme spécifique.
• Les procédés d’essai statiques, qu’ils soient ou non conjuguées à d’autres analyses ou essais, doivent toutefois être utilisés comme méthodes préliminaires de classification. Dans de nombreuses applications, les méthodes d’essai cinétiques seront nécessaires pour établir la vitesse et l’ampleur de disparition du potentiel de neutralisation dans un large éventail de conditions qui peuvent exister dans une installation de gestion des déchets miniers.

Page 5
1 INTRODUCTION
1.1 Objectives and Scope of Investigation
The objectives of this investigation were: • To carry out an evaluation of the standard Sobek acid-base accounting test and other static
test procedures for the determination of the neutralization potential (NP) of mine wastes.
• To evaluate different tests and interpretations for use as supplemental information in the determination of neutralization potential.
• To provide recommendations for the use of static test procedures and their interpretation for acid rock drainage prediction to assist in the prevention or reduction of pollution to receiving waters.
Although all static test procedures attempt to provide an assessment of both the acid producing capability (AP) and acid neutralizing potential (NP) of a mine waste sample, it is the latter determination which is considered to be the most critical. Although acid potentials for all samples evaluated have been determined in this study, it is the evaluation of the determination of neutralization potential by standard acid base accounting procedures and comparison of values with other test procedures which provides the basis of this investigation. The neutralization potentials of 120 samples of waste rock and tailings have been measured in this study. All samples were tested by the following procedures:
• Standard acid base accounting (Sobek et al, 1978) • Standard acid base accounting with different acid additions • Modified acid base accounting (based on Lawrence, 1990) • NP by inorganic carbon analysis (Carbonate NP)
Selected samples were also tested using the following procedure:
• Lapakko method (based on Lapakko, 1994) The mineralogy of a selected number of samples was evaluated using X-ray diffraction. In addition, a preliminary method of calculating NP based on whole rock chemistry was evaluated for a majority of the samples. Results are compared with the experimentally determined values.
Page 6
1.2 Background to Static Prediction Testing
Acid rock drainage (ARD) is the single most important environmental concern in the mining industry. Recent data released by the Canada Centre for Mineral and Energy Technology in the report "Results of a Workshop on the Rehabilitation of Mine Sites, Toronto, 10 and 11 March, 1994" (Feasby and Jones, 1994), indicates that the financial liability for the remediation of waste rock tailings accumulations in Canada is in excess of $5 billion. Although other mine components such as the walls in open pits, underground workings, ore stockpiles, and concentrate storage and loadout areas can contribute to ARD, it is the waste rock and tailings which are the most significant sources. Geographically, it is Ontario and Quebec, where underground mining has been more common, which have the largest accumulations of acid generating tailings. British Columbia has the largest quantities of waste rock compared with any other province due to a larger number of open pit mines. Proponents of new mines and operators of existing mines are required to provide evidence that waste materials to be generated during operation can be stored in a manner that will prevent or mitigate the generation of ARD and the migration of heavy metal contaminated runoff and seepage into downstream watercourses both during operation and long after mine closure. Uncontrolled ARD emissions can result in significant ecological disruption in sensitive and productive receiving waters. To provide confident waste management plans that will allow permitting to proceed and acceptance of closure measures requires that proponents and operators characterize the wastes resulting from current or proposed mining activities in order to predict future performance of the materials when disposed of under environmental conditions. Mining waste materials can be the source of acidic drainage, with associated heavy-metal contamination, due to natural oxidation reactions taking place when the waste is exposed to air and water, with sulfide oxidizing bacteria contributing a significant role in the process. However, acidic drainage can be neutralized and heavy metals attenuated due to reaction of the drainage with alkaline components of the wastes. Almost without exception, wastes are initially characterized using tests known as static prediction tests which attempt to determine the balance between the acid potential (AP) of the material, derived by quantifying the acid-producing components of the material, and the neutralization potential (NP), determined by measuring the quantities of acid-consuming components. Although there are several test methods available, by far the most commonly reported procedure is the Acid Base Accounting Test proposed in a U.S. EPA report of 1978 (Sobek et al., 1978). Although it is recognized by most researchers, mining company personnel, consultants and regulators that acid base accounting and other static tests only provide an initial assessment of the potential of mining wastes to produce ARD and that several other subsequent assessments such as kinetic testing should be carried out to provide a more comprehensive characterization, in practice considerable weight is placed on the results of the static tests. This is evident by the fact that most jurisdictions having power over the issuing of permits to develop and operate mines use the results of static testing as criteria in the classification of wastes for planning purposes. In British Columbia, for example, recently published guidelines (Errington and Price, 1995) propose to use a ratio of the neutralizing capability of a material to its potential acid producing ability as the demarcation between wastes considered to be safe for disposal without

Page 7
specific control requirements and those which require controlled disposal or are uncertain in their classification and require further testing. In B.C., the value of the NP to AP ratio (often written as NPR) is not a fixed value but is established following careful review of both static testing and other tests, particularly kinetic tests. The value of NP of a sample, however, is significantly more sensitive to the test methodology used and its mineralogical characteristics than the determination of AP, as will discussed in more detail below. The value of the NP to AP ratio and the classification of the sample can, therefore, change depending on the NP value obtained. The results of many tests previously carried out by the current investigators have indicated that very significant misinterpretations of static tests such as the acid base account test can arise for specific samples. This can occur even if tests are performed under very carefully controlled conditions. In practice, the tests are, by practical necessity, usually carried out in large numbers and with a low unit cost so that detailed care and attention is not given to individual samples. Furthermore it seems to be quite common for static testing contracts to be awarded on the basis of budget rather than know-how and experience, so that tests are often carried out in laboratories which provide little or no insight to irregularities in the behaviour of individual samples tested or into the interpretation of the results obtained. Consequently, it is not uncommon that data are used without proper consideration of the laboratory technique actually used or that the results are accurate. The source of discrepancies in static test results can be initially understood by considering the disparity between the results that can be achieved under actual test conditions and the future performance of the material under field conditions. In a typical static test, the acid potential of a sample is determined by calculating the theoretical quantity of acid that could be produced if the total sulfur content of a sample is converted to sulfuric acid. In the standard acid base accounting test of Sobek, the neutralization potential is determined by boiling a small quantity of finely ground sample in excess hydrochloric acid to calculate the acid consumption. Clearly, under environmental conditions, not all sulfur will actually oxidize to produce acid. Neither will all the neutralizing capability, as determined under the vigorous conditions of the test, be available for reaction. The largest discrepancies will arise in the assessment of the neutralizing potential. Discrepancies in results often arise due to mineralogical factors which affect the analysis. For low carbonate content materials, high neutralization potentials will be apparent in tests if very acidic digestions are utilized part of the acid base accounting procedure. Under such conditions, some minerals, chiefly silicates, will dissolve and contribute to the apparent NP value. Under environmental conditions, such high acidities are unlikely to be encountered and effective NP values will be much lower, restricted to those minerals which will dissolve or alter under conditions of lower acidities (higher pH). Although silicate alteration can contribute to ARD neutralization and heavy metal attenuation (Sherlock et al, 1995), reactions are very slow and their contribution needs to be understood for short and long term consideration of waste behaviour. For more accurate ARD prediction resulting in more confident waste management planning and permitting of mines to prevent or reduce contaminant release into receiving waters, consideration

Page 8
of the conditions and interpretation of ARD prediction procedures is essential. This report will present the results of an examination of the standard Sobek acid base accounting procedure and its limitations, specifically with regard to the determination of neutralization potential. Comparison with other static test results and supplemental tests and analyses will provide the basis for recommendations for static testing. The results of a preliminary evaluation of a method to calculate NP based on whole rock chemistry will also be presented.
1.3 Standard Acid Base Accounting - Principals and Application
The most widely used static testing procedure used by the mining industry for the initial characterization of mining wastes and other mine components for the prediction of acid rock drainage is the acid base accounting (ABA) procedure of Sobek et al. (1978). As with other static tests, this test attempts to provide a measure of the balance between the constituents of a sample which can produce acid upon oxidation (the acid potential) and those which can neutralize acid (the neutralization potential).
1.3.1 Determination of the Acid Potential
The acid potential (AP) of a sample of mine waste is determined by calculating the theoretical amount of acid that can be produced if the total amount of sulfur in the sample is oxidized to sulfuric acid. Since the units of acid potential are presented in kg CaCO3 per tonne of material, the AP is given by: AP = Sulfur content (%) x 1000 kg x molecular weight of CaCO3 100 atomic weight of sulfur
Thus, AP = sulfur content (%) x 31.25 kg CaCO3/tonne The total sulfur content of a sample is typically measured by Leco or classical gravimetric methods involving oxidative digestion/barium sulfate precipitation. Other analytical techniques such as inductively coupled plasma analysis (ICP) may be used. In the standard Sobek method, no attempt is made to distinguish between sulfur species which will oxidize to form acid, such as sulfide minerals, and those which will not such as sulfate salts and minerals, notably gypsum and barite, or other species.
1.3.2 Determination of the Neutralization Potential
The neutralization potential (NP) of the sample is determined experimentally by digestion in an excess amount of hydrochloric acid, determined by means of the fizz test (see below), to a finely-ground sample under boiling conditions. After cooling, the acid remaining in the pulp is determined by titration with a base (sodium hydroxide) to a pH 7.0 end point so that the amount of acid consumed can be calculated. This quantity of acid is then expressed in units of kg CaCO3 per tonne of sample.

Page 9
For example, in a test to determine the NP of a sample of waste rock, 40 mL of 0.1 N hydrochloric acid is added to 2.0 g of the sample. After the digestion stage, it is determined that 22.5 mL of 0.12 N sodium hydroxide is required to titrate the pulp to a pH of 7.0. The NP of the sample can be calculated as follows:
Acid consumed per g = (40 mL x 0.1 N) - (22.5 mL x 0.12 N) mg equivalents 2 g = 0.65 mg equivalents per g
The neutralization reaction, shown as follows, indicates that 1 mole of CaCO3 is equivalent to 2 moles of HCl:
CaCO3 + 2HCl = CaCl2 + H2O + CO2
Therefore, NP = (0.65 mg equivalents x molecular weight of CaCO3 )/ 2 = 32.5 kg CaCO3 / tonne In the general case, NP = (Acid normality x volume) - (base normality x volume) x 50 weight of sample
1.3.2 The Fizz Test
In the standard Sobek procedure, the volume and normality of the hydrochloric acid to be added to a 2.0 g sample is determined by a (so-called) fizz test. The procedure involves the addition of a few drops of 25% hydrochloric acid to a small quantity of the sample. The degree to which the sample reacts to the acid, determined by assessing the degree of audible fizz and visual frothing due to the formation of CO2 if carbonates are present, allows the selection of a fizz rating. The acid volume and strength is then selected from the following table:
Fizz Rating Acid Normality Acid Volume (mL) None 0.1 20 Slight 0.1 40
Moderate 0.5 40 Strong 0.5 80
The objective of the fizz test is to provide sufficient acid to complete reaction with the acid consuming constituents. The Sobek procedure attempts to ensure this by stipulating that if less than 3 mL of base, of the same strength as the acid used, is required to obtain a pH of 7.0, it is likely that the HCl added was not sufficient If this criterion is not met, the test is to be repeated using the next higher volume or strength of acid. No provision is made, however, to control the degree of excess acid. In practice, the determination of the fizz rating is largely subjective and could be a matter of opinion between different technicians assessing the same sample. This fact, together with other factors such as distractions under typical laboratory conditions, can lead to underestimation or overestimation of the fizz rating of a sample, with a resulting difference in the quantity of acid
Page 10
added in the digestion stage. It follows that for a particular sample, the quantity of acid added could be one of three values: the "correct amount" or either lower or higher amounts. It is known that some commercial laboratories dispense with the fizz test altogether and simply use the highest acid normality and volume specified in the table, presumably to save time and in the belief that the degree of excess will not affect the value of NP obtained. Even assuming a "correct" fizz rating, it is the experience of the current investigators in previously carrying out several thousand static tests, that the value of pH following the digestion stage can vary widely. Values can range from as high as pH 5 or 6 to 0.4 or lower at the other end of the scale. Thus, consistent conditions of acidity in the digestion are not achieved. As part of this investigation, the affect of an incorrect fizz rating on the subsequent NP determination will be assessed by carrying out the Sobek procedure on samples at three of the levels of acid addition specified by the fizz test procedure.
1.4 Modified Acid Base Accounting and Other Static Tests
In addition to the Sobek method, several other tests have been proposed for the initial assessment of the ARD potential of waste samples. Several studies have been carried out in recent years to evaluate and compare static prediction procedures (for example, Ferguson and Erickson, 1987; Lawrence et al, 1989; Lapakko, 1994). Several methods evaluated in those studies are not in widespread use, are close modifications to other more popular methods, or are considered not to be effective and are not, therefore, included in this study. One procedure, the B.C. Research Initial Test (Duncan and Bruynesteyn, 1979) , is still used in some evaluations. It is not, however, included in the experimental evaluation of methods. Lawrence (1990) prepared a manual of chemical prediction procedures in which several static test procedures are described and discussed. Norecol (1991) discussed methods for static prediction procedures and provided a comprehensive account of methods and modifications which can be used for more effective prediction. In this investigation, a modified ABA procedure based on the method of Lawrence (1990) and the determination of neutralization potential by measuring the inorganic carbon content were used for all samples evaluated in addition to the Sobek method. The Lawrence (1990) procedure was developed to minimize the overestimation of NP by (i) carrying out the digestion procedure at ambient temperature, and (ii) by ensuring that the pH at the end of the digestion is in a prescribed range method so as to prevent the over-addition of acid. Values derived from this test are referred to as Modified NP. By measuring the inorganic carbon content, the NP due to carbonates only is determined (Carbonate NP). The procedure of Lapakko (1994) was evaluated for only a few samples.

Page 11
1.5 Interpretation of Static Prediction Tests
For tests in which the acid potential and neutralization potential of a sample are determined independently (eg. Sobek ABA, Modified ABA, Lapakko ABA), test data are usually calculated and interpreted in one of two ways. The original interpretation of static tests is to calculate the balance between the AP and NP values. This difference is termed the Net Neutralization Potential or Net NP or NNP. By convention, Net NP = NP - AP, so that a positive value of Net NP indicates that the sample has more acid consuming constituents than acid producing ones. The sample is therefore classified as a potentially acid consuming material. Similarly, a negative Net NP value indicates that the sample has a surplus of acid producing constituents and is therefore classified as a potential acid producing material. Different jurisdictions have used different guidelines to asses the acid producing or consuming potential based on Net NP, although the trend is to use the NP:AP ratio (see below). Examples are as follows:
Jurisdiction Interpretation of Net NP British Columbia >+20. non acid generating
< 0 acid generating
Montana >20 low risk of acid generation <-20 acid generation likely
Interpretation of the ABA test by calculating the NP:AP ratio has become a more favoured method as this value provides a clearer appreciation of the relative quantities of acid producing and acid consuming constituents. As described in Section 1.2, the value of the ratio is used to assess the potential for acid generation, with different jurisdictions recommending different values to distinguish between potentially acid producing or consuming materials. Examples of NP:AP ratios specified/proposed by some jurisdictions are as follows:
Jurisdiction NP:AP Ratio Criterion
British Columbia 3 California 3
Idaho 2 Montana 3 Nevada 1.2
It should be noted that in several jurisdictions, such as British Columbia, the NP:AP ratio is not a rigidly applied criterion. Rather it is used as a preliminary guide, with the final classification being site specific or rock unit specific, depending on the results of many tests and analyses. Typically, the results of kinetic tests, carried out to establish the rates of acid production and acid neutralization, have an important influence on the criterion.

Page 12
Some test methods, such as the Net Acid Potential method (Lapakko and Lawrence, 1993), do not measure NP and AP values independently, producing instead a net value, analogous to the Net NP value described above.

Page 13
2 EXPERIMENTAL PROCEDURES
2.1 Samples and Sample Preparation
112 waste rock and tailings samples from 12 operating or proposed mines in Canada, the United States, Philippines, Chile and Papua New Guinea, were obtained for this study. In addition, CANMET provided 8 certified reference standards (concentrates, ores and other metallurgical samples). One of the reference standard materials, NBM-1, has recently been produced as a reference material for static test calibration and is, therefore, of particular interest in this investigation. In the tables of results in the text and the appendices, samples have been code numbered as [mine number][sample number][type of sample]. For examples, waste rock sample number 4 from mine number 7 is coded 704-WR.; tailings sample number 11 from mine number 2 is coded 211-T. The reference standards are given their CANMET identifiers. Most of the samples were received as assay or ABA rejects and were therefore already pulverized, typically no finer than 80% minus 200 mesh Tyler. No further sample preparation was required for these samples. Waste rock samples received in large sizes were jaw crushed/cone crushed/pulverized as required to approximately the range 100% minus 60 mesh to 80% minus 200 mesh. Additional tailings samples collected for the investigation were air dried and tested at the as-received size.
2.2 Neutralization Potential using the Sobek Method
2.2.1 Standard Sobek Method
The standard NP procedure of Sobek et al (1978) was followed for all samples, with acid additions selected according to the actual fizz rating. Since many the samples were received already pulverized, some were finer than the minus 60 mesh specified for the procedure. However, most samples were no finer than 80% minus 200 mesh. The principals of this test have been discussed in Section 1.3.
2.2.2 Use of a Different Fizz Rating in the Standard Sobek Method
For every sample, additional tests following the standard ABA procedure were carried out, with acid additions based on a different fizz rating than used previously. The rationale for this was discussed in Section 1.3. For example, if a particular sample, was judged to have a fizz rating of moderate, the additional tests were carried out assuming fizz ratings either side of the moderate values (ie. slight and strong) and acid additions made accordingly. For strong fizz samples, the additional tests were performed with acid additions made assuming the two lower levels (moderate and slight). For no-fizz samples, the additional tests were carried out using the next higher values (slight and moderate). In all other ways, the tests were performed in strict
Page 14
adherence to the Sobek method. For a few samples, insufficient material was available to allow testing at both alternative fizz ratings.
2.2.3 Back Titration Curves for the Sobek Tests
The standard Sobek procedure requires that the quantity of acid remaining at the end of the digestion stage is back titrated to pH 7.0 using sodium hydroxide. Only the total amount of base added is required to be recorded and used for calculation of the acid remaining. In this investigation, the quantity of base added to obtain pH values of 2.0, 2.5, 3.0, 3.5, 4.0, 4.5, 5.0 and 6.0 in addition to the end point at 7.0 was recorded. In this way, the back titration curve can be plotted. This was done for every standard Sobek determination and the tests in which acid additions corresponding to two different fizz ratings were used.
2.3 Neutralization Potential by Modified Acid Base Accounting
The neutralization potential of every sample was determined using a method based on the Modified Acid Base Accounting Procedure of Lawrence (1990). This test was originally developed to reduce the tendency to overestimate NP values perceived to be obtained in the Sobek procedure. This is achieved by performing the hydrochloric acid digestion for 24 hours at lower temperatures (25-35oC) and by controlling the addition of acid so that the pH of the pulp after digestion is in a specific range (1.5 to 2.0). In addition, the end point of the back titration is 8.3, being the usual endpoint for acidity titrations, corresponding to the stoichiometric equivalence point for carbonate/bicarbonate in natural waters in which carbonic acid is the most dominant weak acid. Values of NP are referred to in this report as Modified NP. The modified ABA procedure used for this study was changed from that referenced above. The procedure used is described in Appendix I.
2.4 Neutralization Potential by Analysis of Carbonate
The carbonate neutralization potential of every sample was determined using a Coulimetrics Model 5030 Carbonate Carbon apparatus linked to a Coulimetrics Model 5010 CO2 Coulometer. The method involves the addition of hydrochloric acid to a small quantity of the sample to evolve CO2 from contained carbonates The carbon dioxide is absorbed quantitatively into a solution containing ethanolamine which causes a colour change and a corresponding increase in the light transmittance. Hydroxyl ions are electrically generated to restore the colour and the original transmittance value. The total amount of current required for the titration is integrated and the result displayed as micrograms of carbon absorbed. The CaCO3 equivalent, and thus the Neutralization Potential, referred to in this report as Carbonate NP, can then be calculated as follows:
Carbonate NP (kg CaCO3/t) = mg C in sample x 8.34 weight of sample (g)
Page 15
In this study, it has been assumed that all inorganic carbon is present as carbonate minerals capable of neutralizing acid. For samples in which the iron carbonate mineral, siderite, FeCO3, is present, elevated NP values might be obtained. Although under the conditions of a laboratory test siderite will usually consume acid, the subsequent hydrolysis of the leached iron will release hydrogen ions. In theory, siderite dissolution will neither produce or consume acidity (Norecol, 1991)
2.5 Neutralization Potential by the Lapakko Method
Lapakko (1994) carried out a comparison of prediction test methods on 10 samples and described a method by which the quantity of neutralization provided by minerals at pH’s above 6 is measured. In this investigation, 2 g of selected samples and 50 mL of water were placed in a beaker on a magnetic stirrer. Using a pH controller, 0.1 N sulfuric acid was added at a very slow rate to achieve a stable pH of 6.0 ± 0.1. The NP (pH 6) values in units of CaCO3 equivalent/tonne were calculated from the quantity of acid added.
2.7 Other Analyses
2.7.1 Mineralogical Analysis by X-Ray Diffraction
Mineralogical analysis of selected samples was carried out in the Department of Earth Sciences, UBC, and at CANMET. At UBC, analyses were performed using a Siemens D5000 powder X-ray diffractometer running at 40 kV and 30 mA and using Cu Kα radiation. Spectra were collected from 3 to 60o 2θ using a step size of 0.02o 2θ. At CANMET, a Rigaku rotating anode X-ray powder diffractometer was used, with spectra collected from 5 to 90 o 2θ, with a step size of 0.04 o 2θ.
2.7.2 Sulfur Analyses
Standard (Sobek) acid base accounting requires only the total sulfur analysis to be determined to calculate the Acid Potential of a sample. Several studies have shown that AP can be overestimated if significant quantities of non-sulfide sulfur species are present. Modified procedures address this shortcoming by requiring analysis of sulfur species, particularly sulfate, so that AP is calculated on the basis of sulfide sulfur. Since the emphasis of this study is on the Neutralization Potential determination, sulfur species analyses were not carried out. Total sulfur analyses were determined either by using a Leco induction furnace or by classical acid digestion/barium sulfate precipitation.

Page 16
2.7.3 Whole Rock Analysis
Whole rock analyses were carried out by Chemex Labs, North Vancouver, using X-ray fluorescence following a lithium metaborate fusion. Ferrous iron was also determined by dichromate titration following a non-oxidative HCl/HF digestion to enable a calculation of both Fe2O3 and FeO components.
2.7.4 Analysis of Sobek Digestion Leachates
Selected leachates from digestions carried out using the Sobek procedure and tests in which the acid additions were changed according to a different fizz rating, as described in Section 2.2.1, were analyzed for Al, Ca, Mg, Na, K and Fe by atomic absorption spectrophotometry.
2.8 Calculation of Mineralogy and NP from Whole Rock Chemistry
A method is proposed to calculate the effective NP based on sample mineralogy, to be used in conjunction with static tests and other analyses. Since a typical waste characterization study can involve the analysis and testing of a large number of samples, the cost of determining mineralogy based on classical techniques such as optical microscopy and X-ray diffraction is likely to be prohibitive as a routine procedure. Instead, the proposed method utilizes the analysis of the major rock-forming elements of a sample, usually referred to as a whole rock analysis, in combination with the analysis of inorganic carbon (carbonate), as inputs to a CIPW normative composition procedure to calculate the quantitative mineralogical assemblage of the sample. The computer program used which contains a module to calculate the CIPW norm is called NewPet, a menu driven geochemical data handling and plotting package developed at Memorial University, Newfoundland, Canada (Clark, 1993). [Note: the CIPW normative composition was named after the four petrologists who originally devised the procedure; Cross, Iddings, Pirsson and Washington]. NewPet was used to calculate the weight percent of component minerals for 87 of the samples using whole rock chemistry and inorganic carbon analyses as inputs. In addition to metals analysis, the analytical suite also includes the loss-on-ignition which is also used as an input parameter to NewPet. The mineralogical compositions of each sample were normalized to a total of 100% if the composition provided by NewPet was less than or greater than 100%. Using the calculated mineralogy, a NP value was calculated for each sample by adding together the weighted NP values for each component mineral. Using the calculated mineralogy, a neutralization potential value was calculated for each sample by adding together the weighted NP values for each component mineral. Weighted NP values for each component mineral were calculated using relative reactivity groupings suggested by Sverdrup (1990), relative reactivity values suggested by Kwong (1995) based on Sverdrup’s groupings, and converting to units of kg CaCO3 equivalent per tonne using the ratio of the molecular weight of CaCO3 to the mineral. For example, in a sample containing 17.1 % anorthite [(Ca,Na)AlSi2O8], the contribution of
Page 17
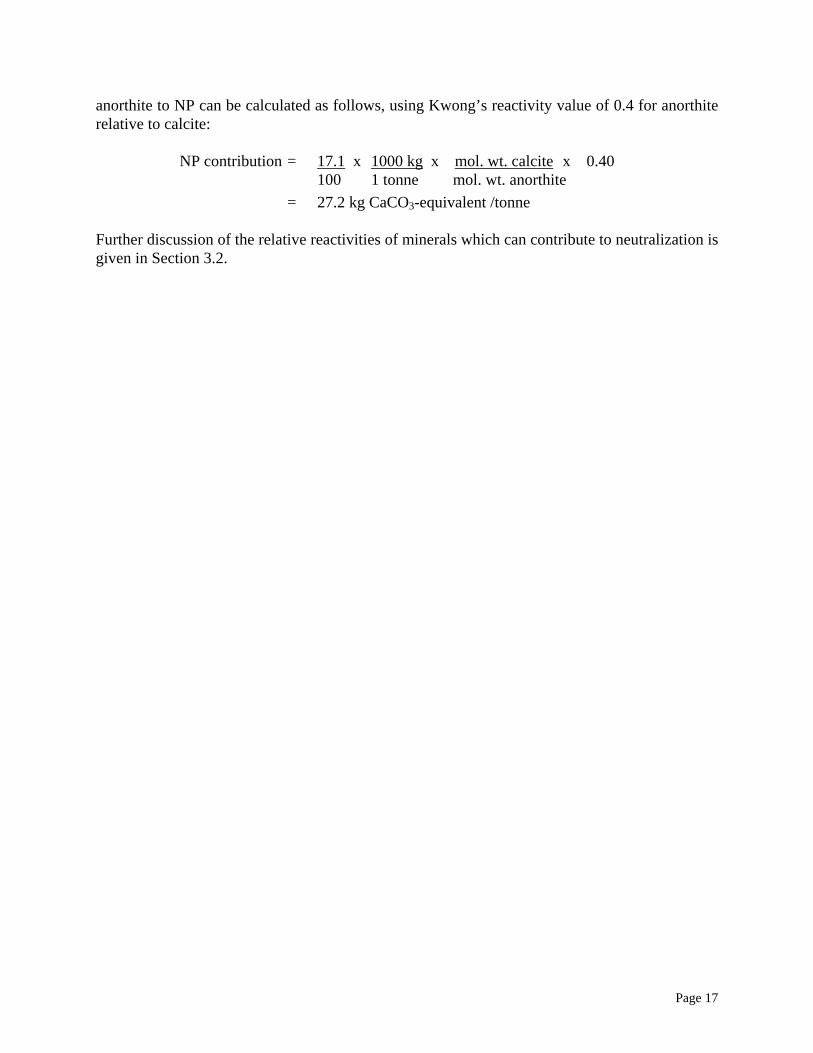
anorthite to NP can be calculated as follows, using Kwong’s reactivity value of 0.4 for anorthite relative to calcite: NP contribution = 17.1 x 1000 kg x mol. wt. calcite x 0.40 100 1 tonne mol. wt. anorthite = 27.2 kg CaCO3-equivalent /tonne Further discussion of the relative reactivities of minerals which can contribute to neutralization is given in Section 3.2.

Page 18
3 RESULTS AND DISCUSSION
The results of all of the determinations of neutralization potentials by the Sobek test, the Sobek test with different acid additions based on alternative fizz ratings, the modified ABA test, CO2 analysis, and the Lapakko method, together with fizz ratings and sulfur analyses, are presented in Table 1. The calculated values of Net NP and NP:AP ratios are given for all of the test results in Table 2. The comparison of NP, NP:AP ratio and the pH value at the end of the digestion for Sobek tests under standard conditions (acid addition according to actual fizz rating) and with different acid additions based on alternative fizz ratings) are given in Table 3, with no-fizz, slight-fizz, moderate-fizz and strong-fizz samples grouped separately in Tables 3a, 3b, 3c and 3d respectively. The analyses of digestion leachates for Al, Ca, Mg, Na, K and Fe from tests on 9 samples under standard Sobek conditions and Sobek tests with different acid additions based on alternative fizz ratings are given in Table 4. Corresponding NP values are also provided, with Modified and Carbonate NP values given for comparison. Table 5 provides the results of XRD analyses of 24 samples performed at UBC (Table 5a) and 5 samples performed at CANMET (Table 5b). Major oxide values from whole rock analyses are given in Table 6. Mineralogical compositions calculated from the whole rock analyses using NewPet are given in Table 7. Calculated NP values for individual mineral components, based on the calculated mineralogical compositions and relative mineral reactivity values, are given in Table 8. The comparison of calculated and experimental NP values are given in Table 9.
3.1 Comparison of NP by Standard Sobek, Modified and Carbonate Methods
The results of NP determinations by the Standard Sobek, Modified and Carbonate methods shown in Table 1. Correlations between NP values for all samples are plotted in Figure 1 (a, b and c). The same correlations for samples from individual mines are shown in Figure 2. Regression analyses for Modified NP vs. Sobek NP, Carbonate NP vs. Sobek and Carbonate NP vs. Modified NP are given in Appendix II. Inspection of the tabulated data and the graph of Modified NP values against Sobek NP values in Figure 1a for all of the samples shows that, with the exception of 4 low-NP samples, modified NP values are significantly lower than the corresponding Sobek values. The relationship between Sobek NP and Carbonate NP appears from Figure 1b to be very similar. Figure 2 shows that the Sobek method overestimates NP relative to the Modified and Carbonate methods for samples from all 12 of the mines.
Page 19
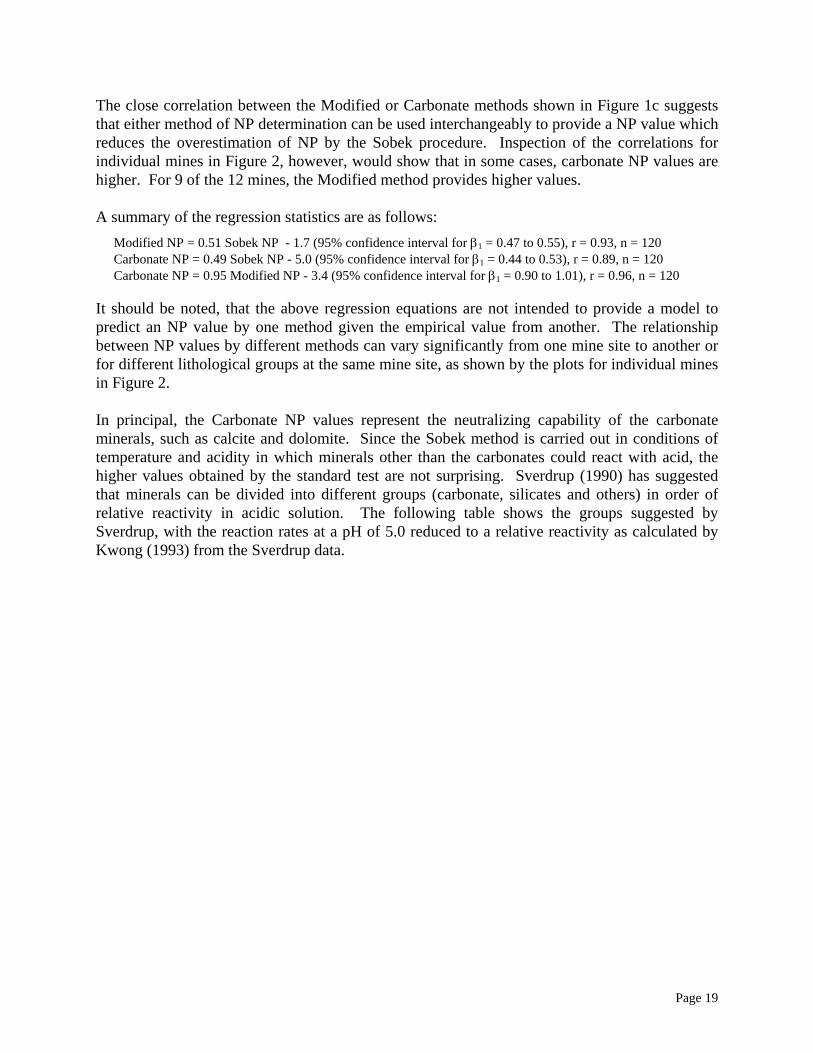
The close correlation between the Modified or Carbonate methods shown in Figure 1c suggests that either method of NP determination can be used interchangeably to provide a NP value which reduces the overestimation of NP by the Sobek procedure. Inspection of the correlations for individual mines in Figure 2, however, would show that in some cases, carbonate NP values are higher. For 9 of the 12 mines, the Modified method provides higher values. A summary of the regression statistics are as follows:
Modified NP = 0.51 Sobek NP - 1.7 (95% confidence interval for β1 = 0.47 to 0.55), r = 0.93, n = 120 Carbonate NP = 0.49 Sobek NP - 5.0 (95% confidence interval for β1 = 0.44 to 0.53), r = 0.89, n = 120 Carbonate NP = 0.95 Modified NP - 3.4 (95% confidence interval for β1 = 0.90 to 1.01), r = 0.96, n = 120
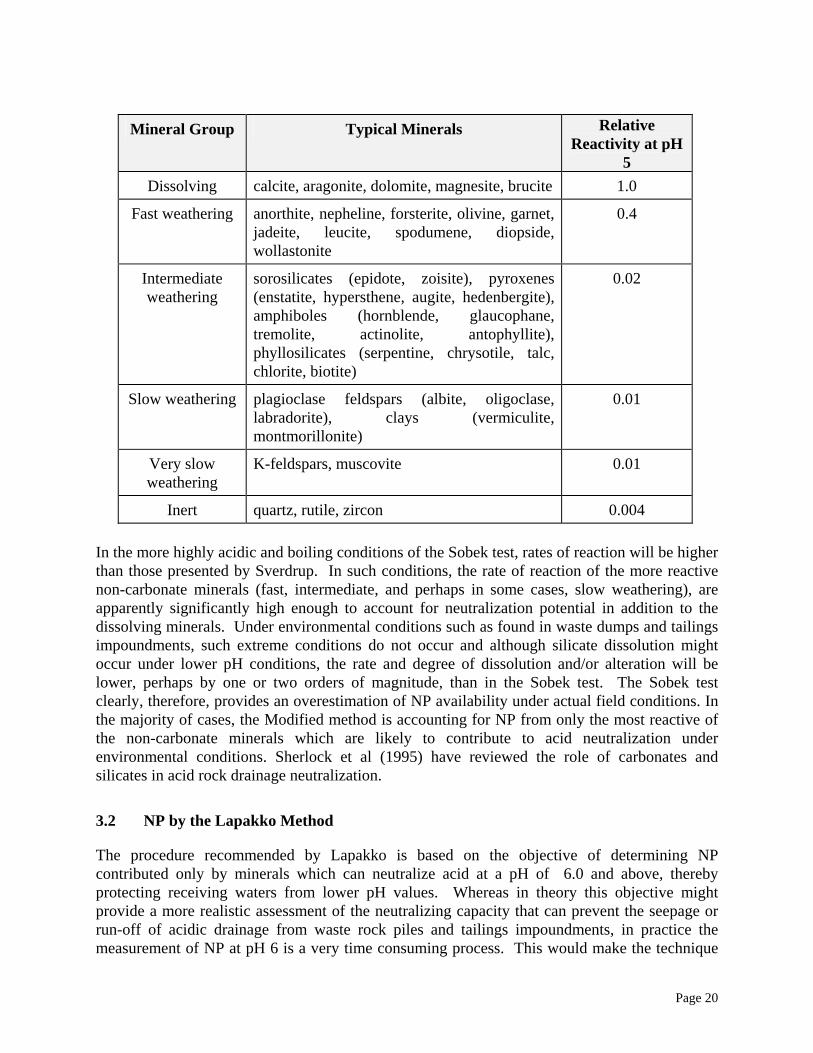
It should be noted, that the above regression equations are not intended to provide a model to predict an NP value by one method given the empirical value from another. The relationship between NP values by different methods can vary significantly from one mine site to another or for different lithological groups at the same mine site, as shown by the plots for individual mines in Figure 2. In principal, the Carbonate NP values represent the neutralizing capability of the carbonate minerals, such as calcite and dolomite. Since the Sobek method is carried out in conditions of temperature and acidity in which minerals other than the carbonates could react with acid, the higher values obtained by the standard test are not surprising. Sverdrup (1990) has suggested that minerals can be divided into different groups (carbonate, silicates and others) in order of relative reactivity in acidic solution. The following table shows the groups suggested by Sverdrup, with the reaction rates at a pH of 5.0 reduced to a relative reactivity as calculated by Kwong (1993) from the Sverdrup data.
Page 20
Mineral Group Typical Minerals Relative
Reactivity at pH 5
Dissolving calcite, aragonite, dolomite, magnesite, brucite 1.0
Fast weathering anorthite, nepheline, forsterite, olivine, garnet, jadeite, leucite, spodumene, diopside, wollastonite
0.4
Intermediate weathering
sorosilicates (epidote, zoisite), pyroxenes (enstatite, hypersthene, augite, hedenbergite), amphiboles (hornblende, glaucophane, tremolite, actinolite, antophyllite), phyllosilicates (serpentine, chrysotile, talc, chlorite, biotite)
0.02
Slow weathering plagioclase feldspars (albite, oligoclase, labradorite), clays (vermiculite, montmorillonite)
0.01
Very slow weathering
K-feldspars, muscovite 0.01
Inert quartz, rutile, zircon 0.004 In the more highly acidic and boiling conditions of the Sobek test, rates of reaction will be higher than those presented by Sverdrup. In such conditions, the rate of reaction of the more reactive non-carbonate minerals (fast, intermediate, and perhaps in some cases, slow weathering), are apparently significantly high enough to account for neutralization potential in addition to the dissolving minerals. Under environmental conditions such as found in waste dumps and tailings impoundments, such extreme conditions do not occur and although silicate dissolution might occur under lower pH conditions, the rate and degree of dissolution and/or alteration will be lower, perhaps by one or two orders of magnitude, than in the Sobek test. The Sobek test clearly, therefore, provides an overestimation of NP availability under actual field conditions. In the majority of cases, the Modified method is accounting for NP from only the most reactive of the non-carbonate minerals which are likely to contribute to acid neutralization under environmental conditions. Sherlock et al (1995) have reviewed the role of carbonates and silicates in acid rock drainage neutralization.
3.2 NP by the Lapakko Method
The procedure recommended by Lapakko is based on the objective of determining NP contributed only by minerals which can neutralize acid at a pH of 6.0 and above, thereby protecting receiving waters from lower pH values. Whereas in theory this objective might provide a more realistic assessment of the neutralizing capacity that can prevent the seepage or run-off of acidic drainage from waste rock piles and tailings impoundments, in practice the measurement of NP at pH 6 is a very time consuming process. This would make the technique
Page 21
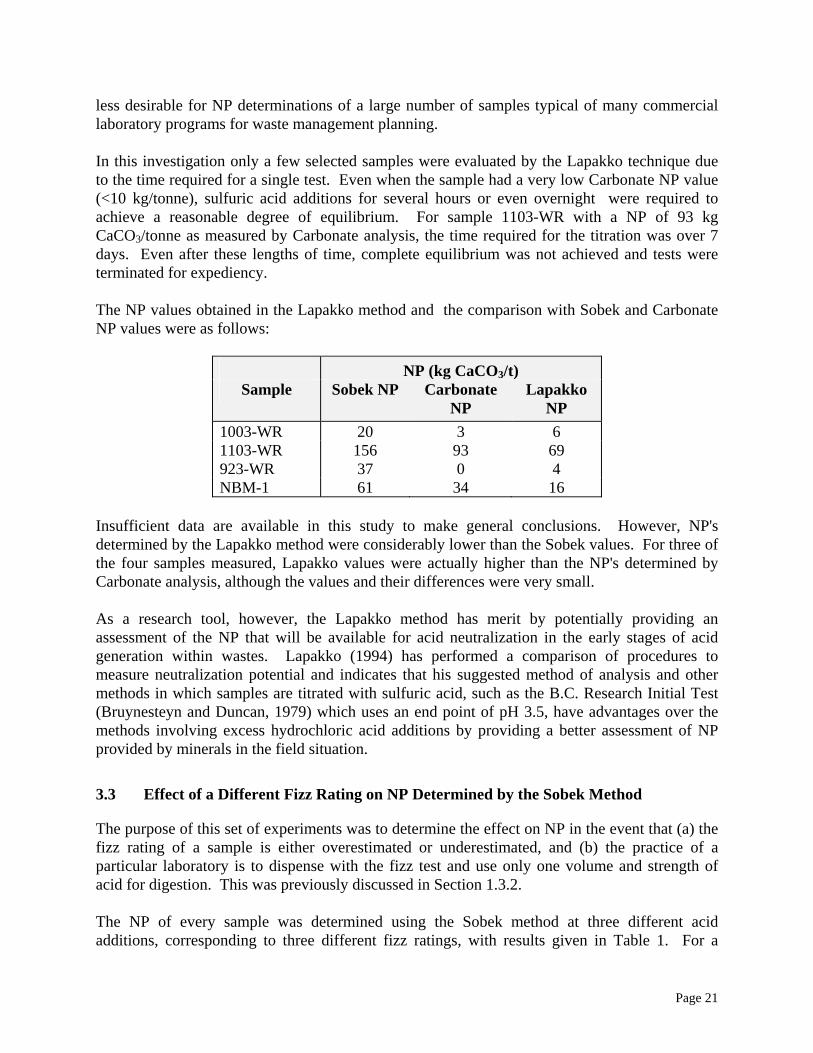
less desirable for NP determinations of a large number of samples typical of many commercial laboratory programs for waste management planning. In this investigation only a few selected samples were evaluated by the Lapakko technique due to the time required for a single test. Even when the sample had a very low Carbonate NP value (<10 kg/tonne), sulfuric acid additions for several hours or even overnight were required to achieve a reasonable degree of equilibrium. For sample 1103-WR with a NP of 93 kg CaCO3/tonne as measured by Carbonate analysis, the time required for the titration was over 7 days. Even after these lengths of time, complete equilibrium was not achieved and tests were terminated for expediency. The NP values obtained in the Lapakko method and the comparison with Sobek and Carbonate NP values were as follows:
NP (kg CaCO3/t) Sample Sobek NP Carbonate
NP Lapakko
NP 1003-WR 20 3 6 1103-WR 156 93 69 923-WR 37 0 4 NBM-1 61 34 16
Insufficient data are available in this study to make general conclusions. However, NP's determined by the Lapakko method were considerably lower than the Sobek values. For three of the four samples measured, Lapakko values were actually higher than the NP's determined by Carbonate analysis, although the values and their differences were very small. As a research tool, however, the Lapakko method has merit by potentially providing an assessment of the NP that will be available for acid neutralization in the early stages of acid generation within wastes. Lapakko (1994) has performed a comparison of procedures to measure neutralization potential and indicates that his suggested method of analysis and other methods in which samples are titrated with sulfuric acid, such as the B.C. Research Initial Test (Bruynesteyn and Duncan, 1979) which uses an end point of pH 3.5, have advantages over the methods involving excess hydrochloric acid additions by providing a better assessment of NP provided by minerals in the field situation.
3.3 Effect of a Different Fizz Rating on NP Determined by the Sobek Method
The purpose of this set of experiments was to determine the effect on NP in the event that (a) the fizz rating of a sample is either overestimated or underestimated, and (b) the practice of a particular laboratory is to dispense with the fizz test and use only one volume and strength of acid for digestion. This was previously discussed in Section 1.3.2. The NP of every sample was determined using the Sobek method at three different acid additions, corresponding to three different fizz ratings, with results given in Table 1. For a
Page 22
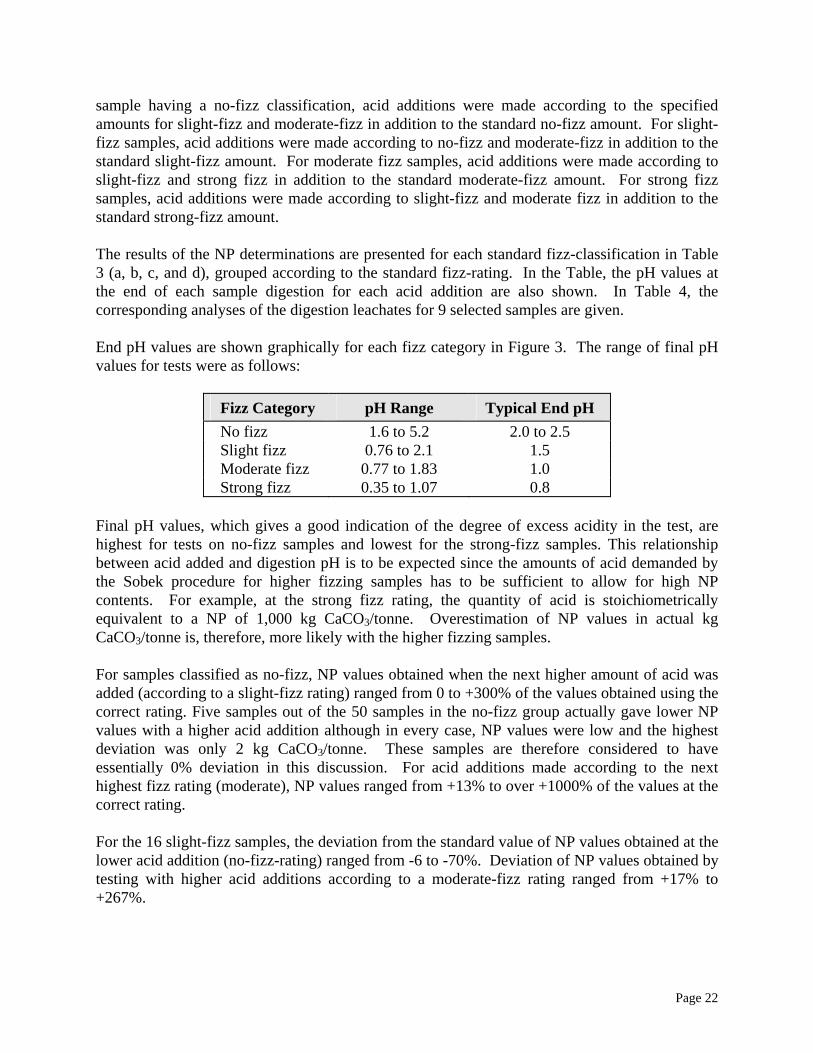
sample having a no-fizz classification, acid additions were made according to the specified amounts for slight-fizz and moderate-fizz in addition to the standard no-fizz amount. For slight-fizz samples, acid additions were made according to no-fizz and moderate-fizz in addition to the standard slight-fizz amount. For moderate fizz samples, acid additions were made according to slight-fizz and strong fizz in addition to the standard moderate-fizz amount. For strong fizz samples, acid additions were made according to slight-fizz and moderate fizz in addition to the standard strong-fizz amount. The results of the NP determinations are presented for each standard fizz-classification in Table 3 (a, b, c, and d), grouped according to the standard fizz-rating. In the Table, the pH values at the end of each sample digestion for each acid addition are also shown. In Table 4, the corresponding analyses of the digestion leachates for 9 selected samples are given. End pH values are shown graphically for each fizz category in Figure 3. The range of final pH values for tests were as follows:
Fizz Category pH Range Typical End pH No fizz 1.6 to 5.2 2.0 to 2.5 Slight fizz 0.76 to 2.1 1.5 Moderate fizz 0.77 to 1.83 1.0 Strong fizz 0.35 to 1.07 0.8
Final pH values, which gives a good indication of the degree of excess acidity in the test, are highest for tests on no-fizz samples and lowest for the strong-fizz samples. This relationship between acid added and digestion pH is to be expected since the amounts of acid demanded by the Sobek procedure for higher fizzing samples has to be sufficient to allow for high NP contents. For example, at the strong fizz rating, the quantity of acid is stoichiometrically equivalent to a NP of 1,000 kg CaCO3/tonne. Overestimation of NP values in actual kg CaCO3/tonne is, therefore, more likely with the higher fizzing samples. For samples classified as no-fizz, NP values obtained when the next higher amount of acid was added (according to a slight-fizz rating) ranged from 0 to +300% of the values obtained using the correct rating. Five samples out of the 50 samples in the no-fizz group actually gave lower NP values with a higher acid addition although in every case, NP values were low and the highest deviation was only 2 kg CaCO3/tonne. These samples are therefore considered to have essentially 0% deviation in this discussion. For acid additions made according to the next highest fizz rating (moderate), NP values ranged from +13% to over +1000% of the values at the correct rating. For the 16 slight-fizz samples, the deviation from the standard value of NP values obtained at the lower acid addition (no-fizz-rating) ranged from -6 to -70%. Deviation of NP values obtained by testing with higher acid additions according to a moderate-fizz rating ranged from +17% to +267%.
Page 23
28 samples were classified as moderate-fizz. The deviation of NP from the standard NP value when tested at the lower acid addition (slight-fizz rating) ranged from 0 to -73%. Deviations from standard NP when tested at a higher acid addition (strong-fizz rating) ranged from +0 to +123%. For the 25 samples rated as strong-fizz, additional NP determinations were made at two lower levels of acid addition. At the first lower level of acid addition (moderate-fizz rating), deviations of NP from the standard NP ranged from -2 to -53%. Deviations were greater when samples were tested at acid additions corresponding to the slight-fizz rating, ranging from -23 to -60%. The analyses of digestion leachates for 9 samples, given in Table 4, show that for all but one sample, the amount of aluminum, magnesium, sodium, potassium and iron leached during sample digestion , increased with increasing acid addition in the digestion (increasing fizz category). In all cases, however, the amount of calcium leached did not increase significantly with increasing acid addition. In Figure 4, the amounts of the cations leached are plotted against the corresponding NP values. These results show clearly that the increasing amounts of the leached silicate mineral cations, Al, Fe, K, and Mg, are directly related to an increase in the NP values. Figure 5 (a, b, c and d) show correlations of NP determined by the Modified and Carbonate methods with the values obtained when using the Sobek procedure at higher and lower acid additions/fizz ratings. The graphs, which may be compared with the correlations shown in Figure 1 for the standard acid addition in the Sobek procedure, show that the deviations of values at the higher acid additions are particularly significant at lower NP values. Values of NP obtained by conducting the Sobek test under reduced conditions of acidity (lower fizz rating) are more closely related to the values obtained by the Modified and Carbonate methods. These graphs again confirm the risk of overestimating NP under high acid conditions which can be employed in the Sobek test. The results of this series of tests show that the NP values obtained by using the Sobek procedure are strongly dependent on the quantity of acid added for the digestion. Since the acid added is dependent on the results of the fizz test, the role of the fizz test in the procedure is very significant. It is the experience of the current investigators that the assignment of a fizz rating is often a subjective matter. Different technicians can give a different fizz rating to the same sample. In addition, errors in assigning fizz can easily be made if full attention is not given throughout the fizz testing procedure. Given the demands and distractions of a commercial laboratory environment, errors in assigning fizz will arise. Furthermore, it is known that in some laboratories, fizz testing is not carried out for expediency. Instead, acid additions and normalities are sometimes standardized, usually at the high end of the range corresponding to a strong fizz rating, in the belief that such practices do not effect the values of NP obtained. The impact on NP values by incorrect assessment of a fizz rating or the practice of standardizing acid additions for operating convenience is clearly significant. The implications of these results on Net NP and NP:AP ratio values, used to interpret static test data and for waste management planning, will be discussed in Section 3.4.
Page 24
Although not specifically evaluated in this study, the effect of digestion temperature and duration would also have an effect on the results of an NP determination. In many cases, the effect of these test variables are likely to be significant. For some less reactive silicate minerals, for example, a longer time of reaction could result in a greater degree of reaction and, therefore, a higher apparent NP value. Again, the importance of following a specific test procedure faithfully, or documenting fully the actual conditions of testing, is evident.
3.4 Effect of Method of NP Determination on Net NP and NP:AP Ratio
The results of Net NP and NP:AP Ratio determinations for all samples are shown in Table 2. Since the NP value for every sample has been shown in the preceding results and their analysis to depend significantly on the test method used or on procedural variations within a specific method, the values of Net NP and of the NP:AP ratio will vary accordingly. The significance of the variations are particularly apparent if the regulatory guidelines for different jurisdictions are considered (see Section 1.5). Clearly, if the NP value is significantly overestimated, the Net NP value might change from a positive (acid consuming) value to a negative (acid producing) value if a lower, more realistic value for NP is used in the calculation. Similarly, a NP:AP ratio exceeding a particular guideline value (safe) might change to one less than the guideline value (sample requires further testing or ARD control measures are required) when using a lower value for NP. If samples are classified on the basis of a Net NP or NP:AP ratio value obtained by using an overestimated NP value, protection of the environment could potentially be compromised, particularly if the value exceeds the regulatory requirement or guideline. In such cases, the samples will be classified as "safe" and the proponent of the mining project will likely not be required to do further study on these samples. Wastes might then be disposed of in a manner which in some situations might lead to the formation of ARD. For example, the classification of “safe” for nearly half of the samples having a NP:AP ratio greater than 3 when NP was determined by the standard Sobek method, can be changed to “requiring further testing” if the Modified or Carbonate method was used to determine NP. A similar analysis can be carried out to show a significant number of changes in classification by considering the differences in NP values for other classification criteria. Conversely, if lower NP values are obtained by one method compared with another, or by inadvertently carrying out a procedure differently for one specific method (such as by using a different fizz rating in the Sobek procedure), the Net NP and NP:AP ratio values will be lower. In this case, values might be lower than the regulatory requirement or guideline, with a consequent higher protection of the environment. This would put the onus on proponents to demonstrate that wastes are not "unsafe" or that adequate control measures can be designed to prevent acid generation occurring. In extreme cases, this might add a financial burden to companies for the engineering and construction of ARD control measures and/or in the amount of financial assurance to be provided to ensure compliance to water quality regulations, to the extent that project feasibility is compromised. An analysis of the effect on the NP:AP ratio of carrying out the NP determination using the Sobek procedure at different fizz ratings (Table 3) are shown in Figure 6. The corresponding
Page 25
regression equations are shown on the graphs. It should be recognized that the Net NP and NP:AP ratio values depend significantly on the sulfur (AP) values, so that a large difference in NP values obtained for the same sample might not necessarily affect the classification of the sample as acid generating or consuming. For this study, the AP value of each sample was determined only by measuring total sulfur (see section 2.7.2). The effect on the Net NP and NP:AP ratio by determining AP through sulfur speciation analysis, as specified by the Modified ABA and other procedures, was not carried out and might make a difference in classification in some cases. The following analysis is valid only for the set of samples evaluated in this study. For specific sets of samples from other mines, the results might be different. These results demonstrate that application of a specific criteria for classifying wastes must be done with some caution since the value of a specific sample can vary significantly depending on the NP method used. In many cases, reporting of ABA results does not define the exact conditions of the analysis, particularly when the Sobek method is used. Fizz ratings, the corresponding acid quantities added, and the end pH of the reaction are rarely reported, if ever. These results have shown that serious misinterpretation of ABA data is possible and erroneous conclusions can be drawn.
3.5 Interpretation of Back Titration Curves
For every test carried out using the standard Sobek procedure and the Sobek procedure at higher and lower fizz ratings, the amount of base titrated to obtain pH values in increments from the starting pH up to the end point pH of 7.0 was recorded. These data together with the corresponding titration curves are presented in Appendix III. The X-axes are plotted in milli-equivalents of H2SO4 per gram of sample, converted from the amounts of base added. Since a lesser or greater quantity of the minerals in a sample will be dissolved under the digestion conditions of the NP procedure depending on the amount of acid added, the constituent elements in those minerals will be in solution in lesser or greater amounts at the end of digestion. During the back titration, these metal ions will precipitate within a characteristic pH range for the individual ions present. As precipitation occurs, the solution is temporarily buffered within the pH range and this will be evident from the shape of the titration curve. Inspection of the data show that the profiles of the back titration curves vary significantly. For some samples, the curves show little evidence of inflection points in specific pH ranges, which would be indicative of the relative absence of specific ions causing buffering of pH during their precipitation. In other cases, many curves show such inflection points, indicating that significant concentrations of a particular ion or ions are present in solution. Most commonly, significant precipitation occurs in the pH range 4-4.5, indicative of the presence of aluminum. If this is the case, the dissolution of a silicate mineral would be indicated. Thus, the shape of the titration provides a qualitative assessment of the minerals in a sample which have undergone dissolution during digestion. In many cases, the indication of increasing silicate dissolution with increasing acid addition (corresponding to the use of a higher fizz rating) is clearly evident. In other cases, such evidence is lacking. In other cases, evidence of increasing silicate dissolution might be apparent between,

Page 26
say, tests carried out at low and moderate fizz conditions but no further dissolution is observed when applying strong fizz conditions. If the NP data obtained from the different procedures, particularly comparing standard Sobek NP with Carbonate NP, is matched to the shape of the titration curves, it can be seen that many of the low Carbonate NP samples (samples with a significant amount of non-carbonate minerals contributing to NP) show evidence of increasing silicate dissolution with increasing acid addition. In addition, increasing silicate dissolution can often be matched to the magnitude of the deviation in NP values obtained when different fizz rating are used. Of course, this is a simplistic approach since many samples exhibit complex mineralogy for which clear interpretation of the shape of the curve is not easily performed. However, the analysis can be attempted with little extra effort over the standard procedures and can provide some useful insight to the minerals contributing to the NP value of a particular sample. An example of the back titration curves obtained for sample 105-WR is shown below to illustrate the potential usefulness of considering back titration curves. Sample 105-WR has a moderate-fizz and was, therefore, tested with acid additions corresponding to slight, moderate and strong fizz ratings.
2
3
4
5
6
7
8
0 1 2 3 4
H2SO4 (mg eq/g)
pH
Fizz Category: Slight
2
3
4
5
6
7
8
2 3 4 5 6
H2SO4 (mg eq/g)
pH
Fizz Category: Moderate
2
3
4
5
6
7
8
3 4 5 6 7
H2SO4 (mg eq/g)
pH
Fizz Category: Strong
The difference in the shape of the curves, particularly with respect to the presence and size of an inflection in the curve in the pH range 4 to 5 is evident with a change in the fizz category. At the standard fizz category for this sample (moderate), the presence of aluminum is the leachate is clearly indicated, whereas as the lower fizz category, only a very slight inflection can be noted. A higher amount of aluminum leached under strong-fizz conditions is indicated. Analysis of the leachates shown in Table 4, confirms the increase in the amount of aluminum leached with increasing fizz rating. Comparison of the NP data for this sample obtained by the different methods, including the Sobek tests at different fizz ratings (Table 1), shows that the NP obtained at the lowest fizz category (slight) is in close agreement with the values obtained using the Modified and Carbonate NP methods. NP values obtained at the two higher fizz categories are significantly greater. These results can be summarized as follows:
Sample NP Method NP (kg/t)
Al in Leachate (mg/L)
Page 27
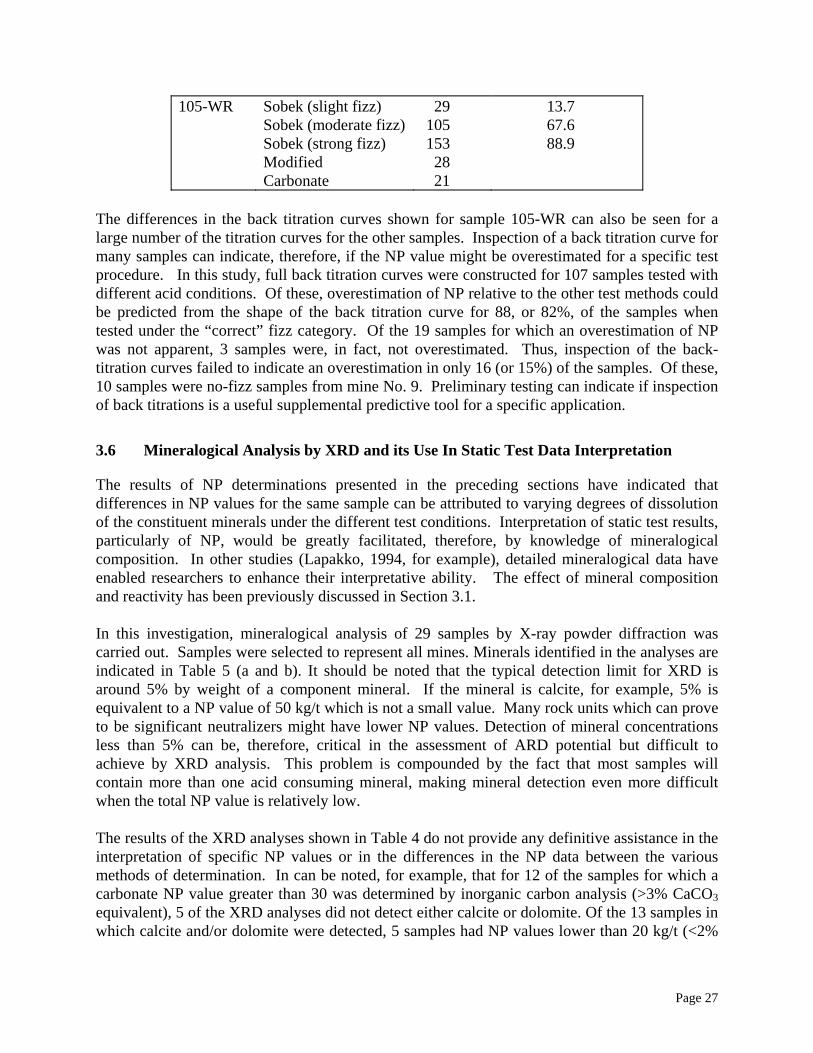
105-WR Sobek (slight fizz) Sobek (moderate fizz) Sobek (strong fizz) Modified Carbonate
29 105 153 28 21
13.7 67.6 88.9
The differences in the back titration curves shown for sample 105-WR can also be seen for a large number of the titration curves for the other samples. Inspection of a back titration curve for many samples can indicate, therefore, if the NP value might be overestimated for a specific test procedure. In this study, full back titration curves were constructed for 107 samples tested with different acid conditions. Of these, overestimation of NP relative to the other test methods could be predicted from the shape of the back titration curve for 88, or 82%, of the samples when tested under the “correct” fizz category. Of the 19 samples for which an overestimation of NP was not apparent, 3 samples were, in fact, not overestimated. Thus, inspection of the back-titration curves failed to indicate an overestimation in only 16 (or 15%) of the samples. Of these, 10 samples were no-fizz samples from mine No. 9. Preliminary testing can indicate if inspection of back titrations is a useful supplemental predictive tool for a specific application.
3.6 Mineralogical Analysis by XRD and its Use In Static Test Data Interpretation
The results of NP determinations presented in the preceding sections have indicated that differences in NP values for the same sample can be attributed to varying degrees of dissolution of the constituent minerals under the different test conditions. Interpretation of static test results, particularly of NP, would be greatly facilitated, therefore, by knowledge of mineralogical composition. In other studies (Lapakko, 1994, for example), detailed mineralogical data have enabled researchers to enhance their interpretative ability. The effect of mineral composition and reactivity has been previously discussed in Section 3.1. In this investigation, mineralogical analysis of 29 samples by X-ray powder diffraction was carried out. Samples were selected to represent all mines. Minerals identified in the analyses are indicated in Table 5 (a and b). It should be noted that the typical detection limit for XRD is around 5% by weight of a component mineral. If the mineral is calcite, for example, 5% is equivalent to a NP value of 50 kg/t which is not a small value. Many rock units which can prove to be significant neutralizers might have lower NP values. Detection of mineral concentrations less than 5% can be, therefore, critical in the assessment of ARD potential but difficult to achieve by XRD analysis. This problem is compounded by the fact that most samples will contain more than one acid consuming mineral, making mineral detection even more difficult when the total NP value is relatively low. The results of the XRD analyses shown in Table 4 do not provide any definitive assistance in the interpretation of specific NP values or in the differences in the NP data between the various methods of determination. In can be noted, for example, that for 12 of the samples for which a carbonate NP value greater than 30 was determined by inorganic carbon analysis (>3% CaCO3 equivalent), 5 of the XRD analyses did not detect either calcite or dolomite. Of the 13 samples in which calcite and/or dolomite were detected, 5 samples had NP values lower than 20 kg/t (<2%
Page 28
CaCO3 equivalent). Furthermore, none of the analyses suggested the presence of the more reactive silicates (see table of reactivities in Section 3.1) such as anorthite, olivine, or diopside. Plagioclase was often identified but specific minerals of the plagioclase series were not distinguished. The end-members albite and anorthite exhibit significantly different reactivities. The additional problem of providing a definitive composition by weight of the minerals using XRD make this technique of limited value for making sharp distinctions in the interpretation of NP data. Microscopic techniques, such as thin section or reflected light, together with visual examination by experienced geologists are probably of much greater value as an aid to the interpretation of NP data. Given the importance of understanding the mineralogy of the lithological groups and waste management units of a specific orebody, the input of the geologist in the initial sampling program for a waste characterization study and in the interpretation of results is strongly recommended.
3.7 Calculation of Mineralogy and NP from Whole Rock Chemistry
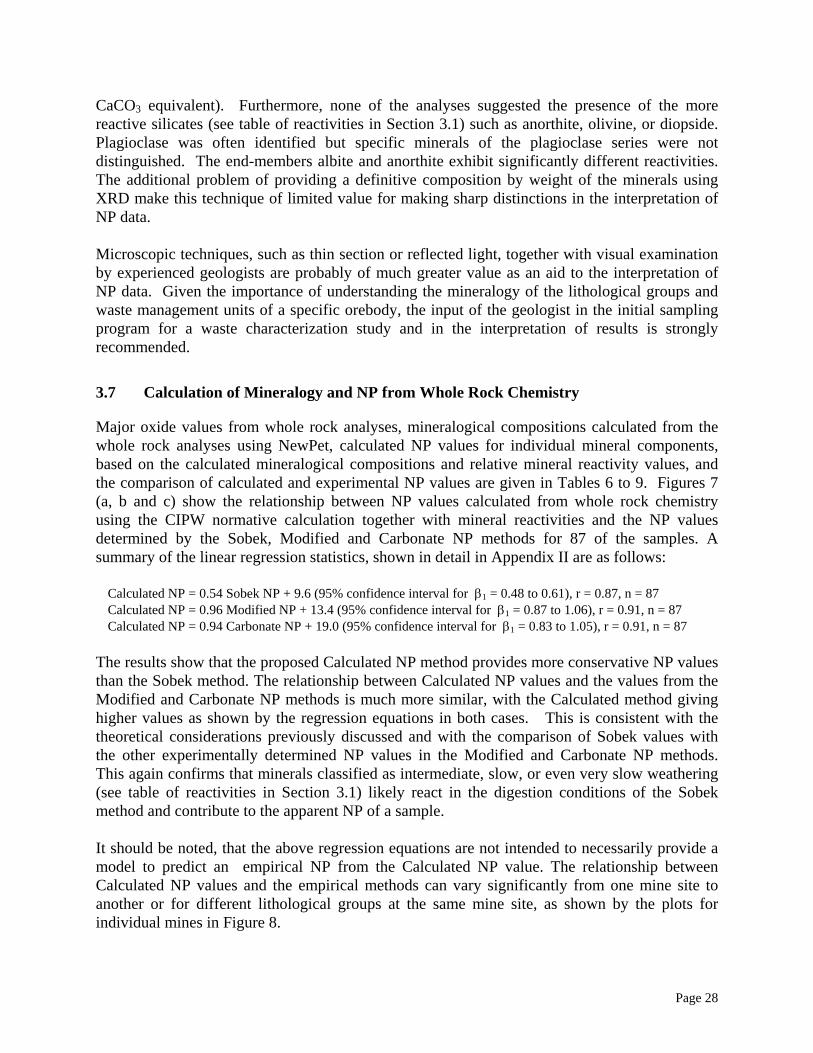
Major oxide values from whole rock analyses, mineralogical compositions calculated from the whole rock analyses using NewPet, calculated NP values for individual mineral components, based on the calculated mineralogical compositions and relative mineral reactivity values, and the comparison of calculated and experimental NP values are given in Tables 6 to 9. Figures 7 (a, b and c) show the relationship between NP values calculated from whole rock chemistry using the CIPW normative calculation together with mineral reactivities and the NP values determined by the Sobek, Modified and Carbonate NP methods for 87 of the samples. A summary of the linear regression statistics, shown in detail in Appendix II are as follows:
Calculated NP = 0.54 Sobek NP + 9.6 (95% confidence interval for β1 = 0.48 to 0.61), r = 0.87, n = 87 Calculated NP = 0.96 Modified NP + 13.4 (95% confidence interval for β1 = 0.87 to 1.06), r = 0.91, n = 87 Calculated NP = 0.94 Carbonate NP + 19.0 (95% confidence interval for β1 = 0.83 to 1.05), r = 0.91, n = 87
The results show that the proposed Calculated NP method provides more conservative NP values than the Sobek method. The relationship between Calculated NP values and the values from the Modified and Carbonate NP methods is much more similar, with the Calculated method giving higher values as shown by the regression equations in both cases. This is consistent with the theoretical considerations previously discussed and with the comparison of Sobek values with the other experimentally determined NP values in the Modified and Carbonate NP methods. This again confirms that minerals classified as intermediate, slow, or even very slow weathering (see table of reactivities in Section 3.1) likely react in the digestion conditions of the Sobek method and contribute to the apparent NP of a sample. It should be noted, that the above regression equations are not intended to necessarily provide a model to predict an empirical NP from the Calculated NP value. The relationship between Calculated NP values and the empirical methods can vary significantly from one mine site to another or for different lithological groups at the same mine site, as shown by the plots for individual mines in Figure 8.

Page 29
The calculated mineralogical composition has two components: a direct measurement of the carbonate content from the inorganic carbon analysis; and an indirect approximation of the silicate mineral content from the whole rock chemistry. NP values calculated from the calculated mineralogical compositions are, in the main, dominated by the carbonate NP, due to the relative reactivity of 1 used for calcite. In some cases, however, the contribution of the more reactive silicate minerals to NP can be significant under environmental conditions. This is reflected in the higher NP values obtained by the Modified method relative to the Carbonate NP values. A shortcoming with the use of the CIPW norm for this application is that the list of normative minerals calculated follows a prescribed set of anhydrous end-member formulas of the rock forming and common accessory minerals that would form upon the crystallization of a magma. The procedure, therefore, ignores the effects of geological processes which subsequently might take place. Alteration minerals are not predicted. Instead, the chemical compositions of the alteration minerals, if present, are interpreted as primary minerals which are, in many cases, likely to be more reactive than their alteration products in acidic drainage conditions. In such cases, the proposed procedure might predict a higher NP than would actually be available. This could account for the higher Calculated NP’s relative to Modified NP’s found in this study. For example, the XRD analyses indicate that a high number of the samples tested contain varying quantities of chlorite, a low reactivity alteration mineral, which is not accounted for in the proposed procedure. A more conservative estimation of NP is to be preferred since values of the ratio of NP to AP, used in the initial classification of wastes, will be correspondingly lower and the receiving environment will be more protected. Users of the procedure must, therefore, be sure to become familiar with mineralogical assessments for the lithological groups under test to determine if an overestimation of NP is being calculated. Improvements to the proposed procedure could improve the reliability of the techniques the confidence in its use. For application at a particular mining project, customized modifications of the CIPW procedure to match actual rock chemistry with identified mineral components in defined lithological groups or waste management units, would provide mining operators with a rapid tool for classifying wastes to match disposal options. Further refinement of the values used for the relative reactivities of minerals is also recommended to improve calculation of the NP value from the predicted mineralogical composition. Use of the Calculated NP procedure is not recommended as the primary method of NP determination for mine wastes. Although a very close correlation between Calculated NP values and practical NP values determined experimentally using methods such as the Modified ABA procedure has been demonstrated for many samples from specific mine locations, not all samples will necessarily provide such good correlation. Application of the procedure might, however, be very useful as a routine and lower cost method for determining NP once the correlation between calculated values and experimental values has been established. For most exploration projects, large number of samples will have already been analyzed by whole rock chemistry as part of the orebody mapping process. These analyses could also form the basis of a program to calculate NP values.
Page 30
Since determination of NP by routine laboratory analysis can be uncertain given the range of values that can be obtained depending on sample mineralogy and the conditions of the method used, the more inherently precise whole rock analysis can be used confidently to calculate a practical NP value. The procedure to calculate NP should, therefore, be used in combination with other tests and analyses in the development of overall waste management plan for a specific mining operation. The successful application of the procedure demonstrated here again highlights the importance of the mineralogical composition of mine wastes in understanding and determining the potential for acid rock drainage at mine sites.
3.8 Acid Base Accounting for the Reference Standard NBM-1
Many workers in the field of ARD prediction testing have discussed for some time the desirability of having reference standards for acid base accounting. In 1994, CANMET, working under the Canadian Certified Reference Materials Project, produced such as standard, designated NBM-1 (Leaver and Bowman, 1994). As part of the standardization of the NBM-1 material, samples were sent to 14 independent laboratories for analysis of both sulfur content and neutralization potential. Values obtained by the laboratories has resulted in the assignment of provisional values of 0.298 % S and a NP of 52 kg CaCO3 /t. It should be noted that prior to the multi-laboratory assessments, the authors of this report received a sample of NBM-1 for preliminary assessment and comment. This preliminary assessment revealed that the determination of NP was very sensitive to the method used for its determination. In addition, initial assessment of a fizz rating for the material was a matter of some dispute. Following discussions with M. Leaver of CANMET, exact instructions on how to carry out the Sobek procedure to determine NP were provided to the 14 laboratories supplied with the material for analysis. The possibility of procedural variations in which the laboratories would carry out the analysis, including interpretation of the fizz rating, was therefore theoretically removed. Even so, variations in the NP results reported by the laboratories were evident (45-60 kg/t) (Leaver and Bowman, 1994). Laboratories were requested to assess the fizz rating. Unanimity was not achieved. In the current investigation, reference standard NBM-1 was analyzed for NP by the standard Sobek procedure, Sobek with lower and higher acid additions (according to lower and higher fizz ratings), the Modified ABA procedure, three additional Modified procedures using different target pH values at the end of digestion, inorganic carbon analysis, and the Lapakko method. In addition, the NP derived from the method of calculating NP from the mineralogical composition (Calculated NP) is included. The results of the NP determinations, together with the corresponding calculated Net NP and NP:AP ratio values based on the sulfur assay assigned to the material, are shown in Table 10. The NP values obtained vary significantly. Using the NP:AP ratio as the criterion for classifying the material, it is clear that the value for the material covers a wide range. With respect to all of the regulatory guidelines for NP:AP ratio discussed in Section 1.5, the NBM-1 material could be classified as either "safe" or "unsafe" by all criteria except that of 1.2:1. Similarly for Net NP, values range from an apparently healthy +85.9 kg/t down to (three samples) lower than 20 kg/t, which is below the "safe" criterion in some jurisdictions

Page 31
The results for this reference material exemplifies clearly all of the concerns expressed in the discussion of the results in the preceding sections and highlights the need for proper documentation and interpretation of the results of NP determinations . Use of standard or reference materials to calibrate or check on NP determination procedures should, therefore, be done with great caution. The considerable variation in the NP values obtained for the NBM-1 sample does not, however, necessarily preclude the use of reference materials. If the range of NP values for the reference material is known for different test procedures, then the NP results provided for a set of samples, including the reference material, by a particular laboratory can be better interpreted, even if the exact conditions of the method used is not clearly specified.

Page 32
4 CONCLUSIONS AND RECOMMENDATIONS FOR STATIC TESTING
A study has been carried out to evaluate static test methods for determining the neutralization potential, NP, of mining waste as part of prediction testing for acid rock drainage. In particular, results of the widely used Sobek method under standard and altered conditions have been assessed and compared with those obtained from the Modified procedure of Lawrence and with those based on the inorganic carbon content (Carbonate NP). The method of Lapakko has also been assessed for selected samples. Special attention has been given to the effect of mineralogical composition in interpreting NP results. A supplemental method to determine NP based on a calculated mineralogical composition and mineral reactivity has been proposed and results compared with the empirical methods of determination. Comparison of the results of NP determinations were carried out due to prior observations that the Sobek method provides an overestimation of NP. Secondly, the reporting of the results of NP determinations found in many reports and mine permit submissions often do not include a full description of methods used or a complete set of the data measured. Consequently, proper interpretation of the results and the possible degree of overestimation, if it exists, cannot be assessed if variations in procedure are inadvertently used or if the test laboratory carries out undocumented variations in a particular procedure. Whatever test is used for NP determinations, therefore, it is very important that the actual conditions used are properly documented to allow a proper interpretation of the results. 112 waste rock and tailings samples from 12 operating or proposed mines in 5 countries were used in the study. In addition, 8 certified reference standard materials were supplied by CANMET for evaluation. One of these reference materials has been recently produced for the calibration and verification of static test procedures. The standard Sobek procedure requires that the quantity of acid, designated by a specific normality and volume, added to digest a sample is determined by observing in a preliminary test the degree of visual and/or audible fizz upon the addition of hydrochloric acid to the sample (the fizz test). Samples are correspondingly rated as having no fizz, slight fizz, moderate fizz or strong fizz and the quantity of acid is added accordingly for the digestion stage. The digestion is carried out under boiling conditions. Previous experience in the testing of a very large number of samples over a number of years has shown that, in many cases, the fizz rating of a sample is a subjective matter. Acid additions, therefore, can be different for different technicians in the same laboratory or between technicians in different laboratories. The effect of applying a different fizz rating has been assessed for all samples in this study. The results of NP values obtained by carrying out the Sobek using the acid addition corresponding to the best assessment of the actual fizz rating were compared with the NP values obtained by Modified and Carbonate NP procedures. In the Modified method, an ambient temperature digestion procedure is used in which the acid addition is selected to achieve a pH at the end of the digestion within a specified range for all samples. The Carbonate NP method is based on the analysis of the inorganic carbon content of a sample and expressing the analysis can
Page 33
be expressed in units of CaCO3 equivalents. The Carbonate method, therefore, provides a NP value based only on the readily available carbonate minerals for acid neutralization in the material. In theory, the Modified method provides an accounting of the most reactive non-carbonate minerals in addition to the carbonate minerals. With the exception of 4 very low-NP samples, the Sobek method performed using the standard fizz rating gave significantly higher NP values than the Modified and Carbonate NP methods. Statistical analysis of the entire data set provided linear regression equations of Modified NP = 0.51 Sobek NP - 1.7, Carbonate NP = 0.49 Sobek NP - 5.0 and Carbonate NP = 0.95 Modified NP - 3.4. Data for samples from individual mine sites indicate that the relationship between the NP values by the methods can vary significantly from these models, although for all 12 mines, the Sobek method overestimates NP relative to the other methods. For 9 of the individual mine data sets, Modified NP values are significantly higher than Carbonate NP values. These data confirm that under the relatively severe conditions of the Sobek digestion procedure, the rate of reaction of the non-carbonate minerals (fast, intermediate and perhaps, in some cases, slow weathering silicate minerals) is high enough to account for neutralization potential in addition to the relatively high-reactivity carbonate minerals. Such conditions are not found in waste dumps, tailings impoundments or other waste units at mine sites, The Sobek procedure clearly, therefore, overestimates the NP that will actually be available under field conditions. The Modified method provides more conservative NP values relative to the Sobek method, indicating that only the most reactive non-carbonate minerals are accounted for in addition to the carbonate minerals. Values from this procedure can be considered to be of more practical value in assessing available NP in the short and medium term. Carbonate NP values provide an indication of the short term availability of NP only. The results of four tests carried out using the Lapakko procedure gave much lower NP values than the Sobek test. The test, in which samples are titrated with sulfuric acid down to only pH 6.0, certainly provides a better estimate of the short-term availability of the neutralizing capacity of a waste material. However, the test is very time consuming and is not particularly suitable for the routine assessment of large numbers of samples. Tests performed using the Sobek procedure with different acid additions (different fizz ratings) showed that the degree of excess acidity at the end of the digestion stage was greater as the fizz rating was increased from ‘none’ to ‘strong’. The NP values obtained at each fizz rating for all samples show that the NP is strongly dependent on the amount of acid added. When tested at a lower fizz rating, NP values were lower than when tested at the ‘correct’ fizz rating for the majority of samples and corresponded more closely with values form the Modified method. Similarly, when tested at a higher fizz rating, NP values were higher. In many case, the values were significantly higher. The increased reactivity of non-carbonate minerals as samples are tested with an increasing fizz rating was confirmed through the analysis of selected leachates at the end of the digestion stage. Increased acidity in the digestion resulted in increasing amounts of silicate mineral cations, particularly Al, K, Mg and Fe, with corresponding increases in the NP values. It is recommended, therefore, that special care should be taken in assessing the fizz rating and in adding the quantity of acid specified if the Sobek procedure is used. Assessment and interpretation of results can be done with more confidence if the exact conditions of testing are known. It should be standard practice that the fizz rating and the pH at the end of the

Page 34
digestion are included with the test results. The practice of eliminating the fizz test and/or only adding the highest acid quantity specified by the Sobek test, a procedure followed in some laboratories for expediency, should be avoided. Inspection of the titration curves which can readily be plotted for each Sobek or other test in which excess acid is used to digest a sample has been shown to provide a reliable qualitative indicator of whether NP has been overestimated. The dissolution of silicate minerals containing aluminum can be detected by observing the shape of the titration curve which will show an inflection in the curve between pH 4 and 5 as the aluminum precipitates with the addition of base. The use of back titration curves in this study was successful in predicting overestimation of NP in 85% of the Sobek tests conducted under standard conditions. The majority of the samples for which overestimation, relative to the Modified and Carbonate NP methods, was not evident were from one mine. This indicates the importance of establishing the utility of using back titration curves in preliminary tests on specific lithological groups or waste management units. The construction and analysis of the curves represents only an small increment of effort over the standard procedure and can provide useful insight to the NP characteristics of a sample. The significance of the dependence of a NP value on the test method used, or on procedural variations within one test method, is particularly important when considering how the data are used to classify wastes for disposal and in the development of control methods to prevent acidic drainage for potentially acid generating materials. Regulatory agencies who are responsible for issuing permits for mining projects with respect to waste management typically use criteria such as the ratio of NP to AP (neutralization potential to acid potential) to assist them in determining which wastes an be disposed of safely with little or no ARD control measures implemented, and which wastes will require special provision for their disposal. Such provisions include disposal in delineated areas in which drainage can be collected for treatment; underwater disposal to control acid generation; and the need for measures such as covers and seals for permanent control upon mine closure. This study has shown that the wide variations in NP values that can be obtained for the same sample can significantly affect the value of the NP:AP ratio to the extent that the sample can be classified as either ‘safe’ or ‘potentially acid generating’ depending on the NP value used. The implication of this can be very significant. If a sample is classified as ‘safe’ but might not be, the environment is at risk. Conversely, if a sample is classified as ‘potentially acid generating’ but is not, then project viability might be at risk due to the additional and often very costly ARD control provisions that a company will have to employ. For example, in this study, nearly half the samples which gave a NP:AP ratio greater than 3 when using the Sobek method were found to have a ratio less than 3 if the Modified or Carbonate NP values were used. Considerable variations of the NP:AP ratio were also evident for many samples if NP values for Sobek tests conducted with different fizz ratings were used. The significance of obtaining different NP:AP ratios for the same sample by using different test procedures should be considered appropriately by regulatory agencies wishing to apply a specific criteria for classifying wastes as acid producing or non-acid producing. In many, if not most, cases, NP:AP criteria have been established on the basis of static tests carried out by the Sobek method. In these cases, some conservatism in setting the criteria might be justified given the tendency for the overestimation of NP. However, in waste characterization programs in which more practical NP values have been determined, the NP:AP criteria for classification can be set

Page 35
at a lower value. In some cases, mining companies using a more realistic NP method, such as the Modified Procedure, could be penalized for reporting lower NP:AP ratios than would be obtained had they used the Sobek method if they are required to conform to a more conservative classification criterion. The impact of test method on NP and the NP:AP ratio was found to be particularly significant for the sample NBM-1, a reference standard material developed specifically for laboratories to calibrate or check on NP determination procedures. Values of NP ranged from 15.8 kg/t for the Lapakko method to 95.2 kg/t for the Sobek test conducted under high-fizz conditions. With an AP value of 9.3 kg/t, the corresponding range of NP:AP ratios is 1.7 to 10.2. The use of a definitive value of NP for reference materials is, therefore not recommended. However, the value of NP for a reference material obtained by a laboratory using a specific procedure to determine the NP values of a sample set could provide a very useful tool to assist in the interpretation of the values, even if the exact procedure used is not clearly specified. A method of calculating NP based on whole rock chemistry, the use of a CIPW normative procedure, and published relative mineral reactivities has been proposed and evaluated for 87 of the samples used in this study. Despite the theoretical shortcomings evident for this method of determining NP, calculated NP values correlated very well with the two methods, Modified and Carbonate, developed to minimize or prevent the overestimation of NP obtained with the Sobek procedure. The use of the CIPW normative calculation to derive a mineralogical composition does not take into account the effects of geological processes which can affect the mineralogical composition of a lithological group following the original crystallization of a magma. Consequently, alteration minerals are not accounted for and the resulting calculated NP values might have a tendency to be higher than those obtained by the empirical Modified method. However, if a correlation between calculated values and empirical values can be established, the technique has potential to provide a useful and simple routine procedure for many mining operations. That the method relies on the more inherently precise whole rock chemical analysis is seen as an advantage over the use of static tests which have been shown in this study to have an uncertainty factor unless methods used are fully understood, rigorously carried out, and thoroughly documented. Refinements of the techniques are possible to customize the normative procedure to match actual rock chemistry with identified mineral components of defined lithological units. Further refinement of the values used in this study for the relative reactivities of minerals would also be recommended to improve the calculation of NP from the predicted mineralogical composition. In conclusion, this study has shown that the measurement of the neutralization potential of mining wastes is not straightforward. Results can vary widely depending on the conditions of the test used and interpretation of data needs to be carried out in full cognizance of the effect of the test conditions in relation to the sample mineralogy. No single test or analysis can be recommended or relied upon to provide a definitive NP determination. In any waste characterization program, determination of NP and an appreciation of the overall potential for ARD should be made following selection and interpretation of a specific set of tests and analyses. A set of such tests and analyses might need to be site specific. In any case, full consultation with and input from project geologists will be invaluable. Some or all of the following tests and analyses might apply.

Page 36
• Determination of NP using a static test procedure which should be rigorously followed and
fully documented. Output data should include digestion end pH. The Modified ABA procedure provided in Appendix I is preferred. Other test methods, such as Sobek , can also be used as long as the implications of the test conditions on the resulting NP value are considered when interpreting the results. Any deviations from standard procedures must be reported.
• Back titration curves are recommended, particularly in preliminary evaluations, to determine the likelihood of NP overestimation. This supplemental tool is particularly recommended whenever the Sobek procedure is used.
• Inorganic carbon analysis should always be carried out to be able to obtain an assessment of the Carbonate NP and to determine the contribution of Carbonate NP to overall NP as determined by the static test procedure. Carbonate NP provides a good initial assessment of the short term availability of neutralization capacity.
• Whole rock chemistry, including total and ferrous iron, can be carried out to enable a derivation of a Calculated NP based on a calculated mineralogy and relative reactivity of the component minerals. This procedure should be calibrated with the results of static testing and other analyses to ensure applicability at a particular site or for a specific lithological unit.
It should be noted that determination of NP by even the most ideal method does not address the important issue of the rate and extent to which a sample will provide neutralization under environmental conditions. Further testing of samples is usually recommended using kinetic test procedures to determine rate and extent of sulfide mineral oxidation, rate and extent of the depletion of neutralization potential and resulting water quality over a range of conditions which might range from low ionic strength, circumneutral pH solutions to high conductivity and high acidity solutions. If the rate at which acidity is generated, exceeds the rate at which it can be neutralized, ARD conditions can arise even though neutralization minerals are still present in theoretical excess. This study has not addressed the other critical aspect of static testing for acid drainage prediction, namely the determination of the acid potential, AP. Although this is not considered to be as complicated an issue as the neutralization potential, current test methods for AP, the assumptions made in the tests, and the way in which data are interpreted, are subject to similar issues that have been highlighted in this study of NP determination. A similarly rigorous study to evaluate methods of AP determination would be valuable.
Page 37
5 REFERENCES
Duncan, D.W. and Bruynesteyn, A. Determination of the acid producing potential of waste materials. Met. Soc. of AIME, paper A-79-29, 1979.
Clarke, D. NewPet for DOS. Department of Earth Sciences, Centre for Earth Resources Research, Memorial University of Newfoundland, 1993.
Feasby, G. and Jones, R.K. Results of a Workshop on the Rehabilitation of Mine Sites, Toronto, 10 and 11 March, 1994, CANMET Publication, 1994.
Ferguson, K.D. and Erikson, P.M. Will it generate AMD? An overview of methods to predict acid mine drainage. Proc. Acid Mine Drainage Workshop, Halifax, Nova Scotia, March 23-26, Environment Canada, 1987.
Kwong, J. Prediction and prevention of acid rock drainage from a geological and mineralogical perspective. MEND Project 1.32.1, CANMET, Ottawa, October, 1993.
Lapakko, K. Evaluation of neutralization potential determinations for metal mine waste and a proposed alternative. Proceedings of the International Land Reclamation and Mine Drainage Conference, Pittsburgh, April 24-29, USBM SP 06A-94, Vol. 1, 129-137, 1994.
Lapakko, K. and Lawrence, R.W. Modification of the Net Acid Production (NAP) Test. Proc. BC Mine Reclamation Symposium, Port Hardy, B.C., 145-159, 1993.
Lawrence, R.W. and Marchant, P.B. Acid Rock Drainage Prediction Manual. A manual of chemical evaluation procedures for the prediction of acid generation from mine wastes. MEND Project 1.16.1b, CANMET, Ottawa, 1989.
Lawrence, R.W. Prediction of the behaviour of mining and processing wastes in the environment. In: Doyle FM (ed). Western regional symposium on mining and mineral processing wastes, Littleton, CO:AIME/SME Publication, pp. 115-121, 1990.
Lawrence, R.W., Marchant, P.B. and Poling, G.W. Investigation of prediction techniques for acid mine drainage. MEND Project 1.16.1a. CANMET, Ottawa, 1989.
Leaver, M.E. and Bowman, W.S., Inter-laboratory Measurement Program For The Standard ARD Material NBM-1, Mineral Sciences Laboratories, Division Report MSL 94-28 (CR), CANMET, July 1994.
Leaver, M.E., Bowman, W.S., Beaudoin, R.P. and McCorkell, R.H., ARD Standard Rock, Mineral Sciences Laboratories, Division Report MSL 94-12 (CR), CANMET, March 1994.
Norecol Environmental Consultants Ltd. New methods for the determination of key mineral species in acid generation prediction by acid base accounting. MEND Project 1.16.1c. CANMET, Ottawa, 1991.
Price W.A. and Errington J, ARD policy for mine sites in British Columbia: Proceedings of the International Land Reclamation and Mine Drainage Conference, Pittsburgh, April 24-29, USBM SP 06A-94, Vol. 4, 285-293, 1994.
Sherlock, E.J., Lawrence, R.W. and Poulin, P. On the neutralization of acid rock drainage by carbonate and silicate minerals. Environmental Geology, 25 (1), 43-54, 1995.

Page 38
Sobek, A.A., Schuller, W.A., Freeman, J.R. and Smith, R.M. Field and laboratory methods applicable to overburdens and minesoils, EPA-600/2-78-054, U.S. Environmental Protection Agency, Cincinnati, Ohio, 1978.
Sverdrup, H.U. The kinetics of base cation release due to chemical weathering. Lund University Press, Lund, Sweden, 245 pp., 1990.

FIGURES

0
50
100
150
200
250
0 50 100 150 200 250
Sobek NP (kg/t)
Mod
ified
NP
(kg/
t)
0
50
100
150
200
250
0 50 100 150 200 250
Sobek NP (kg/t)
Car
bona
te N
P (k
g/t)
0
50
100
150
200
250
0 50 100 150 200 250
Modified NP (kg/t)
Car
bona
te N
P (k
g/t)
Figure 1 Correlation of NP values determined by Sobek, Modified ABA
and Carbonate Analysis

Mine 3
0
50
100
150
0 50 100 150 200
Sobek NP
Mod
and
Car
bona
te N
P
Mine 6
0
20
40
60
80
100
0 50 100 150
Sobek NPM
od a
nd C
arbo
nate
NP
Mine 9
0
50
100
150
200
0 50 100 150 200 250
Sobek NP
Mod
and
Car
bona
te N
PMine 8
0
20
40
60
80
100
0 50 100 150
Sobek NP
Mod
and
Car
bona
te N
P
Mine 7
0
5
10
15
20
0 5 10 15 20
Sobek NP
Mod
and
Car
bona
te N
P
Mine 12
0
50
100
150
200
0 50 100 150 200 250
Sobek NP
Mod
and
Car
bona
te N
P
Mine 11
0
50
100
150
200
0 50 100 150
Sobek NP
Mod
and
Car
bona
te N
P
Mine 10
0
50
100
150
200
0 50 100 150 200
Sobek NP
Mod
and
Car
bona
te N
P
Modified NPCarbonate NPLinear (Modified NP)Linear (Carbonate NP)
Mine 2
0
20
40
60
80
100
0 50 100 150
Sobek NPM
od a
nd C
arbo
nate
NP
Mine 1
0
20
40
60
80
100
0 50 100 150
Sobek NP
Mod
and
Car
bona
te N
P
Modified NP
Carbonate NP
Linear (Modified NP)
Linear (Carbonate NP)
Mine 4
0
5
10
15
0 5 10 15 20
Sobek NP
Mod
and
Car
bona
te N
P
Mine 4
0
50
100
150
0 50 100 150
Sobek NP
Mod
and
Car
bona
te N
P
Figure 2. Sobek NP vs Modified and Carbonate NP - Individual Mines

0.0
1.0
2.0
3.0
4.0
5.0
0 10 20 30 40Sample Number
0.0
1.0
2.0
3.0
4.0
5.0
0 10 20 30 40Sample Number
(a) No-fizz samples (b) Slight-fizz samples
0.0
1.0
2.0
3.0
4.0
5.0
0 10 20 30 40
Sample Numbe r
0.0
1.0
2.0
3.0
4.0
5.0
0 10 20 30 40
Sample Number
(c) Moderate- fizz samples (d) Strong -fizz samples
Figure 3. pH after digestion for standard Sobek tests
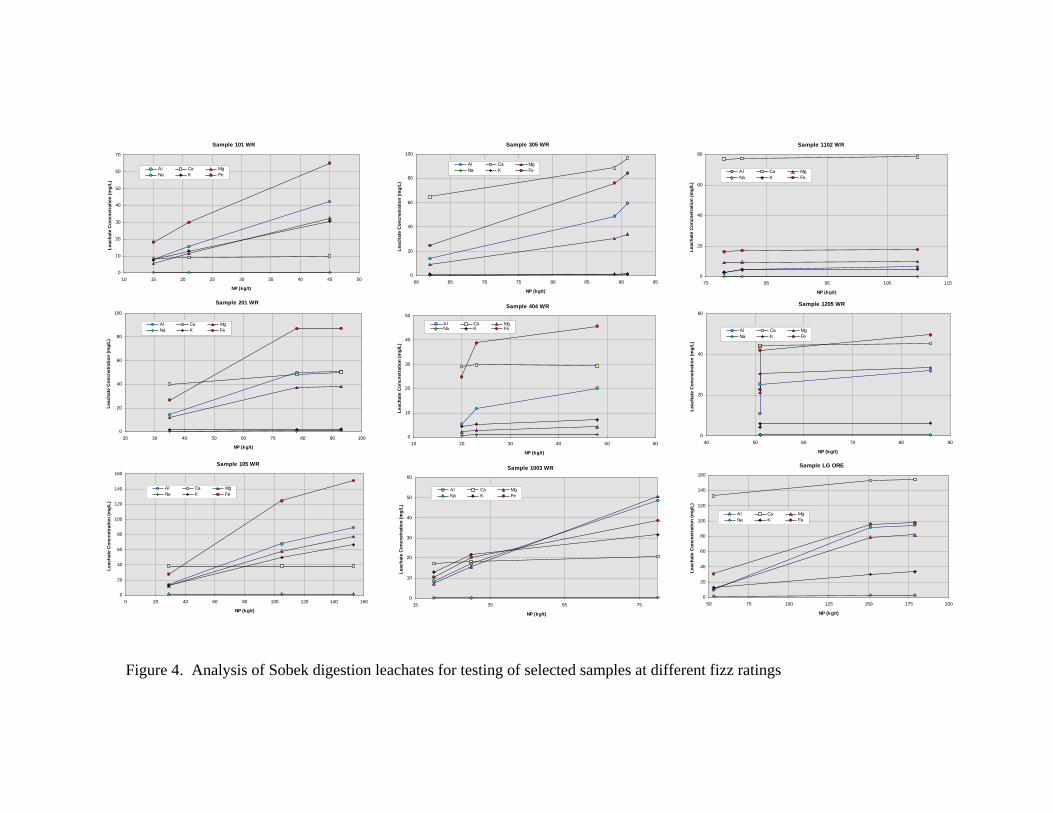
Sample 101 WR
0
10
20
30
40
50
60
70
10 15 20 25 30 35 40 45 50
NP (kg/t)
Leac
hate
Con
cnet
ratio
n (m
g/L)
Al Ca MgNa K Fe
Sample 105 WR
0
20
40
60
80
100
120
140
160
0 20 40 60 80 100 120 140 160
NP (kg/t)
Leac
hate
Con
cnet
ratio
n (m
g/L)
Al Ca MgNa K Fe
Sample 201 WR
0
20
40
60
80
100
20 30 40 50 60 70 80 90 100
NP (kg/t)
Leac
hate
Con
cnet
ratio
n (m
g/L)
Al Ca MgNa K Fe
Sample 305 WR
0
20
40
60
80
100
60 65 70 75 80 85 90 95
NP (kg/t)
Leac
hate
Con
cnet
ratio
n (m
g/L)
Al Ca MgNa K Fe
Sample 404 WR
0
10
20
30
40
50
10 20 30 40 50 60
NP (kg/t)
Leac
hate
Con
cnet
ratio
n (m
g/L)
Al Ca MgNa K Fe
Sample 1003 WR
0
10
20
30
40
50
60
15 35 55 75
NP (kg/t)
Leac
hate
Con
cnet
ratio
n (m
g/L)
Al Ca MgNa K Fe
Sample 1102 WR
0
20
40
60
80
75 85 95 105 115
NP (kg/t)
Leac
hate
Con
cnet
ratio
n (m
g/L)
Al Ca MgNa K Fe
Sample 1205 WR
0
20
40
60
40 50 60 70 80 90
NP (kg/t)
Leac
hate
Con
cnet
ratio
n (m
g/L)
Al Ca MgNa K Fe
Sample LG ORE
0
20
40
60
80
100
120
140
160
50 75 100 125 150 175 200
NP (kg/t)
Leac
hate
Con
cnet
ratio
n (m
g/L)
Al Ca MgNa K Fe
Figure 4. Analysis of Sobek digestion leachates for testing of selected samples at different fizz ratings

0
50
100
150
200
250
0 50 100 150 200 250
Sobek NP (low-fizz)
0
50
100
150
200
250
0 50 100 150 200 250
Sobek NP (high-fizz)
0
50
100
150
200
250
0 50 100 150 200 250
Sobe k NP (low-fizz)
0
50
100
150
200
250
0 50 100 150 200 250
Sobe k NP (high-fizz)
Figure 5. Correlations of NP determined by Modified and Carbonate methods with the Sobek procedure at high and low fizz ratings
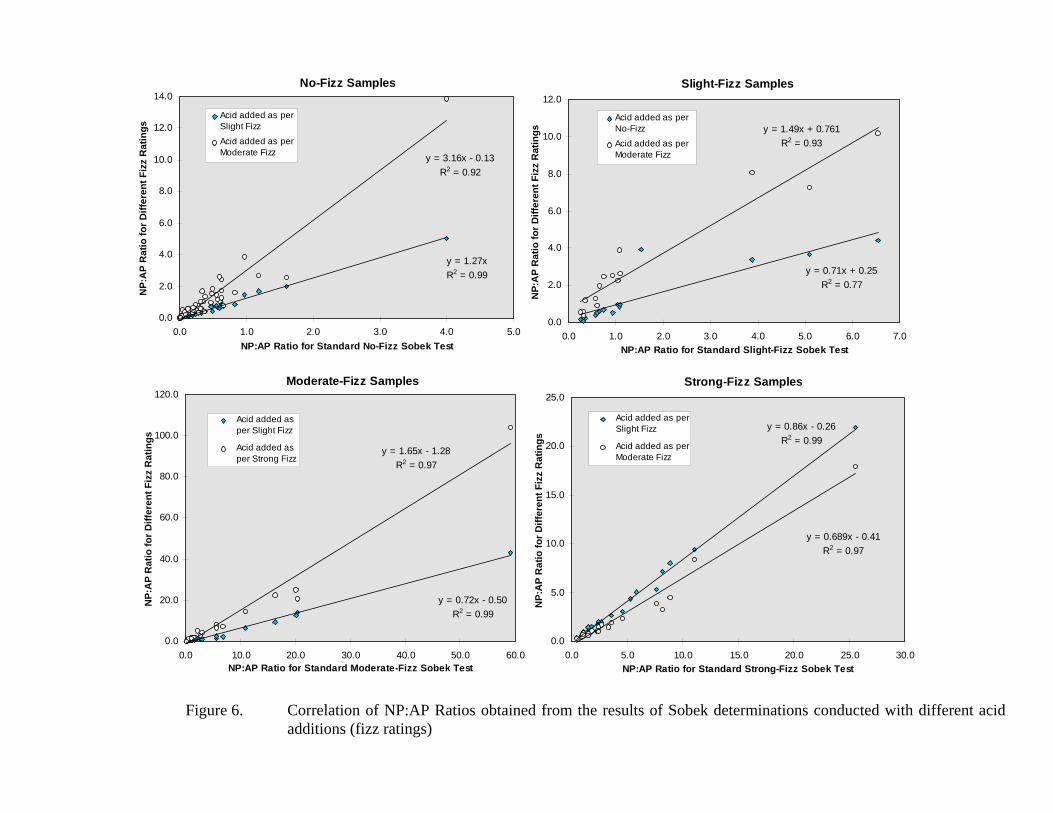
No-Fizz Samples
y = 3.16x - 0.13R2 = 0.92
y = 1.27x R2 = 0.99
0.0
2.0
4.0
6.0
8.0
10.0
12.0
14.0
0.0 1.0 2.0 3.0 4.0 5.0NP:AP Ratio for Standard No-Fizz Sobek Test
NP:
AP
Rat
io fo
r Diff
eren
t Fiz
z R
atin
gs
Acid added as perSlight Fizz
Acid added as perModerate Fizz
Slight-Fizz Samples
y = 0.71x + 0.25R2 = 0.77
y = 1.49x + 0.761R2 = 0.93
0.0
2.0
4.0
6.0
8.0
10.0
12.0
0.0 1.0 2.0 3.0 4.0 5.0 6.0 7.0NP:AP Ratio for Standard Slight-Fizz Sobek Test
NP:
AP
Rat
io fo
r Diff
eren
t Fiz
z R
atin
gs
Acid added as perNo-Fizz
Acid added as perModerate Fizz
Moderate-Fizz Samples
y = 1.65x - 1.28R2 = 0.97
y = 0.72x - 0.50R2 = 0.99
0.0
20.0
40.0
60.0
80.0
100.0
120.0
0.0 10.0 20.0 30.0 40.0 50.0 60.0NP:AP Ratio for Standard Moderate-Fizz Sobek Test
NP:
AP
Rat
io fo
r Diff
eren
t Fiz
z R
atin
gs
Acid added asper Slight Fizz
Acid added asper Strong Fizz
Strong-Fizz Samples
y = 0.689x - 0.41R2 = 0.97
y = 0.86x - 0.26R2 = 0.99
0.0
5.0
10.0
15.0
20.0
25.0
0.0 5.0 10.0 15.0 20.0 25.0 30.0NP:AP Ratio for Standard Strong-Fizz Sobek Test
NP:
AP
Rat
io fo
r Diff
eren
t Fiz
z R
atin
gs
Acid added as perSlight Fizz
Acid added as perModerate Fizz
Figure 6. Correlation of NP:AP Ratios obtained from the results of Sobek determinations conducted with different acid additions (fizz ratings)
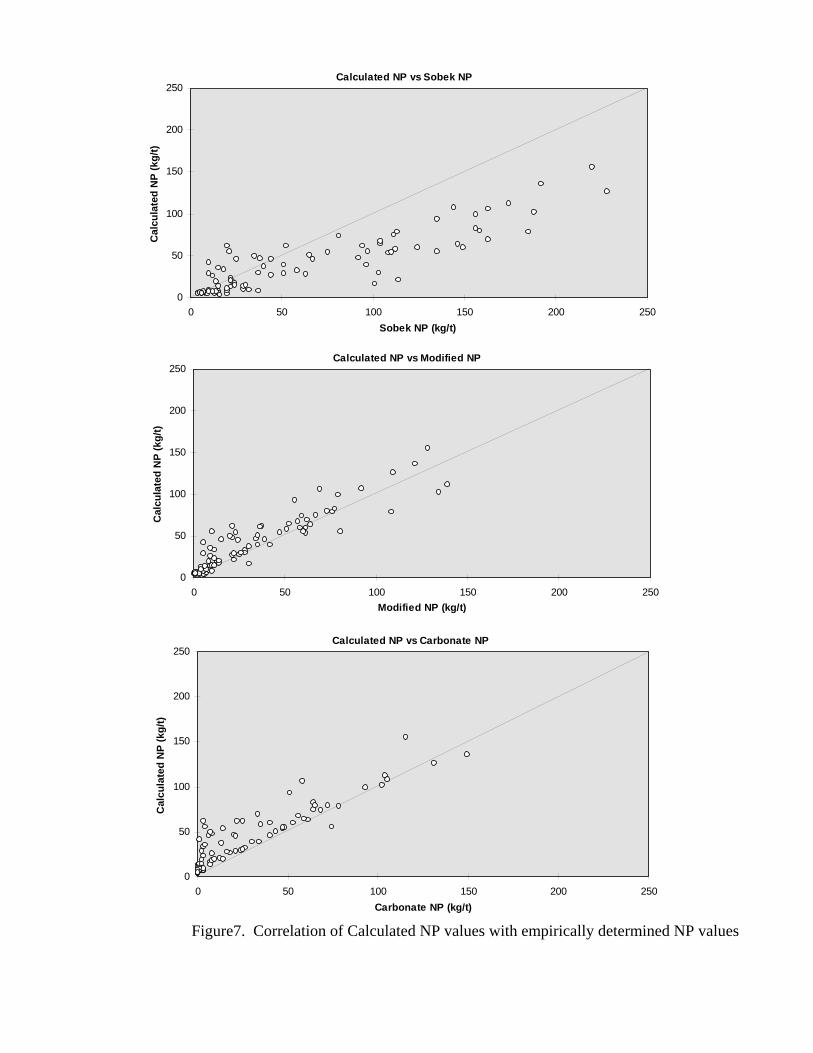
Calculated NP vs Sobek NP
0
50
100
150
200
250
0 50 100 150 200 250Sobek NP (kg/t)
Cal
cula
ted
NP
(kg/
t)
Calculated NP vs Modified NP
0
50
100
150
200
250
0 50 100 150 200 250Modified NP (kg/t)
Cal
cula
ted
NP
(kg/
t)
Calculated NP vs Carbonate NP
0
50
100
150
200
250
0 50 100 150 200 250Carbonate NP (kg/t)
Cal
cula
ted
NP
(kg/
t)
Figure7. Correlation of Calculated NP values with empirically determined NP values

Mine 3
0
20
40
60
80
100
120
140
160
180
0 50 100 150Calculated NP
Expe
rimen
tal N
P
Mine 2
0
20
40
60
80
100
0 20 40 60 80Calculated NP
Expe
rimen
tal N
P
Mine 1
0
20
40
60
80
100
120
0 20 40 60 80Calculated NP
Expe
rimen
tal N
P
Mine 6
0
20
40
60
80
100
120
0 20 40 60 80Calculated NP
Expe
rimen
tal N
P
Mine 5
0
2
4
6
8
1012
14
16
18
20
0 2 4 6 8Calculated NP
Expe
rimen
tal N
PMine 4
0
20
40
60
80
100
120
0 20 40 60 80Calculated NP
Expe
rimen
tal N
P
Mine 9
0
50
100
150
200
250
0 50 100 150 200Calculated NP
Expe
rimen
tal N
PMine 8
0
20
40
60
80
100
120
140
0 20 40 60Calculated NP
Expe
rimen
tal N
P
Mine 7
0
2
4
6
8
10
12
14
16
0 5 10 15Calculated NP
Expe
rimen
tal N
P
Mine 12
0
50
100
150
200
250
0 50 100 150Calculated NP
Expe
rimen
tal N
P
Mine 11
0
20
40
60
80
100
120
140
160
0 50 100 150Calculated NP
Expe
rimen
tal N
P
Mine 10
0
20
40
60
80
100
120
140
160
0 20 40 60 80Calculated NP
Expe
rimen
tal N
P
Sobek NP
Modified NP
Carbonate NP
Figure 8. Empirical NP vs Calculated NP - Individual Mines

TABLES
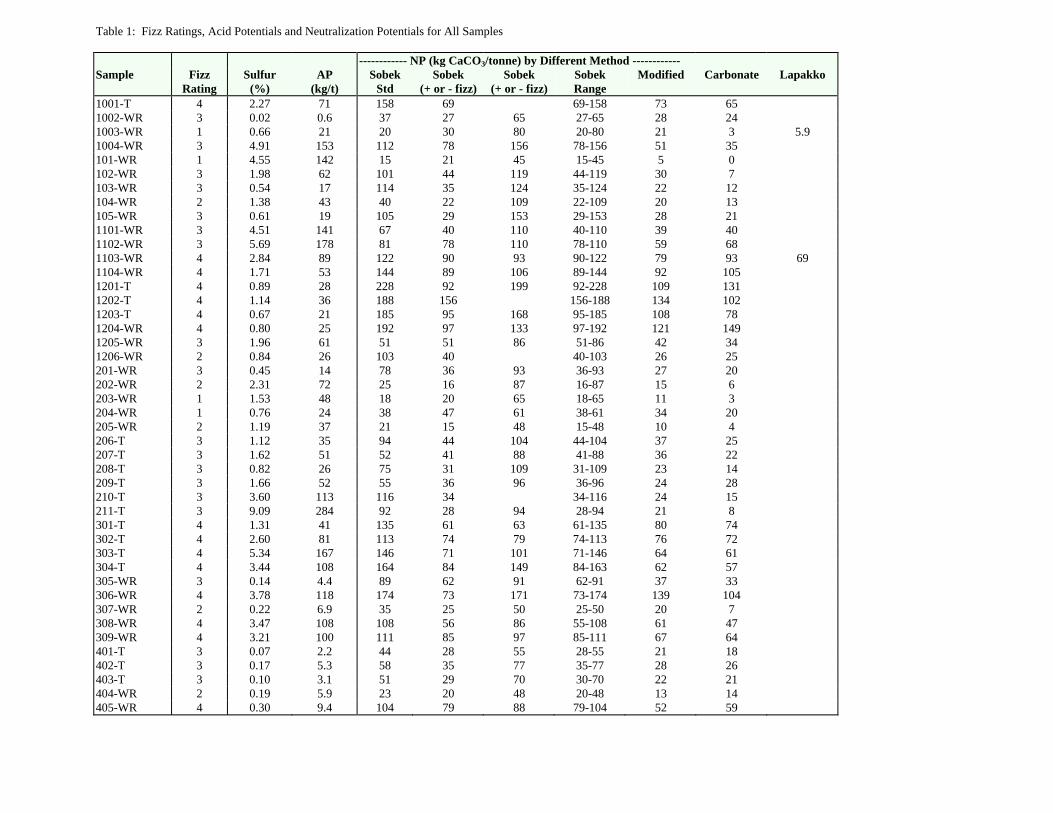
Table 1: Fizz Ratings, Acid Potentials and Neutralization Potentials for All Samples ------------ NP (kg CaCO3/tonne) by Different Method ------------ Sample
Fizz Rating
Sulfur (%)
AP (kg/t)
Sobek Std
Sobek (+ or - fizz)
Sobek (+ or - fizz)
Sobek Range
Modified
Carbonate
Lapakko
1001-T 4 2.27 71 158 69 69-158 73 65 1002-WR 3 0.02 0.6 37 27 65 27-65 28 24 1003-WR 1 0.66 21 20 30 80 20-80 21 3 5.9 1004-WR 3 4.91 153 112 78 156 78-156 51 35 101-WR 1 4.55 142 15 21 45 15-45 5 0 102-WR 3 1.98 62 101 44 119 44-119 30 7 103-WR 3 0.54 17 114 35 124 35-124 22 12 104-WR 2 1.38 43 40 22 109 22-109 20 13 105-WR 3 0.61 19 105 29 153 29-153 28 21 1101-WR 3 4.51 141 67 40 110 40-110 39 40 1102-WR 3 5.69 178 81 78 110 78-110 59 68 1103-WR 4 2.84 89 122 90 93 90-122 79 93 69 1104-WR 4 1.71 53 144 89 106 89-144 92 105 1201-T 4 0.89 28 228 92 199 92-228 109 131 1202-T 4 1.14 36 188 156 156-188 134 102 1203-T 4 0.67 21 185 95 168 95-185 108 78 1204-WR 4 0.80 25 192 97 133 97-192 121 149 1205-WR 3 1.96 61 51 51 86 51-86 42 34 1206-WR 2 0.84 26 103 40 40-103 26 25 201-WR 3 0.45 14 78 36 93 36-93 27 20 202-WR 2 2.31 72 25 16 87 16-87 15 6 203-WR 1 1.53 48 18 20 65 18-65 11 3 204-WR 1 0.76 24 38 47 61 38-61 34 20 205-WR 2 1.19 37 21 15 48 15-48 10 4 206-T 3 1.12 35 94 44 104 44-104 37 25 207-T 3 1.62 51 52 41 88 41-88 36 22 208-T 3 0.82 26 75 31 109 31-109 23 14 209-T 3 1.66 52 55 36 96 36-96 24 28 210-T 3 3.60 113 116 34 34-116 24 15 211-T 3 9.09 284 92 28 94 28-94 21 8 301-T 4 1.31 41 135 61 63 61-135 80 74 302-T 4 2.60 81 113 74 79 74-113 76 72 303-T 4 5.34 167 146 71 101 71-146 64 61 304-T 4 3.44 108 164 84 149 84-163 62 57 305-WR 3 0.14 4.4 89 62 91 62-91 37 33 306-WR 4 3.78 118 174 73 171 73-174 139 104 307-WR 2 0.22 6.9 35 25 50 25-50 20 7 308-WR 4 3.47 108 108 56 86 55-108 61 47 309-WR 4 3.21 100 111 85 97 85-111 67 64 401-T 3 0.07 2.2 44 28 55 28-55 21 18 402-T 3 0.17 5.3 58 35 77 35-77 28 26 403-T 3 0.10 3.1 51 29 70 30-70 22 21 404-WR 2 0.19 5.9 23 20 48 20-48 13 14 405-WR 4 0.30 9.4 104 79 88 79-104 52 59
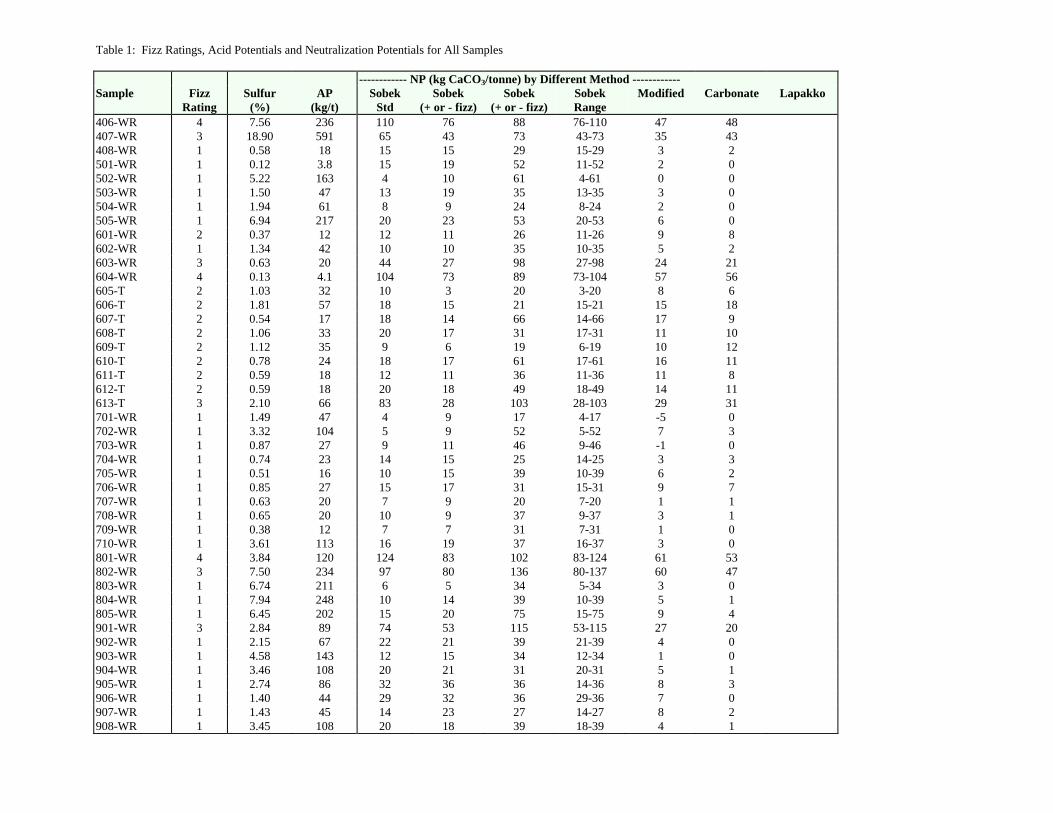
Table 1: Fizz Ratings, Acid Potentials and Neutralization Potentials for All Samples ------------ NP (kg CaCO3/tonne) by Different Method ------------ Sample
Fizz Rating
Sulfur (%)
AP (kg/t)
Sobek Std
Sobek (+ or - fizz)
Sobek (+ or - fizz)
Sobek Range
Modified
Carbonate
Lapakko
406-WR 4 7.56 236 110 76 88 76-110 47 48 407-WR 3 18.90 591 65 43 73 43-73 35 43 408-WR 1 0.58 18 15 15 29 15-29 3 2 501-WR 1 0.12 3.8 15 19 52 11-52 2 0 502-WR 1 5.22 163 4 10 61 4-61 0 0 503-WR 1 1.50 47 13 19 35 13-35 3 0 504-WR 1 1.94 61 8 9 24 8-24 2 0 505-WR 1 6.94 217 20 23 53 20-53 6 0 601-WR 2 0.37 12 12 11 26 11-26 9 8 602-WR 1 1.34 42 10 10 35 10-35 5 2 603-WR 3 0.63 20 44 27 98 27-98 24 21 604-WR 4 0.13 4.1 104 73 89 73-104 57 56 605-T 2 1.03 32 10 3 20 3-20 8 6 606-T 2 1.81 57 18 15 21 15-21 15 18 607-T 2 0.54 17 18 14 66 14-66 17 9 608-T 2 1.06 33 20 17 31 17-31 11 10 609-T 2 1.12 35 9 6 19 6-19 10 12 610-T 2 0.78 24 18 17 61 17-61 16 11 611-T 2 0.59 18 12 11 36 11-36 11 8 612-T 2 0.59 18 20 18 49 18-49 14 11 613-T 3 2.10 66 83 28 103 28-103 29 31 701-WR 1 1.49 47 4 9 17 4-17 -5 0 702-WR 1 3.32 104 5 9 52 5-52 7 3 703-WR 1 0.87 27 9 11 46 9-46 -1 0 704-WR 1 0.74 23 14 15 25 14-25 3 3 705-WR 1 0.51 16 10 15 39 10-39 6 2 706-WR 1 0.85 27 15 17 31 15-31 9 7 707-WR 1 0.63 20 7 9 20 7-20 1 1 708-WR 1 0.65 20 10 9 37 9-37 3 1 709-WR 1 0.38 12 7 7 31 7-31 1 0 710-WR 1 3.61 113 16 19 37 16-37 3 0 801-WR 4 3.84 120 124 83 102 83-124 61 53 802-WR 3 7.50 234 97 80 136 80-137 60 47 803-WR 1 6.74 211 6 5 34 5-34 3 0 804-WR 1 7.94 248 10 14 39 10-39 5 1 805-WR 1 6.45 202 15 20 75 15-75 9 4 901-WR 3 2.84 89 74 53 115 53-115 27 20 902-WR 1 2.15 67 22 21 39 21-39 4 0 903-WR 1 4.58 143 12 15 34 12-34 1 0 904-WR 1 3.46 108 20 21 31 20-31 5 1 905-WR 1 2.74 86 32 36 36 14-36 8 3 906-WR 1 1.40 44 29 32 36 29-36 7 0 907-WR 1 1.43 45 14 23 27 14-27 8 2 908-WR 1 3.45 108 20 18 39 18-39 4 1

Table 1: Fizz Ratings, Acid Potentials and Neutralization Potentials for All Samples ------------ NP (kg CaCO3/tonne) by Different Method ------------ Sample
Fizz Rating
Sulfur (%)
AP (kg/t)
Sobek Std
Sobek (+ or - fizz)
Sobek (+ or - fizz)
Sobek Range
Modified
Carbonate
Lapakko
909-WR 1 3.38 106 29 32 35 29-35 6 1 910-WR 3 2.25 70 120 72 130 72-130 46 40 911-WR 4 1.80 56 135 81 106 81-135 55 51 912-WR 4 2.74 86 156 89 132 89-156 77 64 913-WR 4 2.12 66 156 77 118 77-156 50 39 914-WR 4 1.33 42 149 80 111 80-149 58 40 915-WR 4 1.21 38 220 190 190-220 128 115 916-WR 4 1.15 36 163 84 109 84-163 69 58 917-WR 3 1.31 41 63 44 70 44-70 25 16 918-WR 1 1.22 38 24 33 67 24-67 14 8 919-WR 3 2.85 89 96 56 115 56-115 35 30 920-WR 1 1.46 46 22 34 71 22-71 11 3 921-WR 1 3.57 112 22 31 56 22-56 14 9 922-WR 1 0.81 25 30 43 68 30-68 10 1 923-WR 1 1.90 59 37 44 76 37-76 10 0 4.3 924-WR 1 1.64 51 24 37 50 24-50 11 2 925-WR 1 3.08 96 13 21 53 13-53 6 0 926-WR 1 1.62 51 10 16 34 10-34 1 0 927-WR 1 1.06 33 18 27 49 18-49 8 0 928-WR 1 1.66 52 16 20 55 16-55 8 0 929-WR 1 3.24 101 14 18 47 14-47 5 4 930-WR 1 1.53 48 6 10 27 6-27 1 0 LG-Ore 3 2.98 93 151 53 179 53-179 72 29 CCRMP RTS-4 1 35.90 1122 0 3 6 0-6 0 5 CCRMP CCU-1B 1 34.80 1088 2 3 18 2-18 0 0 CCRMP CH-3 4 2.82 88 210 90 180 90-210 103 122 CCRMP CPB-1 3 17.80 556 40 11 40 11-40 28 3 CCRMP CZN-1 1 30.20 944 10 11 28 10-28 1 6 CCRMP KC-1A 1 27.50 859 8 7 16 7-16 3 2 CCRMP MW-1 1 0.01 0.3 1 4 11 1-11 0 1 CCRMP NBM-1 2 0.30 9.3 61 41 95 41-95 30 34 15.8 CCRMP PC-1 1 6.96 218 5 5 23 5-23 0 1
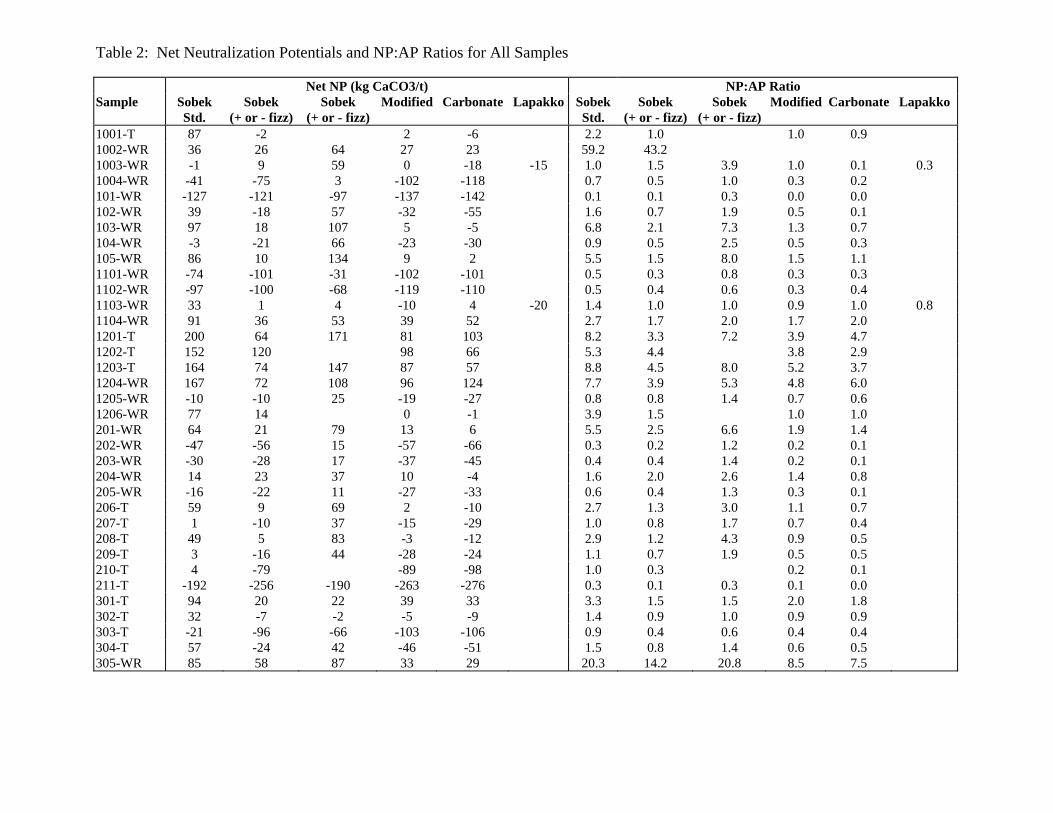
Table 2: Net Neutralization Potentials and NP:AP Ratios for All Samples Net NP (kg CaCO3/t) NP:AP Ratio Sample Sobek
Std. Sobek
(+ or - fizz) Sobek
(+ or - fizz) Modified Carbonate Lapakko Sobek
Std. Sobek
(+ or - fizz)Sobek
(+ or - fizz)Modified Carbonate Lapakko
1001-T 87 -2 2 -6 2.2 1.0 1.0 0.9 1002-WR 36 26 64 27 23 59.2 43.2 1003-WR -1 9 59 0 -18 -15 1.0 1.5 3.9 1.0 0.1 0.3 1004-WR -41 -75 3 -102 -118 0.7 0.5 1.0 0.3 0.2 101-WR -127 -121 -97 -137 -142 0.1 0.1 0.3 0.0 0.0 102-WR 39 -18 57 -32 -55 1.6 0.7 1.9 0.5 0.1 103-WR 97 18 107 5 -5 6.8 2.1 7.3 1.3 0.7 104-WR -3 -21 66 -23 -30 0.9 0.5 2.5 0.5 0.3 105-WR 86 10 134 9 2 5.5 1.5 8.0 1.5 1.1 1101-WR -74 -101 -31 -102 -101 0.5 0.3 0.8 0.3 0.3 1102-WR -97 -100 -68 -119 -110 0.5 0.4 0.6 0.3 0.4 1103-WR 33 1 4 -10 4 -20 1.4 1.0 1.0 0.9 1.0 0.8 1104-WR 91 36 53 39 52 2.7 1.7 2.0 1.7 2.0 1201-T 200 64 171 81 103 8.2 3.3 7.2 3.9 4.7 1202-T 152 120 98 66 5.3 4.4 3.8 2.9 1203-T 164 74 147 87 57 8.8 4.5 8.0 5.2 3.7 1204-WR 167 72 108 96 124 7.7 3.9 5.3 4.8 6.0 1205-WR -10 -10 25 -19 -27 0.8 0.8 1.4 0.7 0.6 1206-WR 77 14 0 -1 3.9 1.5 1.0 1.0 201-WR 64 21 79 13 6 5.5 2.5 6.6 1.9 1.4 202-WR -47 -56 15 -57 -66 0.3 0.2 1.2 0.2 0.1 203-WR -30 -28 17 -37 -45 0.4 0.4 1.4 0.2 0.1 204-WR 14 23 37 10 -4 1.6 2.0 2.6 1.4 0.8 205-WR -16 -22 11 -27 -33 0.6 0.4 1.3 0.3 0.1 206-T 59 9 69 2 -10 2.7 1.3 3.0 1.1 0.7 207-T 1 -10 37 -15 -29 1.0 0.8 1.7 0.7 0.4 208-T 49 5 83 -3 -12 2.9 1.2 4.3 0.9 0.5 209-T 3 -16 44 -28 -24 1.1 0.7 1.9 0.5 0.5 210-T 4 -79 -89 -98 1.0 0.3 0.2 0.1 211-T -192 -256 -190 -263 -276 0.3 0.1 0.3 0.1 0.0 301-T 94 20 22 39 33 3.3 1.5 1.5 2.0 1.8 302-T 32 -7 -2 -5 -9 1.4 0.9 1.0 0.9 0.9 303-T -21 -96 -66 -103 -106 0.9 0.4 0.6 0.4 0.4 304-T 57 -24 42 -46 -51 1.5 0.8 1.4 0.6 0.5 305-WR 85 58 87 33 29 20.3 14.2 20.8 8.5 7.5

Table 2: Net Neutralization Potentials and NP:AP Ratios for All Samples Net NP (kg CaCO3/t) NP:AP Ratio Sample Sobek
Std. Sobek
(+ or - fizz) Sobek
(+ or - fizz) Modified Carbonate Lapakko Sobek
Std. Sobek
(+ or - fizz) Sobek
(+ or - fizz)Modified Carbonate Lapakko
306-WR 56 -45 53 21 -14 1.5 0.6 1.4 1.2 0.9 307-WR 28 18 43 13 0 5.1 3.6 7.3 2.9 1.0 308-WR 0 -52 -22 -47 -61 1.0 0.5 0.8 0.6 0.4 309-WR 11 -15 -3 -33 -36 1.1 0.8 1.0 0.7 0.6 401-T 42 26 53 19 16 20.1 12.8 25.1 9.6 8.2 402-T 53 30 72 23 21 10.9 6.6 14.5 5.3 4.9 403-T 48 26 67 19 18 16.3 9.3 22.4 7.0 6.7 404-WR 17 14 42 7 8 3.9 3.4 8.1 2.2 2.4 405-WR 95 70 79 43 50 11.1 8.4 9.4 5.5 6.3 406-WR -126 -160 -148 -189 -188 0.5 0.3 0.4 0.2 0.2 407-WR -526 -548 -518 -556 -548 0.1 0.1 0.1 0.1 0.1 408-WR -3 -3 11 -15 -16 0.8 0.8 1.6 0.2 0.1 501-WR 11 15 48 -2 -4 4.0 5.1 13.9 0.5 0.0 502-WR -159 -153 -102 -163 -163 0.0 0.1 0.4 0.0 0.0 503-WR -34 -28 -12 -44 -47 0.3 0.4 0.7 0.1 0.0 504-WR -53 -52 -37 -59 -61 0.1 0.1 0.4 0.0 0.0 505-WR -197 -194 -164 -211 -217 0.1 0.1 0.2 0.0 0.0 601-WR 0 -1 14 -3 -4 1.0 1.0 2.2 0.8 0.7 602-WR -32 -32 -7 -37 -40 0.2 0.2 0.8 0.1 0.0 603-WR 24 7 78 4 1 2.2 1.4 5.0 1.2 1.1 604-WR 100 69 85 53 52 25.6 18.0 21.9 14.0 13.8 605-T -22 -29 -12 -24 -26 0.3 0.1 0.6 0.2 0.2 606-T -39 -42 -36 -42 -39 0.3 0.3 0.4 0.3 0.3 607-T 1 -3 49 0 -8 1.1 0.8 3.9 1.0 0.5 608-T -13 -16 -2 -22 -23 0.6 0.5 0.9 0.3 0.3 609-T -26 -29 -16 -25 -23 0.3 0.2 0.5 0.3 0.3 610-T -6 -7 37 -8 -13 0.7 0.7 2.5 0.7 0.5 611-T -6 -7 18 -7 -10 0.7 0.6 2.0 0.6 0.4 612-T 2 0 31 -4 -7 1.1 1.0 2.7 0.8 0.6 613-T 17 -38 37 -37 -35 1.3 0.4 1.6 0.4 0.5 701-WR -43 -38 -30 -52 -47 0.1 0.2 0.4 -0.1 0.0 702-WR -99 -95 -52 -97 -101 0.0 0.1 0.5 0.1 0.0 703-WR -18 -16 19 -28 -27 0.3 0.4 1.7 0.0 0.0 704-WR -9 -8 2 -20 -20 0.6 0.6 1.1 0.1 0.1 705-WR -6 -1 23 -10 -14 0.6 0.9 2.4 0.4 0.1 706-WR -12 -10 4 -18 -20 0.6 0.6 1.2 0.3 0.3

Table 2: Net Neutralization Potentials and NP:AP Ratios for All Samples Net NP (kg CaCO3/t) NP:AP Ratio Sample Sobek
Std. Sobek
(+ or - fizz) Sobek
(+ or - fizz)Modified Carbonate Lapakko Sobek
Std. Sobek
(+ or - fizz)Sobek
(+ or - fizz)Modified Carbonate Lapakko
707-WR -13 -11 0 -19 -19 0.4 0.5 1.0 0.1 0.1 708-WR -10 -11 17 -17 -19 0.5 0.4 1.8 0.1 0.0 709-WR -5 -5 19 -11 -12 0.6 0.6 2.6 0.1 0.0 710-WR -97 -94 -76 -110 -113 0.1 0.2 0.3 0.0 0.0 801-WR 4 -37 -18 -59 -67 1.0 0.7 0.9 0.5 0.4 802-WR -137 -154 -98 -174 -187 0.4 0.3 0.6 0.3 0.2 803-WR -205 -206 -177 -208 -211 0.03 0.02 0.2 0.0 0.0 804-WR -238 -234 -209 -243 -247 0.04 0.1 0.2 0.0 0.0 805-WR -187 -182 -127 -193 -198 0.1 0.1 0.4 0.0 0.0 901-WR -15 -36 26 -62 -69 0.8 0.6 1.3 0.3 0.2 902-WR -45 -46 -28 -63 -67 0.3 0.3 0.6 0.1 0.0 903-WR -131 -128 -109 -142 -143 0.1 0.1 0.2 0.0 0.0 904-WR -88 -87 -77 -103 -107 0.2 0.2 0.3 0.0 0.0 905-WR -54 -50 -50 -78 -83 0.4 0.4 0.4 0.1 0.0 906-WR -15 -12 -8 -37 -44 0.7 0.7 0.8 0.2 0.0 907-WR -31 -22 -18 -37 -43 0.3 0.5 0.6 0.2 0.0 908-WR -88 -90 -69 -104 -107 0.2 0.2 0.4 0.0 0.0 909-WR -77 -74 -71 -100 -105 0.3 0.3 0.3 0.1 0.0 910-WR 50 2 60 -24 -30 1.7 1.0 1.8 0.7 0.6 911-WR 79 25 50 -1 -5 2.4 1.4 1.9 1.0 0.9 912-WR 70 3 46 -9 -22 1.8 1.0 1.5 0.9 0.7 913-WR 90 11 52 -16 -27 2.4 1.2 1.8 0.8 0.6 914-WR 107 38 69 16 -2 3.6 1.9 2.7 1.4 1.0 915-WR 182 152 90 77 5.8 5.0 3.4 3.0 916-WR 127 48 73 33 22 4.5 2.3 3.0 1.9 1.6 917-WR 22 3 29 -16 -25 1.5 1.1 1.7 0.6 0.4 918-WR -14 -5 29 -24 -30 0.6 0.9 1.8 0.4 0.2 919-WR 7 -33 26 -54 -59 1.1 0.6 1.3 0.4 0.3 920-WR -24 -12 25 -35 -43 0.5 0.7 1.6 0.2 0.1 921-WR -90 -81 -56 -98 -103 0.2 0.3 0.5 0.1 0.1 922-WR 5 18 43 -15 -24 1.2 1.7 2.7 0.4 0.0 923-WR -22 -15 17 -49 -59 -55 0.6 0.7 1.3 0.2 0.0 0.1 924-WR -27 -14 -1 -40 -49 0.5 0.7 1.0 0.2 0.0 925-WR -83 -75 -43 -90 -96 0.1 0.2 0.6 0.1 0.0 926-WR -41 -35 -17 -50 -51 0.2 0.3 0.7 0.0 0.0 927-WR -15 -6 16 -25 -33 0.5 0.8 1.5 0.2 0.0
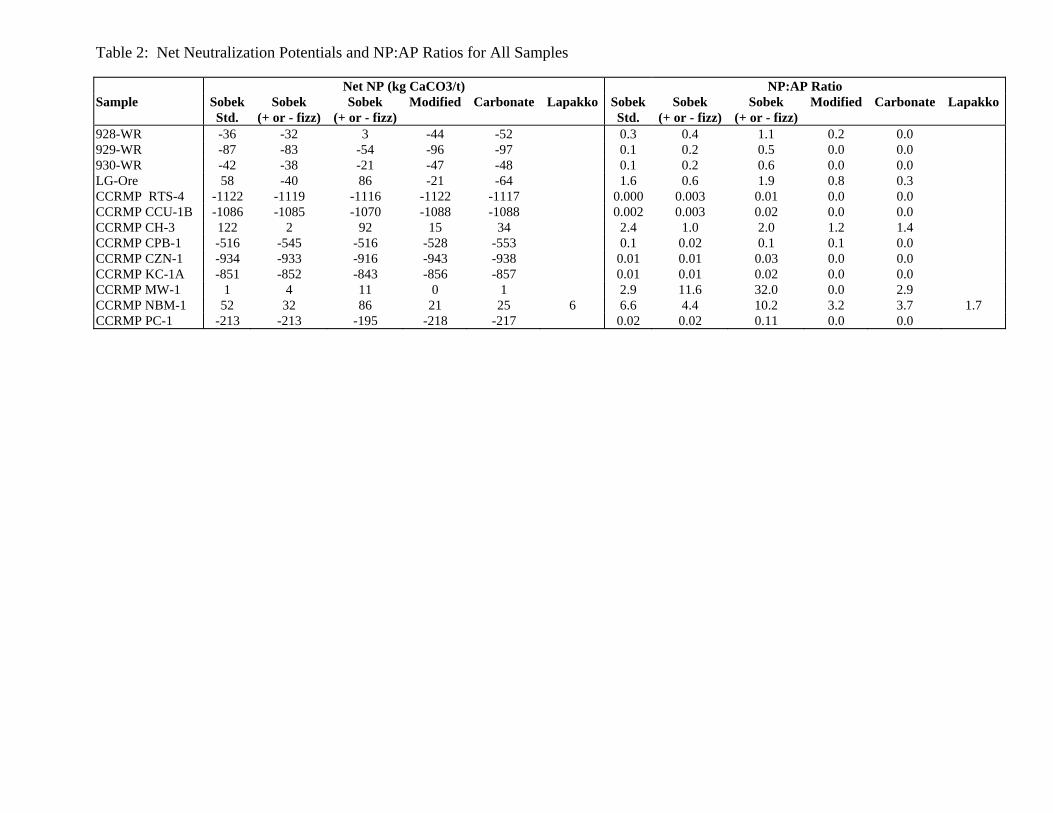
Table 2: Net Neutralization Potentials and NP:AP Ratios for All Samples Net NP (kg CaCO3/t) NP:AP Ratio Sample Sobek
Std. Sobek
(+ or - fizz) Sobek
(+ or - fizz)Modified Carbonate Lapakko Sobek
Std. Sobek
(+ or - fizz)Sobek
(+ or - fizz)Modified Carbonate Lapakko
928-WR -36 -32 3 -44 -52 0.3 0.4 1.1 0.2 0.0 929-WR -87 -83 -54 -96 -97 0.1 0.2 0.5 0.0 0.0 930-WR -42 -38 -21 -47 -48 0.1 0.2 0.6 0.0 0.0 LG-Ore 58 -40 86 -21 -64 1.6 0.6 1.9 0.8 0.3 CCRMP RTS-4 -1122 -1119 -1116 -1122 -1117 0.000 0.003 0.01 0.0 0.0 CCRMP CCU-1B -1086 -1085 -1070 -1088 -1088 0.002 0.003 0.02 0.0 0.0 CCRMP CH-3 122 2 92 15 34 2.4 1.0 2.0 1.2 1.4 CCRMP CPB-1 -516 -545 -516 -528 -553 0.1 0.02 0.1 0.1 0.0 CCRMP CZN-1 -934 -933 -916 -943 -938 0.01 0.01 0.03 0.0 0.0 CCRMP KC-1A -851 -852 -843 -856 -857 0.01 0.01 0.02 0.0 0.0 CCRMP MW-1 1 4 11 0 1 2.9 11.6 32.0 0.0 2.9 CCRMP NBM-1 52 32 86 21 25 6 6.6 4.4 10.2 3.2 3.7 1.7 CCRMP PC-1 -213 -213 -195 -218 -217 0.02 0.02 0.11 0.0 0.0
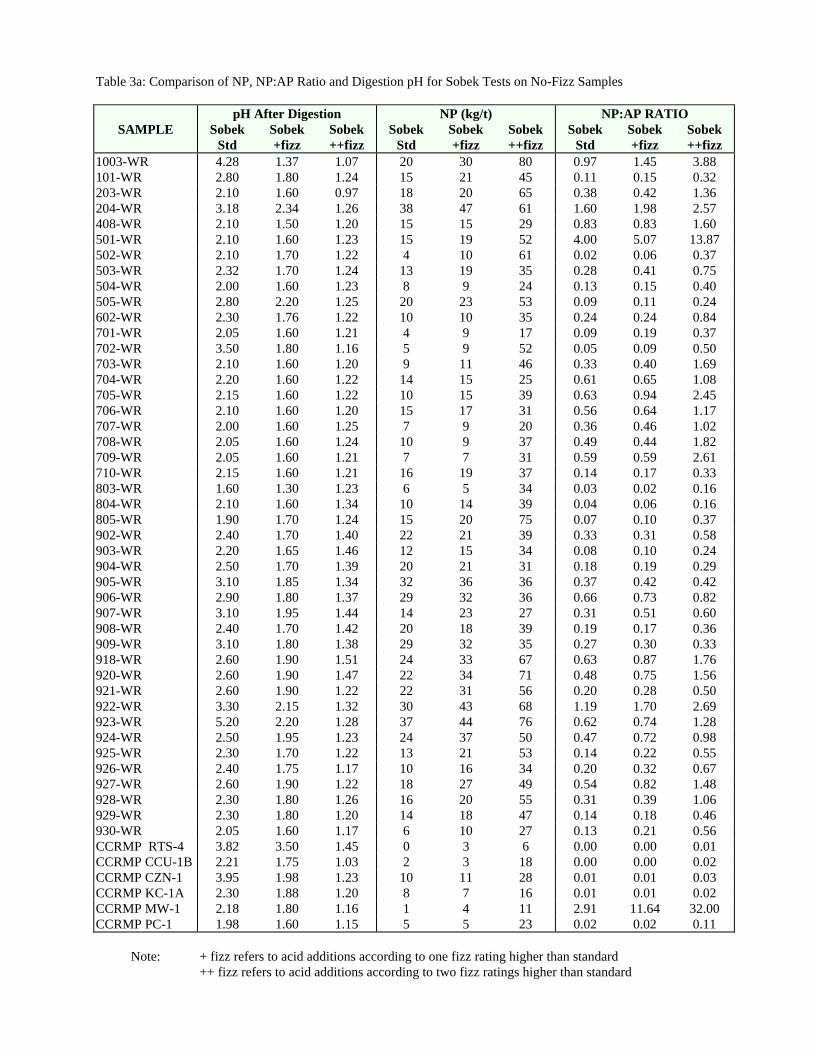
Table 3a: Comparison of NP, NP:AP Ratio and Digestion pH for Sobek Tests on No-Fizz Samples
pH After Digestion NP (kg/t) NP:AP RATIO SAMPLE
Sobek
Std Sobek +fizz
Sobek ++fizz
Sobek Std
Sobek +fizz
Sobek ++fizz
Sobek Std
Sobek +fizz
Sobek ++fizz
1003-WR 4.28 1.37 1.07 20 30 80 0.97 1.45 3.88 101-WR 2.80 1.80 1.24 15 21 45 0.11 0.15 0.32 203-WR 2.10 1.60 0.97 18 20 65 0.38 0.42 1.36 204-WR 3.18 2.34 1.26 38 47 61 1.60 1.98 2.57 408-WR 2.10 1.50 1.20 15 15 29 0.83 0.83 1.60 501-WR 2.10 1.60 1.23 15 19 52 4.00 5.07 13.87 502-WR 2.10 1.70 1.22 4 10 61 0.02 0.06 0.37 503-WR 2.32 1.70 1.24 13 19 35 0.28 0.41 0.75 504-WR 2.00 1.60 1.23 8 9 24 0.13 0.15 0.40 505-WR 2.80 2.20 1.25 20 23 53 0.09 0.11 0.24 602-WR 2.30 1.76 1.22 10 10 35 0.24 0.24 0.84 701-WR 2.05 1.60 1.21 4 9 17 0.09 0.19 0.37 702-WR 3.50 1.80 1.16 5 9 52 0.05 0.09 0.50 703-WR 2.10 1.60 1.20 9 11 46 0.33 0.40 1.69 704-WR 2.20 1.60 1.22 14 15 25 0.61 0.65 1.08 705-WR 2.15 1.60 1.22 10 15 39 0.63 0.94 2.45 706-WR 2.10 1.60 1.20 15 17 31 0.56 0.64 1.17 707-WR 2.00 1.60 1.25 7 9 20 0.36 0.46 1.02 708-WR 2.05 1.60 1.24 10 9 37 0.49 0.44 1.82 709-WR 2.05 1.60 1.21 7 7 31 0.59 0.59 2.61 710-WR 2.15 1.60 1.21 16 19 37 0.14 0.17 0.33 803-WR 1.60 1.30 1.23 6 5 34 0.03 0.02 0.16 804-WR 2.10 1.60 1.34 10 14 39 0.04 0.06 0.16 805-WR 1.90 1.70 1.24 15 20 75 0.07 0.10 0.37 902-WR 2.40 1.70 1.40 22 21 39 0.33 0.31 0.58 903-WR 2.20 1.65 1.46 12 15 34 0.08 0.10 0.24 904-WR 2.50 1.70 1.39 20 21 31 0.18 0.19 0.29 905-WR 3.10 1.85 1.34 32 36 36 0.37 0.42 0.42 906-WR 2.90 1.80 1.37 29 32 36 0.66 0.73 0.82 907-WR 3.10 1.95 1.44 14 23 27 0.31 0.51 0.60 908-WR 2.40 1.70 1.42 20 18 39 0.19 0.17 0.36 909-WR 3.10 1.80 1.38 29 32 35 0.27 0.30 0.33 918-WR 2.60 1.90 1.51 24 33 67 0.63 0.87 1.76 920-WR 2.60 1.90 1.47 22 34 71 0.48 0.75 1.56 921-WR 2.60 1.90 1.22 22 31 56 0.20 0.28 0.50 922-WR 3.30 2.15 1.32 30 43 68 1.19 1.70 2.69 923-WR 5.20 2.20 1.28 37 44 76 0.62 0.74 1.28 924-WR 2.50 1.95 1.23 24 37 50 0.47 0.72 0.98 925-WR 2.30 1.70 1.22 13 21 53 0.14 0.22 0.55 926-WR 2.40 1.75 1.17 10 16 34 0.20 0.32 0.67 927-WR 2.60 1.90 1.22 18 27 49 0.54 0.82 1.48 928-WR 2.30 1.80 1.26 16 20 55 0.31 0.39 1.06 929-WR 2.30 1.80 1.20 14 18 47 0.14 0.18 0.46 930-WR 2.05 1.60 1.17 6 10 27 0.13 0.21 0.56 CCRMP RTS-4 3.82 3.50 1.45 0 3 6 0.00 0.00 0.01 CCRMP CCU-1B 2.21 1.75 1.03 2 3 18 0.00 0.00 0.02 CCRMP CZN-1 3.95 1.98 1.23 10 11 28 0.01 0.01 0.03 CCRMP KC-1A 2.30 1.88 1.20 8 7 16 0.01 0.01 0.02 CCRMP MW-1 2.18 1.80 1.16 1 4 11 2.91 11.64 32.00 CCRMP PC-1 1.98 1.60 1.15 5 5 23 0.02 0.02 0.11
Note: + fizz refers to acid additions according to one fizz rating higher than standard
++ fizz refers to acid additions according to two fizz ratings higher than standard
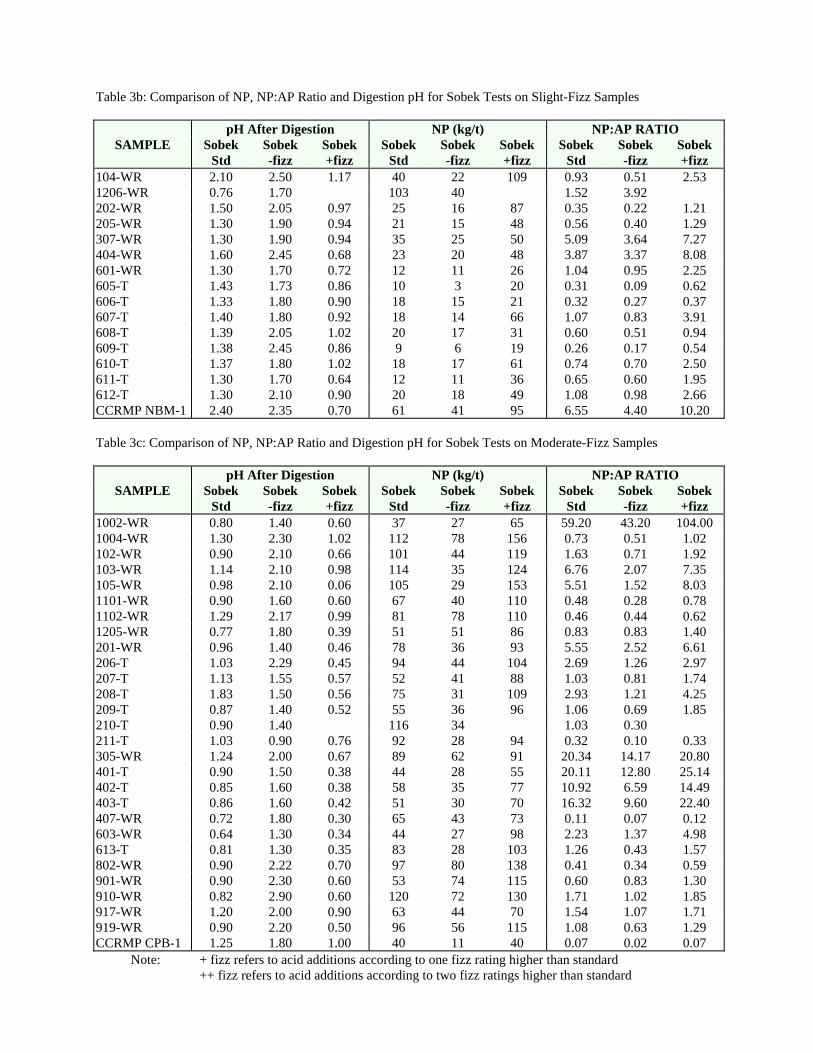
Table 3b: Comparison of NP, NP:AP Ratio and Digestion pH for Sobek Tests on Slight-Fizz Samples
pH After Digestion NP (kg/t) NP:AP RATIO
SAMPLE
Sobek Std
Sobek -fizz
Sobek +fizz
Sobek Std
Sobek -fizz
Sobek +fizz
Sobek Std
Sobek -fizz
Sobek +fizz
104-WR 2.10 2.50 1.17 40 22 109 0.93 0.51 2.53 1206-WR 0.76 1.70 103 40 1.52 3.92 202-WR 1.50 2.05 0.97 25 16 87 0.35 0.22 1.21 205-WR 1.30 1.90 0.94 21 15 48 0.56 0.40 1.29 307-WR 1.30 1.90 0.94 35 25 50 5.09 3.64 7.27 404-WR 1.60 2.45 0.68 23 20 48 3.87 3.37 8.08 601-WR 1.30 1.70 0.72 12 11 26 1.04 0.95 2.25 605-T 1.43 1.73 0.86 10 3 20 0.31 0.09 0.62 606-T 1.33 1.80 0.90 18 15 21 0.32 0.27 0.37 607-T 1.40 1.80 0.92 18 14 66 1.07 0.83 3.91 608-T 1.39 2.05 1.02 20 17 31 0.60 0.51 0.94 609-T 1.38 2.45 0.86 9 6 19 0.26 0.17 0.54 610-T 1.37 1.80 1.02 18 17 61 0.74 0.70 2.50 611-T 1.30 1.70 0.64 12 11 36 0.65 0.60 1.95 612-T 1.30 2.10 0.90 20 18 49 1.08 0.98 2.66 CCRMP NBM-1 2.40 2.35 0.70 61 41 95 6.55 4.40 10.20
Table 3c: Comparison of NP, NP:AP Ratio and Digestion pH for Sobek Tests on Moderate-Fizz Samples
pH After Digestion NP (kg/t) NP:AP RATIO
SAMPLE
Sobek Std
Sobek -fizz
Sobek +fizz
Sobek Std
Sobek -fizz
Sobek +fizz
Sobek Std
Sobek -fizz
Sobek +fizz
1002-WR 0.80 1.40 0.60 37 27 65 59.20 43.20 104.00 1004-WR 1.30 2.30 1.02 112 78 156 0.73 0.51 1.02 102-WR 0.90 2.10 0.66 101 44 119 1.63 0.71 1.92 103-WR 1.14 2.10 0.98 114 35 124 6.76 2.07 7.35 105-WR 0.98 2.10 0.06 105 29 153 5.51 1.52 8.03 1101-WR 0.90 1.60 0.60 67 40 110 0.48 0.28 0.78 1102-WR 1.29 2.17 0.99 81 78 110 0.46 0.44 0.62 1205-WR 0.77 1.80 0.39 51 51 86 0.83 0.83 1.40 201-WR 0.96 1.40 0.46 78 36 93 5.55 2.52 6.61 206-T 1.03 2.29 0.45 94 44 104 2.69 1.26 2.97 207-T 1.13 1.55 0.57 52 41 88 1.03 0.81 1.74 208-T 1.83 1.50 0.56 75 31 109 2.93 1.21 4.25 209-T 0.87 1.40 0.52 55 36 96 1.06 0.69 1.85 210-T 0.90 1.40 116 34 1.03 0.30 211-T 1.03 0.90 0.76 92 28 94 0.32 0.10 0.33 305-WR 1.24 2.00 0.67 89 62 91 20.34 14.17 20.80 401-T 0.90 1.50 0.38 44 28 55 20.11 12.80 25.14 402-T 0.85 1.60 0.38 58 35 77 10.92 6.59 14.49 403-T 0.86 1.60 0.42 51 30 70 16.32 9.60 22.40 407-WR 0.72 1.80 0.30 65 43 73 0.11 0.07 0.12 603-WR 0.64 1.30 0.34 44 27 98 2.23 1.37 4.98 613-T 0.81 1.30 0.35 83 28 103 1.26 0.43 1.57 802-WR 0.90 2.22 0.70 97 80 138 0.41 0.34 0.59 901-WR 0.90 2.30 0.60 53 74 115 0.60 0.83 1.30 910-WR 0.82 2.90 0.60 120 72 130 1.71 1.02 1.85 917-WR 1.20 2.00 0.90 63 44 70 1.54 1.07 1.71 919-WR 0.90 2.20 0.50 96 56 115 1.08 0.63 1.29 CCRMP CPB-1 1.25 1.80 1.00 40 11 40 0.07 0.02 0.07
Note: + fizz refers to acid additions according to one fizz rating higher than standard ++ fizz refers to acid additions according to two fizz ratings higher than standard

Table 3d: Comparison of NP, NP:AP Ratio and Digestion pH for Sobek Tests on Strong-Fizz Samples
pH After Digestion NP (kg/t) NP:AP RATIO
SAMPLE
Sobek Std
Sobek -fizz
Sobek --fizz
Sobek Std
Sobek -fizz
Sobek --fizz
Sobek Std
Sobek -fizz
Sobek --fizz
1001-T 0.70 1.00 158 69 2.23 0.97 1103-WR 1.07 1.37 4.28 156 93 90 1.76 1.05 1.01 1104-WR 1.02 1.35 4.70 144 106 89 2.69 1.98 1.67 1201-T 0.90 1.40 5.10 228 199 92 8.20 7.16 3.31 1202-T 0.53 1.15 188 156 5.28 4.38 1203-T 0.52 0.93 5.04 185 168 95 8.84 8.02 4.54 1204-WR 0.45 0.85 4.90 192 133 97 7.68 5.32 3.88 301-T 0.96 1.35 3.36 135 63 61 3.30 1.54 1.49 302-T 0.89 1.38 3.45 113 78 74 1.39 0.96 0.91 303-T 0.90 1.53 4.74 146 101 71 0.87 0.61 0.43 304-T 0.98 1.44 3.48 163 148 84 1.52 1.38 0.78 306-WR 0.81 1.46 2.40 174 171 73 1.47 1.45 0.62 308-WR 1.05 1.22 3.29 108 86 55 1.00 0.79 0.51 309-WR 0.46 1.13 3.10 111 97 85 1.11 0.97 0.85 405-WR 0.37 0.69 2.22 104 88 79 11.09 9.39 8.43 406-WR 0.35 0.71 2.17 110 88 76 0.47 0.37 0.32 604-WR 0.84 1.21 2.22 104 89 73 25.60 21.91 17.97 801-WR 1.00 1.31 2.50 124 102 83 1.03 0.85 0.69 911-WR 0.60 0.90 2.75 135 106 81 2.40 1.88 1.44 912-WR 0.60 0.90 2.75 156 132 89 1.82 1.54 1.04 913-WR 0.50 0.92 2.95 156 118 77 2.35 1.78 1.16 914-WR 0.90 2.48 6.00 149 111 80 3.58 2.67 1.92 915-WR 0.60 1.00 7.70 220 190 5.82 5.02 916-WR 0.05 0.09 3.07 163 109 84 4.54 3.03 2.34 CCRMP CH-3 0.80 1.40 4.96 210 180 90 2.38 2.04 1.02
Note: + fizz refers to acid additions according to one fizz rating higher than standard
++ fizz refers to acid additions according to two fizz ratings higher than standard
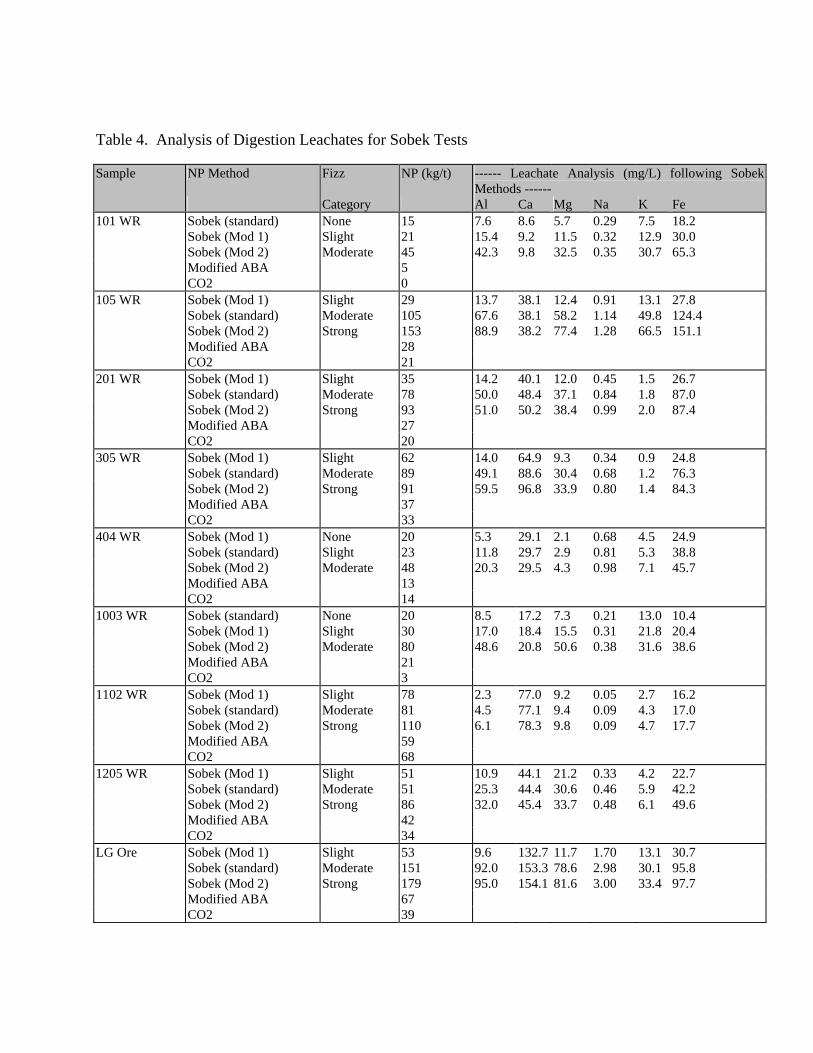
Table 4. Analysis of Digestion Leachates for Sobek Tests Sample NP Method Fizz NP (kg/t) ------ Leachate Analysis (mg/L) following Sobek
Methods ------ Category Al Ca Mg Na K Fe 101 WR Sobek (standard) None 15 7.6 8.6 5.7 0.29 7.5 18.2 Sobek (Mod 1) Slight 21 15.4 9.2 11.5 0.32 12.9 30.0 Sobek (Mod 2) Moderate 45 42.3 9.8 32.5 0.35 30.7 65.3 Modified ABA 5 CO2 0 105 WR Sobek (Mod 1) Slight 29 13.7 38.1 12.4 0.91 13.1 27.8 Sobek (standard) Moderate 105 67.6 38.1 58.2 1.14 49.8 124.4 Sobek (Mod 2) Strong 153 88.9 38.2 77.4 1.28 66.5 151.1 Modified ABA 28 CO2 21 201 WR Sobek (Mod 1) Slight 35 14.2 40.1 12.0 0.45 1.5 26.7 Sobek (standard) Moderate 78 50.0 48.4 37.1 0.84 1.8 87.0 Sobek (Mod 2) Strong 93 51.0 50.2 38.4 0.99 2.0 87.4 Modified ABA 27 CO2 20 305 WR Sobek (Mod 1) Slight 62 14.0 64.9 9.3 0.34 0.9 24.8 Sobek (standard) Moderate 89 49.1 88.6 30.4 0.68 1.2 76.3 Sobek (Mod 2) Strong 91 59.5 96.8 33.9 0.80 1.4 84.3 Modified ABA 37 CO2 33 404 WR Sobek (Mod 1) None 20 5.3 29.1 2.1 0.68 4.5 24.9 Sobek (standard) Slight 23 11.8 29.7 2.9 0.81 5.3 38.8 Sobek (Mod 2) Moderate 48 20.3 29.5 4.3 0.98 7.1 45.7 Modified ABA 13 CO2 14 1003 WR Sobek (standard) None 20 8.5 17.2 7.3 0.21 13.0 10.4 Sobek (Mod 1) Slight 30 17.0 18.4 15.5 0.31 21.8 20.4 Sobek (Mod 2) Moderate 80 48.6 20.8 50.6 0.38 31.6 38.6 Modified ABA 21 CO2 3 1102 WR Sobek (Mod 1) Slight 78 2.3 77.0 9.2 0.05 2.7 16.2 Sobek (standard) Moderate 81 4.5 77.1 9.4 0.09 4.3 17.0 Sobek (Mod 2) Strong 110 6.1 78.3 9.8 0.09 4.7 17.7 Modified ABA 59 CO2 68 1205 WR Sobek (Mod 1) Slight 51 10.9 44.1 21.2 0.33 4.2 22.7 Sobek (standard) Moderate 51 25.3 44.4 30.6 0.46 5.9 42.2 Sobek (Mod 2) Strong 86 32.0 45.4 33.7 0.48 6.1 49.6 Modified ABA 42 CO2 34 LG Ore Sobek (Mod 1) Slight 53 9.6 132.7 11.7 1.70 13.1 30.7 Sobek (standard) Moderate 151 92.0 153.3 78.6 2.98 30.1 95.8 Sobek (Mod 2) Strong 179 95.0 154.1 81.6 3.00 33.4 97.7 Modified ABA 67 CO2 39
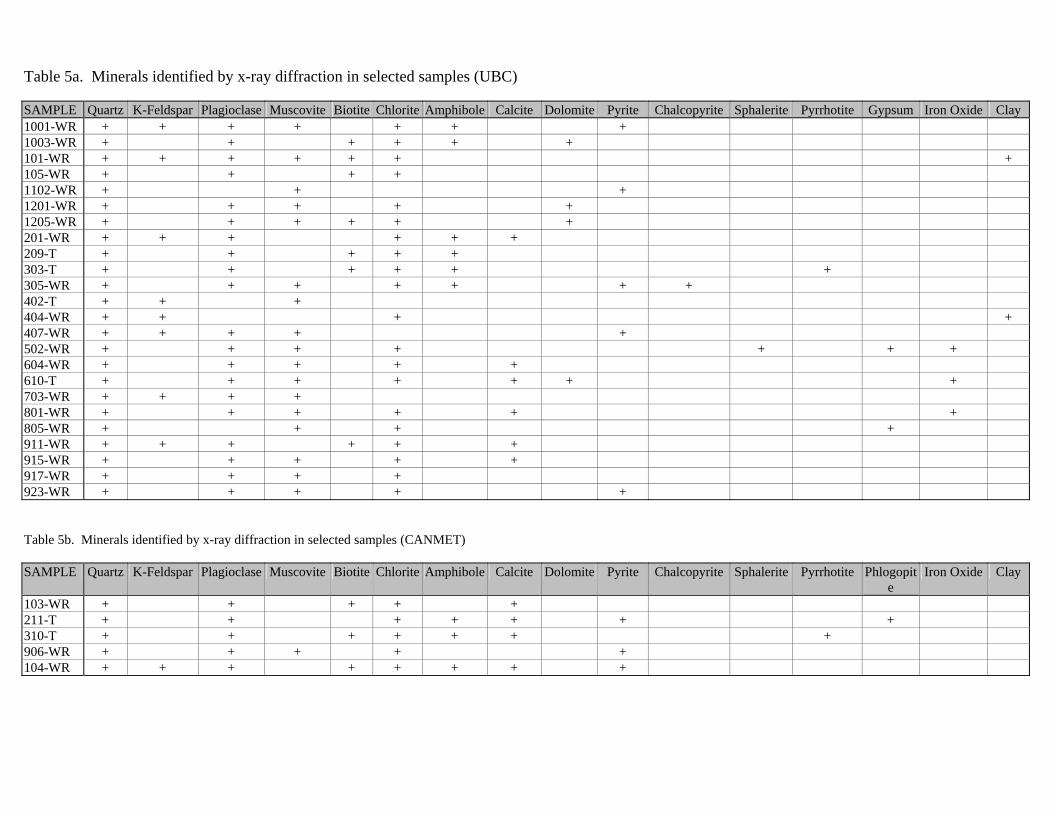
Table 5a. Minerals identified by x-ray diffraction in selected samples (UBC)
SAMPLE Quartz K-Feldspar Plagioclase Muscovite Biotite Chlorite Amphibole Calcite Dolomite Pyrite Chalcopyrite Sphalerite Pyrrhotite Gypsum Iron Oxide Clay 1001-WR + + + + + + + 1003-WR + + + + + + 101-WR + + + + + + + 105-WR + + + + 1102-WR + + + 1201-WR + + + + + 1205-WR + + + + + + 201-WR + + + + + + 209-T + + + + + 303-T + + + + + + 305-WR + + + + + + + 402-T + + + 404-WR + + + + 407-WR + + + + + 502-WR + + + + + + + 604-WR + + + + + 610-T + + + + + + + 703-WR + + + + 801-WR + + + + + + 805-WR + + + + 911-WR + + + + + + 915-WR + + + + + 917-WR + + + + 923-WR + + + + +
Table 5b. Minerals identified by x-ray diffraction in selected samples (CANMET)
SAMPLE Quartz K-Feldspar Plagioclase Muscovite Biotite Chlorite Amphibole Calcite Dolomite Pyrite Chalcopyrite Sphalerite Pyrrhotite Phlogopite
Iron Oxide Clay
103-WR + + + + + 211-T + + + + + + + 310-T + + + + + + + 906-WR + + + + + 104-WR + + + + + + + +

Table 6: Major Oxide Values by Whole Rock Analysis
Sample Silicon Oxide Titanium Oxide Aluminum Oxide Ferric Oxide Ferrous Oxide Manganese Oxide Magnesium Oxide Calcium Oxide Sodium Oxide Potassium Oxide Phosphorus Oxide Carbon Dioxide SiO2 (Wt. %) TiO2 (Wt. %) Al2O3 (Wt. %) Fe2O3 (Wt. %) FeO (Wt. %) MnO (Wt. %) MgO (Wt. %) CaO (Wt. %) Na2O (Wt. %) K2O (Wt. %) P2O5 (Wt. %) CO2 (Wt %) 102-WR 54.95 0.90 16.40 4.10 4.15 0.10 3.28 2.04 2.41 6.77 0.18 0.30 103-WR 51.00 0.94 17.12 3.21 7.00 0.09 6.92 2.29 3.25 4.24 0.19 0.53 104-WR 48.96 0.90 16.03 2.49 6.73 0.11 6.67 3.73 2.71 4.60 0.18 0.56 202-WR 55.51 1.04 13.05 1.56 11.30 0.16 3.89 6.89 1.86 0.93 0.11 0.25 203-WR 55.58 0.47 10.61 1.01 8.00 0.10 11.48 4.41 1.94 0.80 0.13 0.12 204-WR 61.72 0.44 12.14 1.20 4.81 0.08 7.13 4.54 3.20 0.97 0.16 0.89 205-WR 53.37 0.99 13.03 2.54 10.50 0.21 5.03 8.49 1.85 0.63 0.10 0.18 206-T 54.34 0.60 11.22 1.84 8.31 0.17 9.74 6.90 1.08 1.03 0.09 1.09 207-T 55.47 0.72 12.18 2.38 8.81 0.17 6.03 7.31 1.02 1.32 0.08 0.97 208-T 61.22 0.60 11.90 2.48 6.05 0.15 5.16 6.59 1.03 1.57 0.07 0.63 211-T 46.93 0.59 9.89 9.11 11.80 0.15 4.55 6.41 0.75 1.11 0.06 0.34 301-T 57.42 0.27 6.34 3.57 14.90 0.28 3.00 7.06 1.54 0.63 0.24 3.24 302-T 53.84 0.24 5.69 4.79 17.90 0.27 2.71 6.95 1.39 0.49 0.22 3.18 303-T 51.42 0.21 5.63 5.89 20.70 0.20 2.26 5.49 1.55 0.52 0.15 2.69 304-T 52.80 0.32 7.92 4.91 15.60 0.21 3.96 6.31 1.92 0.63 0.16 2.52 306-T 57.94 0.27 6.38 2.07 12.90 0.36 2.90 8.67 0.23 1.22 0.10 4.59 307-T 52.51 0.77 16.96 2.04 7.09 0.14 5.59 6.90 1.82 3.14 0.20 0.32 308-T 60.34 0.16 11.41 3.34 7.62 0.16 1.40 3.60 5.25 0.32 0.12 2.06 309-T 53.93 0.28 7.20 4.76 16.00 0.23 3.21 6.68 1.85 0.58 0.19 2.80 401-T 69.90 0.43 13.30 1.46 0.93 0.07 0.67 1.81 3.39 4.69 0.13 0.78 402-T 70.13 0.44 12.74 1.88 0.89 0.07 0.78 1.86 2.34 4.91 0.15 1.14 403-T 70.19 0.45 12.95 1.95 0.74 0.07 0.71 1.79 3.23 4.60 0.12 0.91 404-WR 68.86 0.37 13.16 1.44 1.00 0.07 0.66 1.03 1.21 7.16 0.03 0.59 405-WR 71.00 0.44 12.67 1.29 1.17 0.09 0.92 2.47 0.76 3.94 0.16 2.61 406-WR 78.34 0.05 2.50 7.58 1.76 0.05 0.13 2.76 0.01 0.81 0.08 2.13 407-WR 48.68 0.08 9.29 19.84 1.40 0.09 0.62 1.62 0.14 5.80 0.03 1.90 408-WR 72.77 0.08 11.64 1.35 1.52 0.01 0.07 0.31 2.95 5.92 0.01 0.09 501-WR 88.51 0.27 5.34 1.40 0.86 0.01 0.22 0.05 0.17 1.07 0.04 0.004 502-WR 52.84 1.17 22.03 7.66 1.25 0.04 0.65 0.32 0.35 4.90 0.14 0.02 503-WR 64.30 0.89 18.15 3.13 1.97 0.01 0.64 0.37 0.23 4.89 0.19 0.004 504-WR 60.91 1.26 20.45 3.34 0.63 0.03 0.82 0.29 0.45 5.76 0.09 0.004 505-WR 49.67 1.39 19.08 9.37 5.64 0.06 0.85 0.55 0.34 3.87 0.32 0.003 601-WR 65.05 0.48 14.94 2.63 2.47 0.25 2.20 3.15 3.27 1.62 0.11 0.34 602-WR 63.47 0.49 15.11 3.93 2.58 0.19 2.15 3.42 2.61 1.78 0.12 0.08 603-WR 63.59 0.47 15.34 3.09 2.43 0.38 1.93 4.24 3.08 1.96 0.11 0.92 604-WR 61.87 0.55 15.29 1.61 3.61 0.36 2.28 4.56 3.83 1.31 0.11 2.45 701-WR 65.59 0.52 13.01 5.95 0.91 0.01 0.59 0.12 1.89 5.27 0.17 0.00 702-WR 65.40 0.53 13.14 4.84 1.80 0.02 1.29 0.23 1.61 6.22 0.11 0.11 703-WR 67.00 0.34 13.61 3.91 0.75 0.01 0.52 0.13 2.17 7.19 0.08 0.02 704-WR 67.76 0.37 13.80 3.22 0.88 0.02 0.58 0.26 2.54 6.61 0.10 0.14 705-WR 66.08 0.58 12.49 6.69 0.46 0.06 1.19 0.68 1.43 4.92 0.17 0.10 706-WR 61.82 0.57 12.79 8.62 0.46 0.04 0.93 0.98 2.34 4.27 0.19 0.29 707-WR 68.48 0.50 12.20 4.74 0.58 0.02 0.64 0.42 1.52 5.87 0.15 0.03 708-WR 66.17 0.56 12.69 6.40 0.54 0.04 0.80 0.61 1.58 5.67 0.18 0.03 709-WR 68.24 0.54 13.02 4.84 2.14 0.02 0.82 0.52 1.59 5.45 0.15 0.01 710-WR 63.62 0.33 14.05 5.40 1.09 0.01 0.52 0.08 2.77 7.49 0.07 0.004 801-WR 57.09 0.67 16.72 5.90 1.97 0.11 1.66 3.72 1.37 4.44 0.32 2.32 802-WR 54.91 0.66 15.01 10.26 0.18 0.12 1.66 2.71 0.14 4.90 0.32 2.08 803-WR 61.01 0.70 15.76 9.14 0.05 0.01 0.57 0.55 0.45 3.92 0.37 0.00 Table 6: Major Oxide Values by Whole Rock Analysis

Sample Silicon Oxide Titanium Oxide Aluminum Oxide Ferric Oxide Ferrous Oxide Manganese Oxide Magnesium Oxide Calcium Oxide Sodium Oxide Potassium Oxide Phosphorus Oxide Carbon Dioxide
SiO2 (Wt. %) TiO2 (Wt. %) Al2O3 (Wt. %) Fe2O3 (Wt. %) FeO (Wt. %) MnO (Wt. %) MgO (Wt. %) CaO (Wt. %) Na2O (Wt. %) K2O (Wt. %) P2O5 (Wt. %) CO2 (Wt %) 804-WR 52.55 0.38 14.46 6.87 1.32 0.03 1.87 5.04 0.13 4.08 0.28 0.05 805-WR 54.70 0.40 15.70 6.50 1.83 0.04 2.92 4.10 0.13 3.95 0.31 0.18 902-WR 61.04 0.70 15.46 4.09 4.00 0.14 3.14 1.41 2.97 1.80 0.16 0.00 903-WR 56.99 0.71 16.21 6.74 3.66 0.09 2.66 0.56 1.59 2.51 0.07 0.00 904-WR 58.20 0.65 16.57 5.11 3.47 0.27 2.97 0.60 1.75 3.06 0.12 0.03 905-WR 61.87 0.60 14.91 4.78 3.71 0.23 2.35 0.62 1.82 2.81 0.17 0.13 906-WR 66.34 0.48 14.30 2.73 3.65 0.08 2.06 1.01 3.43 1.70 0.17 0.02 907-WR 59.16 0.68 16.40 3.86 4.89 0.13 2.61 2.23 3.14 1.86 0.16 0.08 908-WR 60.06 0.67 15.24 5.63 3.23 0.19 2.70 0.97 2.07 2.73 0.16 0.05 909-WR 57.81 0.67 15.89 7.26 3.11 0.23 3.00 1.45 2.86 2.02 0.11 0.04 911-WR 58.09 0.56 13.01 6.10 2.53 0.25 2.49 8.75 1.35 1.95 0.11 2.25 912-WR 56.41 0.58 14.45 5.00 3.00 0.24 3.52 5.97 1.54 2.46 0.27 2.80 914-WR 56.81 0.57 16.04 3.99 2.49 0.19 3.37 4.65 3.31 1.97 0.24 1.75 915-WR 51.22 0.51 12.18 4.62 3.09 0.22 3.47 12.29 1.49 1.71 0.33 5.04 916-WR 53.34 0.65 15.21 4.30 2.63 0.21 3.31 9.98 2.47 1.54 0.14 2.57 917-WR 57.76 0.75 17.23 3.74 3.61 0.15 4.02 2.30 2.48 2.15 0.27 0.69 918-WR 58.35 0.67 17.43 4.07 3.67 0.09 3.20 1.55 3.17 2.35 0.27 0.35 919-WR 57.61 0.72 15.82 5.35 3.06 0.23 3.56 2.62 1.40 2.66 0.27 1.32 920-WR 57.17 0.72 17.03 3.84 3.57 0.14 4.42 2.77 2.47 1.87 0.30 0.14 921-WR 54.26 0.87 18.99 6.24 3.07 0.09 2.53 1.83 1.96 3.18 0.30 0.39 922-WR 58.97 0.65 16.44 4.33 4.54 0.10 3.12 1.69 4.10 1.84 0.26 0.06 923-WR 61.47 0.64 14.64 4.65 4.30 0.27 4.37 0.65 0.67 2.78 0.23 0.02 924-WR 58.92 0.65 16.79 4.13 3.88 0.09 3.03 1.57 3.10 2.26 0.24 0.11 930-WR 58.31 0.85 19.47 4.34 2.90 0.06 2.66 0.14 2.26 3.16 0.01 0.00 1001-T 46.97 0.65 13.37 9.03 3.19 0.09 4.03 5.13 2.39 4.58 0.25 2.84 1002-WR 64.15 0.50 16.26 4.13 0.68 0.13 0.92 1.68 2.13 4.56 0.25 1.07 1003-WR 49.63 0.76 12.35 5.95 4.61 0.19 8.24 8.86 2.23 2.28 0.31 0.14 1004-WR 49.77 0.89 12.35 7.49 3.87 0.09 6.99 5.51 2.55 3.42 0.35 1.56 1101-WR 61.27 0.86 15.38 5.84 0.76 0.50 0.89 1.87 0.15 4.70 0.17 1.74 1102-WR 59.08 0.84 15.15 8.30 0.88 0.95 1.05 2.68 0.20 4.90 0.07 3.01 1103-WR 58.21 0.95 16.03 4.05 2.28 0.10 1.45 3.60 0.28 3.66 0.10 4.11 1104-WR 56.00 0.93 16.81 2.43 4.68 0.20 1.90 3.74 0.30 3.71 0.09 4.64 1201-T 55.66 0.88 11.74 2.26 0.91 0.22 4.39 5.18 1.04 1.87 0.19 5.77 1202-T 54.24 0.91 10.95 2.03 8.46 0.22 4.12 5.40 0.91 1.82 0.19 4.49 1203-T 53.31 0.83 14.57 2.14 8.07 0.21 4.31 4.31 1.19 2.48 0.19 3.44 1204-WR 59.67 0.35 15.23 1.47 1.65 0.06 2.08 4.63 2.47 3.24 0.15 6.57 1205-WR 62.55 0.46 16.21 3.51 1.88 0.05 2.25 1.52 1.29 3.85 0.14 1.48 1206-WR 68.03 0.59 13.95 3.02 1.78 0.07 2.03 0.90 0.74 3.05 0.10 1.09

Table 7: Calculated Mineral Compositions For All Samples Using NEWPET
Sample Quartz Corundum Orthoclase Albite Anorthite Diopside Hypersthene Olivine Magnetite Hematite Ilmenite Rutile Apatite Calcite Magnesite
SiO2 Al2O3 K2O.Al2O3.6SiO2 Na2O.Al2O3.6SiO2 CaO.Al2O3.2SiO2 CaO.(Mg,Fe)O.2SiO2 (Mg,Fe)O. SiO2 2(Mg,Fe)O.SiO2 FeO.Fe2O3 Fe2O3 FeO.TiO2 TiO2 3.3CaO.P2O5 CaCO3 MgCO3
102-WR 5.75 2.53 40.01 20.39 7.04 0.00 11.10 0.00 5.94 0.00 1.71 0.00 0.43 0.69 0.00 103-WR 0.00 4.70 25.06 27.50 6.77 0.00 21.01 3.66 4.66 0.00 1.79 0.00 0.45 1.21 0.00 104-WR 0.00 1.54 27.19 22.93 13.79 0.00 9.51 11.70 3.61 0.00 1.71 0.00 0.43 1.27 0.00 202-WR 14.94 0.00 5.50 15.74 24.52 6.20 24.59 0.00 2.27 0.00 1.98 0.00 0.26 0.52 0.00 203-WR 9.89 0.00 4.73 16.41 17.88 1.93 40.81 0.00 1.66 0.00 0.89 0.00 0.31 0.27 0.00 204-WR 18.61 0.02 5.73 27.07 15.85 0.00 25.02 0.00 1.73 0.00 0.84 0.34 0.38 2.03 0.00 205-WR 11.24 0.00 3.72 15.65 25.39 12.48 22.23 0.00 3.69 0.00 1.88 0.00 0.24 0.40 0.00 206-T 12.96 0.00 6.09 9.14 22.73 3.27 35.73 0.00 2.67 0.00 1.14 0.00 0.21 2.48 0.00 207-T 17.68 0.00 7.80 8.63 24.76 4.00 26.38 0.00 3.46 0.00 1.37 0.00 0.19 2.20 0.00 208-T 26.61 0.00 9.28 8.71 23.21 4.10 19.20 0.00 3.59 0.00 1.14 0.00 0.17 1.44 0.00 211-T 14.70 0.00 6.56 6.35 20.34 7.42 21.08 0.00 13.20 0.00 1.12 0.00 0.14 0.77 0.00 301-T 25.79 0.00 3.72 13.03 8.53 3.80 30.01 0.00 5.17 0.00 0.51 0.00 0.57 7.38 0.00 302-T 22.13 0.00 2.90 11.76 7.84 4.43 33.47 0.00 6.94 0.00 0.46 0.00 0.52 7.22 0.00 303-T 18.46 0.00 3.07 13.11 6.87 2.06 37.72 0.00 8.54 0.00 0.40 0.00 0.36 6.12 0.00 304-T 16.68 0.00 3.72 16.24 11.13 2.73 32.92 0.00 7.11 0.00 0.61 0.00 0.38 5.73 0.00 306-T 31.86 0.00 7.21 1.95 12.77 0.49 29.17 0.00 3.00 0.00 0.51 0.00 0.24 10.44 0.00 307-T 3.96 0.00 18.56 15.40 28.84 1.71 23.41 0.00 2.96 0.00 1.46 0.00 0.47 0.72 0.00 308-T 19.61 0.94 1.89 44.42 4.05 0.00 14.75 0.00 4.84 0.00 0.30 0.00 0.28 4.69 0.00 309-T 19.44 0.00 3.43 16.65 9.63 3.93 31.39 0.00 6.91 0.00 0.53 0.00 0.45 6.36 0.00 401-T 29.86 1.49 27.72 28.68 3.17 0.00 1.67 0.00 1.98 0.09 0.82 0.00 0.31 1.78 0.00 402-T 36.12 3.21 29.02 19.80 1.01 0.00 1.94 0.00 1.82 0.62 0.84 0.00 0.36 2.60 0.00 403-T 31.73 1.80 27.19 27.33 2.34 0.00 1.77 0.00 1.31 1.04 0.85 0.38 0.28 2.07 0.00
404-WR 32.95 3.00 42.32 10.24 1.16 0.00 1.81 0.00 2.08 0.00 0.70 0.30 0.07 1.35 0.00 405-WR 51.04 7.16 23.29 6.43 0.00 0.00 0.90 0.00 1.87 0.00 0.84 0.00 0.38 4.03 1.61 406-WR 75.05 1.61 4.79 0.08 0.00 0.00 0.22 5.69 0.02 3.66 0.09 0.00 0.19 4.74 0.09 407-WR 25.64 2.78 34.28 1.18 0.00 0.00 0.04 0.00 4.57 16.69 0.15 0.00 0.07 2.82 1.27 408-WR 31.75 0.06 34.99 24.96 0.88 0.00 1.74 0.00 1.95 0.00 0.15 0.07 0.02 0.21 0.00 501-WR 83.11 3.90 6.32 1.44 0.00 0.00 0.53 0.00 2.02 0.01 0.51 0.00 0.09 0.00 0.01 502-WR 30.83 15.94 28.96 2.96 0.57 0.00 1.62 0.00 0.77 7.13 2.22 1.21 0.33 0.04 0.00 503-WR 43.04 12.27 28.90 1.95 0.57 0.00 1.59 0.00 3.80 0.50 1.69 0.91 0.45 0.01 0.00 504-WR 34.67 13.17 34.04 3.81 0.82 0.00 2.04 0.00 0.00 3.34 1.39 0.53 0.21 0.01 0.00 505-WR 31.15 14.11 22.87 2.88 0.62 0.00 2.55 0.00 13.59 0.00 2.64 0.00 0.76 0.01 0.00 601-WR 30.12 3.14 9.58 27.67 12.75 0.00 7.51 0.00 3.81 0.00 0.91 0.00 0.26 0.78 0.00 602-WR 31.02 3.14 10.52 22.08 15.69 0.00 6.39 0.00 5.69 0.00 0.93 0.00 0.28 0.18 0.00 603-WR 28.18 2.83 11.58 26.06 14.53 0.00 6.65 0.00 4.47 0.00 0.89 0.00 0.26 2.08 0.00 604-WR 26.12 5.23 7.74 32.41 6.39 0.00 10.73 0.00 2.34 0.00 1.04 0.00 0.26 5.58 0.00 701-WR 33.76 4.20 31.15 15.99 0.00 0.00 1.28 0.00 1.46 4.94 0.99 0.00 0.40 0.00 0.16 702-WR 30.37 3.76 36.76 13.62 0.01 0.00 3.11 0.00 4.33 1.85 1.01 0.00 0.26 0.15 0.09 703-WR 26.08 2.25 42.50 18.36 0.01 0.00 1.30 0.00 1.46 2.91 0.65 0.00 0.19 0.04 0.00 704-WR 26.88 2.47 39.07 21.49 0.00 0.00 1.35 0.00 1.83 1.96 0.70 0.00 0.24 0.23 0.08 705-WR 36.44 4.20 29.08 12.10 1.66 0.00 2.96 0.00 0.00 6.69 1..1 0.00 0.40 0.22 0.00 706-WR 29.70 3.66 25.24 19.80 1.80 0.00 2.32 0.00 0.00 8.62 1.06 0.01 0.45 0.65 0.00 707-WR 35.81 3.00 34.69 12.86 0.93 0.00 1.59 0.00 0.49 4.41 0.95 0.00 0.36 0.06 0.00 708-WR 33.36 3.34 33.51 13.37 1.68 0.00 1.99 0.00 0.25 6.23 1.06 0.00 0.43 0.06 0.00 709-WR 36.23 3.93 32.21 13.45 1.56 0.00 2.04 0.00 0.00 4.84 0.76 0.14 0.36 0.01 0.00 710-WR 18.08 1.39 44.27 23.44 0.00 0.00 1.26 0.00 2.59 3.61 0.63 0.00 0.17 0.00 0.03 801-WR 28.93 9.05 26.24 11.59 1.67 0.00 4.13 0.00 4.77 2.61 1.27 0.00 0.76 5.29 0.00 802-WR 33.25 9.48 28.96 1.18 0.00 0.00 3.50 0.00 0.00 10.26 0.64 0.32 0.76 4.08 0.53 803-WR 42.40 10.66 23.17 3.81 0.31 0.00 1.42 0.00 0.00 9.14 0.13 0.63 0.88 0.00 0.00 804-WR 23.53 1.46 24.11 1.10 22.83 0.00 4.66 0.00 3.25 4.63 0.72 0.00 0.66 0.12 0.00 805-WR 27.06 4.93 23.35 1.10 17.15 0.00 7.27 0.00 4.87 3.14 0.76 0.00 0.73 0.42 0.00 902-WR 28.23 6.45 10.64 25.13 5.95 0.00 10.89 0.00 5.93 0.00 1.33 0.00 0.38 0.00 0.00 903-WR 33.10 10.03 14.84 13.45 2.32 0.00 6.78 0.00 9.77 0.00 1.35 0.00 0.17 0.00 0.00 904-WR 30.30 9.65 18.09 14.81 2.00 0.00 8.98 0.00 7.40 0.00 1.23 0.00 0.28 0.07 0.00 905-WR 35.48 8.45 16.61 15.40 1.15 0.00 8.15 0.00 6.93 0.00 1.14 0.00 0.40 0.29 0.00 906-WR 33.45 5.44 10.05 29.02 3.77 0.00 8.93 0.00 3.96 0.00 0.91 0.00 0.40 0.05 0.00 907-WR 23.53 5.73 10.99 26.57 9.54 0.00 11.41 0.00 5.59 0.00 1.29 0.00 0.38 0.17 0.00 908-WR 31.81 7.62 16.14 17.51 3.45 0.00 7.26 0.00 8.15 0.00 1.27 0.00 0.38 0.11 0.00 909-WR 26.29 6.73 11.94 24.20 6.20 0.00 7.47 0.00 8.83 1.17 1.27 0.00 0.26 0.10 0.00 911-WR 27.80 0.00 11.53 11.42 23.68 3.72 4.48 0.00 7.34 1.04 1.06 0.00 0.26 5.12 0.00 912-WR 28.02 5.54 14.54 3.03 10.13 0.00 9.63 0.00 7.25 0.00 1.10 0.00 0.64 6.38 0.00 914-WR 20.17 4.64 11.64 28.01 10.45 0.00 5.78 0.00 5.78 0.00 1.08 0.00 0.57 3.98 0.00 915-WR 19.72 0.00 10.11 12.61 21.50 4.33 8.02 0.00 6.70 0.00 0.97 0.00 0.78 11.46 0.00 916-WR 15.30 0.00 9.10 20.90 25.87 5.09 6.46 0.00 6.24 0.00 1.23 0.00 0.33 5.84 0.00 917-WR 25.67 8.90 12.71 20.98 5.26 0.00 12.59 0.00 5.42 0.00 1.42 0.00 0.64 1.58 0.00 918-WR 23.42 8.30 13.89 26.82 3.74 0.00 10.40 0.00 5.91 0.00 1.27 0.00 0.64 0.79 0.00 919-WR 32.53 9.57 15.72 11.85 2.90 0.00 9.30 0.00 7.76 0.00 1.37 0.00 0.64 3.00 0.00 920-WR 23.23 6.95 11.05 20.90 10.90 0.00 13.46 0.00 5.56 11.92 1.37 0.00 0.71 0.32 0.00

Table 7: Calculated Mineral Compositions For All Samples Using NEWPET
Sample Quartz Corundum Orthoclase Albite Anorthite Diopside Hypersthene Olivine Magnetite Hematite Ilmenite Rutile Apatite Calcite Magnesite
SiO2 Al2O3 K2O.Al2O3.6SiO2 Na2O.Al2O3.6SiO2 CaO.Al2O3.2SiO2 CaO.(Mg,Fe)O.2SiO2 (Mg,Fe)O. SiO2 2(Mg,Fe)O.SiO2 FeO.Fe2O3 Fe2O3 FeO.TiO2 TiO2 3.3CaO.P2O5 CaCO3 MgCO3
921-WR 24.90 10.61 18.80 16.58 4.67 0.00 6.30 0.00 7.67 0.96 1.65 0.00 0.71 0.88 0.00 922-WR 18.94 5.39 10.88 34.69 6.31 0.00 11.64 0.00 6.27 0.00 1.23 0.00 0.62 0.14 0.00 923-WR 38.13 9.94 16.43 5.67 1.61 0.00 14.38 0.00 6.75 0.00 1.22 0.00 0.54 0.04 0.00 924-WR 24.06 7.22 13.36 26.23 5.53 0.00 10.35 0.00 5.99 0.00 1.23 0.00 0.57 0.25 0.00 930-WR 28.63 12.10 18.68 19.12 0.63 0.00 7.07 0.00 6.29 0.00 1.61 0.00 0.02 0.00 0.00 1001-T 7.00 2.34 27.07 20.22 5.86 0.00 10.04 0.00 8.69 3.04 1.23 0.00 0.59 6.46 0.00
1002-WR 32.95 7.82 26.95 18.02 0.00 0.00 2.26 0.00 1.17 3.33 0.95 0.00 0.59 2.41 0.02 1003-WR 1.91 0.00 13.48 18.87 16.96 19.00 14.23 0.00 8.62 0.00 1.44 0.00 0.73 0.32 0.00 1004-WR 5.52 0.00 20.21 21.58 12.15 2.38 16.30 0.00 10.19 0.47 1.69 0.00 0.83 3.54 0.00 1101-WR 41.70 10.05 27.78 1.27 0.00 0.00 1.19 0.00 1.59 4.75 1.63 0.00 0.40 2.94 0.86 1102-WR 38.93 9.52 28.96 1.69 0.00 0.00 0.39 0.00 3.50 5.89 1.59 0.00 0.17 4.62 1.87 1103-WR 42.30 11.61 21.63 2.37 0.00 0.00 0.45 0.00 4.92 0.66 1.80 0.00 0.24 6.19 2.66 1104-WR 37.20 12.30 21.93 2.54 0.00 0.00 6.05 0.00 3.52 0.00 1.77 0.00 0.21 6.46 3.44 1201-T 33.11 8.01 11.05 8.80 0.00 0.00 18.44 0.00 3.28 0.00 1.67 0.00 0.45 8.80 3.63 1202-T 30.56 7.48 10.76 7.70 0.00 0.00 22.13 0.00 2.95 0.00 1.73 0.00 0.45 9.19 0.75 1203-T 25.32 9.93 14.66 10.07 0.00 0.00 22.22 0.00 3.10 0.00 1.58 0.00 0.45 7.25 0.49
1204-WR 32.90 7.66 19.15 20.90 0.00 0.00 0.00 0.00 0.18 1.35 0.66 0.00 0.36 7.91 4.35 1205-WR 37.54 9.92 22.76 10.91 0.00 0.00 4.62 0.00 4.89 0.14 0.87 0.00 0.33 2.38 0.82 1206-WR 49.69 9.43 18.03 6.26 0.00 0.00 3.95 0.00 4.25 0.08 1.12 0.00 0.24 1.37 0.93

Table 8: Calculated Neutralization Potentials Using Relative Reactivities of Neutralizing Minerals for All Samples
Calculated NP (kg CaCO3/tonne) Sample Quartz Orthoclase Albite Anorthite Diopside Hypersthene Olivine Apatite Calcite Magnesite Total
SiO2 K2O.Al2O3.6SiO2 Na2O.Al2O3.6SiO2 CaO.Al2O3.2SiO2 CaO.(Mg,Fe)O.2SiO2 (Mg,Fe)O. SiO2 2(Mg,Fe)O.SiO2 3.3CaO.P2O5 CaCO3 MgCO3 NP 102-WR 0.4 0.8 0.4 10.6 0.0 2.0 0.0 0.6 6.9 0.0 21.7 103-WR 0.0 0.5 0.5 10.1 0.0 3.7 8.8 0.6 12.1 0.0 36.3 104-WR 0.0 0.5 0.5 21.2 0.0 1.8 29.1 0.6 12.7 0.0 66.3 202-WR 1.0 0.1 0.3 36.6 11.1 4.4 0.0 0.3 5.2 0.0 59.1 203-WR 0.7 0.1 0.3 27.2 3.5 7.4 0.0 0.4 2.7 0.0 42.4 204-WR 1.3 0.1 0.5 23.4 0.0 4.4 0.0 0.5 20.3 0.0 50.5 205-WR 0.8 0.1 0.3 37.7 22.2 4.0 0.0 0.3 4.0 0.0 69.4 206-T 0.9 0.1 0.2 34.0 5.9 6.4 0.0 0.3 24.8 0.0 72.5 207-T 1.2 0.1 0.2 37.0 7.2 4.7 0.0 0.3 22.0 0.0 72.7 208-T 1.8 0.2 0.2 34.3 7.3 3.4 0.0 0.2 14.4 0.0 61.8 211-T 1.1 0.1 0.1 32.0 14.0 4.0 0.0 0.2 7.7 0.0 59.2 301-T 1.7 0.1 0.3 12.5 6.7 5.3 0.0 0.7 73.8 0.0 101.0 302-T 1.5 0.1 0.2 11.6 7.8 5.9 0.0 0.7 72.2 0.0 100.0 303-T 1.3 0.1 0.3 10.3 3.7 6.7 0.0 0.5 61.2 0.0 84.0 304-T 1.1 0.1 0.3 16.5 4.9 5.9 0.0 0.5 57.3 0.0 86.6 306-T 2.2 0.1 0.0 18.9 0.9 5.2 0.0 0.3 104.4 0.0 132.0 307-T 0.3 0.3 0.3 42.6 3.0 4.1 0.0 0.6 7.2 0.0 58.5 308-T 1.4 0.0 0.9 6.1 0.0 2.7 0.0 0.4 46.9 0.0 58.3 309-T 1.3 0.1 0.3 14.1 6.9 5.5 0.0 0.6 63.6 0.0 92.3 401-T 2.0 0.5 0.6 4.7 0.0 0.3 0.0 0.4 17.8 0.0 26.3 402-T 2.5 0.5 0.4 1.5 0.0 0.3 0.0 0.5 26.0 0.0 31.7 403-T 2.2 0.5 0.5 3.4 0.0 0.3 0.0 0.4 20.7 0.0 28.0 404-WR 2.3 0.8 0.2 1.7 0.0 0.3 0.0 0.1 13.5 0.0 18.9 405-WR 3.5 0.4 0.1 0.0 0.0 0.2 0.0 0.5 40.3 16.1 61.1 406-WR 5.2 0.1 0.0 0.0 0.0 0.0 13.8 0.3 47.4 0.9 67.7 407-WR 1.9 0.7 0.0 0.0 0.0 0.0 0.0 0.1 28.2 12.7 43.6 408-WR 2.2 0.7 0.5 1.3 0.0 0.3 0.0 0.0 2.1 0.0 7.1 501-WR 5.7 0.1 0.0 0.0 0.0 0.1 0.0 0.1 0.0 0.1 6.1 502-WR 2.2 0.6 0.1 0.9 0.0 0.3 0.0 0.5 0.4 0.0 4.9 503-WR 3.0 0.5 0.0 0.9 0.0 0.3 0.0 0.6 0.1 0.0 5.4 504-WR 2.5 0.7 0.1 1.3 0.0 0.4 0.0 0.3 0.1 0.0 5.2 505-WR 2.3 0.5 0.1 1.0 0.0 0.5 0.0 1.1 0.1 0.0 5.4 601-WR 2.1 0.2 0.5 19.0 0.0 1.3 0.0 0.3 7.8 0.0 31.3 602-WR 2.2 0.2 0.4 23.6 0.0 1.1 0.0 0.4 1.8 0.0 29.7 603-WR 1.9 0.2 0.5 21.5 0.0 1.2 0.0 0.3 20.8 0.0 46.4 604-WR 1.8 0.1 0.6 9.4 0.0 1.9 0.0 0.3 55.8 0.0 70.0 701-WR 2.4 0.6 0.3 0.0 0.0 0.2 0.0 0.5 0.0 1.6 5.7 702-WR 2.1 0.7 0.3 0.0 0.0 0.6 0.0 0.4 1.5 0.9 6.4 703-WR 1.8 0.8 0.4 0.0 0.0 0.2 0.0 0.3 0.4 0.0 3.9 704-WR 1.9 0.7 0.4 0.0 0.0 0.2 0.0 0.3 2.3 0.8 6.7 705-WR 2.6 0.6 0.2 2.6 0.0 0.5 0.0 0.6 2.2 0.0 9.2 706-WR 2.1 0.5 0.4 2.8 0.0 0.4 0.0 0.6 6.5 0.0 13.3 707-WR 2.5 0.7 0.3 1.4 0.0 0.3 0.0 0.5 0.6 0.0 6.2 708-WR 2.3 0.6 0.3 2.5 0.0 0.4 0.0 0.6 0.6 0.0 7.3 709-WR 2.5 0.6 0.3 2.4 0.0 0.4 0.0 0.5 0.1 0.0 6.7 710-WR 1.3 0.8 0.5 0.0 0.0 0.2 0.0 0.2 0.0 0.3 3.3 801-WR 2.0 0.5 0.2 2.5 0.0 0.7 0.0 1.0 52.9 0.0 59.9 802-WR 2.4 0.6 0.0 0.0 0.0 0.7 0.0 1.1 40.8 5.3 50.8 803-WR 3.1 0.5 0.1 0.5 0.0 0.3 0.0 1.2 0.0 0.0 5.6 Table 8: Calculated Neutralization Potentials Using Relative Reactivities of Neutralizing Minerals for All Samples

Calculated NP (kg CaCO3/tonne) Sample Quartz Orthoclase Albite Anorthite Diopside Hypersthene Olivine Apatite Calcite Magnesite Total
SiO2 K2O.Al2O3.6SiO2 Na2O.Al2O3.6SiO2 CaO.Al2O3.2SiO2 CaO.(Mg,Fe)O.2SiO2 (Mg,Fe)O. SiO2 2(Mg,Fe)O.SiO2 3.3CaO.P2O5 CaCO3 MgCO3 NP 804-WR 1.8 0.5 0.0 37.8 0.0 0.9 0.0 1.0 1.2 0.0 43.2 805-WR 2.0 0.5 0.0 27.2 0.0 1.4 0.0 1.0 4.2 0.0 36.3 902-WR 2.0 0.2 0.5 9.0 0.0 2.0 0.0 0.5 0.0 0.0 14.2 903-WR 2.4 0.3 0.3 3.6 0.0 1.3 0.0 0.2 0.0 0.0 8.1 904-WR 2.2 0.4 0.3 3.1 0.0 1.7 0.0 0.4 0.7 0.0 8.7 905-WR 2.5 0.3 0.3 1.8 0.0 1.5 0.0 0.5 2.9 0.0 9.9 906-WR 2.3 0.2 0.6 5.7 0.0 1.6 0.0 0.5 0.5 0.0 11.4 907-WR 1.6 0.2 0.5 14.4 0.0 2.1 0.0 0.5 1.7 0.0 21.1 908-WR 2.3 0.3 0.4 5.3 0.0 1.3 0.0 0.5 1.1 0.0 11.2 909-WR 1.9 0.2 0.5 9.5 0.0 1.4 0.0 0.4 1.0 0.0 14.7 911-WR 1.9 0.2 0.2 35.0 6.6 0.8 0.0 0.3 51.2 0.0 96.3 912-WR 2.2 0.3 0.1 17.1 0.0 1.9 0.0 1.0 63.8 0.0 86.4 914-WR 1.5 0.2 0.6 16.4 0.0 1.1 0.0 0.8 39.8 0.0 60.4 915-WR 1.4 0.2 0.3 32.4 7.8 1.4 0.0 1.1 114.6 0.0 159.1 916-WR 1.1 0.2 0.4 38.8 9.1 1.2 0.0 0.4 58.4 0.0 109.5 917-WR 1.8 0.2 0.4 8.0 0.0 2.3 0.0 0.9 15.8 0.0 29.4 918-WR 1.6 0.3 0.5 5.7 0.0 1.9 0.0 0.9 7.9 0.0 18.8 919-WR 2.3 0.3 0.2 4.4 0.0 1.7 0.0 0.9 30.0 0.0 39.8 920-WR 1.5 0.2 0.4 14.8 0.0 2.2 0.0 0.9 3.2 0.0 23.0 921-WR 1.8 0.4 0.3 7.2 0.0 1.2 0.0 1.0 8.8 0.0 20.6 922-WR 1.3 0.2 0.7 9.5 0.0 2.1 0.0 0.8 1.4 0.0 16.0 923-WR 2.7 0.3 0.1 2.4 0.0 2.6 0.0 0.7 0.4 0.0 9.3 924-WR 1.7 0.3 0.5 8.4 0.0 1.9 0.0 0.8 2.5 0.0 16.0 930-WR 2.0 0.4 0.4 1.0 0.0 1.3 0.0 0.0 0.0 0.0 5.1 1001-T 0.5 0.5 0.4 9.2 0.0 1.9 0.0 0.8 64.6 0.0 77.9 1002-WR 2.3 0.5 0.4 0.0 0.0 0.4 0.0 0.8 24.1 0.2 28.6 1003-WR 0.1 0.3 0.4 25.6 34.3 2.6 0.0 1.0 3.2 0.0 67.4 1004-WR 0.4 0.4 0.4 18.5 4.3 3.0 0.0 1.1 35.4 0.0 63.5 1101-WR 3.0 0.5 0.0 0.0 0.0 0.2 0.0 0.6 29.4 8.6 42.3 1102-WR 2.7 0.5 0.0 0.0 0.0 0.1 0.0 0.2 46.2 18.7 68.4 1103-WR 3.0 0.4 0.0 0.0 0.0 0.1 0.0 0.3 61.9 26.6 92.4 1104-WR 2.6 0.4 0.1 0.0 0.0 1.1 0.0 0.3 64.6 34.4 103.5 1201-T 2.3 0.2 0.2 0.0 0.0 3.3 0.0 0.6 88.0 36.3 130.8 1202-T 2.2 0.2 0.2 0.0 0.0 4.1 0.0 0.6 91.9 7.5 106.7 1203-T 1.8 0.3 0.2 0.0 0.0 4.1 0.0 0.6 72.5 4.9 84.3 1204-WR 2.3 0.4 0.4 0.0 0.0 0.0 0.0 0.5 79.1 43.5 126.1 1205-WR 2.6 0.4 0.2 0.0 0.0 0.8 0.0 0.4 23.8 8.2 36.6 1206-WR 3.5 0.3 0.1 0.0 0.0 0.7 0.0 0.3 13.7 9.3 28.0
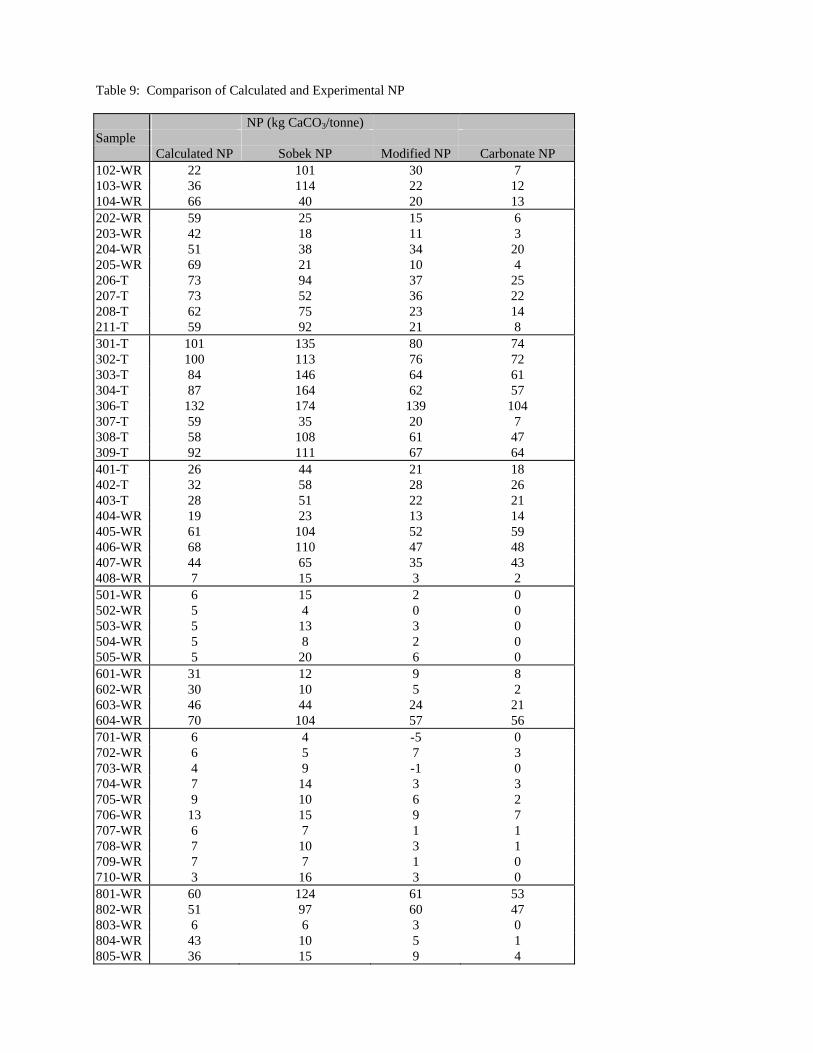
Table 9: Comparison of Calculated and Experimental NP NP (kg CaCO3/tonne) Sample Calculated NP Sobek NP Modified NP Carbonate NP 102-WR 22 101 30 7 103-WR 36 114 22 12 104-WR 66 40 20 13 202-WR 59 25 15 6 203-WR 42 18 11 3 204-WR 51 38 34 20 205-WR 69 21 10 4 206-T 73 94 37 25 207-T 73 52 36 22 208-T 62 75 23 14 211-T 59 92 21 8 301-T 101 135 80 74 302-T 100 113 76 72 303-T 84 146 64 61 304-T 87 164 62 57 306-T 132 174 139 104 307-T 59 35 20 7 308-T 58 108 61 47 309-T 92 111 67 64 401-T 26 44 21 18 402-T 32 58 28 26 403-T 28 51 22 21 404-WR 19 23 13 14 405-WR 61 104 52 59 406-WR 68 110 47 48 407-WR 44 65 35 43 408-WR 7 15 3 2 501-WR 6 15 2 0 502-WR 5 4 0 0 503-WR 5 13 3 0 504-WR 5 8 2 0 505-WR 5 20 6 0 601-WR 31 12 9 8 602-WR 30 10 5 2 603-WR 46 44 24 21 604-WR 70 104 57 56 701-WR 6 4 -5 0 702-WR 6 5 7 3 703-WR 4 9 -1 0 704-WR 7 14 3 3 705-WR 9 10 6 2 706-WR 13 15 9 7 707-WR 6 7 1 1 708-WR 7 10 3 1 709-WR 7 7 1 0 710-WR 3 16 3 0 801-WR 60 124 61 53 802-WR 51 97 60 47 803-WR 6 6 3 0 804-WR 43 10 5 1 805-WR 36 15 9 4

Table 9: Comparison of Calculated and Experimental NP NP (kg CaCO3/tonne) Sample Calculated NP Sobek NP Modified NP Carbonate NP 902-WR 14 22 4 0 903-WR 8 12 1 0 904-WR 9 20 5 1 905-WR 10 32 8 3 906-WR 11 29 7 0 907-WR 21 14 8 2 908-WR 11 20 4 1 909-WR 15 29 6 1 911-WR 96 135 55 51 912-WR 86 156 77 64 914-WR 60 149 58 40 915-WR 159 220 128 115 916-WR 110 163 69 58 917-WR 29 63 25 16 918-WR 19 24 14 8 919-WR 40 96 35 30 920-WR 23 22 11 3 921-WR 21 22 14 9 922-WR 16 30 10 1 923-WR 9 37 10 0 924-WR 16 24 11 2 930-WR 5 6 1 0 1001-T 78 158 73 65 1002-WR 29 37 28 24 1003-WR 67 20 21 3 1004-WR 64 112 51 35 1101-WR 42 67 39 40 1102-WR 68 81 59 68 1103-WR 92 122 79 93 1104-WR 103 144 92 105 1201-T 131 228 109 131 1202-T 107 188 134 102 1203-T 84 185 108 78 1204-WR 126 192 121 149 1205-WR 37 51 42 34 1206-WR 28 103 26 25

Table 10: NP, Net NP and NP:AP ratios for the Reference Material NBM-1 obtained by different methods
Test Method NP Net NP NP:AP
(kg CaCO3/t) (kg CaCO3/t) Sobek (high fizz) 95.2 85.9 10.2 Sobek (standard fizz) 61.1 51.8 6.6 Inter-laboratory Study 42 32.7 4.5 Sobek (low fizz) 41.4 32.1 4.5 Calculated NP 36.6 27.3 3.9 Modified (end pH 1.8) 34.7 25.4 3.7 Inorganic Carbon Analysis 33.9 24.6 3.6 Modified (end pH 2.5) 30.2 20.9 3.2 Modified (end pH 3.0) 27.1 17.8 2.9 Modified (end pH 6.6) 24.0 14.7 2.6 Lapakko 15.8 6.5 1.7

APPENDIX I
Modified Acid Base Accounting Procedure
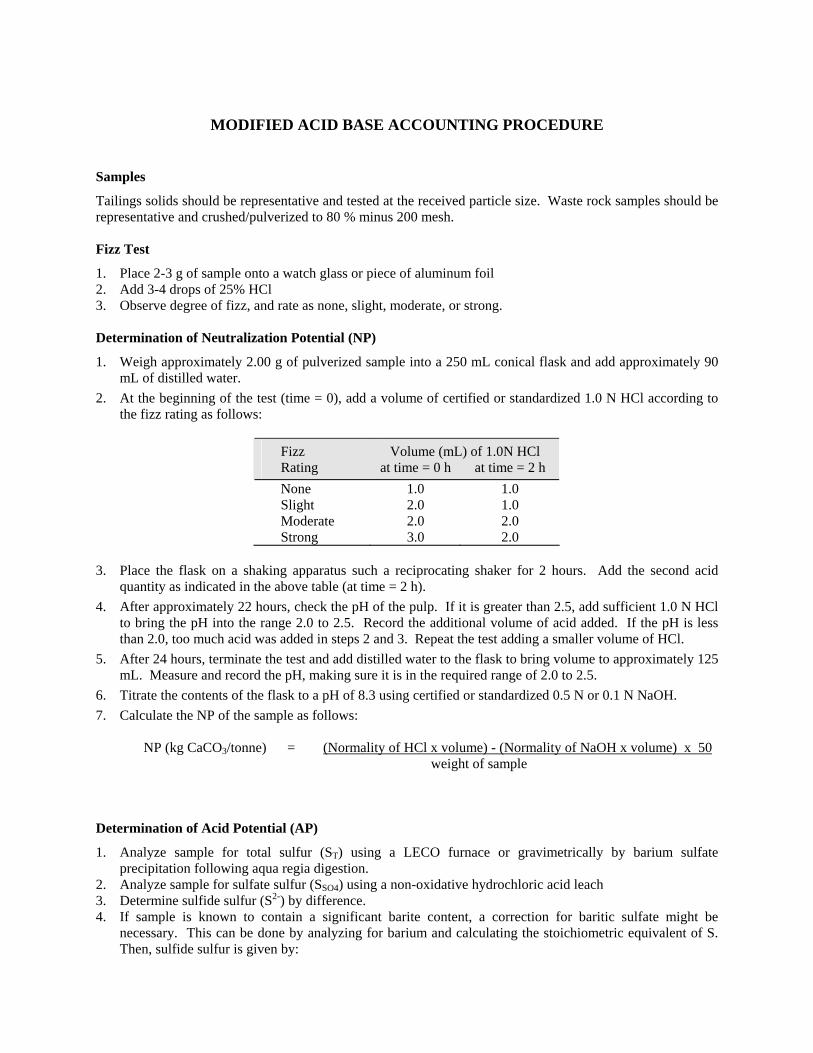
MODIFIED ACID BASE ACCOUNTING PROCEDURE
Samples
Tailings solids should be representative and tested at the received particle size. Waste rock samples should be representative and crushed/pulverized to 80 % minus 200 mesh.
Fizz Test
1. Place 2-3 g of sample onto a watch glass or piece of aluminum foil 2. Add 3-4 drops of 25% HCl 3. Observe degree of fizz, and rate as none, slight, moderate, or strong.
Determination of Neutralization Potential (NP)
1. Weigh approximately 2.00 g of pulverized sample into a 250 mL conical flask and add approximately 90 mL of distilled water.
2. At the beginning of the test (time = 0), add a volume of certified or standardized 1.0 N HCl according to the fizz rating as follows:
Fizz Volume (mL) of 1.0N HCl Rating at time = 0 h at time = 2 h None 1.0 1.0 Slight 2.0 1.0 Moderate 2.0 2.0 Strong 3.0 2.0
3. Place the flask on a shaking apparatus such a reciprocating shaker for 2 hours. Add the second acid
quantity as indicated in the above table (at time = 2 h). 4. After approximately 22 hours, check the pH of the pulp. If it is greater than 2.5, add sufficient 1.0 N HCl
to bring the pH into the range 2.0 to 2.5. Record the additional volume of acid added. If the pH is less than 2.0, too much acid was added in steps 2 and 3. Repeat the test adding a smaller volume of HCl.
5. After 24 hours, terminate the test and add distilled water to the flask to bring volume to approximately 125 mL. Measure and record the pH, making sure it is in the required range of 2.0 to 2.5.
6. Titrate the contents of the flask to a pH of 8.3 using certified or standardized 0.5 N or 0.1 N NaOH. 7. Calculate the NP of the sample as follows: NP (kg CaCO3/tonne) = (Normality of HCl x volume) - (Normality of NaOH x volume) x 50 weight of sample
Determination of Acid Potential (AP)
1. Analyze sample for total sulfur (ST) using a LECO furnace or gravimetrically by barium sulfate precipitation following aqua regia digestion.
2. Analyze sample for sulfate sulfur (SSO4) using a non-oxidative hydrochloric acid leach 3. Determine sulfide sulfur (S2-) by difference. 4. If sample is known to contain a significant barite content, a correction for baritic sulfate might be
necessary. This can be done by analyzing for barium and calculating the stoichiometric equivalent of S. Then, sulfide sulfur is given by:
S2- = [ST - SSO4 - Sbarite ] % 5. Calculate the AP of the sample as follows: AP (kg CaCO3/tonne) = % S2- x 31.25
Calculation of Net NP and NP:AP Ratio
Net NP = [ NP - AP ] kg CaCO3/tonne NP:AP Ratio = NP/AP
Reporting of Results
For each test, record the following parameters and measurements:
Sample identification/name Fizz rating Mass of sample (g) Total volume (mL) and normality of acid added pH at end of digestion Normality and volume of base added to pH 8.3 NP, AP, Net NP, NP:AP ratio
In general, it is recommended that the data necessary to construct a back titration curve is also collected by recording the volume of base added to obtain pH values of 2.5, 3.0, 3.5, 4.0, 4.5, 5.0, 6.0, and 7.0 in addition to the end point at 8.3.
References
Lawrence, R.W., Prediction of the behaviour of mining and processing wastes in the environment. In: Proc. Western Regional Symp. on Mining and Mineral Processing Wastes, ed. F. Doyle, Berkeley, California, May 30 -June 1, 1990, 115-122
Sobek, A.A. et al., Field and laboratory methods applicable to overburdens and minesoils, EPA-600/2-78-054, March 1978.
APPENDIX II
Regression Analysis of Experimental and Calculated NP Values
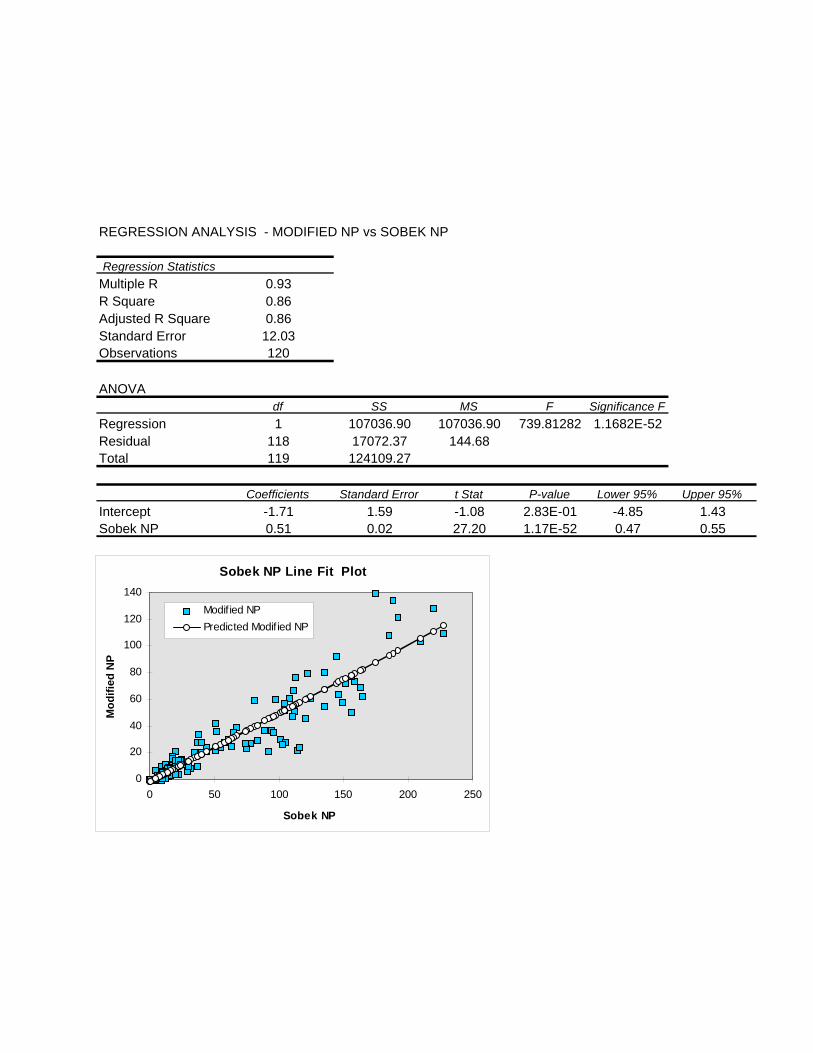
REGRESSION ANALYSIS - MODIFIED NP vs SOBEK NP
Regression StatisticsMultiple R 0.93R Square 0.86Adjusted R Square 0.86Standard Error 12.03Observations 120
ANOVAdf SS MS F Significance F
Regression 1 107036.90 107036.90 739.81282 1.1682E-52Residual 118 17072.37 144.68Total 119 124109.27
Coefficients Standard Error t Stat P-value Lower 95% Upper 95%Intercept -1.71 1.59 -1.08 2.83E-01 -4.85 1.43Sobek NP 0.51 0.02 27.20 1.17E-52 0.47 0.55
Sobek NP Line Fit Plot
0
20
40
60
80
100
120
140
0 50 100 150 200 250
Sobek NP
Mod
ified
NP
Modified NPPredicted Modif ied NP

REGRESSION ANALYSIS -CARBONATE NP vs SOBEK NP
Regression StatisticsMultiple R 0.89R Square 0.79Adjusted R Square 0.79Standard Error 14.85Observations 120
ANOVAdf SS MS F Significance F
Regression 1 97358.47 97358.47 441.66402 1.0687E-41Residual 118 26011.40 220.44Total 119 123369.87
Coefficients Standard Error t Stat P-value Lower 95% Upper 95%Intercept -5.04 1.96 -2.58 1.12E-02 -8.92 -1.17Sobek NP 0.49 0.02 21.02 1.07E-41 0.44 0.53
Sobek NP Line Fit Plot
0
20
40
60
80
100
120
140
160
0 50 100 150 200 250
Sobek NP
Car
bona
te N
P
Carbonate NPPredicted Carbonate NP

REGRESSION ANALYSIS - MODIFIED NP vs CARBONATE NP
Regression StatisticsMultiple R 0.96R Square 0.92Adjusted R Square 0.92Standard Error 9.40Observations 120
ANOVAdf SS MS F Significance F
Regression 1 113679.94 113679.94 1286.2036 2.6698E-65Residual 118 10429.32 88.38Total 119 124109.27
Coefficients Standard Error t Stat P-value Lower 95% Upper 95%Intercept 5.76 1.08 5.33 4.87E-07 3.62 7.91Carbonate NP 0.96 0.03 35.86 2.67E-65 0.91 1.01
Carbonate NP Line Fit Plot
0
20
40
60
80
100
120
140
160
0 50 100 150Carbonate NP
Mod
ified
NP
Modif ied NP
Predicted Modif ied NP

REGRESSION ANALYSIS -CARBONATE NP vs MODIFIED NP
Regression StatisticsMultiple R 0.96R Square 0.92Adjusted R Square 0.92Standard Error 9.37Observations 120
ANOVAdf SS MS F Significance F
Regression 1 113002.68 113002.68 1286.2036 2.6698E-65Residual 118 10367.19 87.86Total 119 123369.87
Coefficients Standard Error t Stat P-value Lower 95% Upper 95%Intercept -3.43 1.16 -2.96 3.74E-03 -5.73 -1.13Modified NP 0.95 0.03 35.86 2.67E-65 0.90 1.01
Modified NP Line Fit Plot
0
20
40
60
80
100
120
140
160
0 20 40 60 80 100 120 140
Modified NP
Car
bona
te N
P
Carbonate NPPredicted Carbonate NP
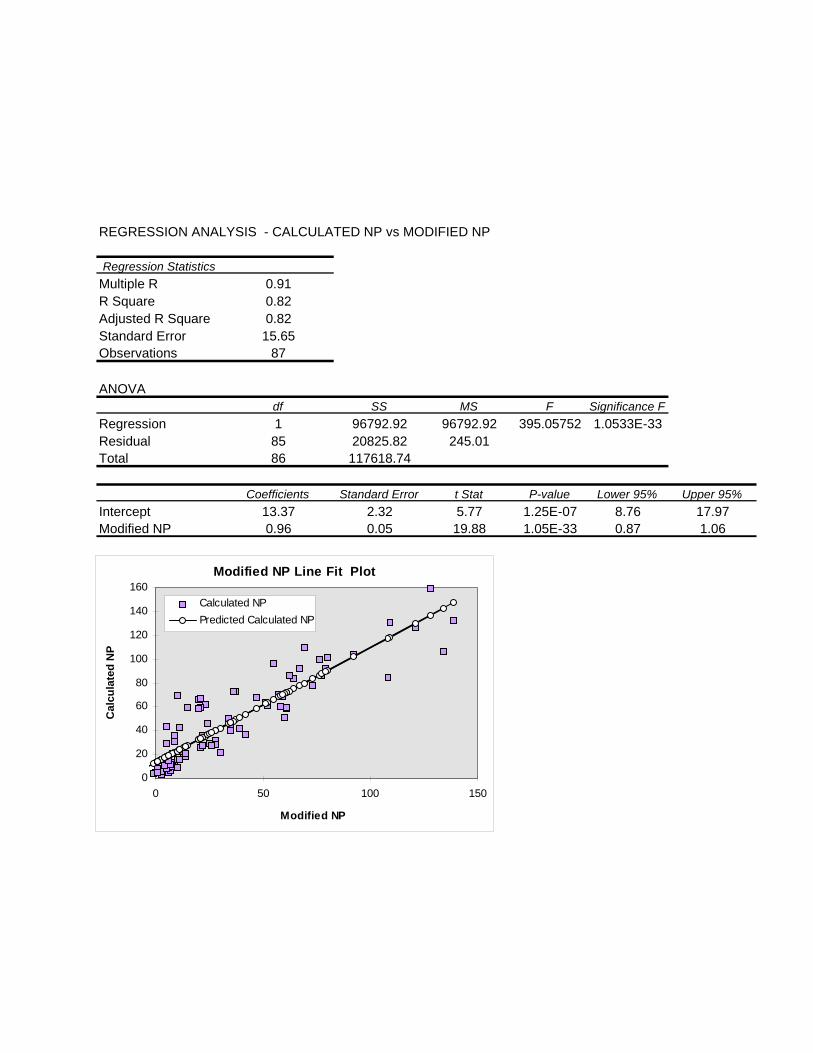
REGRESSION ANALYSIS - CALCULATED NP vs MODIFIED NP
Regression StatisticsMultiple R 0.91R Square 0.82Adjusted R Square 0.82Standard Error 15.65Observations 87
ANOVAdf SS MS F Significance F
Regression 1 96792.92 96792.92 395.05752 1.0533E-33Residual 85 20825.82 245.01Total 86 117618.74
Coefficients Standard Error t Stat P-value Lower 95% Upper 95%Intercept 13.37 2.32 5.77 1.25E-07 8.76 17.97Modified NP 0.96 0.05 19.88 1.05E-33 0.87 1.06
Modified NP Line Fit Plot
0
20
40
60
80
100
120
140
160
0 50 100 150
Modified NP
Cal
cula
ted
NP
Calculated NPPredicted Calculated NP
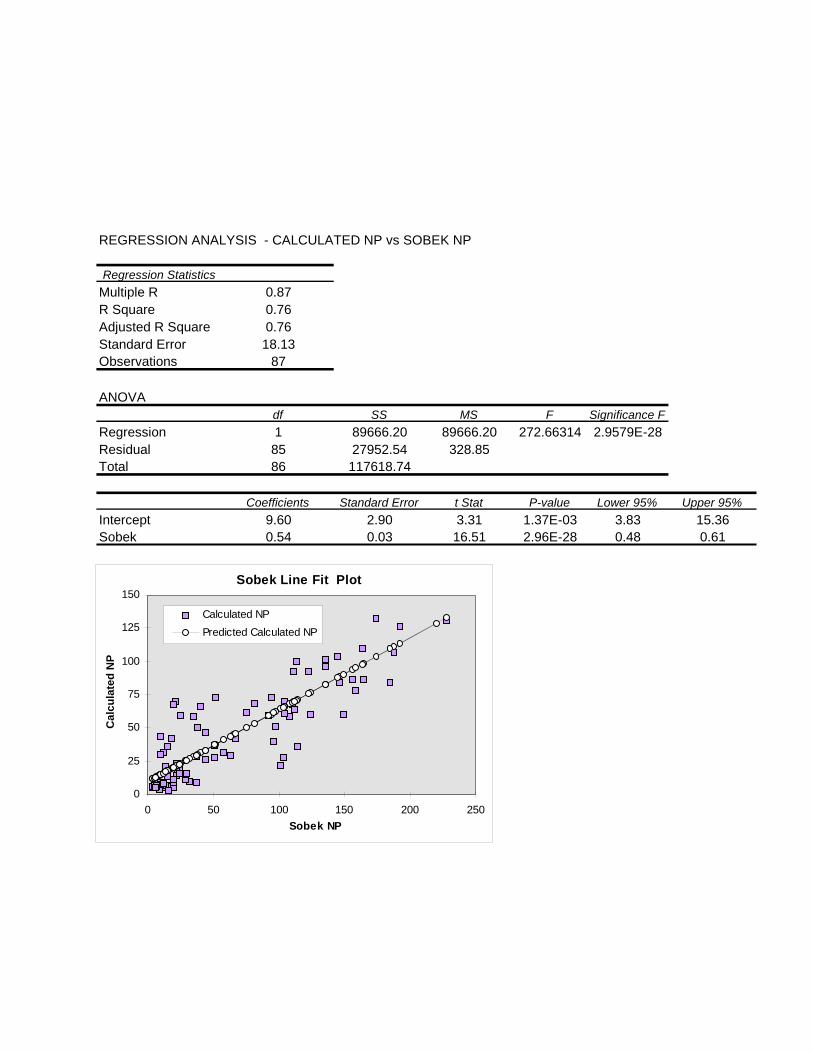
REGRESSION ANALYSIS - CALCULATED NP vs SOBEK NP
Regression StatisticsMultiple R 0.87R Square 0.76Adjusted R Square 0.76Standard Error 18.13Observations 87
ANOVAdf SS MS F Significance F
Regression 1 89666.20 89666.20 272.66314 2.9579E-28Residual 85 27952.54 328.85Total 86 117618.74
Coefficients Standard Error t Stat P-value Lower 95% Upper 95%Intercept 9.60 2.90 3.31 1.37E-03 3.83 15.36Sobek 0.54 0.03 16.51 2.96E-28 0.48 0.61
Sobek Line Fit Plot
0
25
50
75
100
125
150
0 50 100 150 200 250Sobek NP
Cal
cula
ted
NP
Calculated NPPredicted Calculated NP

APPENDIX III
Back Titration Curves for Sobek Tests

APPENDIX IV
X-ray Diffraction Data for Selected Samples
