determination of optimum cutting parameters for multiperformance characteristics in cnc end milling
DESCRIPTION
This paper presents an approach to determine the optimum cutting parameters leading to have best multiperformance in terms of lower surface roughness (quality) and higher material removal rates (quantity) simultaneously in CNC end milling of Al-Si7Mg (LM25). Conventional Taguchi method is applicable for optimizing single performance characteristics only. The grey relational analysis (GRA) coupled with Taguchi method called as grey-Taguchi method used here is useful and a very versatile statistical tool to manipulate the experimental data to have best multiperformance under various conditional requirements. Four process parameters, i.e. coolant environment, cutting speed, feed rate and depth of cut, each at three levels except the coolant at two levels, have been considered. The L18 orthogonal array best suited for such mixed levels of milling parameters is used for the experimental study. The results of confirmation tests demonstrate that grey-Taguchi method can effectively be used toTRANSCRIPT

International Journal of Engineering and Technical Research (IJETR)
ISSN: 2321-0869, Volume-1, Issue-6, August 2013
15 www.erpublication.org
Abstract— This paper presents an approach to determine the
optimum cutting parameters leading to have best
multiperformance in terms of lower surface roughness (quality)
and higher material removal rates (quantity) simultaneously in
CNC end milling of Al-Si7Mg (LM25). Conventional Taguchi
method is applicable for optimizing single performance
characteristics only. The grey relational analysis (GRA)
coupled with Taguchi method called as grey-Taguchi method
used here is useful and a very versatile statistical tool to
manipulate the experimental data to have best
multiperformance under various conditional requirements.
Four process parameters, i.e. coolant environment, cutting
speed, feed rate and depth of cut, each at three levels except the
coolant at two levels, have been considered. The L18 orthogonal
array best suited for such mixed levels of milling parameters is
used for the experimental study. The results of confirmation
tests demonstrate that grey-Taguchi method can effectively be
used to get the optimum combination of milling parameters.
Index Terms— Al-Si7Mg (LM25), CNC end milling,
grey-Taguchi, Multiperformance
I. INTRODUCTION
Milling with an end mill cutter is one of the fundamental,
major and important material removing process in case of
CNC machining. It is estimated that in average shop, milling
constitutes 28% of the total number of operations and 30% of
the total machining time. Because of its versatility, it is
efficiently used for making slots, profiles, surface
contouring, engraving, pocketing. Various factors involved
in CNC milling influence the quality of the final machined
part and its manufacturing economy. Tool materials, control
system of the machine tool and type of the tool holder, axial
capability of the machine tool and cutting parameters
(spindle speed, depth of cut, feed and cooling/lubricating
conditions) are the key factors directly affecting the surface
quality and productivity [4]. Among these factors, the cutting
parameters are suitable for any kind of modifications without
altering the current installation to meet the required demands
of surface finish, material removal rate and dimensional
accuracy. Patel [2] presented the experimental analysis on
aluminium alloy (AL 6351-T6) material with end milling
operation. Taguchi parameter design was used to optimize
the surface roughness. The final surface roughness might be
considered as the sum of two independent effects as the ideal
Manuscript received August 19, 2013. S. Y. Chavan, Department of Mechanical Engineering, Govt. College of
Engineering, Karad (MS), India.
Prof. V. S. Jadhav, Department of Mechanical Engineering, Govt.
College of Engineering, Karad (MS), India.
surface roughness is a result of the geometry of tool and feed
rate and the natural surface roughness is a result of the
irregularities in the cutting operation. Factors such as spindle
speed, feed rate, tool diameter and depth of cut that control
the cutting operation can be setup in advance [3]. It
demonstrates how to use Taguchi parameter design for
optimizing machining performance with minimum cost. In
case of end milling of aluminium alloy (A6061P-T651) the
grey-Taguchi method has been efficiently implemented to
have multiperformance in terms of surface quality and
material removal rate [6], [7].
II. EXPERIMENTAL STUDIES
A. Design of Experiments
A specially designed experimental procedure is required to
evaluate the effects of machining parameters on performance
characteristics. Conventional experimental design methods
are too complex and difficult to use. Additionally, large
numbers of experiments have to be carried out when number
of machining parameters increases. Normally, the full
factorial design would require 54 experimental runs in this
study. However, the effort could be prohibitive and
unrealistic. Here Taguchi method along with GRA used is a
powerful tool for parameter design, to determine optimal
machining parameters for minimum surface roughness and
maximum MRR in milling. The milling parameters levels
and ranges for final experimentation are decided from pilot
experimental results.
Table I shows the test matrix for various parameters
selected along with the ranges and levels for the milling
parameters. L18 orthogonal array proposed by Taguchi is the
best suitable for the study of parameters with mixed levels
and has been used for final experimentation and runs were
carried out with complete randomization.
Table I – Test matrix for experimentation.
Factor → Coolant Cutting
Speed
Depth
of cut
Feed rate
f
Level ↓
N (rpm) d (mm) (mm/rev.)
1 No (D) 4400 1.3 0.015
2 Flooded(C) 5000 2 0.03
3 - 5600 2.7 0.045
Determination of Optimum Cutting Parameters for
Multiperformance Characteristics in CNC End
Milling of Al-Si7Mg Aluminum Alloy
S. Y. Chavan, V. S. Jadhav

Determination of Optimum Cutting Parameters for Multiperformance Characteristics in CNC End Milling of
Al-Si7Mg Aluminum Alloy
16 www.erpublication.org
B. Experimental conditions, Workpiece, Tool Materials
and Measurements
Fig.1 - Schematic diagram of Experimental setup
The experimental setup for end milling of LM25 is shown
schematically in fig. 1. The experiments were performed on
vertical machining centre (BMV45 TC-24 model) having
CNC control system of FANUC series Oi-MD, as shown in
fig.2. The maximum spindle speed is of 6000 rpm, Spindle
power 5.5/7.5 kW (cont. 30 min rating) and maximum feed
rate available is 10 m/min.
Fig.2 - VMC Center BMV TC24
The work piece used for experimentation was initially in
the form of a rectangular plate of LM25 with the dimensions
420 x 120 x 20 mm as shown in fig.3. Actual chemical
composition and mechanical properties of work material are
listed in Table II. End mill cutters used for the pilot and final
experimentation are of solid carbide with TiCN coating
[WIDIA-HANITA make List 4103] which is best
recommended for machining of aluminum alloys. The cutter
is of 10 mm diameter having helix angle of 450 and has three
numbers of flutes equally spaced.
Table II- Chemical composition and mechanical
properties of work piece material
Work Material Al-Si7Mg (LM25)
Chemical composition(%wt)
91.37Al, 6.52Si, 0.33Fe, 0.99Cu, 0.18Mn,
0.31Mg, 0.08Zn, 0.01Cr, 0.02Ni, 0.09Ti,
<0.00Be, 0.02Ca, 0.01Pb, 0.01Sn, 0.02Na
Mechanical properties
Density 2.7gm/cm3, Tensile strength 150.9 N/mm
2,
Elongation after fracture 2.29%, Strength to weight ratio
0.15.
Fig.3 - Workpiece LM 25 plate fixed on m/c table before
machining
The material removal rate and surface roughness, taken as
performance characteristics were evaluated for the analysis
of multiperformance. Surface roughness (Ra) for the
experimental runs have been measured using the
HOMMEL-ETAMIC T8000 roughness tester with length of
travel equal to 3.6 mm for cut off length of 0.6 mm. The
measuring probe of tester is of TKU 300 type and the
range/resolution for surface roughness measurement is 8 µm/
1nm. The material removal rates for each experimental runs
are estimated from the basic equation giving the ratio of
material removed per unit time. The volume of material
removed is measured in mm3 and thus the MRR is expressed
in mm3/s. The experimental run details for milling the slots
are shown schematically in fig.5. Fig.4 shows the partly
machined workpiece.
The observations for material removal rates (MRR) and
surface roughness (Ra) for each experimental run of L18 array
are shown in Table III. The Run order was generated in
MINITAB 15 to have complete randomization.
Fig.4 - Workpiece LM 25 (Partly machined)
Fig.5 – End mill slot details
<.>
Workpiece
spindle
M/C Table
cutting tool
+X+Y
+Z
-Z
50
10
A= 489.27 sq.mm

International Journal of Engineering and Technical Research (IJETR)
ISSN: 2321-0869, Volume-1, Issue-6, August 2013
17 www.erpublication.org
Table III - The observations for L18 Experimentation.
Run
No Coolant
N
(rpm)
d
(mm) f
Ra
(µm)
MRR
(mm3/s)
3 D 1 1 1 0.63 13.99
17 D 1 2 2 0.65 43.06
9 D 1 3 3 0.71 87.19
13 D 2 1 1 0.6 15.90
11 D 2 2 2 0.63 48.93
6 D 2 3 3 0.70 99.08
16 D 3 1 2 0.59 35.62
12 D 3 2 3 0.70 82.20
2 D 3 3 1 0.61 36.99
18 C 1 1 3 0.45 41.98
14 C 1 2 1 0.33 21.53
5 C 1 3 2 0.47 58.13
8 C 2 1 2 0.42 31.80
10 C 2 2 3 0.44 73.39
15 C 2 3 1 0.34 33.03
4 C 3 1 3 0.39 53.43
1 C 3 2 1 0.34 27.40
7 C 3 3 2 0.36 73.98
MAX
= 0.71 99.08
MIN
= 0.33 13.99
III. GREY RELATIONAL ANALYSIS
The word grey used for indicating between black (with no
information) and white (with full and complete certain
information). In a complex system with various inter
relational parameters the grey relational analysis is used, as
the information about the inter relationship is not fully
known. When experiments are not carried out at details GRA
is useful tool to predict the multiperformance of two or more
performance characteristics. The steps that are followed in
GRA can be summarised as follows.
a] Generating comparability sequence or data preprocess- ing
(Normalization of data).
b] Deviation sequence generating.
c] Calculating grey relational coefficients for each perfor-
mance characteristics.
d] Estimation of grey relational grades from grey relational
coefficients.
The surface roughness (Ra) and material removal rate are
taken as the two performance measures in the study. Data
normalization is necessary since the ranges and units for each
performance characteristics are different. The normalized
results between 0 and 1 are easily comparable. So it is also
called as comparability sequence generating. The equation
(1) is used for normalization of surface roughness data which
is expected to be “lower the better” characteristics. The
equation (2) is used for normalizing the MRR values for
experimental runs which is expected to be “higher the better”
characteristics.
kxkx
kxkxkx
ii
iii 00
00*
minmax
max
(1)
kxkx
kxkxkx
ii
iii 00
00*
minmax
min
(2)
where, kxi
0max = maximum value of experimental data
for kth
performance characteristics kxi
0 , kxi
0min =
minimum value of same experimental data and kxi
* is the
normalized value of ith
experiment of kth
performance
characteristics. The deviation sequence can be obtained from
equation (3) for each performance characteristics.
kxkx ii
**
00 (3)
where, kx*
0 is the reference sequence and kxi
* is the
comparability sequence and Δ0i is the deviation sequence
value obtained for ith
experimental run. The grey relational
coefficient for ith
experimental run of kth
performance
characteristics is calculated from equation (4).
max0
maxmin
kk
i
i (4)
where, ζ = distinguishing coefficient (normally=0.5)
kxkx jkij
**
0min minmin
(5)
kxkx jkij
**
0max maxmax
(6)
In real engineering application the emphasis on various
performance measures is different. This can be achieved by
giving different relative weights (wk) given for each
performance measure to calculate grey relational grade. The
equation (7) is the general form to calculate the grey
relational grade. Table IV shows the comparability and
deviation sequence for measured Ra and MRR for each
experimental run.
n
k
n
i
kiki wkwn 1 1
1,1
(7)
Table IV - The sequence after data pre and post processing
Sr.
No.
Run
no.
Comparability
sequence xi*(k)
Deviation sequence
Δ0i = ΙΙx0*(k) - xi*(k)ΙΙ
Ra MRR Ra MRR
1 3 0.211 0.000 0.789 1.000
2 17 0.158 0.342 0.842 0.658
3 9 0.000 0.860 1.000 0.140
4 13 0.289 0.022 0.711 0.978
5 11 0.211 0.411 0.789 0.589
6 6 0.026 1.000 0.974 0.000
7 16 0.316 0.254 0.684 0.746
8 12 0.026 0.802 0.974 0.198
9 2 0.263 0.270 0.737 0.730
10 18 0.684 0.329 0.316 0.671
11 14 1.000 0.089 0.000 0.911
12 5 0.632 0.519 0.368 0.481
13 8 0.763 0.209 0.237 0.791
14 10 0.711 0.698 0.289 0.302
15 15 0.974 0.224 0.026 0.776
16 4 0.842 0.463 0.158 0.537
17 1 0.974 0.158 0.026 0.842

Determination of Optimum Cutting Parameters for Multiperformance Characteristics in CNC End Milling of
Al-Si7Mg Aluminum Alloy
18 www.erpublication.org
18 7 0.921 0.705 0.079 0.295
IV. RESULTS AND DISCUSSIONS
Fig.6 –Main Effect plot - milling parameters on Ra
Fig. 6 presents the main plots for data means of Ra
showing the effect of each milling parameter on surface
roughness. The lower surface roughness can be obtained by
setting the milling parameters as N3, d1, f1 and C (flooded
coolant).The surface roughness decreases as there is
increment in cutting speed (N), while feed rate and depth of
cut have direct relation with Ra. Also it can be seen from
main plots that feed rate has more influence on Ra as
compared to cutting speed and depth of cut.
The influence of selected cutting parameters on surface
roughness have been assessed with the help of analysis of
variance (ANOVA) applied for data means for surface
roughness values obtained in L18 experimental runs. Table V
presents the ANOVA result which shows that the surface
roughness is most affected by coolant environment (C/D)
followed by feed rate (f), and cutting speed (N). The depth of
cut (d) is having least significance on Ra. Fig.7 presents the
% contributions by C, f, N, d on surface roughness as 87.88,
7.40, 1.58, and 0.37 respectively.
The preprocessed (normalized) results along with
experimental observations are shown in Table IV. Higher the
better and lower the better characteristics equations are used
for MRR and Ra respectively to get comparability sequence
xi*(k). The deviation sequence (Δ0i) is generated by taking
reference sequence (x0*(k)) equal to 1, for both Ra and MRR.
The grey relational coefficients are calculated with
distinguishing coefficient value ζ = 0.5 which is most
generally used.
Table V - ANOVA for surface roughness (Ra) (L18)
Source DOF SS MS (V) F-Ratio Prob.
Coolant 1 0.2888 0.2888 319.7 0.000
N (rpm) 2 0.0052 0.0026 2.90 0.102
d (mm) 2 0.0012 0.0006 0.68 0.527
f
(mm/rev
)
2 0.0243 0.0122 13.45 0.001
Error 10 0.0090 0.0010
Total 17 0.3286
F0.05,2,10 = 4.10 (F-test TABLE VALUE)
Fig.7 – Effect of milling parameters on Ra
A. Equal weights for Ra and MRR (w1=w2=0.5)
Fig.8 - Grey relational grades
Fig.8 (refer appendix Table VIII) shows the grey relational
grades obtained for each experimental run. The results with
equal weights are plotted as per run number. It is seen that the
run no.7 has the highest grey relational grade value of 0.3731
indicating the best multiperformance in terms of lower Ra
and higher MRR. Thus the initial optimum parameters setting
given by run no 7 are C, N3, d3, f2 (see Table III). Further the
Taguchi analysis for average grey relational grades at
different levels are plotted in fig. 9 indicating the optimum
setting of parameters for multiperformance as C, N3, d3, f3.
Fig.9 - Grey grade (means) for milling parameters levels
21
0.6
0.5
0.4
321
321
0.6
0.5
0.4
321
Coolant
Me
an
of
Me
an
s
N (rpm)
d (mm) f (mm/rev)
Main Effects Plot for Means (Ra)Data Means
0
10
20
30
40
50
60
70
80
90
C N d f
87.88
1.58 0.377.4
contr
ibution →
Source →
% P
0.3731
0.15
0.21
0.27
0.33
0.39
0.45
3 17 9 13 11 6 16 12 2 18 14 5 8 10 15 4 1 7
gre
y g
rad
e →
Run no→
w1=w2=0.5
0.16
0.18
0.2
0.22
0.24
0.26
0.28
0.3
0.32
D C N1 N2 N3 d1 d2 d3 f1 f2 f3
gre
y gra
de →
w1= w2=0.5
International Journal of Engineering and Technical Research (IJETR)
ISSN: 2321-0869, Volume-1, Issue-6, August 2013
19 www.erpublication.org
Table VI - Comparison between GRA and grey-Taguchi
for grey grade prediction (L18)
w1=w2=0.5
Optimum
by
mere GRA
Grey-Taguchi
prediction
Confir-
mation
Parameter
setting C, N3, d3, f2 C, N3, d3, f3 C, N3, d3, f3
Ra (µm) 0.36
0.44
MRR
(mm3/s)
73.978
110.966
Grey grade 0.3731 0.3741 0.5053
Improvement in grade by 0.1322, MRR by
36.988(mm3/s)
Table VI enumerates the comparative results obtained for
optimum parameter setting given by mere GRA and
grey-Taguchi method. It is seen that there is improvement in
Grey relational grade from 0.3731 to 0.5053 and increase in
MRR from 73.978 to 110.966 mm3/s. Here justification for
level f3 can be given as; i) equal weights for Ra and MRR. ii)
f3 favours the higher MRR and the surface roughness of
0.44µm is much smaller compared with the Ra obtained with
dry milling runs in L18 array.
B. Unequal weights (wRa=0.65, wMRR=0.35)
Fig.10 - Grey relational grades
The effect of relative unequal weights has been analyzed
giving more weight for Ra as compared to MRR. With the
given weights the optimum setting of milling parameters for
best multiperformance by mere GRA prediction remains
same i.e. run no. 7 as best with grey relational grade = 0.3907
(fig.10). But the grey-Taguchi analysis for grades gives the
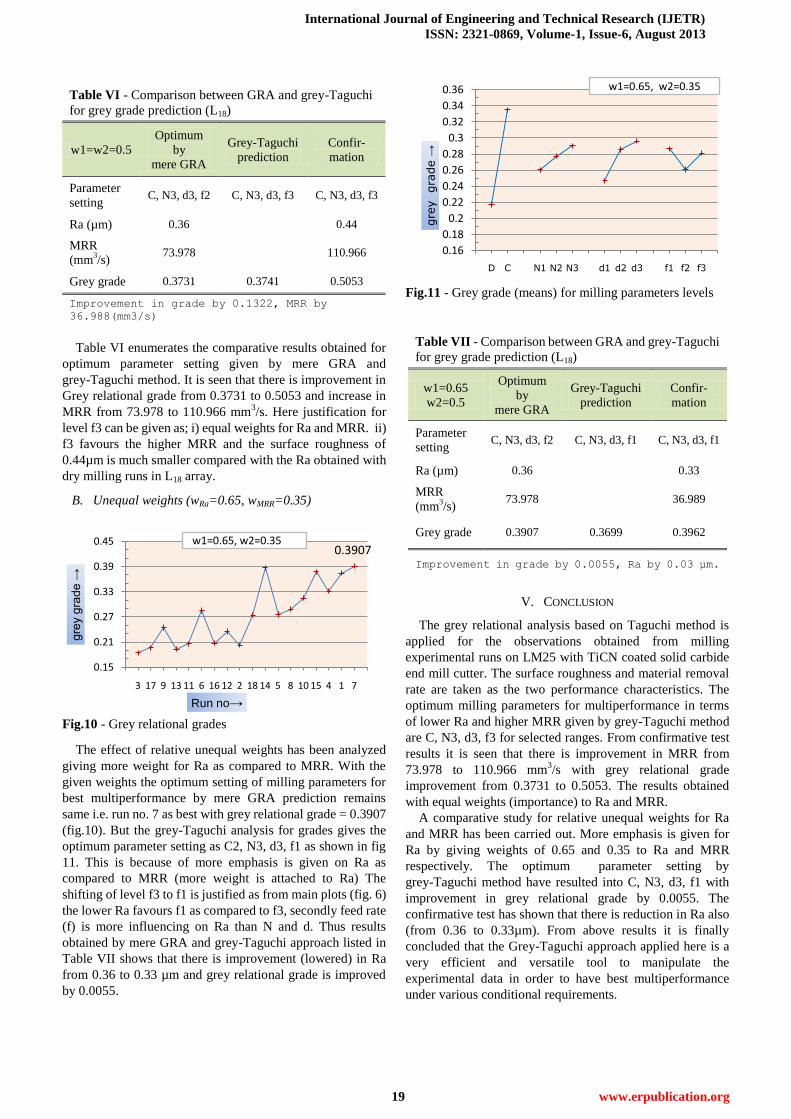
optimum parameter setting as C2, N3, d3, f1 as shown in fig
11. This is because of more emphasis is given on Ra as
compared to MRR (more weight is attached to Ra) The
shifting of level f3 to f1 is justified as from main plots (fig. 6)
the lower Ra favours f1 as compared to f3, secondly feed rate
(f) is more influencing on Ra than N and d. Thus results
obtained by mere GRA and grey-Taguchi approach listed in
Table VII shows that there is improvement (lowered) in Ra
from 0.36 to 0.33 µm and grey relational grade is improved
by 0.0055.
Fig.11 - Grey grade (means) for milling parameters levels
Table VII - Comparison between GRA and grey-Taguchi
for grey grade prediction (L18)
w1=0.65
w2=0.5
Optimum
by
mere GRA
Grey-Taguchi
prediction
Confir-
mation
Parameter
setting C, N3, d3, f2 C, N3, d3, f1 C, N3, d3, f1
Ra (µm) 0.36
0.33
MRR
(mm3/s)
73.978
36.989
Grey grade 0.3907 0.3699 0.3962
Improvement in grade by 0.0055, Ra by 0.03 µm.
V. CONCLUSION
The grey relational analysis based on Taguchi method is
applied for the observations obtained from milling
experimental runs on LM25 with TiCN coated solid carbide
end mill cutter. The surface roughness and material removal
rate are taken as the two performance characteristics. The
optimum milling parameters for multiperformance in terms
of lower Ra and higher MRR given by grey-Taguchi method
are C, N3, d3, f3 for selected ranges. From confirmative test
results it is seen that there is improvement in MRR from
73.978 to 110.966 mm3/s with grey relational grade
improvement from 0.3731 to 0.5053. The results obtained
with equal weights (importance) to Ra and MRR.
A comparative study for relative unequal weights for Ra
and MRR has been carried out. More emphasis is given for
Ra by giving weights of 0.65 and 0.35 to Ra and MRR
respectively. The optimum parameter setting by
grey-Taguchi method have resulted into C, N3, d3, f1 with
improvement in grey relational grade by 0.0055. The
confirmative test has shown that there is reduction in Ra also
(from 0.36 to 0.33µm). From above results it is finally
concluded that the Grey-Taguchi approach applied here is a
very efficient and versatile tool to manipulate the
experimental data in order to have best multiperformance
under various conditional requirements.
0.3907
0.15
0.21
0.27
0.33
0.39
0.45
3 17 9 13 11 6 16 12 2 18 14 5 8 10 15 4 1 7
gre
y g
rad
e →
Run no→
w1=0.65, w2=0.35
0.16
0.18
0.2
0.22
0.24
0.26
0.28
0.3
0.32
0.34
0.36
D C N1 N2 N3 d1 d2 d3 f1 f2 f3
gre
y gra
de →
w1=0.65, w2=0.35

Determination of Optimum Cutting Parameters for Multiperformance Characteristics in CNC End Milling of
Al-Si7Mg Aluminum Alloy
20 www.erpublication.org
APPENDIX
Table VIII – Grey relational grades and ranks for various weights combinations L18
Run
no.
grey relational
coefficient
grey relational grade
γi =1/n ∑ wi .ζi*(k)
Ra MRR w1=w2=0.5 Rank w1,w2 (0.65,0.35) Rank
3 0.3878 0.3333 0.1803 18 0.1844 18
17 0.3725 0.4316 0.2010 16 0.1966 16
9 0.3333 0.7816 0.2787 8 0.2451 11
13 0.4130 0.3384 0.1879 17 0.1935 17
11 0.3878 0.4590 0.2117 13 0.2063 14
6 0.3393 1.0000 0.3348 4 0.2853 8
16 0.4222 0.4013 0.2059 14 0.2075 13
12 0.3393 0.7159 0.2638 11 0.2356 12
2 0.4043 0.4066 0.2027 15 0.2025 15
18 0.6129 0.4270 0.2600 12 0.2739 10
14 1.0000 0.3542 0.3386 2 0.3870 2
5 0.5758 0.5095 0.2713 9 0.2763 9
8 0.6786 0.3874 0.2665 10 0.2883 7
10 0.6333 0.6235 0.3142 6 0.3149 6
15 0.9500 0.3918 0.3354 3 0.3773 3
4 0.7600 0.4824 0.3106 7 0.3314 5
1 0.9500 0.3725 0.3306 5 0.3739 4
7 0.8636 0.6289 0.3731 1 0.3907 1
confirmation
0.5053
0.3962
C,N3,d3,f3
C,N3,d3,f1
A. Calculation of Grey Relational Grade
Sample calculation for run no. 7
1) Comparability sequence / Data preprocessing/
Normalization
For lower the better characteristics (Ra)
kxkx
kxkxx
ii
ii
00
00*
7minmax
max1
From Table III 71.0max 0 kxiand 33.0min 0 kxi
and 36.01*
7 x
92105.033.071.0
36.071.01*
7
x
2) Deviation sequence (Δ0i)
kxkx ii
**
00
where, kx*
0 =1 (reference sequence)
07894.092105.0107
3) Grey relational coefficient
max0
maxmin
kk
i
i
where, ζ = 0.5 (std. value)
kxkx jkij
**
0min minmin
011min
kxkx jkij
**
0max maxmax
101max
86364.015.007894.0
15.0017
4) Grey relational grade (for w1=w2=0.5)
n
k
iki kwn 1
1
37314.06289.05.086364.05.02
17
Grey coefficient for MRR= ξ7 (2) can be calculated in
similar way. It is further used to estimate grey relational
grade. From Table VIII it is = 0.6289.
B. Calculation for Grey-Taguchi grade prediction ( ̂ )
q
i
mim
1
ˆ where, γm = Total mean grey grade
and i = mean grey grade at optimum level of ith
parameter
From table IX, 281.0,311.0 21
270.0,294.0,299.0 43 mand
374.0ˆ

International Journal of Engineering and Technical Research (IJETR)
ISSN: 2321-0869, Volume-1, Issue-6, August 2013
21 www.erpublication.org
Table IX – Response table for grey relational grade
Means
Level coolant N(rpm) d(mm) f
(mm/rev)
1 0.230 0.255 0.236 0.263
2 0.311 0.276 0.277 0.255
3 - 0.281 0.299 0.294
Delta 0.081 0.026 0.063 0.039
rank 1 4 2 3
REFERENCES
[1] Kantheti V. K, Raju M, Janardhana G. R., Kumar P. N. and Rao V. D.”Optimization of Cutting Conditions for Surface Roughness in CNC
End Milling”. International journal of precision engineering and
manufacturing vol. 12, no. 3, June 2011 / 383, 383-391 [2] Patel K. P., “Experimental Analysis On Surface Roughness Of CNC
End Milling Process Using Taguchi Design Method”, International
Journal of Engineering Science and Technology (IJEST) ISSN: 0975-5462 Vol. 4 No.02 February 2012
[3] Choubey A, Chaturvedi V, Jyoti V,” The Implementation Of Taguchi
Methodology For Optimization Of End Milling Process Parameter Of Mild Steel”, International Journal of Engineering Science and
Technology (IJEST) ISSN: 0975-5462 Vol. 4 No.07 July 2012
[4] Routara B. C., Bandyopadhyay A., Sahoo P.,” Roughness modelling and optimization in CNC end milling using response surface method:
effect of work piece material variation”, Int J Adv Manuf Technol
(2009) 40:1166–1180 [5] Patel K, Batish A, Bhattacharya A,” Optimization of surface roughness
in an end-milling operation using nested experimental design” Prod.
Eng. Res. Devel. (2009) 3:361–373 [6] Tsao C.C., ”Grey-Taguchi method to optimize the milling parameters
of aluminium alloys”, Int J. Int J. Adv Manuf Technol (2009) 46:41–48
[7] Goel P, Khan Z A, Siddiquee A N, Kamaruddin S, Gupta R.K., “Influence of slab milling process parameters on surface integrity of
HSLA: a multi-performance characteristics optimization”, Int J Adv
Manuf Technol (2012) 61:859–871 [8] Montgomery D. C., ”Design and analysis of Experiments”, John
Willey and Sons, Inc. Delhi.(2001)
S. Y. Chavan, PG Scholar, Department of Mechanical Engineering, Government College of Engineering Karad, Maharashtra, INDIA.
Prof. V. S. Jadhav, M.E. Mech (Design), Faculty and P.G. coordinator,
Department of Mechanical Engineering, Government College of Engg., Karad, Maharashtra, INDIA. LMISTE, LMISTD.