determination of pre/post process surface roughness … · determination of pre/post process...
TRANSCRIPT

Determination of pre/post process surface roughness and comparison with copper film
adhesion on multiple polymer substrates
Prepared by Martin AguileraWork supported by the Packaging Research Center at Georgia Tech

Motivation
EU Directive Restrict lead-based solder by July 1, 2006
Companies given exceptions
Effect on manufacturingHigher solder temperaturesCTE considerationLayer adhesion

Scope of Project
Board polymer researchBoards provided by Company A for chemical copper coating Boards returned to Company A for adhesion testing (Peel Strength Test)
Board surface roughnessTested before copper coating allowing comparison to peel strength

Scope of Project
Two types of roughness:Micro-roughness (~100 Å)Macro-roughness (>1000 Å)
Examine which type of roughness is most affected by chemical roughening process
Correlation between types of roughness for each board and peel strength
To determine which, if either, is the dominant mode for adhesion
Adhesion Theory
Two main modes of adhesionChemical
Based on oxide formation
Mechanical Based on surface energy reduction

Adhesion Theory
Epoxy chemical structure
Oxygen group allows for oxide formation and chemical bond
Adhesion is based on surface area
Generic epoxy
Copper film

Adhesion Theory
Mechanical AdhesionSurface Energy
Asymmetry of chemical bondsAdditional layer relieves surface energy (bonding)
Adhesion is based on surface roughness and area

Expected Results
Chemical process is expected to increase micro-roughness more due to scale of reaction
Both types of adhesion depend on surface areaBoards with a higher surface roughness will have a higher peel strength
Both types of roughness increase surface areaIt is unclear which type of roughness will correlate with peel strength better

Methods: Sample Preparation
4 types of 5x5” boards (2 per type)1 board of each type set aside
Placed in Atotech Permanganate Etch
1x5” section cut Set aside as post process1x4” section set to Company A
4x5” boards were plated with electroless copper film (~1µm)
Boards were plated with electrolytic copper (~18µm)
4x5” Full Plating
1x4” Post Process
1x1” Post Process
5x5” Full Board

Methods: Sample Preparation
Dupont photoresist film was applied and developed according to peel test pattern
Copper was etched off and samples were sent back to Company A for testing

Methods: Sample Testing
All un-plated board surface roughness measurements made with Veeco DekTak 3030
Surfaces were taped to platform and leveled
DekTak function used to determine surface roughness
Deviation from a linear approximation between two selected points

Methods: Sample Testing
Micro-roughness was determined over a 5 micron range
Macro-roughness was determined over a 315 micron range
5 locations were averaged to determined the board roughness
7 trials were performed at each location

Methods: Peel Test
Samples of plated board and post-process boards were sent to Company A
Peel Strength Tests were performedMacro-scale surface roughness was performed over a 215x315 micron area using AFM
Company A returned data for analysis
Results:Effect on macro-roughness
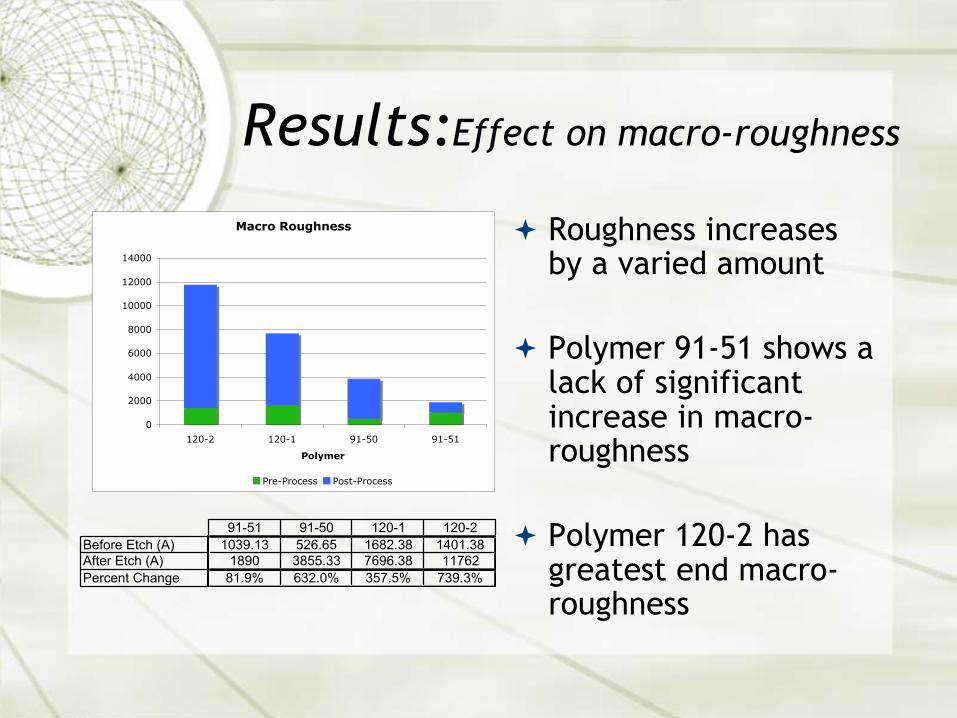
91-51 91-50 120-1 120-2Before Etch (A) 1039.13 526.65 1682.38 1401.38After Etch (A) 1890 3855.33 7696.38 11762Percent Change 81.9% 632.0% 357.5% 739.3%
Roughness increases by a varied amount
Polymer 91-51 shows a lack of significant increase in macro-roughness
Polymer 120-2 has greatest end macro-roughness
Macro Roughness
0
2000
4000
6000
8000
10000
12000
14000
120-2 120-1 91-50 91-51
Polymer
Pre-Process Post-Process

Results: Effect on micro-roughness
Micro Roughness
0
50
100
150
200
250
300
120-2 120-1 91-50 91-51
Polymer
Pre-Process Post-Process
91-51 91-50 120-1 120-2Before Etch (A) 88.56 93.54 102.96 109.18After Etch (A) 147.48 138.9 180.08 238.18Percent Change 66.5% 48.5% 74.9% 118.2%
Smaller percentage in micro-roughness
Similar increases across polymers
Polymer 120-2 has greatest end micro-roughness

Results:Correlation to Peel StrengthPeel Strength
0
0.5
1
1.5
2
2.5
100 125 150 175 200 225 250
Micro-roughness (x10-10m)
91-50
120-1
120-2
91-51
Peel Strength
0
0.5
1
1.5
2
2.5
0 2500 5000 7500 10000 12500
Macro-roughness (x10-10m)
91-50
120-1
120-2
91-51Macro (A) Micro (A) Peel Strength (lbf/in)
120-2 8990 238.18 1.908120-1 7680 180.08 2.17691-50 2510 138.9 1.6691-51 1890 147.48 0.469
Peel strength shows a stronger correlation with macro-roughness than micro-roughness
Polymer 91-51 shows significantly smaller peel strength
Polymers 120-1 & 2 have greatest peel strength

Error
Board 91-51Deciding board for resultsOriginally had a decrease in macro-roughness with etchingContained two distinct roughness sections
Measuring techniquesAFM vs. DekTakSurface roughness vs. surface area

Future Work
Six more samples are being tested in the next few weeks
Improvement of micro/macro definitions to line up with current theory
Investigate whether micro or macro-roughness has a larger effect on surface area

Effect on Classroom: Lesson
Lesson based on understanding statistical significance of data
Students will learn statistical conceptsStandard DeviationConfidence IntervalsSample Sizing
Students will learn to use Excel

Effect on Classroom: Lesson
Data collected as a class will be used to establish formulae and procedures
Measuring height using a 12” ruler Use varying values to motivate question of how we know when to stop taking data

Effect on Classroom: Lesson
In class lab Students collect dataStudents hand calculate values for small set of dataStudents use Excel to calculate values for a larger set of data from lab
Two assessmentsSmall worksheet with questions after classroom workExcel spreadsheet with data to evaluate and electronic submission

ReferencesRF Saraf, JM Roldan, T Derderian, “Tailoring the surface morphology of polymide for –improved adhesion,” IBM Journal of Research Development, vol. 30, no. 4 pp. 441-455, 1994
Wikipedia, “Epoxy”, http://en.wikiedia.org/wiki/Epoxy, (accessed July 21st, 2006)
CP Wong, “Chemical and Mechanical Adhesion Mechanisms of Sputter-Deposited Metal on Epoxy Dielectric for High Density Interconnect Printed Circuit Boards,” IEEE Transactions on Components of Packaging Technologies, vol. 24, no. 3, pp. 416-424, 2001
Wikipedia, “Surface Roughness”, http://en.wikipedia.org/wiki/Surface_energy, (accessed July 21st, 2006)
DE Packham, “The mechanical Theory of Adhesion – a seventy year perspective and its current status” http://staff.bath.ac.uk/mssdep/dep70yrs.htm, (accessed July 21st, 2006)

Questions