determination of the optimum concentration of polyethylene
TRANSCRIPT

วารสารผลิตกรรมการ เกษตรJOURNAL OF AGRICULTURAL P R O D U C T I O N
Determination of The Optimum Concentration of
Polyethylene Glycol 6000 for In-house Maize Seedling
Screening System Against Osmotic Stress
Pattama Hannok1* Kanyakon Ruangjam2 Natthanun Chantamit1 Nasma Donlaman1
Kamolrat Boonmawat1 and Pischanan Lowantha1
1 Division of Agronomy, Faculty of Agricultural Production, Maejo University, Chiangmai 502902 Division of Horticulture, Faculty of Agricultural Production, Maejo University, Chiangmai 50290
* Corresponding author: [email protected]
(Received: 9 July 2021; Revised: 25 July 2021; Accepted: 10 August 2021)
AbstractOne of the breeding strategies to shorten a breeding process is selecting on early
growth stage with correlated secondary traits. In vitro screening method with Polyethylene glycol 6000 is widely used due to it is more controllable and convenience for inducing osmotic stress to plants. Our In-house screening system was used to find the proper concentration of PEG solution on maize seedling which was the objective of this study. The experiment was conducted in Factorial in RCBD with 2 blocks. The first factor was 7 different concentrations of PEG solution in which caused different osmotic potentials of solution. Whereas the second factor was 4 maize varieties: 2 inbred lines and 2 commercial hybrid varieties. Maize seedlings were treated with the protocol of in-house screening system and were collected for 10 phenotypic traits. The results showed the significant effects of PEG 6000 concentration, maize variety and their interaction on many traits. Moreover, it was found that PEG concentrations that causes statistical changes of treatment means when compared with its control (0% PEG) were different at each trait. For example, the proper concentration was 20% PEG for root to shoot ratio while that of the other traits was different. However, PEG of 25% was recommended for being the effective concentration since this level of stress showed the statistical effect on 8 out of
J. Agri. Prod. 69ว. ผลิตกรรมการเกษตร 3(2):69-84

10 traits. However, in case that a list of phenotypic traits might be changed, the effective PEG concentration for the new list of phenotypic traits should be re-considered. In addition, this study showed that two characteristics, shoot area and primary root length, which were extracted from image processing, shoot area showed strong relationship with leaf greenness (-0.42), shoot weight (0.93), root weight (0.63), total fresh weight (0.89), shoot dry weight (0.66) and root to shoot ratio (-0.50). Therefore, it is another interesting trait that might be used in seedling screening because it was easy to extract from the image processing whereas primary root length contrarily had weak correlation with the other 9 traits of seedlings.Keywords: In vitro screening method, osmotic potential, image analysis, early growth stage selection
IntroductionCrop breeding for abiotic stress
tolerance is a challenging work for plant breeders. Genetic improvement of phenotypic traits contributing drought tolerance is laborious and time-consuming. In order to shorten time of the breeding process, integrated selection strategies need to be considered i.e., selecting before flowering time to reduce the unnecessarily numbers of cross, implementing indirect selection through secondary traits, selecting on early growth stage of plants and so on. Critically, it is essential that those secondary traits need to correlate with primary traits so that selection process is efficient. For early growth stage selection, it occurs during plant establishment and is generally conducted under controlled environment.
Association between seedling vigor and its tolerance to drought stresses have been studying in many species i.e., maize (Ramzan et al., 2019, Akinwale et al., 2018), sorghum (Bibi et al., 2012), wheat (Dhanda et al., 2004), soybean (Kim et al., 2001), cotton (Basal et al., 2005) and so on. For example, Akinwale et al. (2018) studied the responses of different maize hybrid varieties under drought at seedling stage. Their results revealed some traits at seedling stage i.e., fresh shoot biomass, total fresh biomass, moisture content of root etc., should be included in selection index for drought tolerance. Moreover, Salungyu et al. (2020) also suggested that primary root length of maize seedling is the predictive trait for mature maize performance in the field. For selection on early growth stage, in vitro screening method is widely used
J. Agri. Prod.70 ว. ผลิตกรรมการเกษตร 3(2):69-84

due to it is more controllable and convenience. Since osmotic adjustment is a desirable trait for selecting genotypes with drought tolerance (Bolaños and Edmeades, 1991), therefore various types of in vitro screening system for drought tolerance have been inventing for screening germplasm and breeding population. Many different cultivations system by using Polyethylene Glycol 6000 have been reporting in drought tolerant screening, i.e., wheat (Marcinska et al., 2012), maize ( Mohammadkhani and Heidari, 2008), sorghum ( Bibi et al., 2012), rice (Wani et al., 2010; Biswas et al., 2002), soybean ( Sakthivelu et al., 2008), potato ( Anithakumari., et al 2011) and so on. Also, different organs of plants i.e., seed, callus, seedling etc., have been using in this type of research.
Polyethylene glycol (PEG 6000) is the hydrophilic polymers (H(OCH2CH2)nOH) with broad range of molecular weight (200-10,000). PEG with higher molecular weights (>4000) cannot penetrate to the plant cells. This leads osmotic potential of solution increases. With this qualification, PEG of high molecular weight could induce plant water deficit. Therefore, PEG 6000 is considered as an osmotic agent and likely used in many studies about plant responses under osmotic/water stresses. However, osmotic potential could be changed with increasing of PEG 6000 concentration and changing of
solution temperature ( Michel and Kaufmann, 1973). Therefore, the PEG 6000 concentration that could induce osmotic stress to plants is a criterion. Michel and Kaufmann, 1973 proposed the equation for evaluating osmotic potential (Ψs) from different concent ra t ions o f PEG 6000 and temperatures. However, many publications have been reporting about osmotic potential only for few traits in which they focused. That strategy might not be effective for plant breeding works due to plant breeders need to consider many traits simultaneously in order to select the supe rior genotypes. Hence, this study aimed to find the proper concentration of PEG 6000 solution for using in our in-house screening system, which is simple, cheap and rapid system. Moreover, this system has no requirement for nutrient culture and expensive instruments.
Materials and MethodsExperimental design
The experiment was designed by using Factorial in Randomized complete block with 2 blocks and the hidden 3 replications in each block. The first factor was maize variety, which were two commercial hybrid field corn and waxy corn and two field maize inbred lines (Takfa 1 and Takfa 3). For the second factor, it was 7 different concentrations of PEG 6000 solution e.g., 0, 5, 10, 15, 20, 25 and 30% w/v. Two blocks
J. Agri. Prod. 71ว. ผลิตกรรมการเกษตร 3(2):69-84

were conducted in consecutive periods of time. In total, 168 experimental units were included in this experiment.
In-house screening system Maize seeds were soaked in distilled
water for 24 hours for imbibition and subsequently transferred to a moist germination paper for 48 hours until radicle was observed. In order to receive the uniform growth speed, seeds with the radicle length in range of 5-8 millimeters were taken (Figure 1A) and wrapped with a piece of sponge sheet by letting the radicle protrudes (Figure 1B and 1C). For this step, it is important to avoid damaging the radicle. A piece of Styrofoam that fit well with the container was prepared in advance to have 5 holes with 2.5 centimeters in diameter and hole spacing of 2.5 centimeters. Then, inserting those wrapped seeds into the round cut Styrofoam as shown in Figure 1D. Styrofoam used in this study fit well with the 1-Litre beaker (10.5 centimeters in diameter), in which contained with 500 millimeters of distilled water. Then, placing all beakers under LED grow lights (Figure 1D) for 5 days at 16/8 light/dark cycle until reaching V4 leaf stages. The LED light used in this current experiment consists of 12-blue, 22-red, 2-white, 2-infrared and 2-UV LEDs (30 watts). After that, water in the beaker was replaced with PEG 6000 solution
with desired concentration. Maize seedlings were grown in PEG 6000 solution for 48 hours under the same light condition. After 48 hours of PEG 6000 immersion, all phenotypic traits were collected. This in vitro screening system has taken 10 days for completing the whole process.
Preparation of Polyethylene glycol 6000For osmotic stress induction, PEG 6000
with different concentrations (0, 5, 10, 15, 20, 25 and 30%) were prepared from 500 gram.kilogram-1 PEG 6000 stock solution. Three hundred milliliters of PEG 6000 solution with the desired concentration were used and replaced into a cultivation container (1-Litre beaker) as described above. Osmotic potentials for those 7 different PEG concentrations were 0 , -0.45, -1.38, -2.78, -4.65, -6.99 and -9.80 MPa, respectively. These values were calculated by using mathematical model of Michel and Kaufmann, 1973 as shown below.
Ψs = -[(1.18x10⁻²) CPEG 6000] – [(1.18x10⁻⁴) CPEG
60002 ] + [(2.67x10⁻⁴) CPEG 6000T] +
[(8.39x10⁻⁷) CPEG 60002T]
Where CPEG 6000 is concentration of PEG 6000 in gram.kilogram-1 H2O and T is solution temperature in degree Celsius.
J. Agri. Prod.72 ว. ผลิตกรรมการเกษตร 3(2):69-84

Figure 1 Process of in-house maize screening system against osmotic stress
A
C
E
G
B
D
F
H
J. Agri. Prod. 73ว. ผลิตกรรมการเกษตร 3(2):69-84

Data collectionNine out of ten characteristics were
directly collected from all 168 experimental units. Those were leaf greenness (SPAD), total fresh weight (tFW), shoot wight (ShWt), root weight (RWt), total dry weight (tDW), shoot dry weight (ShDW), root dry weight (RDW), shoot area (ShA) and primary root length (PRL). SPAD was measured by using SPAD-502 plus meter (Konica, Minolta). A SPAD read was taken in average of 10 data points. The seedlings were cut to separate shoot and root by cutting above nodal roots. Shoots and roots from the same experimental unit were laid and separately taken photo for image analysis. After that, those shoots and roots were weighed for tFW, ShWt and RWt in gram. Dry weights e.g., ShDW, RtDW and tDW were collected after drying at 70°c for 48 hours in the oven.
Images of shoot and root were analyzed for extracting ShA in squared centimeters (Figure 2B) and PRL in centimeters (Figure 2A) by using open-source ImageJ software (Abràmoff et al., 2004) and SmartRoot (Lobet et al., 2011), respectively. The last data was the root-to-shoot ratio (RS) which had been mathematically received by dividing root dry weight by shoot dry weight.
Statistical analysesAll 10 phenotypic traits as described
above were evaluated for normal distribution and transformed with mathematic function if a skewed distribution was observed. Two-way ANOVA was conducted to test the significance for all 10 traits. Furthermore, Post-hoc analysis (Least Significance Difference at α=0.05) was carried out to compare the treatment means in the further step.
Figure 2 Data measurement with Image processing for A) primary root length (PRL) B) shoot area (ShA)
A B
J. Agri. Prod.74 ว. ผลิตกรรมการเกษตร 3(2):69-84

Results and DiscussionDescriptive statistics for all phenotypic traits
In order to illustrate how maize seedlings responded to osmotic stress, the appearance of maize seedlings after 48 hours of osmotic stress at each different 7 concentrations of PEG 6000 was shown in Figure 3. At higher osmotic potential of solution (-6.99 and -9.8 MPa) or at 25 and 30% PEG, maize seedlings were wilt and the stems could not stand upright. Different leaf greenness and leaf rolling could be seen in few varieties as shown in the Figure 3.
All ten phenotypic traits were checked for normality of data as shown in Table 1.
Data of root to shoot dry weight ratio (RS), shoot dry weight (ShDW) and primary root length (PRL) were right-skewed distribution (skewness with underlined in Table 1). Therefore, data transformation was subsequently done to avoid the violation of ANOVA assumptions. Square root function was used in this case and noted as sqrtRS, sqrtShDW and sqrtPRL elsewhere in this article. Moreover, it was noted that 2 symmetrical data e.g., SPAD and ShA showed the high degree of variance when compared with the other traits whereas high variance of PRL data was decreased dramatically after data transformation (σ2
sqrtPRL = 0.49).
Takfa1
Takfa3
Field corn
Waxy corn
Figure 3 Overall responses of 4 maize varieties under different PEG 6000 concentrations
J. Agri. Prod. 75ว. ผลิตกรรมการเกษตร 3(2):69-84
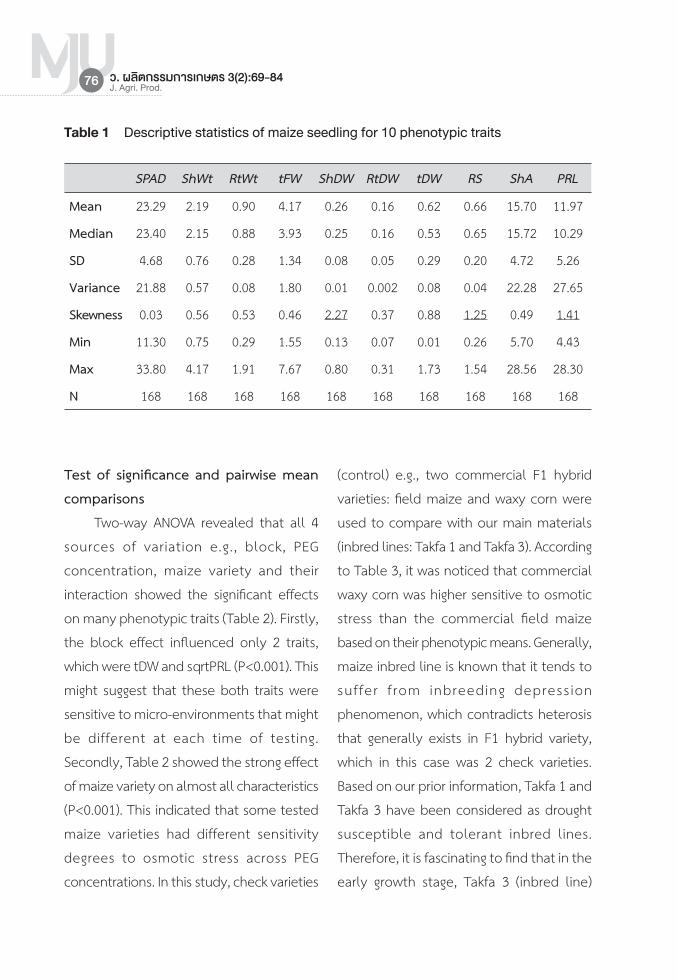
Table 1 Descriptive statistics of maize seedling for 10 phenotypic traits
SPAD ShWt RtWt tFW ShDW RtDW tDW RS ShA PRLMean 23.29 2.19 0.90 4.17 0.26 0.16 0.62 0.66 15.70 11.97
Median 23.40 2.15 0.88 3.93 0.25 0.16 0.53 0.65 15.72 10.29
SD 4.68 0.76 0.28 1.34 0.08 0.05 0.29 0.20 4.72 5.26
Variance 21.88 0.57 0.08 1.80 0.01 0.002 0.08 0.04 22.28 27.65
Skewness 0.03 0.56 0.53 0.46 2.27 0.37 0.88 1.25 0.49 1.41
Min 11.30 0.75 0.29 1.55 0.13 0.07 0.01 0.26 5.70 4.43
Max 33.80 4.17 1.91 7.67 0.80 0.31 1.73 1.54 28.56 28.30
N 168 168 168 168 168 168 168 168 168 168
Test of significance and pairwise mean comparisons
Two-way ANOVA revealed that all 4 sources of variation e.g., block, PEG concentration, maize variety and their interaction showed the significant effects on many phenotypic traits (Table 2). Firstly, the block effect influenced only 2 traits, which were tDW and sqrtPRL (P<0.001). This might suggest that these both traits were sensitive to micro-environments that might be different at each time of testing. Secondly, Table 2 showed the strong effect of maize variety on almost all characteristics (P<0.001). This indicated that some tested maize varieties had different sensitivity degrees to osmotic stress across PEG concentrations. In this study, check varieties
(control) e.g., two commercial F1 hybrid varieties: field maize and waxy corn were used to compare with our main materials (inbred lines: Takfa 1 and Takfa 3). According to Table 3, it was noticed that commercial waxy corn was higher sensitive to osmotic stress than the commercial field maize based on their phenotypic means. Generally, maize inbred line is known that it tends to suffer f rom inbreeding depress ion phenomenon, which contradicts heterosis that generally exists in F1 hybrid variety, which in this case was 2 check varieties. Based on our prior information, Takfa 1 and Takfa 3 have been considered as drought susceptible and tolerant inbred lines. Therefore, it is fascinating to find that in the early growth stage, Takfa 3 (inbred line)
J. Agri. Prod.76 ว. ผลิตกรรมการเกษตร 3(2):69-84
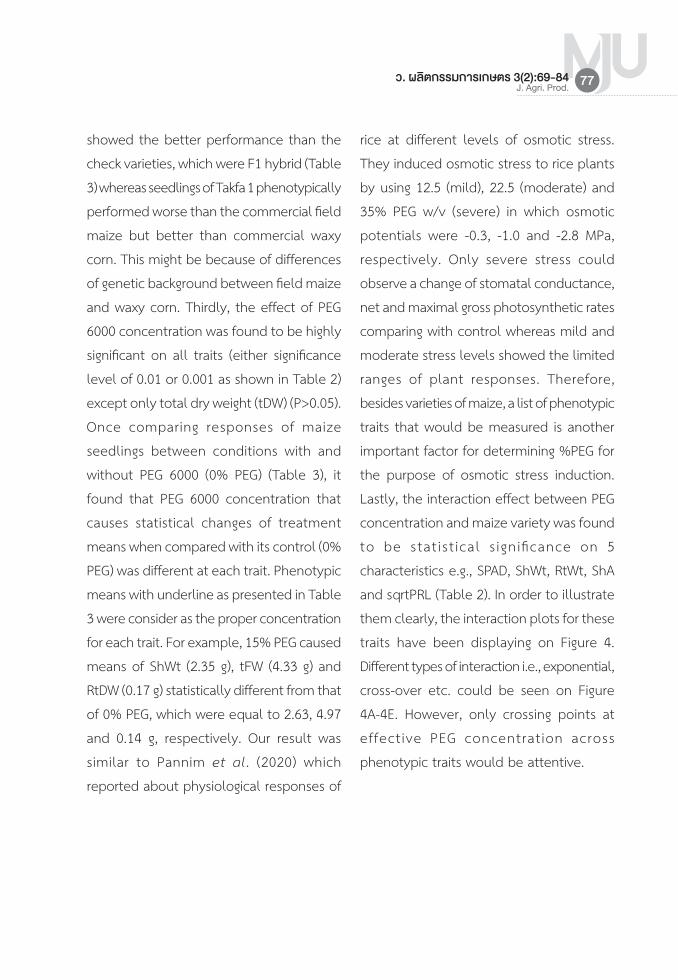
showed the better performance than the check varieties, which were F1 hybrid (Table 3) whereas seedlings of Takfa 1 phenotypically performed worse than the commercial field maize but better than commercial waxy corn. This might be because of differences of genetic background between field maize and waxy corn. Thirdly, the effect of PEG 6000 concentration was found to be highly significant on all traits (either significance level of 0.01 or 0.001 as shown in Table 2) except only total dry weight (tDW) (P>0.05). Once comparing responses of maize seedlings between conditions with and without PEG 6000 (0% PEG) (Table 3), it found that PEG 6000 concentration that causes statistical changes of treatment means when compared with its control (0% PEG) was different at each trait. Phenotypic means with underline as presented in Table 3 were consider as the proper concentration for each trait. For example, 15% PEG caused means of ShWt (2.35 g), tFW (4.33 g) and RtDW (0.17 g) statistically different from that of 0% PEG, which were equal to 2.63, 4.97 and 0.14 g, respectively. Our result was similar to Pannim et al. (2020) which reported about physiological responses of
rice at different levels of osmotic stress. They induced osmotic stress to rice plants by using 12.5 (mild), 22.5 (moderate) and 35% PEG w/v (severe) in which osmotic potentials were -0.3, -1.0 and -2.8 MPa, respectively. Only severe stress could observe a change of stomatal conductance, net and maximal gross photosynthetic rates comparing with control whereas mild and moderate stress levels showed the limited ranges of plant responses. Therefore, besides varieties of maize, a list of phenotypic traits that would be measured is another important factor for determining %PEG for the purpose of osmotic stress induction. Lastly, the interaction effect between PEG concentration and maize variety was found to be stat ist ical s ignificance on 5 characteristics e.g., SPAD, ShWt, RtWt, ShA and sqrtPRL (Table 2). In order to illustrate them clearly, the interaction plots for these traits have been displaying on Figure 4. Different types of interaction i.e., exponential, cross-over etc. could be seen on Figure 4A-4E. However, only crossing points at effective PEG concentration across phenotypic traits would be attentive.
J. Agri. Prod. 77ว. ผลิตกรรมการเกษตร 3(2):69-84

Table 2 Two-way ANOVA showing the effect of factors on 10 phenotypic traits of maize seedlings
SOV df
Mean square
SPAD ShWt RtWt tFWSqrt
ShDWRtDW tDW
Sqrt RS
ShASqrt PRL
Block 1 5.5 0.13 0.13 0.21 0.01 0.001 5.26*** 0.00 9.6794 5.87***
[PEG] 6 73.9*** 6.04*** 6.04*** 14.75*** 0.01** 0.011*** 0.02 0.14*** 260.95*** 4.57***
Variety 3 581.3*** 11.04*** 11.04*** 50.64*** 0.11*** 0.004 1.06*** 0.22*** 341.56*** 2.57***
PxV 18 17.4** 0.33*** 0.33** 0.54 0.004 0.002 0.03 0.01 13.41** 0.42*
Error 139 8.3 0.15 0.15 0.36 0.003 0.002 0.03 0.01 6.32 0.24
Total 167 686.4 17.68 17.68 66.5 0.14 1.03 6.40 0.37 631.92 13.66
*, **, and *** indicate statistical significance at P<0.05, 0.01 and 0.001, respectively
Since our in-house screening method has been using in different types of maize for the purpose of screening, hence %PEG that could cause the changes of most of phenotypic traits across 4 varieties would be considered. To do so, treatment means for each phenotypic trait were considered (Table 3). Interestingly, means of leaf greenness (SPAD) were gradually higher along with higher PEG 6000 concentrations and leaf greenness of maize seedling that immersed in 25% PEG solution showed statistically different from the control condition. This finding is uncommon and difficult to explain here since no any other physiological parameters were measured in this study although low chlorophyll content in wheat leaves has been suggested as an indicator for drought susceptibility (Li et al.,
2006). Another interesting trait is root to shoot ratio (RS). It was the adaptive trait that was commonly used to measure adaptability of plant genotypes under abiotic stresses (Ogawa and Yamauchi, 2006; Xie et al., 2017) i.e., drought, salinity etc. In our maize breeding program, RS ratio is also one of the criteria for assessing genotypes against drought stress. According to the LSD test (Table 3), it suggested that 20% PEG was the proper concentration for assessing RS ratio of maize seedling. However, as seen in Table 3, 25% PEG caused phenotypic mean difference between conditions of with and without PEG 6000 for 8 out of 10 traits. Additionally, no interaction effect was found on 25% PEG. Therefore, 25% PEG has been recommended for using in our in-house screening system as an effective
J. Agri. Prod.78 ว. ผลิตกรรมการเกษตร 3(2):69-84

concentration of PEG. However, in case that a list of phenotypic traits might be changed, the effective PEG 6000 concentration for the new list need to be re-considered. Furthermore, according to our results, it is worth to note that regardless of PEG 6000 concentration, measurement of shoot dry weight and total dry weight of maize seedling might not be helpful for the purpose of drought tolerant screening during seedling growth stage.
Relationship among phenotypic traits of maize seedling
Pearson correlation coefficients for all pairs among 10 traits were estimated and presented in Table 4. Interestingly, leaf greenness (SPAD) had negative relationships with many traits (Table 4) in which their correlation coefficients were in range of -0.19 to -0.49 with significance level at α0.05. Moreover , when cons ider ing two characteristics, ShA and PRL, which were extracted from image processing, it was observed that ShA showed statistically significant strong relationship with SPAD (-0.42), ShWt (0.93), RtWt (0.63), tFW (0.89), ShDW (0.66) and RS ratio (-0.50). Therefore, ShA is another interesting trait that might be used in seedling screening because it was easy to extract from the image processing whereas PRL contrarily had weak correlation with the other 9 traits of
seedlings. However, Salungyu et al., (2020) has been suggesting that root traits of maize seedling could be used as an indicator for assessment of mature plant performance. They reported the significant correlation between primary root length and plant performance in the field test (r=0.29). Therefore, PRL might be included in the further study in our breeding program in order to evaluate whether or not PRL is useful for screening against osmotic stress.
ConclusionAccording to our results , PEG
concentrations that causes statistical changes of treatment means when compared with its control (0% PEG) were different at each trait. For example, the proper concentration was 20% PEG for root to shoot ratio while that of the other traits was different. Twenty five percent of PEG was found to be an effective concentration for using in our in-house screening system because this concentration caused the changes of 8 out of 10 traits e.g., leaf greenness, shoot weight, root weight, total fresh weight, root dry weight, root-to-shoot ratio, shoot area and primary root length and importantly had no interaction effect between ma ize va r i e ty and PEG concentration. However, in case that a list of phenotypic traits might be changed, the effective PEG 6000 concentration for the
J. Agri. Prod. 79ว. ผลิตกรรมการเกษตร 3(2):69-84

new list need to be re-considered. Furthermore, our study also found that shoot dry weight and total dry weight might not be helpful for the purpose of drought tolerant screening during seedling growth stage while shoot area is recommended because it is easy to observe and measure.
Additionally, our in-house screening system that was used in this study is the simple, cheap and rapid in vitro screening method for maize seedling screening against
osmotic stress. This system has no requirement for nutrient culture and expensive instruments. Moreover, it has taken only 10 days to complete the whole process. Also, the amount of tested sample is adjustable depending on the available space under light bulbs. Therefore, this in-house screening system with 25% PEG concentration as a proper concentration would be used in the further maize breeding projects.
Figure 4 Interaction plots representing the significant interaction effect between PEG concentration and maize variety on 5 phenotypic traits
J. Agri. Prod.80 ว. ผลิตกรรมการเกษตร 3(2):69-84

Tabl
e 3
Mea
n co
mpa
rison
s of
osm
otic
stre
ss le
vels
and
see
dlin
g va
rietie
s fo
r eac
h 10
phe
noty
pic
traits
Ψs
(MPa
)%
PEG
SPAD
ShW
tRt
Wt
tFW
sqrt
ShDW
RtDW
tDW
sqrt
RSSh
Asq
rtPR
L
Osmotic stress levels
00%
21.9
7c2.
63a
1.12
a4.
97a
0.51
abc
0.14
c0.
66a
0.74
bc17
.35b
c3.
89a
-0.4
55%
22.1
9bc
2.66
a0.
96b
4.87
a0.
52ab
0.14
c0.
59a
0.72
c19
.59a
3.97
a
-1.3
810
%22
.15b
c2.
60a
0.90
b4.
73a
0.52
a0.
15bc
0.59
a0.
74bc
18.6
4ab
3.60
b
-2.7
815
%22
.64b
c2.
35b
0.95
b4.
33b
0.53
a0.
17ab
0.64
a0.
78b
16.9
6c3.
31c
-4.6
520
%23
.35b
c1.
99c
0.97
b3.
89c
0.49
bc0.
19a
0.62
a0.
88a
14.2
0d3.
05cd
-6.9
925
%23
.75b
1.72
d0.
74c
3.49
d0.
48c
0.18
a0.
58a
0.88
a12
.28e
2.93
d
-9.8
030
%26
.98a
1.39
e0.
63c
2.88
e0.
49bc
0.19
a0.
64a
0.89
a10
.88e
2.97
d
Gran
d m
ean
23.2
92.
190.
904.
170.
510.
160.
620.
8015
.70
3.39
Seedling Varieties
Takf
a319
.62d
2.94
a0.
98a
5.58
a0.
57a
0.18
a0.
77a
0.74
c19
.85a
3.22
b
F1 H
ybrid
fi el
d co
rn28
.20a
2.05
b0.
93ab
4.43
b0.
49b
0.16
a0.
74b
0.79
b15
.15b
3.21
b
Takf
a123
.92b
1.99
b0.
87bc
3.59
c0.
51b
0.16
a0.
51b
0.78
b14
.35b
c3.
38b
F1 H
ybrid
wax
y cor
n21
.41c
1.78
c0.
80c
3.07
d0.
45c
0.17
a0.
45b
0.91
a13
.45c
3.74
a
Note
: Diff
eren
t alp
habe
ts in
eac
h co
lum
n sh
ow th
e sig
nific
ant d
iffer
ence
am
ong
PEG
conc
entra
tion
at α
0.05
J. Agri. Prod. 81ว. ผลิตกรรมการเกษตร 3(2):69-84
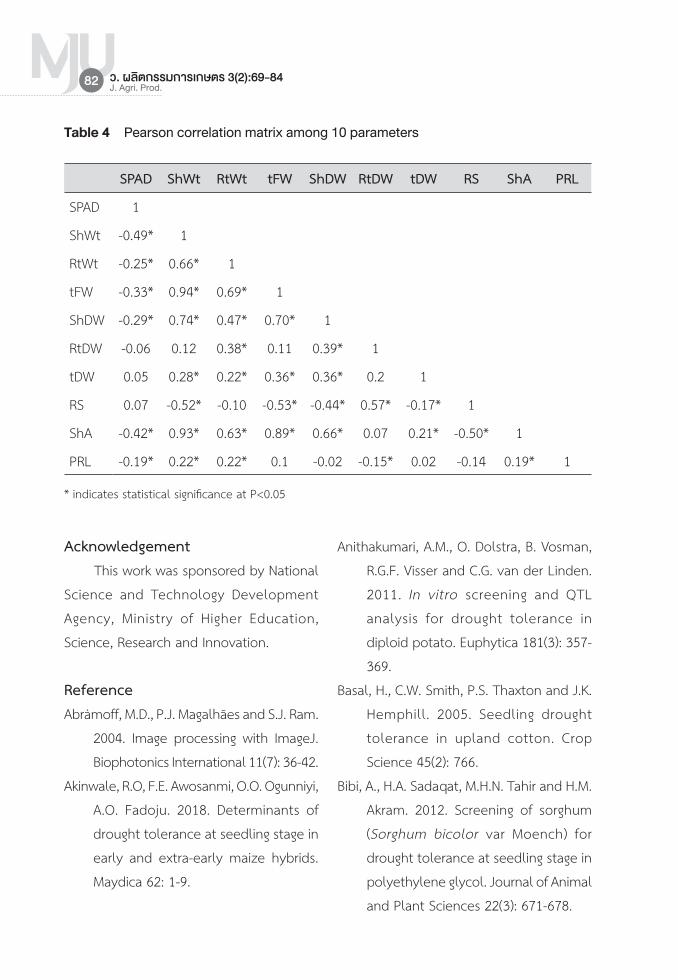
Table 4 Pearson correlation matrix among 10 parameters
SPAD ShWt RtWt tFW ShDW RtDW tDW RS ShA PRL
SPAD 1
ShWt -0.49* 1
RtWt -0.25* 0.66* 1
tFW -0.33* 0.94* 0.69* 1
ShDW -0.29* 0.74* 0.47* 0.70* 1
RtDW -0.06 0.12 0.38* 0.11 0.39* 1
tDW 0.05 0.28* 0.22* 0.36* 0.36* 0.2 1
RS 0.07 -0.52* -0.10 -0.53* -0.44* 0.57* -0.17* 1
ShA -0.42* 0.93* 0.63* 0.89* 0.66* 0.07 0.21* -0.50* 1
PRL -0.19* 0.22* 0.22* 0.1 -0.02 -0.15* 0.02 -0.14 0.19* 1
* indicates statistical significance at P<0.05
AcknowledgementThis work was sponsored by National
Science and Technology Development Agency, Ministry of Higher Education, Science, Research and Innovation.
ReferenceAbràmoff, M.D., P.J. Magalhães and S.J. Ram.
2004. Image processing with ImageJ. Biophotonics International 11(7): 36-42.
Akinwale, R.O, F.E. Awosanmi, O.O. Ogunniyi, A.O. Fadoju. 2018. Determinants of drought tolerance at seedling stage in early and extra-early maize hybrids. Maydica 62: 1-9.
Anithakumari, A.M., O. Dolstra, B. Vosman, R.G.F. Visser and C.G. van der Linden. 2011. In vitro screening and QTL analysis for drought tolerance in diploid potato. Euphytica 181(3): 357-369.
Basal, H., C.W. Smith, P.S. Thaxton and J.K. Hemphill. 2005. Seedling drought tolerance in upland cotton. Crop Science 45(2): 766.
Bibi, A., H.A. Sadaqat, M.H.N. Tahir and H.M. Akram. 2012. Screening of sorghum (Sorghum bicolor var Moench) for drought tolerance at seedling stage in polyethylene glycol. Journal of Animal and Plant Sciences 22(3): 671-678.
J. Agri. Prod.82 ว. ผลิตกรรมการเกษตร 3(2):69-84

Biswas, J., B. Chowdhury, A. Bhattacharya and A.B. Mandal. 2002. In vitro screening for increased drought tolerance in rice. In Vitro Cell. Dev. Biol. Plant 38(5): 525-530.
Bolaños, J. and G.O. Edmeades. 1991. Value of selection for osmotic potential in tropical maize. Agronomy Journal 83(6): 948.
Dhanda, S.S., G.S. Sethi and R.K. Behl. 2004. Indices of drought tolerance in wheat genotypes at early stages of plant growth. Journal of Agronomy and Crop Science 190(1): 6-12.
Kim, Y., S. Shanmugasundaram, S. Yun, H. Park and M. Park. 2001. A simple method of seedling screening for drought tolerance in soybean. Korean J. Crop Sci. 46(4): 284-288.
Li, R., P. Guo, B. Michael, G. Stefania and C. Salvatore. 2006. Evaluat ion of chlorophyll content and fluorescence parameters as indicators of drought tolerance in barley. Agric. Sci. China 5: 751-757.
Lobet, G., L. Page`s and and X. Draye. 2011. A Novel image-analysis toolbox enabling quantitative analysis of root system architecture. Plant Physiol 157(1): 29-39.
Marcinska, I., I. Czyczyło-Mysza, E. Skrzypek, M. Filek, S. Grzesiak, M.T. Grzesiak, F. Janowiak, T. Hura, M. Dziurka, K.
Dziurka, A. Nowakowska and S.A. Quarrie. 2012. Impact of osmotic stress on physiological and biochemical characteristics in drought-susceptible and drought-resistant wheat genotypes. Acta Physiol. Plant 35(2): 451-461.
Michel, B.E. and M.R. Kaufmann. 1973. The osmotic potential of polyethylene glycol 6000. Plant Physiol. 51(5): 914-916.
Mohammadkhani, N. and R. Heidari. 2008. Water stress induced by Polyethylene Glycol 6000 and sodium chloride in two maize cultivars. Pak. J. Biol. Sci. 11(1): 92-97.
Ogawa, A. and A. Yamauchi. 2006. Root osmotic adjustment under osmotic stress in maize seedlings 1. transient change of growth and water relations in roots in response to osmotic stress. Plant Prod. Sci. 9(1): 27-38.
Pannim, W., C. Chutteang, W Utkhao, S Sukkhaeng, S, Promdang and Suntaree Yingjajaval. 2020. Stomatal and pho to s yn the t i c r e spon se t o polyethylene glycol induced drought stress of Thai jasmine rice (Oryza sativa L. ssp. indica cv. KDML105) during vegetative stage. Agricultural Sci. J. 51(2): 90-106.
Ramzan, J., M. Aslam, M. Ahsan and F.S. Awan. 2019. Selection of screening criteria against drought stress at early
J. Agri. Prod. 83ว. ผลิตกรรมการเกษตร 3(2):69-84

growth stages in maize (Zea mays L.). Pak. J. Agri. Sci. 56(3): 633-643.
Sakthivelu, G., M.K. Akitha Devi, T. Rajasekaran, G.A. Ravishankar, T. Nedev and G. Kosturkova. 2008. Drought-induced alternations in growth, osmotic potential and in vitro regeneration of soybean cultivars. Gen. Appl. Plant Physiology Special Issue 34(1-2): 103-112.
Salungyu, J., S. Thaitad, A. Bucksch, J. Kengkanna, P.J. Saengwilai. 2020. From lab to field: Open tools facilitating the translation of maize root traits. Field Crop Research. 255, 107872.
Wani, S.H., P.A. Sofi, S.S. Gosal and N.B. Singh. 2010. In vitro screening of rice (Oryza sativa L) callus for drought tolerance. Commun. Biometry Crop. Sci. 5(2): 108-115.
Xie, Q., K.M.C. Fernando, S. Mayes and D.L. Sparkes. 2017. Identifying seedling root architectural traits associated with yield and yield components in wheat. Ann. Bot. 119(7): 1115-1129.
J. Agri. Prod.84 ว. ผลิตกรรมการเกษตร 3(2):69-84