determination of the zincate diffusion coefficient and its application
TRANSCRIPT

General Disclaimer
One or more of the Following Statements may affect this Document
This document has been reproduced from the best copy furnished by the
organizational source. It is being released in the interest of making available as
much information as possible.
This document may contain data, which exceeds the sheet parameters. It was
furnished in this condition by the organizational source and is the best copy
available.
This document may contain tone-on-tone or color graphs, charts and/or pictures,
which have been reproduced in black and white.
This document is paginated as submitted by the original source.
Portions of this document are not fully legible due to the historical nature of some
of the material. However, it is the best reproduction available from the original
submission.
Produced by the NASA Center for Aerospace Information (CASI)
https://ntrs.nasa.gov/search.jsp?R=19780011705 2018-03-17T08:33:23+00:00Z
NASA TECHNICAL NASA TM -73879MEMORANDUM
v^
00Mti
QZ(*t ASA-TM-73970) DETERMINATION nF THE N78-19648ZINCATr DIFFUSION CnEFFICIENT V7D ITSAPPLICATION TO ALKALINr BATTEFY FROBLEMS(",'AS A) 20 p HC A 32/MF A01 CSCL 10C Unclas
G.3/44 09682
DETERMINATION OF THE ZINCATE DIFFUSION COEFFICIENT
AND ITS APPLICATION TO ALKALINE BATTERY PROBLEMS
by Charles E. May and Harold E. KautzLewis Research CenterCleveland, Ohio 44135
L^
t•.^s^ b^^ ^actun
lll9 s1 hl ^12^^^^
s
I
I ^ -I
TECHNICAL PAPER to be presented at theElectrochemical Society MeetingPittsburgh, Pennsylvania, October 15-20, 1978

DETERMINATION OF THE ZINCATE DIFFUSION COEFFICIENT AND ITS
APPLICATION TO ALKALINE BATTERY PROBLEMS
by Charles E. May and Harold E. Kautz
National Aeronautics and Space Administration
Lewis Research CenterCleveland, Ohio 44135
ABSTRACT
The diffusion coefficient for the zincate ion at 24° C was found to
be 9.9 x10 -7 cm2 /sec 4 30 percent in 45 percent potassium hydroxide and
1.4 x 10 -7 cm2 /sec ±25 percent in 40 percent sodium hydroxide. Comparison
of these values with literature values at different potassium hydroxideconcentrations show that the Stokes-Einstein equation is obeyed. The dif-fusion coefficient is characteristic of the zincate ion (not the cation)
and independent of its concentration. Calculations with the measuredvalue of the diffusion coefficient show that the zinc concentration in analkaline zincate half cell becomes uniform throughout in tens of hours by
00 diffusion alone. Diffusion equations are derived which are applicable tos finite size chambers. Details and discussion of the experimental methodw are also given.
I
I
i
I

DETERMINATION OF THE ZINCATE DIFFUSION COEFFICIENT AND ITS
APPLICATION TO ALKALINE BATTERY PROBLEMS
by Charles E. May and Harold E. Kautz
National Aeronautics and Space AdministrationLewis Research CenterCleveland, Ohio 44135
SUMMARY
The diffusion coefficient for the zincate ion at 24° C was found tobe 9.9 . 10 -7 cm2 /sec T30 percent in 45 percent potassium hydroxide and1.4x10-7 cm2 /sec ±25 percent in 40 percent sodium hydroxide. Comparisonof these values with literature values at different potassium hydroxideconcentrations show that the Stokes-Einstein equation is obeyed. The dif-
fusion coefficient is characteristic of the zincate ion (not the cation)and independent of its concentration. Calculations with the measuredvalue of the diffusion coefficient show that the zinc concentration in analkaline zincate half cell becomes uniform throughout in tens of hours bydiffusion alone. Diffusion equations are derived which are applicable tofinite size chambers. Details and discussion of the experimental method
are also given.
INTRODUCTION
A renewed interest in rechargeable batteries has led us to begin astudy of the alkaline zinc electrode (Ref. 1). An important aspect of theinvestigation involves the tr nsport of the zincate ion, Zn(OH)4; two
modes are possible: diffusive and convective. Measurements of the diffu-sion coefficient of the zincate ion, D, in alkaline media have been made(Refs. 2 and 3) but we desired to know D under specific experimentalconditions, i.e., high zincate concentration. Note that although one
speaks about the diffusion of zincate, it is the apparent diffusion coef-ficient of a metal (e.g., potassium) zincate that is measured. Equationshave been derived that relate the measured value to that for the zincateion (Ref. 4, pp. 119-121; and Ref. 5, pp. 124-126). Nevertheless, it isthe apparent diffusion coefficient of potassium zincate as measured thatshould be applied to an actual problem.
Herein, we report the room temperature diffusion coefficient forboth potassium and sodium zincates. The concentrations used during themeasurements for potassium zincate approximated those used in the NASAsilver/zinc and nickel/zinc batteries. The method used to determine the
diffusion coefficients is described, and its applicability discussed.Finally, the diffusion coefficient for potassium zincate is used to answersome questions concerning the zinc-zincate half cell present in secondarybatteries.
ORIGINAL OF POOR QUALITY
00ITrn
W

2
EXPERIMENTAL DETAILS
Essence of Method
Various methods (Ref. 5, pp. 62-76) have been used to determine diffu-
sion coefficients in hydrodiffusion systems. A popular method involvesdiffusion through a glass frit. Because the highly alkaline solutionswith which we are involved are corrosive to glass frit, we designed amethod which can make use of only materials that are resistant to the cor-rosive solutions. Our method is a modification of one used in solid statediffusion: a sample (a vertical column of solution) containing initiallyno -zincate was butted against another sample (vertical column of solution)
containing initially a uniform concentration of zincate, C o , in moles per
liter; the more dense sample was on the bottom. The concentration profilewas then measured after certain times and D was calculated from
Eq. [1] (,'ef. 6, Eq.
2C = erfc x
r1]0 2 rD—t
where C is the zincate concentration at time t and distance x fromthe butted interface. Equation (1) applies only for sufficiently long
columns and when D is not a function of C. (See Appendix A for equa-tions applicable to short columns.) Instead of sectioning the column to
determine C, we adapted a technique that has been used to measure thezincate diffusion rate through battery separators (Pefs. 7 and 8): the
potential, E, was measured between an amalgamated zinc electrode at dis-
tance x and an amalgamated zinc electrode in a reference chamber of
zincate concentration C o . Eq. [2] was used to calculate C/Co.
C e
C = = e
-2EF/RT -78.1E[2]
0
where F is the Faraday; R, the gas constant; and T, absolute temperature.
Eq. [-'] should be applied only when the effect of gradients of thecation and hydroxide ion concentrations can be ignored (due to their highand nearly uniform concentrations). When F.qs. [1] and [2] both apply,they can be combined as follows:
2e-78.1E = erfc x [3]2^_Dt
Apparatus
Schematics of the cell are shown in F:b. 1 (a: disassembled; b: infilling configuration; and c: in running configuration). The cell consistsof three chambers. The upper chamber is the one that contains aqueous so-lution of potassium or sodium hydroxide but initially no zincate. The mid-dle one contains the aqueous solution of potassium or sodium hydroxide with J

I
3
the initially uniform zincate concentration, C o . The lower one is thereference chamber; it is separated from the middle chamber by a cellulosemembrane (2.8 nm pore size, 90 pm dry thickness). The concentrations of
the lower chamber are identical to the initial concentrations in the mid-dle chamber. The zincate concentration in the lower chamber remains essen-
tially constant during a 21 day experiment because of the relatively slowdiffusion of the ions through the cellulose (Ref. 7) and the small concen-tration gradients existing across the cellulose in our experiments, indi-cated by negligible potentials between the reference electrode and lowestelectrode in the middle chamber. Also, preliminary experiments indicatednegligible gradients within the reference chamber.
Clamping the polymethylmethacrylate spacers (Fig. 1(a)) to form thechambers (Fig. 1(b)) served to prevent leaking of the electrolyte at thezinc electrodes. Spacers were either 0.142 or 0.290 centimeter thick.The zinc electrodes were made from 0.005 centimeter thick zinc sheet of5N purity. These were amalgamated in situ by contact with a saturatedmercuric chloride solution for two minutes. Amalgamating only the portion
of an electrode that contacted the electrolyte prevented the zinc tabswhich were used for electrical contact from becoming too brittle. Afteramalgamation, the cell was washed with water, disassembled and dried be-fore assembly for a diffusion experiment.
Chemicals
The zinc sheet was 5N pure. The stock potassium zincate solution wasmade by dissolving 50 grams of reagent grade zinc oxide, ZnO, in enough
reagent grade nominally 45 percent potassium hydroxide, KOH (carbonatefree) to make 500 milliliter. Typical analyses of such solutions haveshown them to be 1.21 trolar in potassium zincate and 9 molar in KOH. Alesser concentration of potassium zincate (0.30 M) was made by dilutionof the stock solution with 45 percent KOH solution. The sodium zincate
solution was made by dissolving 35 grams of the Zn0 in enough (338 ml)40 percent (14.3 M) certified A.C.S. grade sodium hydroxide, NaOH, aqueoussolution to make 345 ml. The resultant solution was then 1.43 molar insodium zincate and 11.2 molar in NaOH. Note that the concentrations neednot be known to calculate D; see Eq. [3]. The solutions in the upperchamber were pure hydroxide solutions: 45 percent KOH for use with thepotassium zincate and 40 percent NaOH for use with the sodium zincate.
In a preliminary experiment, in order to match more closely the con-centration of hydroxide in the upper chamber with that in the middle cham-
ber (which of course would mismatch the cation concentrations) 37 percentKOH was used in the upper chamber instead of 45 percent: in this case,the data were scattered with respect to Eq. [i; and deemed unreliable.
This indicated to us that it was the cation concentrations that shouldbe matched.
ORIGINAL PAGE IS
OF Po )lt QUALITY
AI ^.

4
Procedure
In preparation for a diffusion experiment, the cell was assembled in
the filling position (Fig. 1(b)) so that the upper and middle chamberssolutions could not mix. The chambers were filled witli the proper solu-
tions. 'Pile cell was positioned rigidly and then the run was begun (corre-sponding to t = 0) by caretuliv sliding the upper chamber into the run-ning configuration (Fig. 1(c)). The potential between each electrode and
the reference was fed sequentially into a digital voltmeter and printer.Pile temperature during the course of all experiments was 24°±1° C.
RESULTS AND DISCUSSION
Pile Diffusion Coefficient
Profile of zincate concentration. - The data for 1.21 molar potassiumzincate butted against 45 percent KOH are shown in Fig. 2 (2 experiments);
C/Co is plotted against x/,'t. in Fig. 2, an attempt was made to correct
at least partially for any initial disturbance, i.e., convective nixingby the sliding of the upper chamber; this was done by subtract-
ing values at 30 minute sfrom corresponding subsequent values values as follows:
For upper chamber: (_C1' "rrected
` J
;4
.. 0 O min. value
For middle chamber: Ecorrected - Lmeasured - E 30 min. value
^5^
Me solid line in Fig. 2 corresponds to a D of 9.9 ,, 10 -7 cm2/sec;
its calculation is discussed later. The curve fits the general profile ofthe data points; thus the diffusion law for constant D (Eq. ) appearsto be applicable. Tlie data point, for electrodes with x values greaterthan one sixth of the chamber length should deviate from the curve near
C/Co = 0.5 (see Appendix A); this is not apparent in Fig. 2. All points
near C/Co = 0 and C/Co = 1 do deviate from the curve; this may be dueto convective transport effects and/or uncertainty in initial values of E
arising in part from strains in the zinc metal collectors.
The profile of the 0.3 molar potassium zincate concentration is sim-
ilar to that in Fig. 2. Tile profile of the sodium zincate concentration
also ap proxiutates that predicted by Eq. [11 but with a 1) of about
1.4x10 - cm=/sec.
From an examination of potassium zincate data as well as those forsodium zincate, we have drawn the following conclusions concerning the
reliability of individual data points. Data points are more reliable when
obtained from the upper chamber electrodes (Chose at which the zincate con-
centration builds up) and for electrode closer to the interface (buttedsurface). The electrode data close to the interface are also more reli-
able for i,iatnematical reasons; see Appendix A. fie most reliable values
,..,,
^, li

5
of C/Co are those between about 0.15 and 0.35. In order to prevent aninterruption of our discussion of D and its implications, our evaluationof the general method is contained in Appendix B.
Calculation of D values. - To calculate D values, only the most
reliable values of C/C o were used; that is, those between 0.15 and 0.35.A value of D for each reliable data point was calculated from
Eq. [2]. Corrections introduced by Eqs. [4j and [5' are very smallfor these data and were ignored. For potassium zincate we obtained the
average. D value (from 14 data points) of 9.9x10 -7 cm2 /sec,30 percentmean deviation. For sodium zincate the average D (from 11 data points)
was 1.4 x 10⁻⁷ cm2 /sec*_25 percent. The average value. of D for 0.3 molarpotassium zincate was slightly higher than that for 1.21 molar, but waswithin the mean deviation; thus, indications are again that D is not afunction of zincate concentration.
Agreement with other data. - Inof D for potassium zincate (Refs. 2ion concentration. The D values in
recalculation of data in ref. 9.
defined by the other authors' data.via the Ilkovic equation at extremely10-3 molar. Our good agreement withconstant over a wide range of zincate
Fig. 3, the room temperature valueand 3) is plotted against potassium
Ref. 2 appear to be due to aOur value of D falls on the curve
The data other than ours was obtainedlow zincate concentration, abouttheir data emphasizes that D isconcentration.
Plotting D in terms of hydroxide concentration rather than potassiumion concentration would displace oar data with respect to those of otherinvestigators. Th,ir hydroxide concentration essentially equals their
potassium ion concentration while ours does not because of our nigh zincate
concentration. With such a plot of D against hydroxide concentration ourD would be about one third that predicted from these data. A logical in-ference would be that it is the potassium ion and not the hydroxide that is
affecting the value of D.
To obtain a comparison for our sodium zincate data, we measured the
permeation rate of both potassium zincate and sodium zincate through cel-lulose. (The method is described in Ref. 7.) Because cellulose is notan ion selective membrane, the ratio of the two permeation coefficientsshould equal the ratio of corresponding diffusion coefficients. Experi-mentally, we found 7.3 for the ratio of the permeation coefficient of potas-sium zincate to that for sodium zincar.e. This is good agreement with 7.1,the ratio of the corresponding diffusion coefficients. The low diffusioncoefficient for sodium zincate witli respect to that for potassium zincate
is also in accord with the fact that the charging polarization is greaterfor the zinc electrode in NaOH than in KOH.
Theoretical effect of supporting electrolyte. - Experimentally, wehave already seen a great effect of the supporting electrolyte on D. Let
us now examine the phenomenological and widely used equation that relatesthe apparent value of D to the true D Z for the zincate ion.
I

6
D M G M D H G H - D*
G G z
D = D Z 1 + 2 * z *z [6]
DM C
M + DCCH + 2D*z z z )
*where G refers to the gradients; C, the concentrations; D the true dif-fusion coefficients; z, the zincate ion; M, the cation; and H, the hydrox-ide ion (Pef. 5, pp. 124-126). The value of D should approach Dz atsufficiently hiP electrolyte (hydroxide) concentration (Ref. 5, p. 126).The value of D z can then be related to n (viscosity coefficient) and r,the apparent radius of the zincate ion via the Stoke-Einstein equation(Ref. 2).
D kT
= 6nnr
where k is the Boltzmann constant; and T, the absolute temperature.HandbDok values of n for the solvents (hydroxide solution, Ref. 10) canbe used with little error for the n values of the solutions when thelatter are not available.
Fig. 4 gives a plot of D against the reciprocal of n. The squarepoints (lief. 3) aetermine a good straight line through the origin in agree-ment with Eq. [7]. The other data, except for the bracketed point,fall reasonably close to the line. McBreen (Ref. 2) also plotted Dagainst 1/n but concluded that there was nonlinear dependence due to theexistence of the bracketed point.
Tile straightness of the line in Fig. 4 indicates an essentially con-stant r (Lq. [7]) independent of alkali concentration. This in turn indi-cates the same zincate species (i.e.,Ln(OH)4) at all alkali concentrations.The slope of the curve (Fig. 4) yields an r of about 1.9 X.
Of much interest is the fact that our sodium zincate data point fallsvery near the straight line (Fig. 4). Thus the low diffusion coefficientfor sodium zincate with respect to that for potassium zincate might beattributable solely to the high viscosity of the sodium hydroxide solution.This is additional evidence that the D measured corresponds to Dz, thediffusion coefficient for the zincate ion. Our results give no direct evi-dence as to the applicability of Eq. [6].
Recently (Re-f. 1) we found that the transition from mossy to dendriticelectrodeposited zinc appeared to be dependent on the hydroxide ion concen-tration; our present findings might indicate that this dependence is only asecondary one and that the primary dependence is on Elie viscosity of thesolution. Moreover, the dependence of D on viscosity (applicability ofthe Stokes-Einstein equation) implies that the use of additives which lowerthe viscosity of the electrolyte in a battery can increase D, and thuslower concentration polarization.
`7]
T

Dy _ P [81
l .^
7
Applications
Electrode boundary layer thickness. - In an earlier report (hef. 1)we described the existence of a boundary layer during the electrodeposi-tion of zinc from a potassium hydroxide solution ( simulation of charginga silver/zinc or nickel/zinc battery). Not enough data were available atthat time to calculate the thickness of the ooundary layer. The concen-trations involved in that work wera the same as those described in thisreport. Tile boundary layer thickness, y, can be calculated from the fol-lowing equation.
where P, the permeation coefficiec,t through the layer, is 4.7x10 -4 cm/sec;
it is the reciprocal of Y l given in Ref. 1. The boundary layerthickness, y, is thus found to be about 20 um for a solution that is
9 molar in KOH and 1.21 molar in potassium zincate. One would of courseexpect y to be a function of KOH concentration.
Zincate distribution. - We now desire to see what effect a D of
9.9 x 10- cm /sec has on the zincate concentration profile in a secondary
battery if ion transport occurs by diffusion alone. We have treated thesubject in a manner to minimize assumptions; e.g., no charging or discharg-ing rates have to be assumed. We start by assuming the most unfavorablestarting situation for attaining a uniform zincate concentration; that is,
at zero time all the zincate is present at the surface of the zinc metalcollector. It may be present either in solution or as a precipitate.
First, we will discuss the former case; the equations that are applicableare derived in ippendix C. Of importance to us is the time, t, requiredto attain a uniform concentration (within one percent).
2t (sec) -
0.5D Z 191
A typical value for i is about 0.15 centimeter (NASA silver/zinc alkalinebattery); by using our experimental value for D, the time required isabout 3 hours. Even if D is an order of magnitude less due to the sepa-rator present in the battery, the time required for essentially uniform
zincate concentration is still quite short.
The situation where essentially all the zincate at the surface of thecollector is Present as a precipitate, appears to be an even less favorablesituation for attaining a uniform zincate concentration. This is a possiblesituation though not probable because zincate will precipitate when satura-tion is grossly exceeded. According to our unpublished data, zincate pre-
cipitates readily from 45 percent KOH when it exceeds 2.5 times saturation
(? molar). The diffusion process starting with a precipitate is envisionedas follows: as dissolved zincate diffuses out from the electrode, the

`r
I
8
zincate precipitate dissolves rapidly to keep the surface concentrationat saturation ( about 1.2 molar in 45 percent KOH) until the precipitateis exhausted. During this period, the following equation (P.ef. 6, Eq. 4.18
is applicable.
OD
`lt = 1 - C—\ 8 e-D(2m+1)2n2t/4k2 [10]M"
L-1 (2m + 1)2
where i is the length of the chamber and m is the number of the term.When M t is the total mass available per unit area, M. is the mass perunit area if the entire electrolyte could be at 1.2 molar, t becomes thetime required for complete dissolution of the precipitate. M t and M.are respectively about 0.11 and 0.18 millimoles/cm 2 for the NASA silver/zinc battery. If Dt/Z 2 > 0.35, omission of m > 0 causes only a 0.01percent error in the sum. If this is true, we may write
C
l - Mtn2
t (sec) _ -4D2 In Bt.)
j11 j
For the NASA silver/zinc battery, the time to attain complete dissolutionwould be 18 flours. Adding 3 hours (maximum time required for a uniformconcentration starting from a completely soluble system) to this number,
yields only 21 Hours, which is still a relatively short time for attaininga very uniform concentration starting with a precipitate at the electrode.
The situation of course would be different if the dissolution of theprecipitate were the rate-determining step. However, the NASA silver/zincbattery is regularly charged in 2 hours so that a precipitate if presentmust have a relatively fast rate of dissolution which could not be ratedetermining.
Without going into effects of ion selective membranes and complexformation (both are beyond the scope of our present report) we see no addi-
tional situations that might exist to affect the zinc concentration profile.
We conclude that for a usual zinc alkaline half cell, the zincate concen-tration becomes uniform in a relatively short period of time (tens of hours)for any state of discharge. This means that prolonged standing cannot fur-ther affect the zincate profile and any detrimental effects caused by stand-ing are not directly attributable to the concentration profile. In addi-
tion, the uniformity in concentration becomes an ideal starting conditionin calculations of profile during various types of charging, e.g., pulse
charging. Such calculations, however, should be performed with the func-tional D for the particular battery contiguration (separator and electro-lyte) under consideration.
ORIGINAL Pl^Gh; I^
or pooh QU t'-LITY
9
Because diffusion is so rapid, transport by conve{
discussion would be a moot point.
CONCLUDING STATEMENTS
1. Tile diffusion coefficients for potassium zincate and sodium zincatehave been determined at high zincate concentrations.
Z. They are highly dependent on the viscosity of the solution, follow-ing the Stokes-Einstein equation.
3. Tile measured values of D are characteristic of the zincate ion(not the cation) and independent of its concentration.
4. Because of the magnitude of D, the zincate concentration in analkaline battery can become uniform in tens of hours. Thus, in terms of
zincate profile, prolonged standing of a discharged cell can cause no
detrimental effects.

i10
l
riI
r 1)
1 1
APPENDIX A
EQUATIONS FOR FINITE SIZE DIFFUSION CELLS
The purpose of this appendix is to d:termine if Eq. [1] for aninfinite Length diffusion cell can be used for our experimental setup.Crank (Ref. 6, Eq. 2.17) presents an equati-. which gives the conccni;atJon
profile for the diffusion system consisting of two butted celumn-; of finite
length.
Co '—\( h + 2mk - x' h - 2m.Z + x'}
C = erf +erf I (Al i2 2,7Dt 2
where
2 is the total length of both columns
u the length of the "zincate rich" colurrul
x' distance measured from the end of the "zincate rich" column
C= C at t= O for 0< x' - h0
C- U at t = O for It x' < k
To use Eq. [All it must be converted to our spacial coordinate sys-
tem. Thus we set
x' = L• + x [A21
and
R-211 [A3]
We also define q to be the ratio of half the cell length to the distance(from the interface) at which the concentration is measured.
q=1i [AlX
Combining Eqs. [Al] through [A4] vields
m
C 2—o Srerf (4mq - 1 ) x + erf [2q(1 - 2m) + 1 ]K^
[AS]Ut
i
ORIGINAL PAGE IS
OF POUR QUA11TY I

Because this equation [A5] is relatively difficult to handle, we derivedthe equation in simpler form by returning to the general form of the equa-
tion for planer diffusion (Kef. 6, Eq. 2.25).
-x2DtC z (Am m msin \ x' + B cos mx')e m
[A6]
m=1
where the A 's, B 's, and a 's are constants. The coordinate system andthe limits are • h ,. `nsame as those for Eq. [A1] so that E.q. [A6]can be reflected at 0, 4, 2Z, etc. thereby one finds
xm R[A7J
Am = 0 [A8]
Via the limits used fcr I:q. LAl], evaluation of the Fourier seriesconstants (ltef. 11, p. 71), and Ens. [ .17] and [A8]; U. [Au]
ma y be written for t = 0.
I_C - Co + nm sir.(mT 1
cos ^m^k ) [A9 ]J JJ
M-1
From Eq. [A9], the B 's become known and Eq. [A6] for any timema y be written as follows .m
m
C h 2 mnh 'mnx' -(mn)2Dt/22A + sin -i J cos` e [A10J
o
,m^
Transformint, I'q. jAlU into our set of variables via Eqs. [A2]to !A41 givr.s:
X_
^^ l l
C = 1 + 2 sin( mn ) cos!mn ( 1 Y 1 e ^4q/2/ (,1111Co 2 _^ nm \ 2 / ^_ 2 1 q /]odd m
or1
xC
1 - ^^ 2 sin( M, l e
(
^ [Al2 JC o 2 ( nm \2q
odd m
I

IL
12
Fig. 5 is a plot of C/C o -igainst x/2 y'b7, for various values ofq. The curves are compared with Eq. [1] (dashed line Fig. 5)
Co x
C -- 2 P.rf [i]2 Dt
which is applicable for infinitely long columns. One can see irmeuiatelythat it is the value of q that determines the validity of Eq. [i].For q > 10, Eq. [Al2] essentially coincides with Eq. [1]. As q _e-creases, deviation of Eq. [Al2] from Eq. [1] is apparent at small valuesof x/2v'D--t-. As q decreases more, the deviation becomes greater cnd be-gins at larger values of x/21Dt. At q = 1, there 4-s no region of agree-ment between Eqs. [1] and [Al2].
In this report, q = 6 for the electrodes closest to the buttedinterface. From Fig. 5, one can see that Eqs. [1] and [Al2] are inexcellent agreement except where 0.6 > C/C o > 0.4. And even in thisregion, agreement is reasonable. Theiefore in this report, we have usedEq. [1] to approximate the behavior of the zincate concentration at theelectrode close to the butted interface in our diffusion experiment.
I^
ORIGINAL ^
OFU
^ITy1)()()R

13
APPENDLX B
MLTHOD
A in tliod such as we used is generally avoided by most investigatorsbecause possible convect'_ve transport might mask the diffusion or at leastsubject the vdlue of D to considerable error ill positive direction.However, at least some convection cannot be ruled out of any method. Al--though convection can occur during the mere standing of the cell due toslight disturbances, most interference from convection would likely be pro-duced by the initial butting or final sampling. We avoided a samplingeffect by ill measurement of a potential. The effect of initial buttingwas minimized by th, sliding procedure lied. The result was well behavedprofiles (e.g. , ' ig. ?) . Mother contra') , ' ing factor to , ,,e success ofthe nx thod for the zincate species may havc been the small (4 percent)density difference between the solutions in the upper and middle chambers(tile denser being in the middle chamber) .
Cci:L;li,i aspects of the use of E as :I measure of zillcate concentra-tion should also be discussed. At zero time, the upper chamber lids negli-gible zincate content so that the electrodes ill chamber are probablyoperating more as oxygen electrodes. This situation, however, gave notrouble ill present investigation because only large t values were
'd for the calculation of D. Another factor that could prevent E from_ng all measure of the diffused zincate arises from the very slow
chemical dissolution of (even amalgamated) zinc electrodes making such elec-trodes less negative due to build up of zincate at the surface. This wouldbe a proportionally greater effect oil electrodes in the upper chamberand far from the butted interface and account for the greater reliabilityof electrodes close to the interface:. moreover, at lower values of Co,the dissolution of zinc should have a proportionally greater effect on allvalues of C measured; this could result in all in D in the posi-tive direction in keeping with the slightly higher D we found for0.3 molar potassium zincate.
.Dote that this general method c:nl be applied to the determination ofD for other ions. Ali example would he Llic Fe +3 ion in the presence ofa constant Fe+= ion concentration: the E for Fe +3 - Fe+2 redox reactioncould be used is a measure of the Fe +3 concentration.
ORIGINAL PAGE, ISOF POOR (1UALITY

C31
C41
W
14
APPENDIX C
TIi`E REQUIRED TO ACHIEVE UNIF0101 ZINCATE CONCENTRATION
In this report, we are 'iterested in tLe time required to achieve a
nearly uniform zincate concentration in a battery. The worst starting
condiLion for achieving the siLU atloll is the presence of alt the zincate
at the collector surface at the start, either as a precipitate or in solu-
tion. All equation describing the former case has been derived elsewhere
( ef. v, T ' However, for the latter case, only an equation for an
infinitely long chamber is readily available.
2
C
^E-x/4Dt
(,TDt) 1/2 e
The purpose of this appendix is to derive the corresponding equationfor a finis.. long chamber and from it to derive the time required to achievea uniform concentration profile. To start, we again turn to the general
solution ( q. A6 ) for planar diffusion. Because r [AV, to IA91
are valid, one may proceed to
Wr-^2
C h 2 mnh m1Tx-("TT)
^ +
TTM sinl ) cost e [A101
o —^m=1
No transformation of variables is needed because h is very small. P1,the nklss per unit cross section is given by the following two equations.
!Cil
[C2M = C h0
and
M = C £e
where C is C at infinite time. Thus,W
W
= 1 + 2 CoslmTTx)e-(mn)2 We 2
m=1
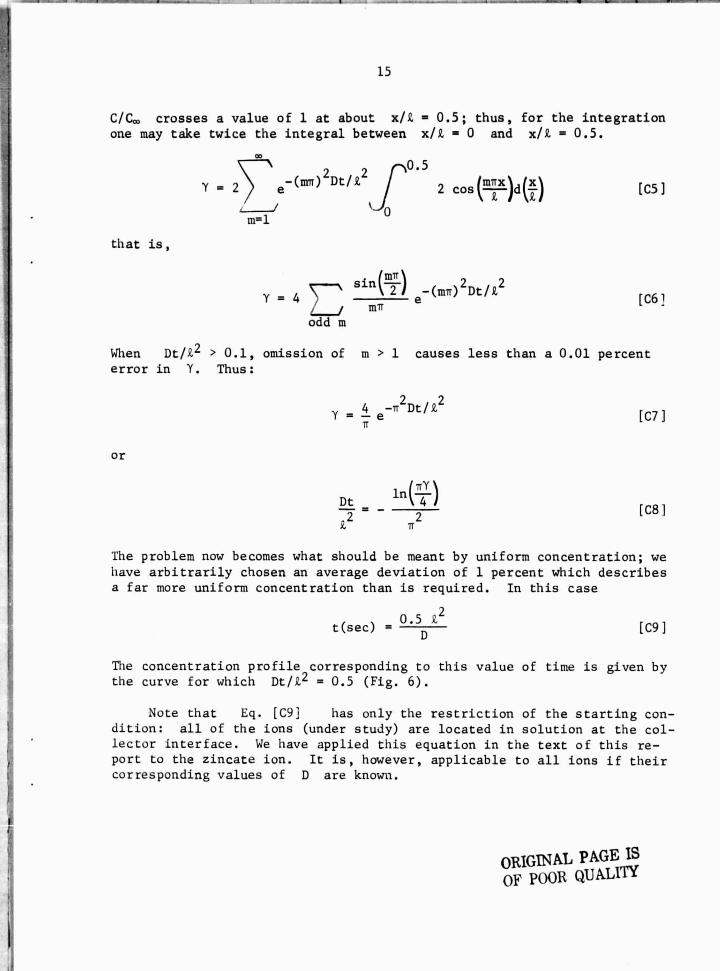
In 6, C/C,„ is plotted against x/^ for various values of
DO Z2 . For large values of Z, IC4 and ', Cl' are in agreement
as is to be expected.
our inLerest is in the value of Dt/Z 2 required for a uniform con-
centration profile; therefore let us calculate the average deviation, Y,
of C/Cw irom 1: this requires an integration over all values of x/R.
hlirn C,t /.= 0.1 ("ig. b), the concentration is nearly uniform and
i
yi
15
C/Cm crosses a value of 1 at about x/k = 0.5; thus, for the integrationone may take twice the integral between x/k = 0 and x/k = 0.5.
00
0.5
Y = 2 e-(mT')2Dt/k2 2 cos(mnx )d (x ) [C5]
^_T\\
z z
m=1
that is ,
mn
Y = 4 sin( 2 e-(mr)2Dt/k2 C6mn
odd m
When Dt/k 2 > 0.1, omission of m > 1 causes less than a 0.01 percenterror in Y. Thus:
Y = 4 e-n2Dt/k2
TT
or
7'y
Dt In 4 / [C8]k2 =- ^2
The problem now becomes what should be meant by uniform concentration; wehave arbitrarily chosen an average deviation of 1 percent which describesa far more uniform concentration than is required. In this case
t (sec) = 0.5D k2
[C91
The concentration profile corresponding to this value of time is given bythe curve for which Dt/k2 = 0.5 (Fig. 6).
Note that Eq. [C9] has only the restriction of the starting con-dition: all of the ions (under study) are located in solution at the col-lector interface. We have applied this equation in the text of this re-port to the zincate ion. It is, however, applicable to all ions if theircorresponding values of D are known.
ORIGINAL PAGE IS
OF POOR QUALITY
[C71
0 a r

16
ERENCES
E., and Sabo, Brian E., Relation ofed Zinc to Ion Concentration Profile,
NASA TN D-8527, 1977 .
2. McBreen, James, Study to Investigate and Improve the Zinc Electrode
for Spacecraft Electrochemical Cells, NASA CR-92599, October 1967.
3. Dirkse, T. P., in Power Sources 3, Res. Develop Non-Mech. Elec. PowerSource, Proc. Int. Symp. 7th 1970, Derek 11. Collins, editor, pp.
485-493, Oriel Press, Newcastle upon Tyne, Eng. y
4. McGregor, R., "Diffusion and Sorption in Fibers and Films, Vol. 1,An Introduction with Reference to Dyes," Academic Press, New York
(1974).
5. Tuwiner, Sidney B., with sections by Miller, Lawrence P., and Brown,
W. E., "Diffusion and Membrane Technology," Reinhold PublishingCorporation, New York (1962).
6. Crank, J.: The Mathematics of Diffusion, Oxford University Press,
1956.
7. Philipp, Warren H. and May, Charles E., Functioning of Inorganic/
Orgy anic Battery Separators in Silver-Zinc Cells, NASA TM X-3357,1976.
8. Cooper, J. E. and Fleischer, Arthur, editors, Characteristics of
Separators for Alkaline Silver Oxide Zinc Secondary Batteries;Screening Methods, pp. 115-126, Air Force Systems Command, Air
Force Aero Propulsion Lab. AD 447301, 1964.
9. Investigation and Improvement of Zinc Electrodes for Electrochemical
Cells, NASA CR-84025, December 1965.
10. Weast, R. C., editor, Handbook of Chemistry and Physics 52nd edition,1972-1972, pp. D205, D216, and F36, CRC Press, Cleveland, 0. (1972).
11. Sokolnikoff, Ivan S. and Sokolnikoff, Elizabeth S., "Higher Mathe-matics for Engineers and Physicists," p. 71, McGraw-Hill Book
Company, Inc., New York (1941).
I
i
I
il

TOP CLAMP
.64-
r—
UPPERCHAMBER ' 290^^^
CELLULOSE -`
.290,-
REFERENCE;^ « ELECTRODE
^, II q II
LOWERCHAMBER
.n00d'
w
142^
.142MIDDLECHAMBER
.1424:
.142
u/^Y
64 <= "^1
GUIDE
TRACKUPPER
CHAMBER
la) DISASSEMBLED.
Figure 1. - Schematics of diffusion cell Ithickness dimensions are in centimeters.Central hole in spacers and zinc sheet are 1. 27 cm in diameter. Shaded piecesare zinc sheet: electrodes or shims. Clamping bolts are not shown in bl andIC). I.
UPPER
FRONT EN;. OF GUIDE CHAMBER
TRACK FOR UPPER FILLING ELECTRODES
CHAMBER HOIE-
t^MIDDLE CHAMBERELECTRODES
REFERENCE -ELECTRODE -
CELIUIOSE
Oil ASSEMBLED, FILLING POSITION.
SLIDE TO BUTTEDSOLUTION POSITION
IU ASSEMBLED, RUNNING POSITION.
Figure 1. - Concluded.
OF Poolt Q
i
I
Ir•
-- -

0
°°310 '011Vb NOIIVWN30NOD
i1
I
N— _
S O
_ C
O qY Z 1^O N qZ Z o C
_N rA Qp p
y
'^ u _yyO ^q LL LL c F
K d'OO N oY
C N _ n^ a O
O Q av^ is
U C
N U >
c,o -• 4ti —
O aD `O O N O
As1Z W) '1N313131303 NOISf133I0 31V3NIZ
o E
N
•rI N
d n ^ N q
W G4.JO
_. 11e va q DO
^
g u.O
yoI..i
O L C
'_ ^WV
'N v+ .O nz W
LL E n PB.noaoUZ O
Z C)Z N z 4 v`
^ CO
Arv
.-+ oD ^O Q N O O
0313
OI1V8 N011Va1N33NO3
NASA•Lewi n
w 3 0U OO c
W q >v H >Q:
O Z uIn — o cx a o
v '^ E
aV C U0p V ^LL I OOO a .o a
Q C ^ qd' O+ 6 >
O iLL
N
^dC u
I N N Qx
I
N ^
^ '_' ^ 61 NNO ^ Orn N ^2 D ^^QW
C Oat.O ^ q y
C> UZU v
q — y ^n-it > o
v ^^ CS-o c c E cZSn N (n ,o O
.o o ^ u,n_' O% i" y C N'= ^
ZIri a a
LL
? N, y CCLL
NO 00 O Q N p ^
0313 'OI1VN NOI1V2llN3)NO)
N7 o
< O
Nn+ Q ^ '^ Ea
rq
c
W ^ Oz o! O G O
O q 4 CaC W 'u
U,0 2
'aI
Zq O
O
v — _O
NNN ^
^
MO^ n a
`
_O
66 ^T O
_TW
)as1Z W0 '1N313133303 NOISf133I0 31V14I7
ORIGINAL PAGE,
OF pWit QUALITY
1 1- I
i
^I