determination of tumor margins with surgical specimen ... · determination of tumor margins with...
TRANSCRIPT
1
Determination of Tumor Margins with Surgical Specimen Mapping Using Near-Infrared
Fluorescence
Rebecca W. Gao1, Nutte (Tarn) Teraphongphom
2, Nynke S. van den Berg
2, Brock A. Martin
3,
Nicholas J. Oberhelman2, Vasu Divi
2, Michael J. Kaplan
2, Steven S. Hong
2, Guolan Lu
2, Robert
Ertsey2, Willemieke Tummers
5, Adam J. Gomez
3, F. Christopher Holsinger
2, Christina S. Kong
3,
A. Dimitrios Colevas4, Jason M. Warram
6, Eben L. Rosenthal
2
1Stanford University School of Medicine
2Department of Otolaryngology – Head and Neck Surgery, Stanford University
3Department of Pathology, Stanford University
4Department of Medicine, Division of Oncology, Stanford University
5Department of Surgery, Leiden University Medical Center, Netherlands
6Department of Otolaryngology, University of Alabama at Birmingham
RUNNING TITLE
Fluorescence tumor-mapping can predict positive surgical margins.
KEYWORDS
fluorescence, near-infrared imaging, head and neck cancer, clinical trial, image-guided surgery
CONFLICTS OF INTEREST
The laboratory received equipment loans from SurgVision and NOVADAQ. The authors report
no conflicts of interest.
on June 16, 2020. © 2018 American Association for Cancer Research. cancerres.aacrjournals.org Downloaded from
Author manuscripts have been peer reviewed and accepted for publication but have not yet been edited. Author Manuscript Published OnlineFirst on July 2, 2018; DOI: 10.1158/0008-5472.CAN-18-0878
2
FINANCIAL SUPPORT
This work was supported by the Stanford Comprehensive Cancer Center, the Stanford University
School of Medicine Medical Scholars Program, the Netherlands Organization for Scientific
Research (019.171LW.022), and the National Institutes of Health and the National Cancer
Institute (R01CA190306, R21CA182953, R21CA179171, T32CA091078).
CORRESPONDING AUTHOR
Eben L. Rosenthal
Professor of Otolaryngology and Radiology
Ann & John Doerr Medical Director
Stanford Cancer Center
875 Blake Wilbur Drive
Stanford, CA 94305
Tel: 650 723 4250
Email: [email protected]
on June 16, 2020. © 2018 American Association for Cancer Research. cancerres.aacrjournals.org Downloaded from
Author manuscripts have been peer reviewed and accepted for publication but have not yet been edited. Author Manuscript Published OnlineFirst on July 2, 2018; DOI: 10.1158/0008-5472.CAN-18-0878
3
LIST OF ABBREVIATIONS AND ACRONYMS
EGFR = epidermal growth factor receptor
HNSCC = squamous cell carcinoma arising from the head and neck
FDG = fluorodeoxygluocse
NIR = near-infrared
TBR = tumor-to-background ratio
MFI = mean fluorescence intensity
ECG = electrocardiogram
IHC = immunohistochemistry
CK = cytokeratin
ROC = receiver operating characteristic
ROI = region of interest
on June 16, 2020. © 2018 American Association for Cancer Research. cancerres.aacrjournals.org Downloaded from
Author manuscripts have been peer reviewed and accepted for publication but have not yet been edited. Author Manuscript Published OnlineFirst on July 2, 2018; DOI: 10.1158/0008-5472.CAN-18-0878
4
ABSTRACT
For many solid tumors, surgical resection remains the gold standard and tumor-involved
margins are associated with poor clinical outcomes. Near-infrared (NIR) fluorescence imaging
using molecular agents has shown promise for in situ imaging during resection. However, for
cancers with difficult imaging conditions, surgical value may lie in tumor-mapping of surgical
specimens. We thus evaluated a novel approach for real-time, intraoperative tumor margin
assessment.
21 adult patients with biopsy-confirmed squamous cell carcinoma arising from the head
and neck (HNSCC) scheduled for standard-of-care surgery were enrolled. Cohort 1 (n=3)
received panitumumab-IRDye800CW at an intravenous microdose of 0.06 mg/kg, cohort 2A
(n=5) received 0.5mg/kg, cohort 2B (n=7) received 1mg/kg, and cohort 3 (n=6) received 50 mg.
Patients were followed 30 days post-infusion and adverse events were recorded. Imaging was
performed using several closed- and wide-field devices. Fluorescence was histologically
correlated to determine sensitivity and specificity.
In situ imaging demonstrated tumor-to-background ratio (TBR) of 2-3, compared to ex
vivo specimen imaging TBR of 5-6. We obtained clear differentiation between tumor and normal
tissue, with a three-fold signal difference between positive and negative specimens (p<0.05). We
achieved high correlation of fluorescence intensity with tumor location with sensitivities and
specificities >89%; fluorescence predicted distance of tumor tissue to the cut surface of the
specimen.
This novel method of detecting tumor-involved margins in surgical specimens using a
cancer-specific agent provides highly sensitive and specific, real-time, intraoperative surgical
on June 16, 2020. © 2018 American Association for Cancer Research. cancerres.aacrjournals.org Downloaded from
Author manuscripts have been peer reviewed and accepted for publication but have not yet been edited. Author Manuscript Published OnlineFirst on July 2, 2018; DOI: 10.1158/0008-5472.CAN-18-0878
5
navigation in resections with complex anatomy which are otherwise less amenable to image
guidance.
SIGNIFICANCE STATEMENT:
This study demonstrates that fluorescence can be used as a sensitive and specific method
of guiding surgeries for head and neck cancers and potentially other cancers with challenging
imaging conditions, increasing the probability of complete resections and improving oncologic
outcomes.
INTRODUCTION
Surgical resection remains the primary treatment for many solid tumors, and failure to
pinpoint residual neoplastic tissue results in positive surgical margins, which are correlated with
locoregional recurrence and poor patient outcomes, emphasizing the need for improved
intraoperative identification of tumor-involved margins (1-3).
Surgeries for squamous cell carcinomas of the head and neck (HNSCC) may especially
benefit from real-time tumor discrimination due to the unforgiving nature of tumor margins in
complex head and neck anatomy. If the resection is too conservative, the patient may suffer local
recurrence from residual tumor – too aggressive, and critical functional and aesthetic features of
the face may be compromised. Currently, intraoperative margin assessment relies on frozen
analysis of select tissue specimens, a time-intensive method which can only sample a small
portion of the wound bed or the primary specimen and is limited to certain tissue types.
There have been several attempts in different cancer types at developing suitable
techniques for the real-time assessment of tumor margins, including radiofrequency
on June 16, 2020. © 2018 American Association for Cancer Research. cancerres.aacrjournals.org Downloaded from
Author manuscripts have been peer reviewed and accepted for publication but have not yet been edited. Author Manuscript Published OnlineFirst on July 2, 2018; DOI: 10.1158/0008-5472.CAN-18-0878

6
spectroscopy, Raman spectroscopy, photoacoustics, optical coherence tomography, Cerenkov
luminescence using fluorodeoxygluocse (FDG) tracers, and sheet light microscopy, among
others (4-6). These methods all have their own challenges and limitations. Notably, these
methods have largely focused on in situ imaging of tumor tissue during resection.
Although HNSCC resections may especially benefit from fluorescence guidance, they are
also uniquely challenging for optical imaging due to the orientation difficulties created by
complex and heterogeneous topography and interference from shadowing – especially within the
oral cavity (7). As such, in the case of head and neck cancers and other cancers with difficult in
situ imaging conditions, surgical value may primarily lie in the fluorescence evaluation of
surgical specimens.
Conveniently, over 90% of HNSCC overexpress the epidermal growth factor receptor
(EGFR), presenting an attractive, cancer-specific target for contrast agents (8). EGFR is a
transmembrane cell surface glycoprotein frequently overexpressed in many other types of solid
tumors as well, broadening its oncologic applicability (9). We conjugated the therapeutic anti-
EGFR antibody panitumumab to a near-infrared (NIR) fluorescent dye and evaluated
panitumumab-IRDye800CW in a dose-escalation clinical trial. We chose to repurpose an FDA-
approved therapeutic agent for imaging given the already-demonstrated safety, regulatory
efficiency, cost savings, and promising in-human results (10-14).
Panitumumab is a fully-humanized monoclonal IgG2 antibody that binds to the
extracellular domain of EGFR with high affinity, and it was first FDA-approved in 2006 for
metastatic colorectal cancer (15,16). Preclinical research with panitumumab-IRDye800CW
showed high tumor-to-background ratios (TBRs) and the ability to detect microscopic areas of
disease invisible to the naked eye (16,17). Previous research on another anti-EGFR antibody,
on June 16, 2020. © 2018 American Association for Cancer Research. cancerres.aacrjournals.org Downloaded from
Author manuscripts have been peer reviewed and accepted for publication but have not yet been edited. Author Manuscript Published OnlineFirst on July 2, 2018; DOI: 10.1158/0008-5472.CAN-18-0878
7
cetuximab-IRDye800CW, demonstrated promising results, and, due to the higher binding
affinity and improved safety profile of panitumumab, we chose panitumumab-IRDye800CW to
evaluate a new, innovative method of utilizing fluorescence for tumor discrimination and tumor-
mapping of surgical specimens (18).
The primary aims of our study were to provide evidence of safety, tumor-specific uptake,
and assessment of tumor-involved margins in surgical specimens vs. in situ imaging using an
intravenously administered panitumumab-IRDye800CW in patients with HNSCC.
MATERIALS AND METHODS
Study Design
We performed a single center, non-randomized, prospective phase I study. The study
protocol was approved by the Stanford University Institutional Review Board (IRB 35064) and
the FDA (NCT 02415881), and written informed consent was obtained from all patients. The
study was performed in accordance with the Declaration of Helsinki, FDA’s ICH-GCP
guidelines, and United States Common Rule.
All adult patients with biopsy-proven, primary or recurrent HNSCC scheduled to undergo
standard-of-care surgery with curative intent were eligible. Exclusion criteria included: a life
expectancy of less than 12 weeks, a Karnofsky performance status <70%, prior infusion
reactions to monoclonal antibodies, QT prolongation on screening electrocardiogram (ECG) (>
440ms in males, and > 450ms in females), significant cardiopulmonary or liver disease,
abnormal electrolyte values, and/or utilization of Class IA or Class III antiarrhythmic agents.
Four cohorts of patients were enrolled in this dose escalation study. Cohort 1 (n=3)
received a microdose of 0.06 mg/kg (1/100 of one therapeutic panitumumab dose) and was
on June 16, 2020. © 2018 American Association for Cancer Research. cancerres.aacrjournals.org Downloaded from
Author manuscripts have been peer reviewed and accepted for publication but have not yet been edited. Author Manuscript Published OnlineFirst on July 2, 2018; DOI: 10.1158/0008-5472.CAN-18-0878

8
primarily assessed for safety. Cohort 1 was not included in the statistical analysis and served
only as a negative reference point, as the devices were insufficiently sensitive to detect this
concentration level of dye. Cohort 2 was used to assess for ranging dose. Cohort 2A (n=5)
received a loading dose of 100 mg of unlabeled panitumumab followed by a 0.5 mg/kg (1/12 of
therapeutic) infusion of the study drug, conjugated panitumumab-IRDye800CW. Cohort 2B
(n=7) received the same loading dose as cohort 2A and an infusion of 1 mg/kg (1/6 or
therapeutic) of panitumumab-IRDye800CW. Cohort 3 (n=6) received a fixed dose of 50 mg of
panitumumab-IRDye800CW. Preclinical research suggested the utility of a loading dose for
improved tissue contrast, and we thus examined dosages both with and without a loading dose,
as flat dosing may simplify dosing and minimize costs (19).
Briefly, patients were infused with the study drug 1-5 days prior to surgery, fluorescence
imaging was obtained both of the surgery and of the surgical specimens intraoperatively, and
final pathology correlation was obtained (Figure 1A-D).
Panitumumab-IRDye800CW Conjugation
Panitumumab-IRDye800 was produced under GMP at the Leidos Biomedical Research
Center (Frederick, MD). IRDye800CW-NHS (IRDye800CW-N-hydroxysuccinimide ester; LI-
COR Biosciences) as a fluorescent probe with a NIR absorption and emission peak of 778
nm/794 nm as discussed previously (17,20,21). Briefly, panitumumab (Vectibix; Amgen,
Thousand Oaks, CA, USA; 147 kDa) was conjugated to IRDye800CW-NHS by a 2-hour
incubation at 20°C in the dark with a dye to protein ratio of 2.3:1. Quality control of the
conjugate included analysis of drug product in sterile vial for particulates, and integrity of the
on June 16, 2020. © 2018 American Association for Cancer Research. cancerres.aacrjournals.org Downloaded from
Author manuscripts have been peer reviewed and accepted for publication but have not yet been edited. Author Manuscript Published OnlineFirst on July 2, 2018; DOI: 10.1158/0008-5472.CAN-18-0878

9
sterilizing filter. Upon production and vialing, vials were transported to Stanford University
where they were stored at the Stanford Health Care Investigational Pharmacy.
Safety Assessment
Adverse events were categorized according to the National Cancer Institute Common
Terminology Criteria (Version 4.0). Safety data and adverse events were collected at 15 days,
and patients were followed for 30 days post-infusion. General physical exam and Karnofsky
performance status were assessed prior to enrollment and on the day of surgery, day 15, and day
30. Serum chemistry, metabolic panels, complete blood count, prothrombin/partial
thromboplastin times, and thyroid stimulating hormone levels were obtained on day 0, day of
surgery, and as needed for up to 30 days post-drug infusion. ECGs were performed at screening,
30 minutes post-infusion of the unlabeled-antibody loading dose, 2 hours post-infusion of the
antibody-dye complex, and day 30.
Intraoperative NIR Imaging
Intraoperative imaging was performed using two wide-field optical imaging systems
modified for IRDye800 fluorescence imaging: PINPOINT (Novadaq, Burnaby, Canada), and
SurgVision Explorer Air (SurgVision BV, Netherlands). During surgery, NIR imaging of the
primary tumor was performed prior to and during tumor resection. After tumor removal, the
wound bed was imaged. The surgeon then obtained tissue specimens from the wound bed at
select margin areas most suspicious for residual tumor involvement according to clinical
judgment. In patients undergoing neck dissections, we imaged the lymph nodes and post-
dissection wound bed. Our protocol stipulated that imaging data would not guide the surgical
on June 16, 2020. © 2018 American Association for Cancer Research. cancerres.aacrjournals.org Downloaded from
Author manuscripts have been peer reviewed and accepted for publication but have not yet been edited. Author Manuscript Published OnlineFirst on July 2, 2018; DOI: 10.1158/0008-5472.CAN-18-0878
10
procedure, and all resections was performed per standard of care. To minimize ambient lighting,
overhead, head-lamp, and room lights were turned off for imaging.
All patient specimens (including the primary tumor specimen, wound bed margins, and
lymph nodes) were imaged on the OR back table immediately after resection. Imaging was
performed using a closed-field NIR optical imaging system (Pearl Triology imaging platform;
LI-COR Biosciences; 800 nm channel) and the two wide-field imaging devices previously
described. Images from the open-field devices were immediately available on the screen in real-
time as a continuous video. The images for the closed-field device (i.e. PEARL) took
approximately 15 seconds to capture.
Histopathology Processing
The surgical specimens were processed for frozen section or formalin-fixation by the
pathologist. Select wound bed margins underwent frozen section analysis and the specimens
were exhausted. All other specimens were fixed in formalin. After formalin-fixation, the primary
tumor was sliced at 5-mm intervals and sectioned to fit in cassettes. The cassettes were imaged
with a closed-field NIR optical imaging system (Pearl Triology imaging platform; LI-COR
Biosciences; 800 nm channel) for measuring fluorescence signal. The specimens in the cassettes
were embedded in paraffin for standard histologic processing.
Formalin-fixed paraffin-embedded (FFPE) specimen blocks were serially sectioned at 5
µm thickness. The slides were dried overnight at 37°C and baked for 2 hours at 65°C. Both
FFPE blocks and slides were scanned for NIR fluorescence using the Odyssey CLx scanning
system (LI–COR Biosciences, Lincoln, Nebraska, USA), using the 800-nm channel, at 21-μm
lateral spatial resolution and the highest quality setting.
on June 16, 2020. © 2018 American Association for Cancer Research. cancerres.aacrjournals.org Downloaded from
Author manuscripts have been peer reviewed and accepted for publication but have not yet been edited. Author Manuscript Published OnlineFirst on July 2, 2018; DOI: 10.1158/0008-5472.CAN-18-0878

11
Immunohistochemistry
FFPE tissue slides were deparaffinized with xylene and rehydrated in 100/70/50%
concentration ethanol. One slide from each FFPE blocks was stained with hematoxylin and eosin
(H&E) according to standard procedure. All slides were examined by a board-certified
pathologist to delineate tumor.
Additionally, selected blocks were immunohistochemically (IHC) evaluated for EGFR
expression and tumor identification. Briefly, slides were treated with heat-induced antigen
retrieval in EDTA-based buffer (pH 9.0) for 15 minutes, followed by endogenous peroxidase
blocking for 30 minutes. For EGFR staining, tissue sections were incubated for 2 hours with
anti-EGFR primary antibody (clone EP38Y, prediluted; in 0.025mol/L Tris-HCl, Thermo Fisher
Scientific, Waltham, Massachusetts, USA), then followed by a 30-minute incubation with goat-
anti-rabbit secondary antibody (Vector Laboratories, Burlingame, California, USA). For
cytokeratin (CK) staining, the slides were incubated with the anti-pan cytokeratin monoclonal
antibody AE1/AE3 (ab961, Abcam, Cambridge, United Kingdom) and followed by a 30-minute
incubation with goat anti-mouse secondary antibody (Vector Laboratories, Burlingame,
California, USA). Both EGFR and CK slides, were treated with streptavidin for 1 hour and
ImmPACT DAB Peroxidase (HRP) (Vector Laboratories, Burlingame, California, USA) for 5
minutes. Sections were counterstained with Mayer’s hematoxylin, dehydrated in a series of
alcohol and xylene, and coverslipped with mounting media. Stained slides were scanned digitally
using a whole slide scanner (Hamamatsu NanoZoomer 2.0-RS, Hamamatsu, Japan).
Microscopy Fluorescence Imaging
on June 16, 2020. © 2018 American Association for Cancer Research. cancerres.aacrjournals.org Downloaded from
Author manuscripts have been peer reviewed and accepted for publication but have not yet been edited. Author Manuscript Published OnlineFirst on July 2, 2018; DOI: 10.1158/0008-5472.CAN-18-0878
12
For fluorescence microscopy, selected tissue slides were deparaffinized, and the nuclei
were counterstained with 4',6-diamidino-2-phenylindole (DAPI, Prolong Gold, Life
Technologies, California, USA). Stained slides were dried in the dark at 4°C overnight. The
slides were imaged using a custom set-up inverted digital fluorescence microscope (DM6B Leica
Biosystems, Amsterdam, Netherlands) equipped with a highly-sensitive Leica DFC9000GTIs
camera (4.2M Pixel sCMOS camera), a metal halide LED light source (X-Cite® 200DC,
Excelitas™ Technologies, Fremont, California, USA) for DAPI imaging, and a xenon arc lamp
LB-LS/30 (Sutter Instrument, Novato, California, USA) for NIR imaging of IRDye800. Image
acquisition and processing was done through LAS X software (Leica Biosystems, Amsterdam,
Netherlands). Images were stitched using Adobe Photoshop CS6.0 software.
Data Analysis
Image Analysis
The images from the wide-field devices were analyzed using ImageJ (version 1.50i,
National Institutes of Health, Bethesda, Maryland, USA). For imaging data acquired by the
SurgVision Explorer device, images were processed into a compatible format using integrated
instrument software for the SurgVision (SV_view, SurgVision BV, Netherlands) prior to ImageJ
analysis.
For in situ imaging of the primary tumor, the tumor-to-background ratios (TBRs) were
calculated as fluorescence intensity of the primary tumor divided by the fluorescence intensity of
the background (peritumoral area). Peritumoral tissue for in situ imaging was standardized and
defined as the area immediately adjacent to tumor tissue with the same-sized area as the tumor.
The region of interest (ROI) for tumor was determined based on the fluorescence images and
on June 16, 2020. © 2018 American Association for Cancer Research. cancerres.aacrjournals.org Downloaded from
Author manuscripts have been peer reviewed and accepted for publication but have not yet been edited. Author Manuscript Published OnlineFirst on July 2, 2018; DOI: 10.1158/0008-5472.CAN-18-0878

13
confirmed with H&E. Peritumoral tissue was chosen as the background fluorescence to capture a
TBR more reflective of realistic views of the tumor during resections.
For the back-table imaging of the lymph nodes and sectioned primary tumor specimens,
TBRs were calculated as fluorescence intensity of the entire specimen divided by the
fluorescence intensity of a piece of muscle from the patient. Muscle has low EGFR expression
and therefore served as a negative control.18
This alternate method was used because tumor vs.
peritumoral area could not be delineated, since the purpose of pathological analysis of these
specimens is to determine whether or not tumor tissue is involved.
For the back-table imaging of the wound bed margins, TBRs were calculated as
fluorescence intensity of the entire specimen divided by average fluorescence intensity of three
randomly-selected spaces (not including the specimen itself) with the same size as the specimen.
This calculation method was used because the wound bed margins are often sent for frozen
section pathological analysis intraoperatively, prior to availability of a muscle specimen for
comparison.
Correlation of EGFR Expression and Fluorescence Intensity
To determine the correlation between fluorescence intensity and EGFR expression, three
ROIs were randomly drawn based on each IHC stained EGFR slide. The mean fluorescence
intensity of the ROIs was measured in a consecutive tissue slide from Odyssey® CLX
fluorescence scanning system (LI-COR Biosciences, Lincoln, Nebraska, USA) and the system’s
integrated instrument software (ImageStudio, LI-COR Biosciences, Lincoln, Nebraska, USA).
Staining intensities for EGFR in each of the corresponding ROIs were calculated through
analysis of whole slide scanned images (Hamamatsu NanoZoomer 2.0-RS, Hamamatsu, Japan).
on June 16, 2020. © 2018 American Association for Cancer Research. cancerres.aacrjournals.org Downloaded from
Author manuscripts have been peer reviewed and accepted for publication but have not yet been edited. Author Manuscript Published OnlineFirst on July 2, 2018; DOI: 10.1158/0008-5472.CAN-18-0878

14
Image analysis was done in ImageJ. Images thresholds and the percentage of EGFR positive
stained area related to the total ROI area were calculated (EGFR-stained area/total ROI area),
and a regression line was generated.
Correlation of Fluorescence Signal with Tumor Depth
After removal from the patient, the gross primary tumor specimen was imaged by closed-
field fluorescence imaging devices of the entire deep margin surface (Supplementary Figure 2A-
B). The threshold was calculated using the average of the mean fluorescence intensities of tumor
tissue in primary tumor specimens as the standard for tumor tissue fluorescence signal, and we
used one half that MFI value as the threshold for fluorescence. All areas on the deep margin
surface of the gross specimen exceeding this threshold were considered positive for fluorescence,
and all other areas were negative. Pathology slides sectioned from fluorescent areas of the deep
margin were considered fluorescence-positive.
The distance between the tumor-involved tissue and the deep margin surface of the
specimen for each pathology slide was measured using ImageJ for both fluorescence-positive
and fluorescence-negative slides. The lateral width of the tumor area was measured and divided
into ten equal intervals (Supplementary Figure 2C). At the beginning of each interval, the
straight-line distance between the tumor-involved area and the deep margin surface was
measured for a total of ten measurements per slide (Supplementary Figure 2D). The average
distances of tumor-involved tissue from the deep margin in fluorescent-positive slides were
compared to average distances in fluorescence-negative slides using unpaired, two-tailed t-tests
by patient and by cohort.
on June 16, 2020. © 2018 American Association for Cancer Research. cancerres.aacrjournals.org Downloaded from
Author manuscripts have been peer reviewed and accepted for publication but have not yet been edited. Author Manuscript Published OnlineFirst on July 2, 2018; DOI: 10.1158/0008-5472.CAN-18-0878

15
Sensitivity and Specificity
To determine the sensitivity and specificity of panitumumab-IRDye800CW for surgical
specimens, a receiver operating characteristic (ROC) analysis was performed on data from all
tissue specimens submitted for pathological evaluation. Based on each tissue cassette, we
determined the mean fluorescence intensity (MFI), defined as total counts divided by ROI pixel
area. Next, the pathologist, using the corresponding H&E slide as the gold standard, assessed
whether or not tumor was present in the cassette using a binary (yes/no) approach. We calculated
the sensitivity and specificity of the fluorescence signal of the formalin-fixed tissues against the
H&E result. Gland regions exhibited elevated fluorescence and were excluded.
To determine the sensitivity and specificity for wound bed margin assessment, we used a
slightly different approach. Recognizing the importance of sensitivity over specificity (i.e.
exclusion of false-negatives), we aimed for maximal sensitivity. The TBRs for each wound bed
margin specimen were compared to the pathology diagnosis, and the differences between the
TBRs for negative margins and positive margins were analyzed using an unpaired t test (2-tail).
Dysplastic tissue was considered “positive” because it resulted in further surgical resection.
Specimens composed completely of bone tissue were excluded due to poor fluorescence
penetration. For cohort 3 (50mg), the primary resecting surgeon was asked to predict whether
each margin specimen was involved by malignancy, and the resulting sensitivity and specificity
were compared to predictions by the fluorescence imaging.
For the deep margins, the sensitivity and specificity of the fluorescence signal in
detecting tumor-involved areas within 1mm and 2mm of the deep margin were calculated in
GraphPrism by cohort. 1mm and 2mm were selected because these are the distances commonly
used by pathologists to indicate close and/or negative resection margins for HNSCC.
on June 16, 2020. © 2018 American Association for Cancer Research. cancerres.aacrjournals.org Downloaded from
Author manuscripts have been peer reviewed and accepted for publication but have not yet been edited. Author Manuscript Published OnlineFirst on July 2, 2018; DOI: 10.1158/0008-5472.CAN-18-0878

16
Statistical Analysis
Statistical analysis was performed using a two-way ANOVA for validity of the
differences between groups where a single condition changed (Version 6.0c, GraphPad Software,
La Jolla, California, USA). Correlations of surgical imaging to quantitative measures of
fluorescence in surgical specimens, and IHC analyses of specimens were investigated for the
purposes of co-localization and correlation (Pearson correlation) and for determination of MFI
obtained by fluorescence signal. A p-value of 0.05 or less was considered statistically
significant.
RESULTS
Safety Assessment
From December 2015 to October 2017, 31 patients with biopsy-proven HNSCC were
screened for enrollment. Ten patients did not meet eligibility criteria. Patient and tumor
characteristics of the remainder 21 patients are summarized in Supplementary Figure 1. The
average age at diagnosis was 62 years old (range 32-85), and the majority presented with oral
cavity SCC (81%). Tumor size (determined by pathology) ranged from 6 to 55 mm (median 32.5
mm) in maximum dimension. Patients in cohort 1 received a microdose (0.06mg/kg or an
average of 4.7 ± 0.7mg of panitumumab-IRDye800CW), cohort 2A received 0.5mg/kg (average
39.2 ± 6.9mg), cohort 2B received 1.0mg/kg (average 69.1 ± 12.3mg), and cohort 3 received a
fixed 50 mg dose.
on June 16, 2020. © 2018 American Association for Cancer Research. cancerres.aacrjournals.org Downloaded from
Author manuscripts have been peer reviewed and accepted for publication but have not yet been edited. Author Manuscript Published OnlineFirst on July 2, 2018; DOI: 10.1158/0008-5472.CAN-18-0878
17
No infusion reactions occurred, nor were there any abnormalities in hematology or blood
chemistry levels after infusion of panitumumab-IRDye800CW that could be attributed to the
study drug. There was a single grade-1 related adverse event in the microdose cohort (0.06
mg/kg); the patient experienced an increase in the QTc interval after infusion of the study drug
but returned to baseline at the 30-day follow-up.
Cellular Localization of Panitumumab-IRDye800CW
In Figure 2A-2F, clear co-localization of fluorescence intensities from fluorescence
imaging at 800 nm showed uniform, strong cytoplasmic and membranous binding of
panitumumab-IRDye800CW (green channel) to the tumor cells. This fluorescence was not
observed in the normal tissues or the stromal compartment. Regions of high grade dysplasia
showed lower to normal uptake of dye compared to invasive cancer (Figure 2E and 2F). DAPI
(blue channel) was also used to stain the nuclei of the tissue improve image visualization. To
determine the correlation between the fluorescence intensity and tumor location, cytokeratin, and
EGFR expression, a board-certified pathologist outlined the areas of tumor (T) and normal tissue
(N) on routine H&E slides (Figure 2G-J). EGFR was highly expressed in tumor tissue and
correlated well to high levels of fluorescence; Linear regression analysis of percentage of EGFR
area and fluorescence revealed a strong correlation (r2=0.8599, p<0.001) (Figure 2K).
In Situ Surgical Imaging
Video and still-frame images were obtained during surgery, and, from these images,
TBRs were calculated to determine the ability of panitumumab-IRDye800CW to discriminate
between normal and tumor tissue (Figure 3A-D). In situ images of the primary tumor were
on June 16, 2020. © 2018 American Association for Cancer Research. cancerres.aacrjournals.org Downloaded from
Author manuscripts have been peer reviewed and accepted for publication but have not yet been edited. Author Manuscript Published OnlineFirst on July 2, 2018; DOI: 10.1158/0008-5472.CAN-18-0878
18
analyzed and plotted by cohort. Average TBRs of 2.4 ± 0.4 was found for cohort 2A (0.5 mg/kg),
2.6 ± 0.4 for cohort 2B (1.0 mg/kg), and 2.5 ± 0.4 cohort 3 (50 mg fixed dose). No statistically
significant differences were observed between the TBRs of the wide-field devices (p>0.05). In
all patients, fluorescence imaging of the surgical specimens confirmed intraoperative findings.
No intraoperative imaging was performed in cohort 1 (0.06 mg/kg panitumumab-IRDye800CW),
as the dose was too low for in situ imaging, and the primary goal was to determine study drug
safety.
Identifying the Smallest Amount of Detectable Disease
When evaluating fluorescence intensities of different tissue types in the resected
specimens, a strong correlation was found between fluorescence intensities, tissue weight, and
tissue type, with r2 of 0.93, 0.83 and 0.79 for tumor, normal muscle, and normal epithelium,
respectively (p<0.001) (Figure 3E-F). Moreover, when looking at the normalized fluorescent
signal by weight, a 12-fold increase in fluorescence signal was observed when comparing tumor
and normal muscle (p<0.0001). Similarly, a 3-fold fluorescence intensity difference was found
between tumor and normal epithelium (which also expresses EGFR) (p=0.0002).
Surgical Specimen Tumor Mapping
Tumor Detection in the Primary Tumor Specimen
Evaluation of fluorescence intensity immediately after surgical resection and prior to
formalin-fixation was performed in a closed-field device. A quantitative comparison of mean
fluorescence intensity (MFI) of the primary tumor and the enveloping uninvolved tissue
(background) and TBR are shown by cohort (Figure 3C). There is no statistically significant
on June 16, 2020. © 2018 American Association for Cancer Research. cancerres.aacrjournals.org Downloaded from
Author manuscripts have been peer reviewed and accepted for publication but have not yet been edited. Author Manuscript Published OnlineFirst on July 2, 2018; DOI: 10.1158/0008-5472.CAN-18-0878

19
difference in the background signal from cohorts 2A, 2B and 3. We achieved average TBRs of
2.67 ± 0.7 for cohort 1 (0.06 mg/kg), 5.40 ± 0.6 for cohort 2A (0.5 mg/kg) and 5.44 ± 0.7 for
cohort 2B (1.0 mg/kg) and 6.53 ± 1.2 for cohort 3 (50 mg). As expected, in cohort 1 (0.06
mg/kg), minimal fluorescence signal in surgical specimens was detected. The difference in MFIs
and TBRs between cohort 1 and the three other cohorts was statistically significant (p<0.05), but
there was no difference in TBRs between cohorts 2A, 2B, and 3.
To determine the overall specificity and sensitivity of panitumumab-IRDye800CW for
neoplastic tissue, a ROC curve was generated from the MFI data from the specimen cassettes
from each patient and plotted as sensitivity versus (1-specificity). Average positive predictive
value (PPV), negative predictive value (NPV) and area under the curve (AUC) are also displayed
(Table 1). All cohorts showed very high sensitivity and NPV (≳90%). Cohorts 2B and 3 both
showed higher specificity (91%, 92% vs. 78%) and PPV (86%, 82% vs. 68%) compared to
cohort 2A. They also demonstrated higher AUC values (0.95, 0.93 vs. 0.83), although there was
no statistical difference between cohorts 2B and 3 compared to cohort 2A, (p=0.09, p=0.2).
Tumor Detection in Margin Samples
When strips of tissue were obtained from the wound bed by the surgeon, these samples
were imaged prior to frozen sectioning (Figure 4A). The average TBR of positive wound bed
samples in cohort 2A was 18.14 and 4.63 for negative margins (p=0.0005) (Figure 4B). The
average SBR for positive margins in cohort 3 was 50.27 and 11.12 for negative margins
(p<0.0001) (Figure 4C). Only cohorts 2A and 3 had positive wound bed margins for comparison.
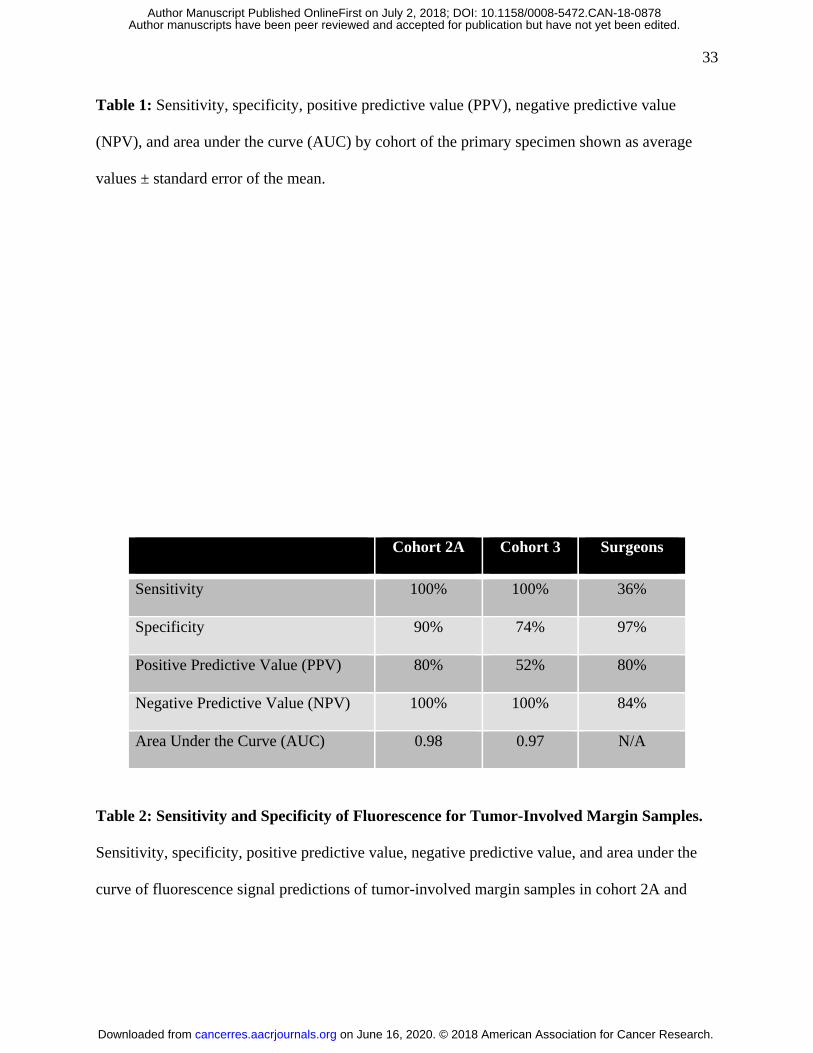
Additionally, panitumumab-IRDye800CW demonstrated a high sensitivity and specificity
for the intraoperative detection of tumor-involved margin samples. In cohort 2A (0.5 mg/kg
on June 16, 2020. © 2018 American Association for Cancer Research. cancerres.aacrjournals.org Downloaded from
Author manuscripts have been peer reviewed and accepted for publication but have not yet been edited. Author Manuscript Published OnlineFirst on July 2, 2018; DOI: 10.1158/0008-5472.CAN-18-0878

20
dose), there was a sensitivity of 100%, a specificity of 90%, an AUC of 0.98 (p=0.007), PPV of
80%, and NPV of 100% (Table 2). For cohort 3 (50mg dose), there was a sensitivity of 100%,
specificity of 74%, AUC of 0.97 (p=0.002), PPV of 52%, and NPV of 100%. Compared to the
resecting surgeon, fluorescence signal revealed the presence of disease more consistently:
fluorescence had a much greater sensitivity (100% vs. 36%) and NPV (100% vs. 84%) with less
specificity (74% vs. 97%) and PPV (52% vs. 80%).
Mapping Tumor Depth Around the Margins of the Primary Specimen
At the deep surface of the primary tumor specimen, we examined the distance of tumor
tissue from the specimen edges using fluorescence. In all three cohorts, fluorescence signal in an
area indicated that tumor tissue was significantly closer to the margin edges than in areas without
fluorescence (p<0.0001) (Figure 5A-D). There was a significant difference between the tumor
distance from the edges of fluorescent areas in cohort 2B compared to 2A and 3 (2A (p<0.001, 3
p<0.001). There was no difference between the tumor distance in fluorescent areas between
cohorts 2A and 3 (p=1).
Comparison of tumor tissue depth from the deep margin surface of the primary tumor
specimen in fluorescent areas compared to areas without fluorescence was 2.5 ± 2.4 mm vs. 7.6
± 4.9 mm for cohort 2A (p < 0.0001, 95% confidence interval 4.3-5.9), 2.5 ± 1.8 mm vs. 6.9 ±
3.5 mm for cohort 2B (p < 0.0001, 95% CI 3.6-5.1), and 3.8 ± 2.5 mm vs. 8.6 ± 3.7 mm for
cohort 3 (p < 0.0001, 95% CI 5.3-6.2).
Fluorescence had >95% sensitivity and >98% NPV for areas where the tumor-tissue was
≤ 1mm from the margin edge in all three cohorts 2A, 2B, 3 and 80-90% sensitivity and >90%
NPV for tumor tissue ≤ 2mm (Supplementary Tables 2 and 3). At both the ≤ 1mm and ≤ 2mm
on June 16, 2020. © 2018 American Association for Cancer Research. cancerres.aacrjournals.org Downloaded from
Author manuscripts have been peer reviewed and accepted for publication but have not yet been edited. Author Manuscript Published OnlineFirst on July 2, 2018; DOI: 10.1158/0008-5472.CAN-18-0878

21
cutoffs, the cohorts showed lower specificity (50-60%) and PPV (14-50%). Generally, the ≤
2mm cutoff showed modestly higher specificity and PPV and lower sensitivity and NPV
compared to the ≤ 1mm cutoff. Cohort 2B demonstrated the lowest specificity and PPV
compared to cohort 2A and cohort 3.
DISCUSSION
Fluorescently-labeled antibodies have been a promising development for achieving
tumor-specific, intraoperative guidance for oncologic resections. The focus, however, for optical
image-guided surgery has predominantly centered around in situ surgical navigation during
specimen removal. Experience in recent clinical trials suggests that open-field imaging may have
distinct limitations using current hardware, depend on instrument positioning intrusions, and
intrude on surgeon workflow (7). HNSCC and other cancers with limited exposure and narrow
wound beds that result in difficult imaging conditions may derive more benefit from specimen
tumor-mapping rather than intermittent in situ imaging. To this end, we developed several
specimen-mapping strategies to improve real-time information needed by the surgeon that
integrates into the workflow of oncologic surgery.
Compared to previous research on other cancer-specific fluorescence tracers, we present
two unique methods of utilizing fluorescence to detect tumor-involved margins within surgical
specimens: screening intraoperative margin samples and identifying close or positive margins on
deep margin of the primary tumor specimen (10-14,18,22). Margin sampling is an active area of
research and controversy, which is a primary driving motivation for our research to improve
intraoperative margin analysis through fluorescence imaging. There is significant controversy for
on June 16, 2020. © 2018 American Association for Cancer Research. cancerres.aacrjournals.org Downloaded from
Author manuscripts have been peer reviewed and accepted for publication but have not yet been edited. Author Manuscript Published OnlineFirst on July 2, 2018; DOI: 10.1158/0008-5472.CAN-18-0878

22
which locations in the wound bed and how many locations are necessary to comprehensively
determine the presence of residual disease. Surgical margins generally are obtained using two
widely-accepted methods: The first is removal of small tissue biopsies from the wound bed by
the surgeon. The second is that the entire specimen is examined by the surgeon and/or
pathologist after which margins are taken. Thus, margin selection remains a controversial area of
surgical oncology, and it is most often that the surgeon chooses the method based on personal
preference, clinical circumstance, and institutional bias (23). Sending multiple margin samples is
a resource-intensive method which can prolong anesthesia time while waiting for results. Our
data shows that positive, tumor-involved margin samples are significantly more fluorescent than
normal, negative margin samples. While the specificity is limited (74-90%), the sensitivity and
negative predictive value is exceptionally high (100%, 100%). This enables fluorescence to be an
ideal “rule out” test, allowing the clinical team to screen these margin samples and prioritize the
fluorescent ones for further examination, leading to savings of time and labor.
On the other hand, while margin samples are used for the binary evaluation of whether or
not tumor tissue is present in the sampled location, the goal for evaluating the primary tumor
specimen is altogether different. The presence of tumor in the primary tumor specimen is
undisputed, and it is instead necessary to determine resection completeness by examining how
closely tumor tissue extends to the specimen edges. The presence of tumor tissue within 1 mm of
the specimen surface is generally considered a positive margin, while tumor greater than 5 mm
away is considered negative. Presence of tumor between 1 and 5 mm from the cut surface is
often considered as a close margin. Our data indicates that fluorescence is sensitive for detection
of tumor within the 0-5 mm range, which has potential future applications in allowing
on June 16, 2020. © 2018 American Association for Cancer Research. cancerres.aacrjournals.org Downloaded from
Author manuscripts have been peer reviewed and accepted for publication but have not yet been edited. Author Manuscript Published OnlineFirst on July 2, 2018; DOI: 10.1158/0008-5472.CAN-18-0878

23
pathologists to prioritize fluorescent areas for further analysis, also leading to savings of time
and labor.
Even more specifically, our data suggests that panitumumab-IRDye800CW can
distinguish between areas of the primary specimen harboring tumor close to the edges and areas
in which tumor is farther away – thus creating a fluorescent “map” predicting tumor depth across
the entire surface of the specimen. This mapping capability can also be used to reduce the
sampling error inherent to the current standard of sampling areas of the primary tumor specimen
or the wound bed to determine the presence of tumor-involved margins. This sampling error may
be further worsened by the limited ability of the surgeon to predict (and thus select to sample)
areas with tumor-involved margins, as suggested by a 36% surgeon sensitivity for positive
margins in our trial. Fluorescence, however, may be able to map out the entire specimen surface
(the surgical margin) to identify suspicious areas of residual tumor tissue, as sampling can only
inspect a fraction of this space. By using tumor-mapping of surgical specimens, fluorescence can
potentially assist in achieving complete resections and improved oncologic outcomes.
Our data suggests that, at our current level of technology, closed-field fluorescent tumor-
mapping of surgical specimens on the OR back table may provide more consistent data
compared to open-field in situ imaging. In situ surgical imaging requires open-field devices that
are subject to interference from ambient light, reflectance, and placement at variable angles to
the tumor, whereas back-table imaging of surgical specimens can utilize closed-field devices
with a controlled environment. The in situ images showed an average TBR of 2.5 compared to
5.8 for the surgical specimen images, in part due to interference from ambient lighting. We
attempted to overcome these difficulties by reducing overhead lighting, but this often interrupts
surgical workflow, whereas surgical specimen imaging can be performed in parallel on the back
on June 16, 2020. © 2018 American Association for Cancer Research. cancerres.aacrjournals.org Downloaded from
Author manuscripts have been peer reviewed and accepted for publication but have not yet been edited. Author Manuscript Published OnlineFirst on July 2, 2018; DOI: 10.1158/0008-5472.CAN-18-0878

24
table while the surgeons operate, minimizing disruption from maneuvering the imaging devices.
These closed-field devices are inexpensive, readily available, and relatively small. Given these
advantages, closed-field devices with a controlled, standardized environment and the potential to
generate three-dimensional tumor-maps of surgical specimens may be an optimal way to
leverage current technology.
We validated our results by examining fluorescence signal with tumor and normal tissue
by linear weight measurements, and fluorescence intensity also correlated well with EGFR
expression and density. Fluorescence signal was shown to be relatively homogeneous across the
cytoplasm and cellular membrane of tumor tissue, consistent with the known antibody-receptor
complex transition from the cell surface to the cytoplasm (24). Imaging contrast between tumor
and normal tissue was consistent with preclinical data (25).
In terms of patient safety, panitumumab-IRDye800CW demonstrated a highly favorable
safety profile. There were no infusion reactions, and only one Grade 1 adverse event. This shows
improved safety over cetuximab-IRDye800CW, a compound we previously used to demonstrate
simple, initial feasibility and safety of a fluorescently-labeled anti-EGFR antibody (10). When
designing this study to evaluate the new methods for surgical specimen mapping we proposed,
we chose panitumumab-IRDye800CW instead of cetuximab-IRDye800CW in order to improve
patient safety, as panitumumab is a fully-humanized monoclonal antibody, whereas cetuximab is
a human-mouse chimera. Accordingly, since we are using much lower doses for imaging
compared to the therapeutic dose of panitumumab (which also has a safer profile as a parent
compound compared to cetuximab), it is unsurprising to see minimal adverse effects (15,16).
We also evaluated the optimal dosing necessary to achieve these detection goals. The
three cohorts (2A, 2B, 3) did not show significantly different TBRs of the primary tumor
on June 16, 2020. © 2018 American Association for Cancer Research. cancerres.aacrjournals.org Downloaded from
Author manuscripts have been peer reviewed and accepted for publication but have not yet been edited. Author Manuscript Published OnlineFirst on July 2, 2018; DOI: 10.1158/0008-5472.CAN-18-0878

25
specimen. A larger difference between fluorescence of positive and negative wound bed margins
in cohort 3 (1mg/kg) compared to cohort 2A (0.5mg/kg) suggest that a higher dose may be more
effective. However, cohort 2B (1mg/kg) might have an unnecessarily high dose for mapping
tumor depth on the primary specimen. Fluorescence intensity from tumor in cohort 3 (1mg/kg)
was strong enough to be detected at a deeper depth than cohort 3 (0.5mg/kg) or cohort 3 (50mg)
but had trade-offs in specificity and PPV. Additionally, the loading dose of unlabeled antibody
does not appear to add additional value. As such, cohort 3 (flat dose of 50mg of panitumumab-
IRDy800CW) appears to be the safest and most cost-effective dose.
The primary limitation of our trial is the small cohort sizes which limited the power to
distinguish how tumor size and location may affect fluorescence signal. The tumors were not
evaluated preoperatively for EGFR status, although we did not see different EGFR expression
levels impact TBR on histological examination. EGFR is also modestly expressed in the basal
layer of normal mucosa and skin, which can increase background fluorescence (26).
Additionally, we did not examine and quantify the histologic characteristics of the resected
tumors to assess for aggressive or complex features such as perineural invasion, distant tumor
nests, and stromal alterations which may affect drug uptake. HNSCC also exhibit inter and intra-
tumor heterogeneity, which we attempted to correct for by using each patient as his/her own
control in the analysis.
A physical limitation of the technology is the penetration depth of NIR fluorescence
(approximately 5mm) (27). This depth can identify tumor tissue in small margin samples and at
distances relevant for determining resection completeness (0-5mm) but cannot provide complete
internal pictures of large specimens >10mm in thickness. Compared to other intraoperative
imaging methods in development, fluorescence imaging has acceptable penetration depth
on June 16, 2020. © 2018 American Association for Cancer Research. cancerres.aacrjournals.org Downloaded from
Author manuscripts have been peer reviewed and accepted for publication but have not yet been edited. Author Manuscript Published OnlineFirst on July 2, 2018; DOI: 10.1158/0008-5472.CAN-18-0878

26
(compared to 1-2mm for Cerenkov luminescence with radiotracers), faster imaging speeds
(compared to 15-30 minutes for multispectral imaging), lack of ionizing radiation, and high
spatial resolution (although less than sheet light microscopy) (4-6,28). Additionally, new
combinatory uses of fluorescence in optoacoustics (such as multispectral optoacoustic
tomography) have shown potential to incorporate the high image fidelity of optical imaging with
the increased penetration depth (3-5 cm) afforded by acoustic technology (28-30).
Overall, our data presents a promising new avenue of utilizing fluorescence to identify
both the presence of tumor tissue in margin samples as well as to map tumor depth in the primary
tumor specimen. Tumor-mapping of surgical specimens may be more revealing than in situ
imaging in cancers with difficult imaging conditions in particular, but margin assessment
utilizing the methods presented in this trial may potentially applicable to all oncologic surgeries.
These promising results from conjugating fluorescent dyes to therapeutic monoclonal antibodies
may prove to be a valuable method of combining existing technologies to develop safe, tumor-
specific imaging agents to improve intraoperative detection of cancerous tissue to ultimately
improve oncologic outcomes.
CONCLUSIONS
We present a novel method of detecting tumor-involved margins in surgical specimens
using a cancer-specific agent to provide highly sensitive and specific, real-time, intraoperative
surgical navigation in resections with complex anatomy otherwise poorly amenable to image-
guidance.
ACKNOWLEDGEMENTS
on June 16, 2020. © 2018 American Association for Cancer Research. cancerres.aacrjournals.org Downloaded from
Author manuscripts have been peer reviewed and accepted for publication but have not yet been edited. Author Manuscript Published OnlineFirst on July 2, 2018; DOI: 10.1158/0008-5472.CAN-18-0878

27
This work was supported by the Stanford Comprehensive Cancer Center, the Stanford
University School of Medicine Medical Scholars Program, the Netherlands Organization for
Scientific Research (019.171LW.022), and the National Institutes of Health and the National
Cancer Institute (R01CA190306, R21CA182953, R21CA179171, T32CA091078). Institutional
equipment loans were received from Novadaq, SurgVision.
REFERENCES:
1. Ganly I, Patel S, Shah J. Early stage squamous cell cancer of the oral tongue –
clinicopathologic features affecting outcome. Cancer. 2011;118(1):101-11.
2. McMahon J, O’Brien CJ, Pathak I, Hamill R, McNeil E, Hammersley N, et al. Influence of
condition of surgical margins on local recurrence and disease-specific survival in oral and
oropharyngeal cancer. Br J Oral Maxillofac Surg. 2003;41(4):224–31.
3. Ravasz LA, Slootweg PJ, Hordijk GJ, Smit F, van der Tweel I. The status of the resection
margin as a prognostic factor in the treatment of head and neck carcinoma. J Cranio-Maxillo-
fac Surg Off Publ Eur Assoc Cranio-Maxillo-fac Surg. 1991;19(7):314–8.
4. St John ER, Al-Khudairi R, Ashrafian H, Athanasiou T, Takats Z, Hadjiminas DJ, Darzi A,
Leff DR. Diagnostic accuracy of intraoperative techniques for margin assessment in breast
cancer surgery: A Meta-analysis. Ann Surg. 2017;265(2):300-310.
on June 16, 2020. © 2018 American Association for Cancer Research. cancerres.aacrjournals.org Downloaded from
Author manuscripts have been peer reviewed and accepted for publication but have not yet been edited. Author Manuscript Published OnlineFirst on July 2, 2018; DOI: 10.1158/0008-5472.CAN-18-0878
28
5. Thill M, Röder K, Diedrich K, Dittmer C. Intraoperative assessment of surgical margins
during breast conserving surgery of ductal carcinoma in situ by use of radiofrequency
spectroscopy. Breast. 2011;20(6):579-80.
6. Grootendorst MR, Cariati M, Pinder SE, Kothari A, Douek M, Kovacs T, Hamed H, Pawa A,
Nimmo F, Owen J, Ramalingam V, Sethi S, Mistry S, Vyas K, Tuch DS, Britten A, Van
Hemelrijck M, Cook GJ, Sibley-Allen C, Allen S, Purushotham A. Intraoperative
Assessment of Tumor Resection Margins in Breast-Conserving Surgery Using 18F-FDG
Cerenkov Luminescence Imaging: A First-in-Human Feasibility Study. J Nucl Med.
2017;58(6):891-898.
7. Moore LS, Rosenthal EL, Chung TK, de Boer E, Patel N, Prince AC, Korb ML, Walsh EM,
Young ES, Stevens TM, Withrow KP, Morlandt AB, Richman JS, Carroll WR, Zinn KR,
Warram JM. Characterizing the utility and limitations of repurposing an open-field optical
imaging device for fluorescence-guided surgery in head and neck cancer patients. J Nucl
Med. 2017;58(2):246-251.
8. Grandis J, Tweardy D. Elevated levels of transforming growth factor α and epidermal growth
factor receptor messenger RNA are early markers of carcinogenesis in head and neck cancer.
Cancer Res. 1993;53(15):3579-84.
9. Salomon DS, Brandt R, Ciardiello F, Normanno N. Epidermal growth factor-related peptides
and their receptors in human malignancies. Crit Rev Oncol Hematol 1995;19(3):183-232.
10. Rosenthal EL, Warram JM, de Boer E, Chung TK, Korb ML, Brandwein-Gensler M, Strong
TV, Schmalbach CE, Morlandt AB, Agarwal G, Hartman YE, Carroll WR, Richman JS,
Clemons LK, Nabell LM, Zinn KR. Safety and tumor specificity of cetuximab-IRDye800CW
for surgical navigation in head and neck cancer. Clin Cancer Res. 2015; 21(16):3658-66.
on June 16, 2020. © 2018 American Association for Cancer Research. cancerres.aacrjournals.org Downloaded from
Author manuscripts have been peer reviewed and accepted for publication but have not yet been edited. Author Manuscript Published OnlineFirst on July 2, 2018; DOI: 10.1158/0008-5472.CAN-18-0878

29
11. Burggraaf J, Kamerling IM, Gordon PB, Schrier L, de Kam ML, Kales AJ, Bendiksen R,
Indrevoll B, Bjerke RM, Moestue SA, Yazdanfar S, Langers AM, Swaerd-Nordmo M,
Torheim G, Warren MV, Morreau H, Voonerveld PW, Buckle T, van Leeuwen FW,
Ødegårdstuen LI, Dalsgaard GT, Healey A, Hardwick JC. Detection of colorectal polyps in
humans using an intravenously administered fluorescent peptide targeted against c-Met. Nat
Med. 2015;21(8):955-61.
12. Hoogstins CE, Tummers QR, Gaarenstroom KN, de Kroon CD, Trimbos JB, Bosse T, Smit
VT, Vuyk J, van de Velde CJ, Cohen AF, Low PS, Burggraaf J, Vahrmeijer AL. A novel
tumor-specific agent for intraoperative near-infrared fluorescence imaging: a translational
study in healthy volunteers and patients with ovarian cancer. Clin Cancer Res.
2016;22(12):2929-38.
13. Lamberts LE, Koch M, de Jong JS, Adams ALL, Glatz J, Kranendonk MEG, Terwisscha van
Scheltinga AGT, Jansen L, de Vries J, Lub-de Hooge MN, Schröder CP, Jorritsma-Smit A,
Linssen MD, de Boer E, van der Vegt B, Nagengast WB, Elias SG, Oliveira S, Witkamp AJ,
Mali WPTM, Van der Wall E, van Diest PJ, de Vries EGE, Ntziachristos V, van Dam GM.
Tumor-Specific Uptake of Fluorescent Bevacizumab-IRDye800CW Microdosing in Patients
with Primary Breast Cancer: A Phase I Feasibility Study. Clin Cancer Res.
2017;23(11):2730-2741.
14. Terwisscha van Scheltinga AG, van Dam GM, Nagengast WB, Ntziachristos V, Hollema H,
Herek JL, Schröder CP, Kosterink JG, Lub-de Hoog MN, de Vries EG. Intraoperative near-
infrared fluorescence tumor imaging with vascular endothelial growth factor and human
epidermal growth factor receptor 2 targeting antibodies. J Nucl Med. 2011;52(11):1778-85.
on June 16, 2020. © 2018 American Association for Cancer Research. cancerres.aacrjournals.org Downloaded from
Author manuscripts have been peer reviewed and accepted for publication but have not yet been edited. Author Manuscript Published OnlineFirst on July 2, 2018; DOI: 10.1158/0008-5472.CAN-18-0878

30
15. Jakobovits A, Amado RG, Yang X, Roskos L, Schwab G. From XenoMouse technology to
panitumumab, the first fully human antibody product from transgenic mice. Nat Biotechnol.
2007;25(10):1134.
16. Amado RG, Wolf M, Peeters M, Van Cutsem E, Siena S, Freeman DJ, et al. Wild-Type
KRAS is required for panitumumab efficacy in patients with metastatic colorectal cancer. J
Clin Oncol. 2008;26(10):1626–34.
17. Heath CH, Deep NL, Sweeny L, Zinn KR, Rosenthal EL. Use of panitumumab-IRDye800 to
image microscopic head and neck cancer in an orthotopic surgical model. Ann Surg Oncol.
2012;19(12):3879-87.
18. Yang XD, Jia XC, Corvalan JR, Wang P, Davis CG. Development of ABX-EGF, a fully
human antif-EGF receptor monoclonal antibody, for cancer therapy. Crit Rev Oncol
Hematol. 2001;38(1):17-23.
19. Moore LS, Rosenthal EL, de Boer E, Prince AC, Patel N, Richman JM, Morlandt AB,
Carroll WR, Zinn KR, Warram JM. Effects of an unlabeled loading dose on tumor-specific
uptake of a fluorescently labeled antibody for optical surgical navigation. Mol Imaging Biol.
2017;19(4):610-16.
20. van Dam GM, Themelis G, Crane LMA, Harlaar NJ, Pleijhuis RG, Kelder W, Sarantopoulos
A, de Jong JS, Arts HJG, van der Zee AGJ, Bart J, Low PS, Ntziachristos V. Intraoperative
tumor-specific fluorescence imaging in ovarian cancer by folate receptor-alpha targeting:
first in-human results. Nature Med. 2011;17(10):1315-19.
21. Bhattacharyya S, Patel N, Wei L, Riffle LA, Kalen JD, Hill GC, Jacobs PM, Zinn KR,
Rosenthal EL. Synthesis and biological evaluation of panitumumab-IRDye800 conjugate as a
on June 16, 2020. © 2018 American Association for Cancer Research. cancerres.aacrjournals.org Downloaded from
Author manuscripts have been peer reviewed and accepted for publication but have not yet been edited. Author Manuscript Published OnlineFirst on July 2, 2018; DOI: 10.1158/0008-5472.CAN-18-0878
31
fluorescence imaging probe for EGFR-expressing cancers. Medchemcomm. 2014;5(9):1337-
1346.
22. Koch M, de Jong JS, Glatz J, Symvoulidis P, Lamberts LE, Adams AL, Kranendonk ME,
Terwisscha van Scheltinga AG, Aichler M, Jansen L, de Vries J, Lub-de Hooge MN,
Schröder CP, Jorritsma-Smit A, Linssen MD, de Boer E, van der Vegt B, Nagengast WB,
Elias SG, Oliveira S, Witkamp AJ, Mali WP, Van der Wall E, Garcia-Allende PB, van Diest
PJ, de Vries EG, Walch A, van Dam GM, Ntziachristos V. Threshold analysis and
biodistribution of fluorescently labeled bevacizumab in human breast cancer. Cancer Res.
2017;77(3):623-631.
23. Hinni ML, Ferlito A, Brandwein-Gensler MS, Takes Rp, Silver CE, Westra WH, Seethala
RR, Rodrigo JP, Corry J, Bradford CR, Hunt JL, Strojan P, Devaney KO, Gnepp DR, Hartl
DM, Kowalski LP, Rinaldo A, Barnes L. Surgical margins in head and neck cancer: a
contemporary review. Head Neck. 2013;35(9):1362–70.
24. Citri A, Yarden Y. EGF-ERBB signalling: towards the systems level. Nat Rev Mol Cell Biol.
2006;7(7):505-16.
25. Day KE, Sweeny L, Kulbersh B, Zinn KR, Rosenthal EL. Preclinical comparison of Near-
Infrared-Labeled cetuximab and panitumumab for optical imaging of head and neck
squamous cell carcinoma. Mol Imaging Biol. 2013;15(6):722-9.
26. Uhlen M, Zhang C, Lee S, Sjöstedt E, Fagerberg L, Bidkhori G, Benfeitas R, Arif M, Liu Z,
Edfors F, Sanli K, von Feilitzen K, Oksvold P, Lundberg E, Hober S, Nilsson P, Mattsson J,
Schwenk JM, Brunnström H, Glimelius B, Sjöblom T, Edqvist PH, Djureinovic D, Micke P,
Lindskog C, Mardinoglu A, Ponten F. A pathology atlas of the human cancer transcriptome.
Science. 2017;357(6352).
on June 16, 2020. © 2018 American Association for Cancer Research. cancerres.aacrjournals.org Downloaded from
Author manuscripts have been peer reviewed and accepted for publication but have not yet been edited. Author Manuscript Published OnlineFirst on July 2, 2018; DOI: 10.1158/0008-5472.CAN-18-0878

32
27. Vahrmeijer AL, Frangioni JV. Seeing the invisible during surgery. Br J Surg.
2011;98(6):749-50.
28. McNally LR, Mezera M, Morgan DE, Frederick PJ, Yang ES, Eltoum IE, Grizzle WE.
Current and emerging clinical applications of multispectral optoacoustic tomography
(MSOT) in oncology. Clin Cancer Res. 2016;22(14):3432-9.
29. Langhout GC, Grootendorst DJ, Nieweg OE, Wouters MW, van der Hage JA, Jose J, van
Boven H, Steenbergen W, Manohar S, Ruers TJ. Detection of melanoma metastases in
resected human lymph nodes by noninvasive multispectral photoacoustic imaging. Int J
Biomed Imaging. 2014;2014:163652.
30. Taruttis A, van Dam GM, Ntziachristos V. Mesoscopic and macroscopic optoacoustic
imaging of cancer. Cancer Res. 2015;75(8):1548-59.
TABLES
Cohort 2A Cohort 2B Cohort 3 All Cohorts
Dose 0.5 mg/kg 1.0 mg/kg 50 mg
n 165 550 186 972
Sensitivity (%) 92 ± 3.6 92 ± 2.7 89 ± 5.1 91 ± 2.1
Specificity (%) 78 ± 10.3 91 ± 1.5 92 ± 3.5 88 ± 3.3
Positive Predictive Value (PPV) 68 ± 11.4 86 ± 8.2 82 ± 9.5 80 ± 4.4
Negative Predictive Value (NPV) 95 ± 3.5 96 ± 3.1 94 ± 2.8 93 ± 2.0
Area Under the Curve (AUC) 0.83 ± 0.07 0.95 ± 0.01 0.93 ± 0.03 0.91 ± 0.02
on June 16, 2020. © 2018 American Association for Cancer Research. cancerres.aacrjournals.org Downloaded from
Author manuscripts have been peer reviewed and accepted for publication but have not yet been edited. Author Manuscript Published OnlineFirst on July 2, 2018; DOI: 10.1158/0008-5472.CAN-18-0878
33
Table 1: Sensitivity, specificity, positive predictive value (PPV), negative predictive value
(NPV), and area under the curve (AUC) by cohort of the primary specimen shown as average
values ± standard error of the mean.
Cohort 2A Cohort 3 Surgeons
Sensitivity 100% 100% 36%
Specificity 90% 74% 97%
Positive Predictive Value (PPV) 80% 52% 80%
Negative Predictive Value (NPV) 100% 100% 84%
Area Under the Curve (AUC) 0.98 0.97 N/A
Table 2: Sensitivity and Specificity of Fluorescence for Tumor-Involved Margin Samples.
Sensitivity, specificity, positive predictive value, negative predictive value, and area under the
curve of fluorescence signal predictions of tumor-involved margin samples in cohort 2A and
on June 16, 2020. © 2018 American Association for Cancer Research. cancerres.aacrjournals.org Downloaded from
Author manuscripts have been peer reviewed and accepted for publication but have not yet been edited. Author Manuscript Published OnlineFirst on July 2, 2018; DOI: 10.1158/0008-5472.CAN-18-0878

34
cohort 3. Fluorescence signal predictions were compared to predictions made by the primary
resecting surgeon.
FIGURE LEGENDS
Figure 1: Clinical workflow. The patient is intravenously infused with the panitumumab-
IRDye800CW 1-5 days prior to surgery (A). During surgery, in situ fluorescence imaging is
obtained intraoperatively with open-field imaging devices (B). Closed-field fluorescence
imaging of the surgical specimens is also performed (C). After surgery, all surgical specimens
undergo standard histopathological analysis, and fluorescence intensity is compared to EGFR
expression and tumor location (D).
Figure 2: Target validation. Microscopy images H&E stains of tumor and normal tissue (A,C)
are compared to images showing EGFR expression (B,D). Areas of high-grade dysplasia (E)
on June 16, 2020. © 2018 American Association for Cancer Research. cancerres.aacrjournals.org Downloaded from
Author manuscripts have been peer reviewed and accepted for publication but have not yet been edited. Author Manuscript Published OnlineFirst on July 2, 2018; DOI: 10.1158/0008-5472.CAN-18-0878

35
show increased EGFR expression (F), although less compared to areas of invasive carcinoma. A
section of tumor and normal tissue is compared by H&E (G), cytokeratin staining (H), EGFR
expression (I), and fluorescence intensity (J). EGFR expression shows a strong positive
correlation with fluorescence intensity (K).
Figure 3: In Situ and Surgical Specimen Mapping. TBRs by cohort of the in situ primary
tumor obtained using an open field device (A). An example of an in situ image (B). MFIs of
tumor tissue in the primary tumor surgical specimen and background muscle by cohort obtained
using a closed-field imaging device with TBRs (C). Sample image of a primary tumor specimen
(D). Brightfield and fluorescence images of serial sections of tumor tissue, muscle, and skin by
weight (E). Muscle, normal epithelium, and tumor tissue show positive linear correlation of
weight and fluorescence signal (F). Normalized fluorescence by weight shows statistically
significant difference between fluorescence of tumor compared to muscle and normal epithelial
tissue (G).
Figure 4: Margin Samples. Examples of tumor-involved (positive) and normal (negative)
margin samples biopsied from the wound bed by the resecting surgeon per clinical judgement
(A). TBRs of muscle, negative margin samples, and positive margin samples in cohort 2A (0.5
mg/kg) (B) and cohort 3 (50mg) (C). There is a statistically significant difference between
positive and negative margins (p = 0.0005, p < 0.0001).
Figure 5: Tumor-Mapping of Surgical Specimens. Distance of tumor tissue to the deep margin
surface of the primary tumor specimen given as average tumor depth (mm) ± standard deviation.
on June 16, 2020. © 2018 American Association for Cancer Research. cancerres.aacrjournals.org Downloaded from
Author manuscripts have been peer reviewed and accepted for publication but have not yet been edited. Author Manuscript Published OnlineFirst on July 2, 2018; DOI: 10.1158/0008-5472.CAN-18-0878
36
Views of the entire deep margin surface of representative samples from cohort 2A (A), cohort 2B
(B), and cohort 3 (C) are shown here. Comparison of tumor tissue depth from the deep margin
surface of the primary tumor specimen in fluorescent areas versus areas without fluorescence
(D).
on June 16, 2020. © 2018 American Association for Cancer Research. cancerres.aacrjournals.org Downloaded from
Author manuscripts have been peer reviewed and accepted for publication but have not yet been edited. Author Manuscript Published OnlineFirst on July 2, 2018; DOI: 10.1158/0008-5472.CAN-18-0878
Published OnlineFirst July 2, 2018.Cancer Res Rebecca W. Gao, Nutte T Teraphongphom, Nynke S van den Berg, et al. Mapping Using Near-Infrared FluorescenceDetermination of Tumor Margins with Surgical Specimen
Updated version
10.1158/0008-5472.CAN-18-0878doi:
Access the most recent version of this article at:
Material
Supplementary
http://cancerres.aacrjournals.org/content/suppl/2018/06/30/0008-5472.CAN-18-0878.DC1
Access the most recent supplemental material at:
Manuscript
Authoredited. Author manuscripts have been peer reviewed and accepted for publication but have not yet been
E-mail alerts related to this article or journal.Sign up to receive free email-alerts
Subscriptions
Reprints and
To order reprints of this article or to subscribe to the journal, contact the AACR Publications
Permissions
Rightslink site. Click on "Request Permissions" which will take you to the Copyright Clearance Center's (CCC)
.http://cancerres.aacrjournals.org/content/early/2018/06/30/0008-5472.CAN-18-0878To request permission to re-use all or part of this article, use this link
on June 16, 2020. © 2018 American Association for Cancer Research. cancerres.aacrjournals.org Downloaded from
Author manuscripts have been peer reviewed and accepted for publication but have not yet been edited. Author Manuscript Published OnlineFirst on July 2, 2018; DOI: 10.1158/0008-5472.CAN-18-0878