determination of underc forest history from current forest
TRANSCRIPT

Holland 1
Determination of UNDERC Forest History from Current Forest Structure BIOS 35502: Practicum in Environmental Field Biology
Brian Holland Advisors: Anne Chouinard and Karen Francl
July 21, 2006

Holland 2
ABSTRACT Recently uncovered archive documents revealed that the most recent
logging occurred on the UNDERC property from 1955-1967, not prior to 1920 as
had been thought. This study was undertaken to confirm the accuracy of the
archive documents, to determine what areas the numerous unmapped cuts took
place in, and to determine whether partial- or clearcutting was the primary
technique used. Stand parameters such as diameter distribution and species
composition were used. Trees in each stand were also cored to determine age and
to look for tree ring size releases caused by post-cut growth increases. Sugar
maple dominated (shade-tolerant hardwood – TH), aspen dominated (shade-
intolerant hardwood – IH) and mixed (MI) stands were studied. Age and diameter
distribution indicated that all stands studied had been cut more recently than the
1920s and supported the claims of the archive documents. For the most part, the
unknown-history stands were similar in average diameter and species composition
to the known-cut stands, meaning they were probably treated similarly. Diameter
distribution, age, and species composition of the stands generally indicated that
current TH stands were partially cut and current IH and MI stands were probably
clearcut. Diameter distribution was not very helpful or consistent in determining
this. The logging history of the study areas was determined fairly well, but the
study was narrowly focused on only two of the numerous stand types on property.

Holland 3
INTRODUCTION
The history of the forests of the western Great Lakes over the last 130
years is largely related to human intervention, primarily motivated by commercial
interests (Whitney 1987). Logging of the old-growth forest began in the 1870s,
taking primarily white pine (Pinus strobus) close to rivers. Once white pine of
harvestable size was decimated, logging efforts expanded between 1880-1920 to
include all pine (Pinus spp.) and hardwood types (e.g. Acer saccharum [sugar
maple], Tsuga canadensis [eastern hemlock], and Tilia americana [basswood]) in
virtually all areas accessible via newly-created railroad routes (Whitney 1987,
Peterson and Squiers 1995).
Heavy logging in northeastern Wisconsin began in the 1890s (Stearns and
Likens 2002). By 1920, most of the profitable timber had been removed from this
region (Sakai and Sulak 1985, Whitney 1987), and fires, first consuming the slash
left from logging and later the small trees that grew in the exposed, dry soils,
slowed the regrowth of the forests (Sakai and Sulak 1985, Whitney 1987,
Peterson and Squiers 1995, Stearns and Likens 2002). Around 1920, technical
advances and an increase in resources devoted to fire control allowed a second-
growth forest to be established (Whitney 1987). Over the past 90 years, these
young forests have been logged, using primarily more conservative selective-cut
methods (Whitney 1987, Crow et al. 2002).

Holland 4
The forests of the University of Notre Dame Environmental Research
Center (UNDERC) in Vilas County, Wisconsin and Gogebic County, Michigan
have departed from this common history only since the late 1960s. In the winter
of 2005-2006, the discovery of University archive documents put to rest any
doubt that logging occurred from 1955-1967 or 1968. Based on calculations
reliant on volume-to-weight conversions from Spelter (2002) and Lothner et al.
(1974), archive documents indicate that ca. 85% of the timber removed from the
property was aspen (Populus tremuloides [quaking aspen] and probably also
Populus grandidentata [bigtooth aspen]), which was cut from 1955-1967. Sugar
maple, yellow birch (Betula alleghaniensis), eastern hemlock, and white pine, cut
in 1958, 1960, 1961, 1963, and 1964, accounted for the majority of the remaining
harvesting activities (Marathon records of stumpage sales ca. 1967, Notre Dame
Archives).
These documents are incomplete and appear contradictory. Furthermore,
they only indicate the location of the 1955-1961 aspen logging sites (Figure 1),
leaving the location of ca. 62% of the total aspen logging unknown (Marathon ca.
1967, Notre Dame Archives) and they do not clearly delineate the area of any of
the non-aspen cutting. Those locations would constitute a substantial portion of
the UNDERC property. The logging technique that was used, e.g. selective-
cutting or clearcutting, is also not specified. The logging contract specified that
healthy forest development was to be a priority of the cutting, but the agreement

Holland 5
may not have been faithfully carried out (Committee on Institutional Cooperation
report 1967, Notre Dame Archives).
At present, no other source of detailed information has been uncovered
concerning the mid-20th-century history of the UNDERC forests. In recent years,
only one very general survey of the composition of the forests (Underwood 2005)
and one tree age study of limited scope (Mahon 2003) have been undertaken.
There is no information available on forest stand characteristics such as stand age,
stand diameter, and detailed stand composition.
The UNDERC property, like much of the northwestern Upper Peninsula,
is a mosaic of forest types that are frequently lumped together under the name
northern hardwoods (Barnes and Wagner 2004, Anne Chouinard, personal
communication). The property includes numerous stands of swamp conifers (e.g.
Picea mariana [black spruce], Larix laricina [tamarack]), mixed coniferous and
deciduous forest, mixed hardwoods, sugar maple, and aspen, among others (Layer
of UNDERC forest stand types and wetlands, created 2005; Francl, unpublished
data).
Several factors make quaking and bigtooth aspen focal points of any study
of UNDERC land use history. These trees were probably originally targeted by
loggers for their value as pulpwood (Marathon records of stumpage sales ca.
1967, Notre Dame Archives, Barnes and Wagner 2004). After the logging had
occurred, they would likely have been pioneer species in any clearcut areas of the

Holland 6
forest due to their ability to generate root suckers, their high growth rate, and their
affinity for sunny environments (Whitney 1987, Barnes and Wagner 2004).
The goal of this study was to assess the accuracy of the existing logging
records and to attempt to fill in two gaps in those records – which areas of the
property were logged during the 1962-1967 for which there is no location
information, and what logging techniques were used in the 1955-1967 cutting.
I hypothesized that the archive records would be corroborated by the dbh
(diameter at breast height) and age data of the stands that have been cut. In trees
that predate the logging event, increased light resources should have caused a
post-logging increase in growth that I would see in tree cores as a sudden increase
in tree ring width (Canham 1985, Bebber et al. 2003). This increase should match
up with the year of logging.
I also hypothesized that, because of their similar pre-1955 history, the as-
yet unidentified areas of 1962-1967 logging should have been similar in present
day average diameter species composition to the known and identified 1955-1961
areas if logging methods were unchanged throughout the entire logging period. I
predicted that these parameters would not be significantly different between the
known-cut and unknown-history stands.
Finally, I hypothesized that the diameter distribution and tree ages would
indicate that partial cutting was the primary logging technique employed. I
expected to find evidence of some clearcutting – this is the only way that the pure

Holland 7
aspen stands on property could exist (Palik 2003). I predicted that the current
stand diameter distribution in non-aspen stands would form a reverse-j shape.
This distribution shape is characteristic of forest stands managed using an uneven-
age (partial cut) system (Crow et al 2002). I also expected the cores of the largest
trees in each stand to date at least to the ca. 1920 reestablishment period (these
would be trees that were already in the canopy at the time of the most recent
logging but were not chosen to be cut), and other canopy trees (those recruited
into the canopy after the partial cuts) to date to the 20 years prior to the cut.
MATERIALS AND METHODS
Selection of Sample Stands
Survey stands were selected based on the clarity and consistency of the
relevant logging records. An effort was also made to distribute the stands across
the UNDERC property as much as possible in order to get a more complete
picture of the logging events. A total of nine stands were sampled within the
areas indicated as having been cut in the 1950s and 1960s – three shade-
intolerant hardwoods (IH - largely aspen), three mixed hardwoods (MI), and three
shade-tolerant hardwoods (TH - largely sugar maple). An additional nine stands
of the same classification were sampled in areas of UNDERC that had no reliable
records (Figure 1). The stands were selected using ArcView 3.3 (Environmental
Holland 8
Systems Research Institute, Redlands, California) data layers. Available layers
included an UNDERC habitat layer (forest stand types and wetlands, created
2005; Francl, unpublished data; UTM NAD27, Zone 16N), and DOQQ (Digital
Orthophoto Quarter Quadrangle) maps created from 1998 aerial photos
(courtesy of USDA Forest Service).
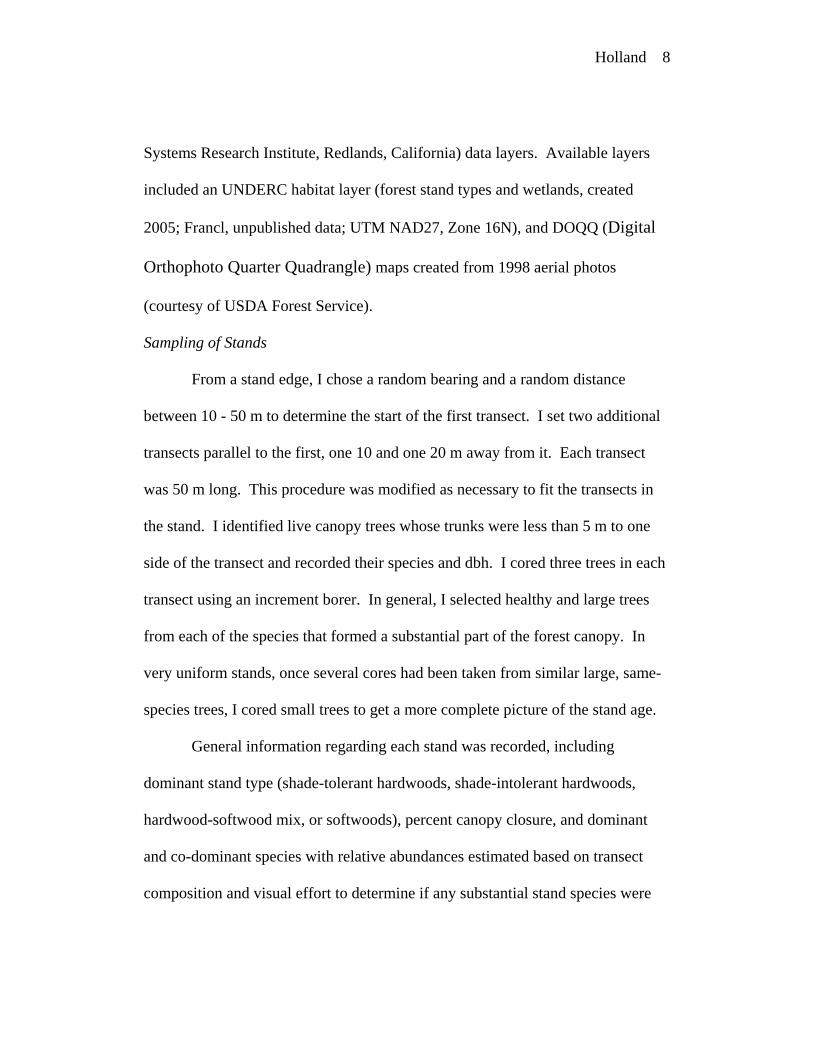
Sampling of Stands
From a stand edge, I chose a random bearing and a random distance
between 10 - 50 m to determine the start of the first transect. I set two additional
transects parallel to the first, one 10 and one 20 m away from it. Each transect
was 50 m long. This procedure was modified as necessary to fit the transects in
the stand. I identified live canopy trees whose trunks were less than 5 m to one
side of the transect and recorded their species and dbh. I cored three trees in each
transect using an increment borer. In general, I selected healthy and large trees
from each of the species that formed a substantial part of the forest canopy. In
very uniform stands, once several cores had been taken from similar large, same-
species trees, I cored small trees to get a more complete picture of the stand age.
General information regarding each stand was recorded, including
dominant stand type (shade-tolerant hardwoods, shade-intolerant hardwoods,
hardwood-softwood mix, or softwoods), percent canopy closure, and dominant
and co-dominant species with relative abundances estimated based on transect
composition and visual effort to determine if any substantial stand species were

Holland 9
not included in the transects. Percent canopy closure was categorized (0-25%, 25-
50%, 50-75%, or >75%) using visual estimation supplemented by a densiometer
in “borderline” stands. Densiometer readings, when necessary, were taken in
each cardinal direction at the start of each transect. The presence or absence of
tree stumps of possible anthropogenic origin was noted. Where present, the
approximate size and density of stumps was recorded.
I sanded the cores and aged them in the laboratory using a dissecting
microscope, hand lens, and the naked eye as necessary. Each core was examined
for growth releases, and, when one was found, the year was recorded. A release
was defined as a 50% increase in ring length between consecutive years.
Statistical Analysis
In SYSTAT 11.0 (SYSTAT Software, Inc., Point Richmond, CA), the tree
diameter in each stand was graphed and the distribution was fit to a negative
exponent (reverse-j) regression and a normal distribution to determine if it was
logged using apartial cut (Crow et al. 2002). In order to establish their similar
history, Each stand of unknown history was compared to the combined known-cut
stands of its type using a two-sample t-tests to test for difference in dbh of the
dominant species of each stand, and to test for differences in percentage of each
stand that was composed of shade-intolerant species.
RESULTS

Holland 10
Accuracy of 1955-1961 Archive Maps
Locations of study sites and “known-cut” areas are shown (Figure 1). Of
the sites in “known-cut” areas, only site eight (TH) contained sugar maple of dbh
>45 cm. This stand contained a substantial number of large, apparently sawn
stumps. Six of the nine stands showed at least one credible release in the 1955-
1967 period. Three of those six had more than one release in the same year. In
three of the six, the release year was within one year of the cutting date indicated
by archive maps. In all 18 stands surveyed, multiple cores appeared to show
steady growth before, during, and after the 1955-1967 period with no sign of
release. Only site 8 contained stumps.
General Results and Tree Coring Notes
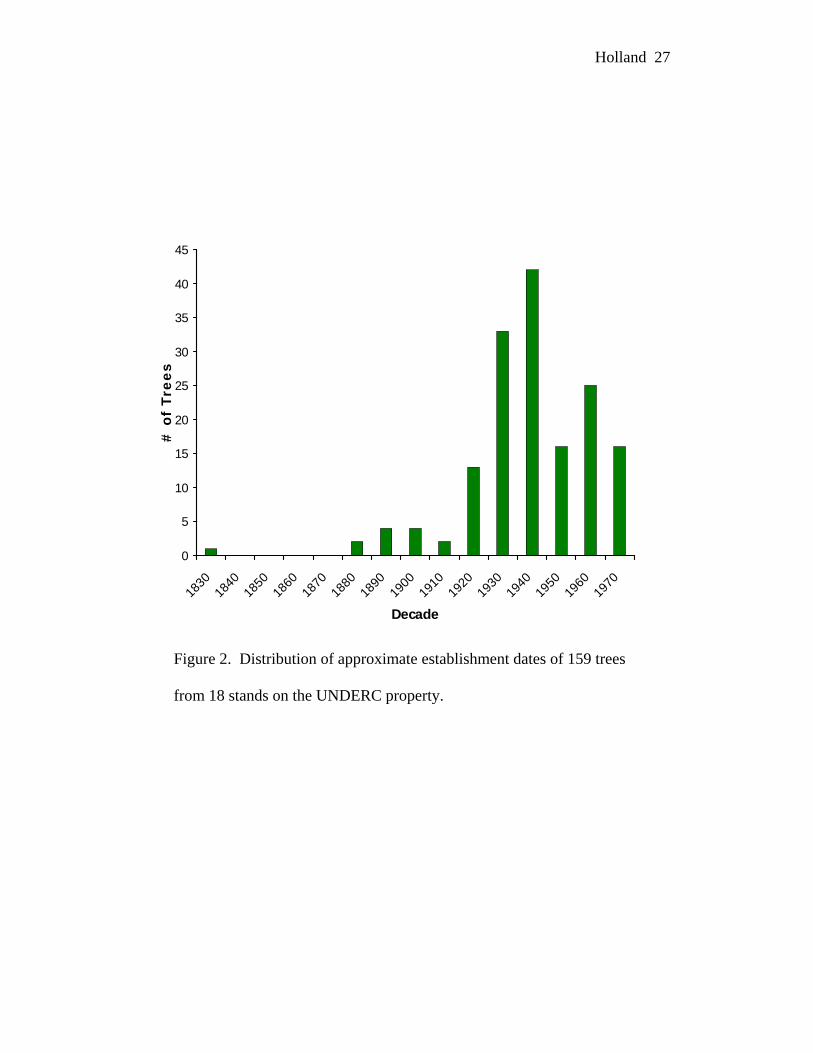
The oldest tree cored in this study (a sugar maple) was aged to 1831. It
was also the only tree that showed a release in the mid-1890s (approximately
1895). Twelve of 159 total trees cored were dated earlier than 1920. The largest
number of current canopy trees was established in the 1940s and 1930s (Figure 2).
This may represent the earliest time at which the post-logging, post-fire land was
able to support the establishment of large numbers of new trees (Whitney 1987).
Calculations of relative species abundances in the stands surveyed caused
some of them to be reassigned to different shade-tolerance stand types (TH, shade
intolerant hardwood – IH, or intermediate/mixed tolerance hardwood – MI).
Also, a distinction was made between MI dominated by sugar maple or quaking

Holland 11
aspen and those dominated by red maple (Acer rubrum) due to the unique
character of red maple-dominated stands observed in the field. As a result, the
known-cut stands were comprised of three TH, two IH, three MI, and one red
maple MI, and the unknown-history stands were comprised of four TH, four IH,
and one red maple MI rather than the originally planned three of each type.
Comparison of Known- and Unknown-history Stands
Average dbh of dominant canopy species (Figure 3) and relative
abundance of aspen in the canopy (Figure 4) were compared between each
unknown-history stand and the combined known-history stands of its stand type
using two-sample t-tests.
IH – Three of the four unknown IH stands showed significantly smaller
average dbh than the known-cut IH stands (site 14: t=3.939, df=5.3, p=0.010, site
15: t=2.967, df=6.0, p=0.025, site 16: t=3.839, df=7.0, p=0.006). The fourth (site
10) showed a trend toward smaller dbh (t=1.498, df=6.1, p=0.184). Three of the
four sites showed no significant difference in relative abundance of quaking aspen
in the canopy (Table 1). One (site 16) had a significantly lower relative
abundance of aspen (t=2.376, df=4.7, p=0.066), but this was due in large part to a
higher abundance of shade-tolerant conifers (14.4% of sampled trees), not of late-
successional hardwoods (7.1%).
MI (red maple) – The only unknown-history red maple MI stand (17) was
not significantly different in mean dbh from the only known-history red maple MI

Holland 12
stand (t=-1.283, df=3.8, p=0.272). A possible trend of lower aspen relative
abundance in the unknown stand was found (t=1.903, df=2.6, p=0.165), but the
sample size was very small.
TH – TH unknown site 11 had a significantly smaller mean dbh than the
known-cut stands (t=5.431, df=9.0, p<0.001). That site also showed a strong
trend toward a higher aspen canopy abundance (t=-1.814, df=9.5, p=0.101).
Another unknown site (18) showed a strong trend toward smaller sugar maple dbh
(t=1.901 df=6.7, p=0.101). This site and the two remaining unknown-history TH
sites (12, 13) did not have enough aspen for a t-test to be performed on their aspen
abundances. Eight of nine known-history TH transects contained no quaking
aspen, so these three unknown TH sites are probably not significantly different
from the known stands. Neither of the remaining two unknown TH sites had
mean dbh significantly different from the known stands.
Logging Technique: Diameter Distributions and Stand Ages
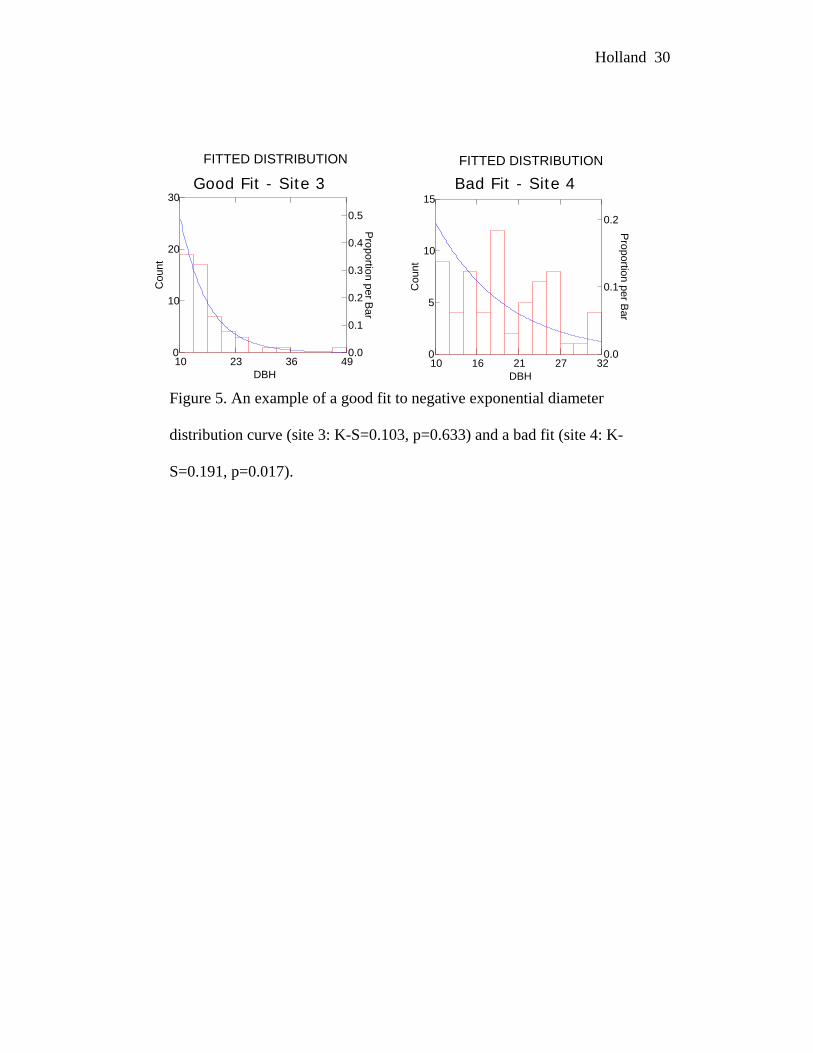
The dbh distribution of each stand was fitted to an exponential curve. A
good fit was characterized by a high Kolmogorov-Smirnov p-value: this indicates
a low probability that the data and fit curve are significantly different (Figure 5).
Only one of the three known-cut TH stands fit the curve well (site 8: K-S = 0.119,
p = 0.635). Three of the four unknown TH stands fit the curve weakly (site 11:
K-S = 0.144, p = 0.182, site 12: K-S = 0.193, p = 0.135, site 13: K-S = 0.167, p =
0.205). All of the known-cut MI stands fit to some degree (site 1: K-S = 0.170,

Holland 13
p=0.158, site 3: K-S = 0.103, p=0.633, site 5: K-S = 0.131, p = 0.331, site 9: K-S
= 0.108, p = 0.755). The unknown MI stand did not fit. Neither of the known-cut
IH stands fit the curve. One of the four unknown IH stands fit the curve fairly
well (site 2: K-S = 0.101, p = 0.476).
As with the distributions, of the three known-cut TH stands, only site 8
showed stand ages consistent with a partial cut, containing four trees older than
1920 (Table 1). All four unknown TH stands produced at least somewhat
compatible tree ages, though site 18 only had one tree (1890) older than 1935,
making it somewhat suspect. Of the other three, site 13, which had the best
negative exponential curve fit, also had the most compatible tree ages – 7 of 9
were older than 1920. Only 7 trees older than 1930 were cored in the other 11
stands combined. Thus, they are not compatible with this idea of tree age in a
mid-20th century partial cut.
DISCUSSION
The dearth of large trees in the stands indicated in the archives as cut
means the last large scale disturbance in those stands probably cannot date as far
back as 1920 - 1890s logging (Crow et al. 2002). The close correspondence
between some measured tree releases and the cutting dates indicated by archive
maps lends credibility to the accuracy of those maps. At the least, it seems safe to
say that they can probably be trusted not to depict cutting that did not occur.

Holland 14
The 1831 sugar maple that was cored brings up an interesting possibility.
Though it represents just one core, it is of relatively high quality and its release
might suggest that the UNDERC property was logged in the mid-1890s, not long
after the first logging operations moved into Northeastern Wisconsin and the
Upper Peninsula. Further coring of known older stands (white pine and hemlock)
at the southeast end of the property might confirm this suspicion.
History of Unknown UNDERC Stands
IH – These stands all have at least a trend toward smaller mean dbh than
the known-cut IH stands. Thus, it is clear that they have been cut or otherwise
entirely disturbed – the question in these cases is why they are smaller than the
known-cut stands. It could simply be due to an environmental factor such as low
soil nutrient levels, but it could be the result of a more recent disturbance, or of
difficulty regenerating trees on the spot. Competing shrubs can substantially
delay reestablishment of trees, sometimes causing regeneration to fail altogether
(Dixon et al. 2006). This can happen for a variety of reasons (Iseman 1999,
Balandier et al. 2006), many of which could be easily be different between two
stand sites on the UNDERC property.
The date of logging in two of these four sites is evident from tree core
releases– site 15 was probably cut in 1965, and site 10 was probably cut in 1962.
Both of these dates correspond to years of unknown-location aspen logging on the
UNDERC property. Site 10 is located northeast of Bogpot, near several areas of

Holland 15
known 1955-1961 logging. Site 15 is located west of Tenderfoot creek, relatively
far from any of the early logging. This might suggest that convenience was the
prime mover in Marathon’s aspen logging site selection, not a scientific or
economic evaluation.
MI – The red maple (17) was almost certainly cut (or otherwise severely
disturbed). Seven of the nine aged trees from the stand date to the 1940s. The
two older trees (1920s) were probably passed over because they would probably
not have been of merchantable size in the 1960s: they are currently only 21 and
25 cm dbh.
TH – Because all four of these stands have mean dbh less than or equal the
combined known-cut stands, it is safe to say that they have also been logged more
recently than 1920. The stand (11) with smaller mean diameter and a higher
relative abundance of aspen in the canopy could potentially have been treated
differently when it was cut. The term “partial cut” was often used in that time
period to describe what was in fact simple high-grading – the removal of all trees
over a certain size (Kelty and D’Amato 2005). This stand, relatively near the
western edge of the Notre Dame property, away from most of the lakes, might
have been cut more heavily due to its inconspicuous location. Of course, the
discrepancy could be due to a natural event or the characteristics of the stand.
Two of the four unknown TH stands showed credible releases in more
than one of their cores. The first, site 13, showed a release in 1962. This is not

Holland 16
one of the years in which sugar maple and other tolerant hardwoods are recorded
as having been harvested by Marathon. Normally, I would attribute this
discrepancy to an imperfect core reading, but in this case one of the cores was a
hemlock whose rings were very clear. It is unlikely that this core was misread. It
is likely that this is an instance of either careless bookkeeping or undocumented
cutting. The site does lie along the road to South Gate – there would be no easier
place to surreptitiously extract lumber.
The other site (18) has a credible release in 1960. Archive records
indicate that 1960 was one of three years in which basswood and ash were both
cut. Site 18 contains both. This site is unusual that the largest trees (>30 cm dbh)
are 53% basswood and white ash, while the site as a whole (dbh >10 cm) is only
11% those species. This is probably not the result of selective cutting of sugar
maple (the dominant species), because several large basswood and white ash were
cored and the oldest was 1940 – there is no evidence of large canopy basswood
and white ash being passed over. This is probably an illustration of the higher
growth rate of the two minor species – their subcanopy saplings were able to more
rapidly exploit the canopy gaps opened by logging (Barnes and Wagner 2004).
Evidence of Logging Technique
Generally speaking, the negative exponential fit did not give consistent
results that indicate partial cutting to have been the dominant method on the
UNDERC property. That having been said, it is unlikely that multiple pure maple

Holland 17
stands could have regenerated after a clearcut in an area obviously susceptible to
colonization by shade-intolerant aspen. This incongruity in the three TH stands
could be the result of several factors.
First, the fact that the UNDERC forests have been unmanaged for up to 40
years might have skewed the distribution, which was formulated for managed
stands. This seems unlikely because old-growth and undisturbed stands, with
natural treefall gaps and disturbances, also tend to take on a reverse-j diameter
distribution (Crow et al. 2002, Lahde et al 2002). A stand that was transitioning
between the two would probably show a similar distribution.
Second, the fact that only trees >10 cm dbh were recorded could have
skewed the distribution results. This has been shown to happen in a related
distribution curve that is theoretically negative exponential in uneven-age stands –
the age distribution curve (Loewenstein et al. 2000). This possibility could be
explored by determining the distribution of known uneven-age stands of similar
composition, which could probably be located at the Ottawa National Forest.
Third, some degree of high-grading cut might have been performed,
removing most of the handful of very large trees characteristic of the reverse-j
uneven age diameter distribution. In addition to the large trees being absent from
the distribution, their absence would mean that the forest would lose its main
source of natural disturbance (treefall gaps). This would, on a longer time scale,
reduce the small and medium-small diameter classes by eliminating the openings

Holland 18
they use to establish and grow. The lack of subsequent logging to provide new
gaps could have resulted in the atypical diameter distribution evident today. The
observed TH stand ages could be explained in the same way. Older trees may not
have been found because they, being the largest, were preferentially removed. A
more intensive establishment date and diameter distribution study might be able
to more conclusively explore the idea that high-grading or a similar method was
practiced on property in the mid-20th century.
It now seems likely that the MI stands were either clearcut or very heavily
partially cut. The absence of old trees is not consistent with a partial cut. Also,
the substantial aspen presence (23% of the MI stands on average) probably
indicates a very open post-cut forest floor. It is possible, however, that aspen was
a part of the pre-cut MI stands, and that it could have grown rapidly from root
suckers and re-entered the canopy in that way. The weak reverse-j fits do not
provide much guidance.
The IH stands are almost certainly the result of clearcutting. An almost
exclusively aspen stand could not have come about from any other logging
technique. The lack of old trees in these stands and their general failure to fit the
negative exponential distribution support this idea. The one stand that fit the
distribution well defies my explanation.

Holland 19
Experimental Weaknesses and Direction of Future Research
The primary weakness of this study is its narrow focus. UNDERC, like
most northern hardwood forests, is comprised of many different stand types.
Aspen- and sugar maple-dominated stands may make up a substantial percentage
of the property, but the majority of the property is comprised of stands with a
more diverse mix of tree species. To get a complete picture of the logging history
of the property, these sites must be examined. While very wet sites such as bogs
dominated by black spruce and tamarack can be ignored because they are not
likely places for a logging operation to try to harvest, all upland sites should be
explored.
These methods and statistics of this study did not work very well with
stands that could not be easily classified. The t-test known-unknown comparison
method would be largely useless in a study that encompassed the full diversity of
upland UNDERC forests – it would be impossible to classify enough stands in the
same categories. Rigorous tree coring could be an alternative to this method. If a
much larger number of trees in each stand were cored, and if the coring were done
in a way that assured a representative sample, logging history and technique could
probably be established reasonably well.
Another weakness in this study was the general difficulty of obtaining
good tree core readings. This was due to two factors. First, many of the larger
trees on property are experiencing heart rot or developing hollow centers,

Holland 20
meaning they do not produce good, dateable cores. This could complicate a
purely core-based experiment – if unhealthy trees are excluded, it might bias the
forest sample. Second, it is simply very difficult to accurately read the cores.
Ranges of ~3 years for a given event are not hard to provide, but specific years
are anything but guaranteed.
The manner in which release years were determined may also have been a
problem in this study. The typical method of determining release years relies on
measuring the width of each tree ring using some combination of movable stage
microscope and computer technology (Canham 1985, Bebber et al. 2003). The
purely visual technique used in this study probably missed many less immediate
and clear releases (Bebber et al. 2003). Also, releases and cuts may not always
line up exactly– in white pine, it is common for releases not to appear until three
or more years after a disturbance (Bebber et al. 2003).
Predictions for UNDERC Forests
The present-day UNDERC forest composition is still very much a result of
the mid-20th century logging, which appears to have encompassed the majority of
the upland areas of the property. As time goes on, the pure aspen stand will
probably cease to exist on property except in future disturbed areas (i.e.
windfalls). As the forest matures, sugar maple will increase in dominance.
Large, old maple in some of the pure maple stands on property have already been
creating natural treefall gaps for years. As time goes on and maple trees in what

Holland 21
are currently mid- and early-successional forests become older, they will begin to
die as well. In the long term, UNDERC should return to an old-growth style
regeneration pattern, albeit with somewhat different species composition. Less
dominant species such as yellow birch and white ash should find a lasting habitat
in these canopy gaps.
ACKNOWLEDGEMENTS
I would like to thank Anne Chouinard for the constant stream of
knowledge, guidance, and enthusiasm that she put into this study. I would also
like to thank Karen Francl for her guidance and support, Keren Tischbaum, Molly
VanAppledorn, and Gary Belovsky for their assistance, Anne’s father-in-law and
Mac, Gary and Bob in UNDERC maintenance for indispensable woodworking
help, and the UNDERC class of 2006 for their moral support and companionship.
Finally, thanks to the Bernard J. Hank Family Endowment for the financial
support without which this study would not have been possible.
LITERATURE CITED
Balandier, P., C. Collet, J.H. Miller, P.E. Reynolds, S.M. Zedaker. 2006.
Designing Forest Vegetation Management Srategies Based on the
Mechanisms and Dynamics of Crop Tree Competition by Neighbouring
Vegetation. Forestry 79.

Holland 22
Barnes, B.V. and W.H. Wagner. 2004. Michigan Trees: a Guide to the Trees of
the Great Lakes Region. University of Michigan Press, Ann Arbor,
Michigan.
Bebber, D. P., S.C. Thomas, W.G. Cole, D. Balsille. 2003. Diameter Increment in
Mature Eastern White Pine Pinus strobes L. following partial harvest of
old-growth stands in Ontario, Canada. Trees 18:29-34.
Canham, C.D. 1985. Suppression and Release during Canopy Recruitment in
Acer saccharum. Bulletin of the Torrey Botanical Club 112(2), 134-145.
Crow, T. R., D.S. Buckley, E.A. Nauertz, and J.C. Zasada. 2002. Effects of
Management on the Composition and Structure of Northern Hardwood
Forests in Upper Michigan. Forest Science 48(1):129-145.
Dixon, F.L., D.V. Clay, I. Willoughby. 2006. The Efficacy of Pre-emergence
Herbicides on Problem Weeds in Woodland Regeneration. Crop
Protection 25: 259-268.
Iseman, T.M., D.R. Zak, W.E. Holmes, A.G. Merrill. 1999. Revegetation and
Nitrate Leaching from Lake States Northern Hardwood Forests Following
Harvest.
Kelty, M.J., A.W. D’Amato. 2005. Historical Perspective on Diameter-Limit
Cutting in Northeastern Forests. In: Kenefic, Laura S.; Nyland, Ralph D.
eds. Proceedings of the Conference on Diameter-Limit Cutting in
Northeastern Forests.; 2005 May 23-24; Amherst, MA. Gen. Tech. Rep.

Holland 23
NE-341.
Lahde, E. T. Eskelinen, A. Vaananen. 2002. Growth and Diversity Effects of
Silvicultural Alternatives on an Old-growth Forest in Finland. Forestry
75(4):395-400.
Loewenstein, E.F., P.S. Johnson, H. E. Garrett. 2000. Age and Diameter
Structure of a Managed Uneven-aged Oak Forest. Canadian Journal of
Forest Research 30:1060-1070.
Lothner, D.C., R.M. Marden, and E. Kallio. 1974. Weight-Volume Relationships
of Aspen and Winter-Cut Black Spruce Pulpwood in Northern Minnesota.
USDA Forest Service, Washington D.C., NC-174.
Mahon, B. 2003. Logging History of UNDERC. BIOS 569: Practicum in Field
Biology, University of Notre Dame.
Palik, B., K. Cease, L. Egeland, C. Blinn. 2003. Aspen Regeneration in Riparian
Management Zones in Northern Minnesota: Effects of Residual Overstory
and Harvest Method. Northern Journal of Applied Forestry. 20(2) 79-84.
Peterson, C.J. and E.R. Squiers. 1995. Competition and Succession in an Aspen-
White-Pine Forest. Journal of Ecology 83:449-457.
Sakai, A.K. and J.H. Sulak 1985. Four Decades of Secondary Succession in Two
Lowland Permanent Plots in Northern Lower Michigan. American
Midland Naturalist 113(1):146-157

Holland 24
Spelter, H. 2003. Challenges in Converting Among Log Scaling Methods. USDA
Forest Service, Washington D.C., FPL-RP-611
Stearns, F. and G.E. Likens. 2002. One Hundred Years of Recovery of a Pine
Forest in Northern Wisconsin. American Midland Naturalist 148:2-19.
Underwood, Z.J. 2005. Ground-Truthing the UNDERC Property Using GIS;
Filling the Gaps in the Ottawa National Forest Surveys of Surrounding
Forests. BIOS 569: Practicum in Field Biology, University of Notre
Dame.
Whitney, G.G. 1987. An Ecological History of the Great Lakes Forest of
Michigan. Journal of Ecology 75:667-684.

Holland 25
Table 1. Tree core results: Basic stand information, oldest three approximate establishment
dates based on cores, and dates of releases. Number of cores with this date given in
parenthesis.
Site # Stand Type Knwn./Unk. Oldest Trees Release? (# of cores) 1 MI Known 1926, 1930, 1932 1957 (1) 2 TH Known 1931, 1933, 1933 1956-7 (4) 3 MI(Red Maple) Known 1933, 1939, 1941 1960 (1) 4 IH Known 1944, 1945, 1960 None 5 MI Known 1927, 1929, 1930 1959-60 (4) 6 TH Known 1926, 1930, 1931 1961 (1) 7 IH Known 1922, 1929, 1932 None 8 TH Known 1831, 1897, 1905 1895 (1), 1959-60 (3) 9 MI Known 1935, 1936, 1938 1954 or 60 (1) 10 IH Unknown 1936, 1939, 1944 1962 (2) 11 TH Unknown 1921, 1924, 1935 1962 (1) 12 TH Unknown 1909, 1923, 1931 None 13 TH Unknown 1883, 1887, 1891 1962-3 (2) 14 IH Unknown 1940, 1961, 1963 None 15 IH Unknown 1944, 1946, 1967 1965 (2) 16 IH Unknown 1930, 1942, 1958 None 17 MI(Red Maple) Unknown 1925, 1929, 1941 1954 (1) 18 TH Unknown 1890, 1935, 1940 1960 (2)

Holland 26
Figure 1. Map showing study sites and areas indicated as having been cut
1955-1961 by archive records. #1-9 are known-cut stands, #10-18 are
unknown-history stands. Outlined areas are cuts marked on archive maps
(with indicated year when provided).
Holland 27
0
5
10
15
20
25
30
35
40
45
1830
1840
1850
1860
1870
1880
1890
1900
1910
1920
1930
1940
1950
1960
1970
Decade
# o
f Tre
es
Figure 2. Distribution of approximate establishment dates of 159 trees
from 18 stands on the UNDERC property.

Holland 28
IHK 10 14 15 16 MIK 17 THK 11 12 13 18 0
5
10
15
20
25
30
35
40
Figure 3. Average dbh of trees of dominant canopy species, dbh >10 cm.
Checkered/dashed pattern bars represent combined average for all known-
cut stands of that type (IH=diamonds, MI=dashes, TH=squares), each
striped bar represents average for one unknown-history stand (IH
stands=downward stripes, MI stand=vertical stripes, TH stands= upward
stripes). Significant differences denoted with *. Error bars are SD.
MIXED TOLERANT HARDWOOD
INTOLERANT HARDWOOD
Ave
rage
dbh o
f dom
inan
t ca
nopy
spec
ies
* * * *

Holland 29
% S
had
e in
tole
rant
canopy
tree
s
0
10
20
30
40
50
60
70
80
90
100
*
Figure 4. Average relative abundance of quaking aspen. Checkered/dashed
pattern bars represent combined average for all known-cut stands of that
type (IH=diamonds, MI=dashes, TH=squares), each striped bar represents
average for one unknown-history stand (IH stands=downward stripes, MI
stand=vertical stripes, TH stands= upward stripes). Significant differences
denoted with *. Error bars are SD.
IHK 10 14 15 16 MIK 17 THK 11 12 13 18
INTOLERANT HARDWOOD
MIXED TOLERANT HARDWOOD
Holland 30
FITTED DISTRIBUTION FITTED DISTRIBUTION
10 23 36 49
DBH
0
10
20
30
Cou
nt
0.0
0.1
0.2
0.3
0.4
0.5
Proportion per B
ar
10 16 21 27 32DBH
0
5
10
15
Cou
nt
0.0
0.1
0.2
Proportion per B
ar
Figure 5. An example of a good fit to negative exponential diameter
distribution curve (site 3: K-S=0.103, p=0.633) and a bad fit (site 4: K-
S=0.191, p=0.017).
Good Fit - Site 3 Bad Fit - Site 4