determining elemental impurities in pharmaceutical...
TRANSCRIPT

www.themedicinemaker.com
It’s elementaryNew guidance for element impurities
11
Top tipsFinding the right tools for the job
20
Prepare for glorySample preparation tips and tricks
23
C lever complianceTools to meet regulatory requirements
29
Determining Elemental Impurities
in Pharmaceutical Products and Dietary
SupplementsA QA/QC Primer for USP <232>,
<233>, <2232> and ICH Q3D
Edition 2 – November 2015

02 Contents 03 Disclaimer
04 Foreword – The Medicine Maker05 Foreword – USP
06 Historical Determination of Heavy Metals 06 Colorimetric methods 07 Why do we need to move on from colorimetric methods? 07 What metals should we look for and at what level?
08 Developing New Methods for Determining Elemental Impurities 08 Evolution of USP <232>, <233> and <2232> methods 10 Evolution of ICH Q3D guidelines 10 Regulatory wrangles - alignment of ICH guidelines and USP methods
11 New Methods for Elemental Impurities
11 USP General Chapter <232> - Limits
13 Compliance with USP General Chapter <232> limits 14 ICH Q3D - Limits 15 USP General Chapter <233> - Procedures 16 Is the technique suitable? 18 USP General Chapter <2232> - Dietary Supplements and Nutraceutical Products
10 Tips for the Analysis of Pharmaceutical Materials 21 Which technique should you use? 21 ICP-OES 22 ICP-MS 22 What’s the right tool for the job?
Contents
As we approach the point at which new USP and ICH
methodologies for assessing metal contamination come into effect, companies need to act now or risk being left behind.This primer is intended to help
pharmaceutical manufacturers and contract laboratories
understand and implement new methodologies for the determination of elemental impurities in drugs, drug
products and raw materials, as well as elemental contaminants
in dietary supplements.New methods and guidelines
are coming from United States Pharmacopeia (USP) Chapters USP <232>, <233> and <2232>, and counterpart guidelines from
International Conference on Harmonization (ICH), which are observed by the European
Medicines Agency and referred to as ICH Q3D.
We hope this primer provides QA/QC practitioners insight into the evolution and current
status of methods and guidelines for the determination of
elemental impurities, whilst educating in the best practices
and optimum workflows for this demanding application.
DisclaimerThis primer is provided by
Thermo Fisher Scientific strictly for personal educational use. Whilst every effort has been taken to ensure content is current at time of print, this primer is not intended to substitute current regulatory guidance or methods. By
using this primer, you assume the risk that the information and materials
herein may be incomplete, inaccurate, out of date, or may not meet your needs
and requirements.
RISK!
1815
23 Sample Preparation Tips
24 Why dissolve samples? 25 Why use microwave digestion? 25 Which acids?
26 How Can I Increase Productivity? 27 Fast sampling
27 Fast, intelligent samplers and auto-diluters 28 Automatic system set-up and calibration
29 Tools for Regulatory Compliance
29 Compliant software 29 Reporting 29 System qualification
30 Summary
30 Acknowledgements
30 References
6
16

Foreword
It’s elementary! Understanding new guidance on elemental impurities.
Although the risk factors for heavy metal contamination have altered dramatically, standard methods for their determination and control have
changed little for more than 100 years,still relying on wet chemistry and interpreting color changes.
But now new guidelines from the United States Pharmacopeia (USP) and the International Conference on Harmonization (ICH) are on the way. They take advantage of the huge advances in analytical science in recent years and demand accurate, reliable testing. It is a huge step-change in how trace elements are analyzed in pharmaceutical and nutraceutical products, and the increased precision will provide a much higher degree of patient protection.
Patient safety is the number one priority for everyone engaged in making medicines, and the new guidance has been welcomed. However, the increasing complexity of today’s analytical techniques does throw up challenges, particularly for smaller pharma companies and generics manufacturers who may be faced with setting up new labs dedicated to trace element analysis, with all the associated equipment and training needs.
This educational primer, created by Thermo Fisher Scientific and The Medicine Maker, is intended to help pharmaceutical manufacturers and
contract laboratories understand and implement the new methodologies before the regulation comes into force.
Thermo Fisher Scientific, and other vendors in the analytics arena, have seen a growing stream of questions and requests for information from customers who know they need to implement the new guidance, but aren’t always entirely sure how. Having amassed a long list of customer questions and answers, Thermo Fisher Scientific created this primer to provide a starting point for companies implementing new methods.
The primer begins by reviewing the reasons behind the new guidance and what it means for pharmaceutical and nutraceutical manufacturers. We then look at each new USP Chapter in turn, before discussing the merits of different analytical techniques and sharing tips and advice on sample preparation, productivity and regulatory compliance.
The Medicine Maker team are pleased to partner with Thermo Fisher Scientific to disseminate the primer, and we hope it will prove to be a valuable resource for anyone who wishes to learn more about the latest guidance.
Charlotte BarkerEditor, The Medicine Maker
Foreword
Elemental Impurities – Impact on Drug QualityAs pharmaceutical production goes global, new USP standards on elemental impurities are being introduced to keep patients safe.
Today, approximately 80 percent of all active pharmaceutical ingredients in medicines sold in the US are manufactured in another part of
the world. Whether it’s the manufacture of a prescription medicine, an over-the-counter drug or a dietary supplement, the production of pharmaceuticals and other health-related products truly has become a global enterprise.
While manufacturers have to ensure the quality and consistency of ingredients that go into a final pharmaceutical product, they must also employ measures for the proper control of unwanted impurities in drugs and drug ingredients. Standards for the identity, strength, quality and purity of drug products and their ingredients are developed by the U.S. Pharmacopeial Convention (USP). These standards are enforceable by the FDA as part of the overall safety net that helps to protect public health with regard to drug quality. Recently, USP announced that its new standards for elemental impurities in drug products will be implemented on January 1, 2018.
Elemental impurities include substances such as arsenic, cadmium, lead and mercury, which can appear in a final drug product through various routes. They can occur naturally as a result of their presence in the ground from which materials are sourced, be added intentionally as part of a product’s synthesis (e.g., as a catalyst in chemical reactions), or be introduced inadvertently (e.g., interactions with processing equipment during manufacturing).
To date, there have been no known health-related incidents involving elemental impurities in pharmaceuticals. However, there are concerns about the ability to control for quality – particularly when products and ingredients come from so many sources, both domestic and non-domestic.
USP undergoes a continuous evaluation and revision of all its standards in order to update their scientific and public health relevance. While no specific event triggered the revision of elemental impurities standards, USP’s scientific experts concluded that these standards should be updated to incorporate modern analytical methods and current health information on these impurities.
In addition to coordinating its efforts with the FDA and industry, USP has worked closely with the International Conference on Harmonization (ICH) to ensure alignment of its new standards for elemental impurities with the ICH Q3D Guideline for Elemental Impurities.
Ultimately, manufacturers of drug products and ingredients are responsible for assuring conformance to FDA requirements and USP standards, no matter what the source of their materials. As more ingredients come from varied sources, applying modern, scientifically sound quality standards will help protect both manufacturers and – more importantly – patients.
Kahkashan ZaidiPrincipal scientific liaison, USP General Chapters
This article first appeared at Quality Matters (qualitymatters.usp.org), the blog of the United States Pharmacopeial Convention (USP). Reprinted with permission from USP.

RISK!
Colorimetric analytical methods are based on measuring color changes of solutions that arise from specific chemical interactions with the analyte elements. USP Chapter <231> is based on a chemical reaction of the heavy metal, compared with a standard prepared from a stock lead solution. It relies on the ability of heavy elements such as lead, mercury, bismuth, arsenic, antimony, tin, cadmium, silver, copper, and molybdenum to react with thioacetamide (an organic-based sulfur compound) at pH 3–4 to produce a precipitate of the metallic sulfide, which is then compared with a lead standard solution. It is used to demonstrate that the metallic impurities colored by sulfide ions under the specific test conditions do not exceed a limit of 10 parts per million (ppm). However, since many metals behave very differently, the method requires that the visual comparison is performed very quickly after the precipitate has formed. Unfortunately, analysts can differ in their interpretation of the color change, so different analysts may not consistently read the sample and standard solutions correctly each time.
Other drawbacks of this approach include:
• Human variability: procedures are time-consuming and labor- intensive so results and recoveries can vary significantly among analysts. • Matrix assumption: the assumption that formation of the sulfides in the sample is similar to that of the lead standard solution, and not affected by the sample matrix. • Matrix removal: herbal dietary supplement samples require an oxidation step with concentrated nitric and sulfuric acids to remove the carbon, followed by digestion with hydrochloric acid and finally
sulfide precipitation. These extra steps restrict the detection limit for this test to circa 20 ppm where all the metals described previously are also measured as lead equivalents. It is well recognized that the heavy metals, and mercury in particular, are not well recovered by this method. • Preparative losses: the sample preparation procedure involves ashing at high temperature and acid dissolution of the sample residue. Consequently, it is prone to sample losses, particularly for volatile elements like mercury. The loss of metals is also matrix-dependent.
Why do we need to move on from colorimetric methods?
In 2008, the USP supported a workshop to address limitations of specifications for metals testing as described in Chapter <231> [2]. A committee was directed to conduct a workshop that would provide the basis for USP to advance specifications for metals testing on the basis of risk assessment, toxicological science and modern analytical methodology. In addition, the committee was asked to involve experts from Europe and Japan, with the goal of delivering common specifications and analytical procedures for metals testing that would be accepted by the global pharmaceutical and nutraceutical communities.
A general consensus from the workshop was that the colorimetric methodology for metals testing was inadequate and should be replaced by instrumental methods of greater specificity and sensitivity for a wide range of metals of interest. Analysis of metals had radically changed in other industries, such as industrial and environmental; however, the pharmaceutical industry lagged
behind. It was acknowledged that with current state-of-the-art methods, metals can be detected at levels much lower than clinical or toxicological importance. The challenge therefore represented the coupling of method capability, risk assessment, and likelihood of presence of metals of interest in a manner that best protects public health.
What metals should we look for and at what level?
Historically, several metals had shown prevalence in pharmaceuticals due to their use in manufacturing vessel alloys, organometallic reagents or as catalysts. Some metals also had known toxic effects. Consequently, there was general agreement with regulators that the following metals should be detectable at toxicologically relevant concentrations:
• Lead• Mercury • Arsenic• Cadmium
In addition, the following elements should be detectable based on the likelihood of presence and toxicity:
• Platinum• Palladium
6 The Medicine Maker × Thermo F isher Scient i f ic � 7The Medicine Maker × Thermo F isher Scient i f ic �
Although the risk factors for heavy metal contamination have altered dramatically, standard methods for their determination and control have changed little for more than 100 years. They have relied primarily on colorimetric analytical methods based on precipitation of the metal sulfide in a sample, and comparing it to a lead standard; USP Chapter <231> [1]. As a result, most regulated limits for heavy metals were based on historical test performance limits and had little basis in toxicology.
Historical Determination of Heavy MetalsColorimetric methods
“Procedures are time-consuming
and labor-intensive, so results and recoveries can vary significantly among analysts.”

global parties. Based on feedback from all these different stakeholders, there have been a number of revisions to both Chapter <232> and <233>, which resulted in implementation timelines being modified a number of times.
However, an announcement on January 14, 2015 established January 1, 2018 as the new date of applicability for General Chapters <232>, <233> and <2232> [4]. This was intended to align implementation more closely with limits and timelines
set down by other global pharmaceutical and medical agencies such as the ICH Q3D Step 4 Guidelines for Elemental Impurities announced on December 16, 2014 [5]. The intention was to provide a buffer period where users could either continue to utilize the existing Chapter <231> approach, or implement the methodology outlined in the new chapters <232>, <233> and <2232>. In the period between 2015 and 2018, the USP will be engaging in an ongoing dialogue with the
8 The Medicine Maker × Thermo F isher Scient i f ic � 9The Medicine Maker × Thermo F isher Scient i f ic �
After several years, with many meetings and expert panel discussions, USP proposed three new General Chapters in 2010 covering impurity limits, analytical procedures in pharmaceutical products and raw materials, and elemental contaminants in dietary supplements:
• Chapter <232> Elemental Impurities in Pharmaceutical Products —Limits • Chapter <233> Elemental Impurities in Pharmaceutical Products — Procedures • Chapter <2232> Elemental Contaminants in Dietary Supplements
These revisions focused on two main areas of work:
1. Updating the methodology used to test for elemental impurities in drugs and dietary supplements to include procedures that rely on modern analytical technology.2. Setting limits for acceptable levels of metal impurities (including, but not limited to, lead, mercury, arsenic, and cadmium) in drugs and dietary supplements.
The USP Metal Impurities Expert Panel worked with stakeholders to assess methodologies and limits that provide
greater patient/consumer protection and could reasonably be deployed across industry laboratories. It was decided that limits for exposure should be toxicologically based and be developed by an expert consensus process.
The USP moved forward with these new chapters, gathering comments from the pharmaceutical and nutraceutical manufacturing industries, analytical instrumentation user community, regulatory agencies and other interested
Developing New Methods for Determining Elemental ImpuritiesEvolution of USP <232>, <233> and <2232> methods
January
1 2018
“Limits for exposure should be
toxicologically based and be developed by an expert consensus
process.”
• Ruthenium• Rhodium• Rubidium
This was consistent with the European Medicines Agency (EMA) guidelines [3].
Another important consideration is the form of the metal in the finished product. This is of particular importance for arsenic and mercury. Dietary supplements that contain kelp may have very high concentrations of organic arsenic, which is relatively innocuous compared to inorganic arsenic. Similarly, metallic mercury is relatively non-toxic, while methyl mercury is highly toxic and is known to be concentrated in some foods, such as fish. Lead in all forms is toxic, but tetraethyl lead in particular is much more toxic than metallic lead.
Unless separation of the different chemical forms of a metal (speciation) is carried out prior to analysis, the total of all forms for a given metal will be determined. Reports of metals in various dietary supplements describe both metals that should not be present in any form, such as lead and mercury, and metals that are well known to be present in non-toxic forms, such as arsenic.
The overall conclusion of the workshop was that a major revision of USP <231> was needed. In addition, further consideration of limits for the testing of other metals associated with the manufacturing process was necessary. It was also a goal that serious effort would be made to harmonize approaches to metals testing across the major pharmacopeias globally. These efforts would then go forward as a public process, with input sought from the various stakeholders at each step of the implementation process.

pharmaceutical industry, the FDA, and the ICH to ensure this alignment process goes as smoothly.
Evolution of ICH Q3D guidelines
In 2009 the ICH proposed that a new harmonized guideline be developed to provide a global policy for limiting metal impurities in drug products and ingredients. The existing ICH Q3A Guideline classifies impurities as organic, inorganic, and residual solvents. The Q3A and Q3B Guidelines effectively addresses the requirements for organic impurities, while Q3C covers requirements for residual solvents. The proposed new Guideline, Q3D, would provide clarif ication of elemental impurity requirements.
A harmonized approach for control of elemental impurities, including the list of specific metals to be limited and the appropriate limits, would be beneficial to help avoid uncertainty and duplication of work. Some regulatory guidance on specification limits for residues of metal catalysts and reagents was recently provided by Europe, but similar regulatory guidance had not yet been provided from the U.S. or Japan for public review. An ICH Guideline would ensure that new requirements have the necessary input of the regional regulatory authorities, to the benefit of regulators, industry, and public health. A guideline for elemental impurities would emphasize control of supply chains and risk assessment, as was done for residual solvents. Furthermore, a harmonized guideline would provide appropriate safety-based limits for the control of metal impurities, along with consistent expectations for test requirements and regulatory filings.
The ICH published a Step 4 version of its “Guidelines for Element Impurities” document [5], which categorized the
various elemental impurities in four different classifications which were intended to facilitate decisions during the risk assessment process:
• Class 1 impurities are significantly toxic across all routes of administration. Typically they have limited or no use in the manufacture of pharmaceuticals but can be present as impurities in commonly used materials (e.g., mined excipients) and cannot be readily removed from the material. These four elemental impurities; As, Cd, Hg and Pb require consideration during the risk assessment. • Class 2 impurities are toxic based on route of administration. Some of the elements present in this category are infrequently observed as impurities in materials used to produce drug products. As such, unless intentionally added, they have a low probability of inclusion in the drug product and do not present a significant risk. Class 2 elemental impurities are further categorized: o Class 2A: V, Mo, Se, and Co require assessment across all potential sources and routes of administration o Class 2B: Au, Tl, Pd, Pt, Ir, Os, Rh, Ag and Ru require assessment across potential impurity sources only if they are intentionally added to the processes used to generate the material under evaluation. • Class 3 impurities are impurities with relatively low toxicity and have high permitted daily exposure (PDE) limits by the oral route of administration but require consideration in the risk assessment for other routes of administration (e.g., inhalation and parenteral
routes). For oral routes of administration, unless these elements are intentionally added as part of the process generating the material, they do not need to be considered during the risk assessment. For parenteral and inhalation products, the potential for inclusion of these elemental impurities should be evaluated during the risk assessment. The elemental impurities in this class include: Sb, Ba, Li, Cr, Cu, Sn, and Ni. • Class 4 impurities have been evaluated but a PDE has not been established due to their low inherent toxicity and/or regional regulations. The elements in this class are include: Al, B, Fe, Zn, K, Ca, Na, Mn, Mg, and W.
All classes and ICH PDEs are summarized in Table 3 on page 14.
Regulatory wrangles – alignment of ICH guidelines and USP methods
The ICH urged the USP to fully align the elemental impurities defined in Chapter <232> with the ICH Q3D Step 2B requirements. After some initial reluctance, in October 2013, the USP agreed to partially align the limits defined in Chapter <232> with the Q3D Step 2B document and make some minor editorial modifications to Chapter <233>. Partially aligned limits were posted by the USP and remained in place until a further announcement in October, 2014 which indicated that USP intends to fully align Chapter <232> and Chapter <233> with Q3D directives outlined in the Step 4 document, but includes the statement “to the extent possible”. This leaves a situation of slight ambiguity at time of writing, June 2015.
New Methods for Elemental ImpuritiesUSP General Chapter <232> – Limits
This chapter specifies limits for elemental impurities in drug products, drug substances, active ingredients and excipients. The elemental impurity levels in drug products, unless otherwise specified in an individual drug product monograph, must show compliance with the limits specified and be made available to the regulatory agency upon request.
10 The Medicine Maker × Thermo F isher Scient i f ic � 11The Medicine Maker × Thermo F isher Scient i f ic �

A total of fifteen elemental impurities (Cd, Pb, As, Hg, In, Os, Pd, Pt, Rh, Ru, Cr, Mo, Ni, V, Cu) are specified with their toxicity limits, defined as maximum PDE levels in µg/day for the four major drug delivery categories. The PDE limits are shown in Table 1.
These PDE limits are related to the toxicity of the elemental impurity and its bioavailability. Exposure has been determined for each of the elemental impurities of interest, for the four major routes of administration:
• Oral• Inhalation• Parenteral (intravenous)• Large volume parenteral (LVP)
However, these limits do not apply to parenteral nutritional supplements, dialysates or conventional vaccines. The parenteral category covers injections greater than 10mL but less than 100 mL, whereas the LVP category covers injections greater than 100 mL. The other two routes of administration, mucosal and topical, which are not called out in the list of PDEs, are considered to be the same as oral.
Speciation USP Chapter <232> addresses speciation, although it does not specify an analytical procedure. Each of the elements has the potential to be present in differing oxidation states or species. However, arsenic and mercury are of particular concern because of differing toxicities between their inorganic and organic forms:
• Arsenic limits are based on the inorganic form, which is the most toxic. Arsenic can be measured using a total-arsenic procedure under the assumption that all arsenic contained in the material under test is in the inorganic
Element Oral Daily Dose PDE (μg/day)
Parenteral Daily Dose PDE (μg/
day)
Inhalation Daily Dose PDE (μg/
day)
LVP Component
Limit (μg/g)
Cadmium Cd 5.0 2.5 3.4 0.25
Lead Pb 5.0 5.0 5.0 0.5
Arsenic (Inorganic) As 15 15 1.9 1.5
Mercury (Inorganic) Hg 15 1.5 1.2 0.15
Iridium Ir 100 10 1.5 1.0
Osmium Os 100 10 1.5 1.0
Palladium Pd 100 10 1.0 1.0
Platinum Pt 100 10 1.5 1.0
Rhodium Rh 100 10 1.5 1.0
Ruthenium Ru 100 10 1.5 1.0
Chromium Cr ‡ ‡ 2.9 ‡
Molybdenum Mo 180 90 7.6 9.0
Nickel Ni 600 60 6.0 6.0
Vanadium V 120 12 1.2 1.2
Copper Cu 1300 130 13 13
Table 1. Elemental Impurities for Drug Products Defined in USP Chapter <232> [6].Based on an arbitrary adult human body weight for either sex of 50 kg (110 lb). These represent updated ICH guidelines limits from December 2014. They are not yet fully aligned with ICH Q3D and as such are subject to change during 2015–2018. ‡ Not considered a safety concern
Element Oral Drug
Concentration Limits (μg/g)
Parenteral DrugInhalational Drug
Concentration Limits (μg/g)
Cadmium Cd 0.5 0.25 0.34
Lead Pb 0.5 0.5 0.5
Arsenic (Inorganic) As 1.5 1.5 0.19
Mercury (Inorganic) Hg 1.5 0.15 0.12
Iridium Ir 10 1.0 0.15
Osmium Os 10 1.0 0.15
Palladium Pd 10 1.0 0.15
Platinum Pt 10 1.0 0.15
Rhodium Rh 10 1.0 0.15
Ruthenium Ru 10 1.0 0.15
Chromium Cr § § 0.29
Molybdenum Mo 18 9.0 0.76
Nickel Ni 60 6.0 0.60
Vanadium V 12 1.2 0.12
Copper Cu 130 13 1.3
Table 2. USP <232> concentration limits for drug components or products dosed at ≤10 g/day [6]†.§ Not considered a safety concern
form. Where the limit is exceeded using a total-arsenic procedure it should be demonstrated, using a suitable procedure to separate the species, that the inorganic form meets the specification (Figure 1).
• Mercury limits are based upon the inorganic mercuric (2+) oxidation state. Methyl mercury, the most toxic form, is rarely an issue for pharmaceuticals. Therefore the limit was established assuming that if mercury was present in the drug compound it would exist as the most common inorganic form. However, if there is a known potential for the material to contain methyl mercury (such
as drugs/compounds derived from fish or kelp), an appropriate speciation procedure would be required.
Compliance with USP General Chapter <232> limits
In order for the drug product to comply with specified impurity limits, the concentration of each impurity in the finished product should be no more than its PDE limits. The following three options are available for determining compliance with the limits for elemental impurities in pharmaceutical materials:
1. Drug Product Analysis: The results obtained from the analysis
of the drug compound scaled to a maximum daily dose, are compared to the daily dose PDE values shown in Table 2. Each impurity should be no more than the PDE.
Inten
sity (
cps)
Time (s)
8000
7000
6000
5000
4000
3000
2000
1000
00 100 200 300 400 500 600 700 800 900 1000
75As (KED)
Figure 1. Example LC-ICP-MS chromatogram showing arsenic speciation.
“The concentration of each impurity in the
finished product should be no more
than its PDE limits.”
12 The Medicine Maker × Thermo F isher Scient i f ic � 13The Medicine Maker × Thermo F isher Scient i f ic �

2. Summation: Quantify the concentration of each elemental impurity (in µg/g) present in each of the components of the drug product. The sum of each impurity should be no more than its daily dose PDE. It should be emphasized that before products can be evaluated using this option; the manufacturer must ensure that additional elemental impurities cannot be inadvertently added through the manufacturing process or storage of the product.
3. Individual Component: This
option is available to LVP products only, which should meet the requirements when each drug substance and raw material meets the limits provided in the LVP Component Limit column listed in Table 1. If all compounds in a formulation meet the limits shown, then these components may be used in any proportion, with no further calculation necessary. While elemental impurities derived from the manufacturing process or the storage containers are
not specifically provided for in this option, the drug product manufacturer should ensure that these sources do not contribute significantly to the total content of elemental impurities.
Acceptable levels based on final use The acceptable levels for these impurities depend on the material's ultimate use. Therefore, drug product manufacturers must determine the acceptable level of elemental impurities in the drug substances and excipients used to produce their products. The values provided in Table 2 represent concentration limits for components (drug substances and excipients) of drug products based on a maximum daily dose of ≤10 g/day. These values serve as default concentration limits to aid discussions between drug product manufacturers and the suppliers of the components of their drug products.
ICH Q3D – Limits
For comparison, the ICH Q3D PDE values are included in Table 3.
“Manufacturers must determine the
acceptable level of elemental
impurities in the drug substances
and excipients used to produce their
products.”
Element Class Oral PDE(μg/day)
Parenteral PDE
(μg/day)
Inhalation PDE
(μg/day)Cadmium Cd 1 5.0 2.0 2.0
Lead Pb 1 5.0 5.0 5.0
Arsenic As 1 15 15 2.0
Mercury Hg 1 30 3.0 1.0
Cobalt Co 2A 50 5.0 3.0
Vanadium V 2A 100 10 1.0
Nickle Ni 2A 200 20 5.0
Titanium Tl 2B 8.0 8.0 8.0
Gold Au 2B 100 100 1.0
Palladium Pd 2B 100 10 1.0
Iridium Ir 2B 100 10 1.0
Osmium Os 2B 100 10 1.0
Rhodium Rh 2B 100 10 1.0
Ruthenium Ru 2B 100 10 1.0
Selenium Se 2B 150 80 130
Silver Ag 2B 150 10 7
Platinum Pt 2B 100 10 1.0
Lithium Li 3 550 250 25
Antimony Sb 3 1200 90 20
Barium Ba 3 1400 700 300
Molybdenum Mo 3 3000 1500 10
Copper Cu 3 3000 300 30
Tin Sn 3 6000 600 60
Chromium Cr 3 11000 1100 3.0
Table 3. ICH permitted daily exposures for elemental impurities [5].
This chapter deals with sample preparation, instrumental method and validation protocols for measuring the elemental impurities using a plasma-based spectrochemical techniques, such as:
• Inductively coupled plasma optical emission spectroscopy (ICP-OES);
• Inductively coupled plasma mass spectroscopy (ICP-MS),
• Or any alternative technique providing it meets the data quality objectives of the method.
Before any technique is used, it must be confirmed that the overall analytical procedure is appropriate for the instrument and the samples being analyzed. Analytical procedures for the determination of the oxidation state, organic complex, or speciated form of the elemental impurity are not included in this chapter.
Sample preparation procedures The selection of the appropriate sample preparation procedure will be dependent on the material being analyzed. The procedures described below have all shown to be appropriate.
• Neat: For liquids that can be analyzed without sample dilution.
• Direct aqueous solution: Used when the sample is soluble in an aqueous solvent.
• Direct organic solution: Appropriate when the sample is
USP General Chapter <233> – Procedures
14 The Medicine Maker × Thermo F isher Scient i f ic � 15The Medicine Maker × Thermo F isher Scient i f ic �

soluble in an organic solvent. • Indirect solution: Used when a
material is not directly soluble in aqueous or organic solvents. It is preferable that a total metal extraction is performed in order to obtain an indirect solution. For example, an open-vessel acid dissolution or a
closed-vessel approach, such as microwave digestion. The benefit of closed-vessel digestion is that it minimizes the loss of volatile impurities. The choice of what concentrated mineral acid to use depends on the sample matrix and the impact of any potential interferences on the analytical technique being used. An example procedure that has been shown to have broad applicability is described below:
Accurately weigh 0.5 g of the dried sample into an appropriate flask and add 5 mL of the concentrated acid. Allow the flask to sit loosely covered for 30 min in a fume hood then add an additional 10 mL of the acid, and digest completely using a closed-vessel microwave instrument. Follow the manufacturer’s recommended procedures to ensure safe use. Dilute digested solution to appropriate volume and analyze.
Detection technique Two analytical procedures are suggested in USP <233> dependent on the expected
concentration of the elemental impurity in the product or component:
• Parts-per-million (ppm) concentrations – ICP–OES, such as Figure 2, is recommended.
• Parts-per-billion (ppb) and below concentrations – ICP-MS, such as Figure 3, is preferred.
• Alternative technologies, such as atomic absorption may be used, providing validation requirements are met.
Is the technique suitable?
All analytical procedures must be validated and shown to be acceptable. The level of validation necessary depends on whether a limit test or a quantitative determination is specif ied in the individual monograph. The requirements for the validating procedures for each type of determination are described below. Any alternative procedure that has been validated and meets the acceptance criteria that follow is also considered to be suitable for use.
The following section defines the validation parameters for determining whether an analytical technique is suitable for monitoring elemental impurities at concentrations below those defined by the PDE limits for that particular drug product. Meeting these requirements must be demonstrated experimentally using an appropriate system suitability procedure and reference material. The suitability of the method must be determined by via spike recovery studies, where the sample is spiked with a known concentration of each element of interest at the appropriate acceptance limit concentration. The materials under test must be spiked before any sample preparation steps are performed.
To challenge the suitability of the technique being used and whether its detection capability is appropriate for
Figure 2. Thermo Scientific™ iCAP™ 7000 Series ICP-OES.
Figure 3. Thermo Scientific™ iCAP Q™ ICP-MS.
the analytical task it is important to know the PDE limit and dosage for each target element. More specifically, the PDE limits and the daily dosage recommendations for the drug need to be used to calculate the ‘J value’ for each element. The USP defines the J value as the PDE concentration of the element of interest, appropriately diluted to the working range of the instrument, after the sample preparation process is completed.
Equation 1 USP J factor calculationJ= PDE/(Maximum Daily Dose×Diluton Factor)
Example:
Taking Lead (Pb) as an example:
• PDE limit for Pb defined is 5 μg/day, Table 1.
• Maximum daily dosage of 10 g of the drug product/day is suggested.
• Dilution factor of 100 is used in preparation - 1 g of sample is digested/dissolved and diluted into 100 mL.
(5μg/day)J Pb= =5 μg/L
(10g/day×100)
The method then suggests using a calibration made up of 2 standards:
• Standard 1= 2.0J, Standard 2 = 0.5 J.
• So for Pb, the standard concentrations should be 10 μg/L and 2.5 μg/L respectively.
The suitability of a technique is then determined by measuring the calibration drift by comparing results for Standard
1 before and after the analysis of all the sample solutions under test. This calibration drift should be less than 20 percent for each target element.
No specific instrumental conditions are suggested in USP <233>. Samples should be analyzed according to the manufacturer's suggested conditions and results reported based on the original sample size. However, appropriate measures must be taken to correct for interferences, following general guidelines on plasma spectrochemistry [7]. Interference types include, but are not limited to:
• matrix-induced wavelength
overlaps encountered when using ICP-OES
• polyatomic interferences, such as argon-based interferences encountered when using ICP-MS
The suitability of the technique and analytical procedure is then determined by a set of validation protocols, which cover a variety of performance and quality tests, including:
• Detectability • Precision • Specificity • Accuracy • Ruggedness • Limit of Quantification (LOQ )• Linear Range
Each test is explained in great detail in USP Chapter <233>, but a brief description of each is provided below.
Detectability This section describes the procedure and requirements for determining both non-instrumental and instrumental detectability. However, here we describe only the instrumental test. Prepare the following solutions:
• ‘Standard Solution’ containing all target analytes at concentrations equal to 1.0J
• Matrix-matched blank• Un-spiked sample• Sample spiked at 1.0J
– ‘Spiked Sample Solution 1‘ • Sample spiked at 0.8J
– ‘Spiked Sample Solution 2’
The technique/procedure is considered acceptable when:
• Spiked Sample Solution 1 gives a
signal intensity equal to or greater than the Standard Solution.
• Spiked Sample Solution 2 gives a signal intensity less than the Spiked Sample Solution 1.
• The signal for each Spiked Sample is not less than the un-spiked Sample.
Precision/Repeatability • Prepare six separate test sample
solutions and spike each one such that the analytes of interest are at concentrations equal to 1.0J.
• Acceptance criterion: Relative standard deviation (RSD) for the six individual sample determinations should be < 20 percent.
Specificity The procedure must be able to assess the behavior of each target element in the presence of other components that may be present in the sample, including other target elements, matrix components, and other potential interferences. Procedures to do this are laid out elsewhere [7].
Accuracy This test is designed to assess the accuracy of the analytical method, particularly when samples are above the normal calibration range.
16 The Medicine Maker × Thermo F isher Scient i f ic � 17The Medicine Maker × Thermo F isher Scient i f ic �

• Prepare standard solutions containing target elements at concentrations ranging from 0.5J to 2.0J using suitable calibration/reference materials.
• Analyze calibration standards and build calibration curve.
• Prepare samples with spikes containing all target elements at concentrations from 0.5J to 2.0J.The technique/procedure is considered acceptable when:
• The calculated spike recovery for three replicates at each sample concentration should be 70–150 percent.
• Certified reference materials (CRM) from a national metrology institute or reference materials that are traceable to that CRM is used to validate trueness of the method.
Ruggedness The purpose of this test is to determine the
effect of random events on the analytical precision of the method. This test requires that the precision/repeatability test described above be repeated three times:
• On different days or • With different instrumentation or • By different analysts
Only one of these three experiments is required to demonstrate ruggedness. Acceptance criterion: RSD should be <25 percent for each element.
Limit of Quantification and Linear Range The LOQ and linear range capability is demonstrated by meeting the Accuracy requirement.
USP General Chapter <2232> – Dietary Supplements and Nutraceutical Products
Let’s take a closer look at the differences between USP Chapter <232> and <2232>. It is important to note that Chapter <2232> is intended only for dietary supplements and ingredients. Furthermore, Chapter <2232> is intended for information and guidance purposes only. Therefore, Chapter <2232> contains no mandatory requirements. Consequently, the FDA reserves the right to enforce it at their discretion. However, other countries may choose to strictly comply with the entire USP–NF directives.
Chapter <2232> covers the four elements of toxicological concern (As, Cd, Pb, Hg) in dietary supplements, again defined as maximum PDE levels in units of µg/day. The chapter became official on August 1, 2013 and was published in the 2nd Supplement to USP 37–NF 32 on December 1st, 2014 [7]. Chapter <2232> has no analytical procedures associated with it, but instead refers to procedures described in Chapter <233> to carry out the determination
of the four elemental contaminants in dietary supplements. As a result, full implementation of Chapter <2232> will occur on January 1, 2018 to coincide with the other two chapters.
The PDE limits defined in Chapter <2232> are shown in Table 4, unless a specific monograph provides different limits for a supplement that is consumed in larger quantities than 10 g/day. PDE levels are derived from data supplied by the Food Agriculture Organization of the United Nations and World Health Organization (FAO/WHO), based on an average person’s body weight of 50 kg and other factors derived from exposure to elemental contaminants in air, food, and drinking water.
Speciation Arsenic species determination is only required when the element of interest exceeds the limit using the standard non-species specific determination. Where the arsenic limit is exceeded compliance with the limit for inorganic arsenic shall be demonstrated on the basis of a procedure described in USP-NF General Chapter 211, which describes the determination of As via conversion to AsH3 (arsine), which is complexed with silver diethyldithiocarbamate and then measured colorimetrically [8].
Methyl mercury determination is not necessary when the content for total mercury is less than the limit for methyl mercury. When the total mercury content
is higher than the methyl mercury limit, a speciation method is recommended. With both arsenic and mercury, any speciation method is suitable; for example ion chromatography (IC) or liquid chromatography (LC) hyphenated to ICP-MS, as long as it produces results that comply with validation criteria.
Compliance with Chapter <2232> In order for a dietary supplement to comply with the limits for elemental contaminants as described in this chapter, the concentration of each impurity in the finished product should be below the respective PDE limit. The following three options are available for determining compliance with the limits for elemental contamination in dietary supplements:
• Dietary Supplement Analysis: The finished dietary supplement is analyzed according to the procedure in described in Chapter <233>. The results obtained from the analysis of a typical serving size, based on the maximum daily dosage of the supplement recommended on the label (servings/day) should be below the PDE values, outlined in Table 4.
• Individual Component: Applicable to a finished dietary supplement with a maximum daily intake of less than 10g. This option allows individual ingredients to be analyzed
according to method described in Chapter <233>. The finished product meets requirements if each component used in production of the finished product meets limits given in Table 4.
• Summation Option: Used for finished dietary supplement consumed in quantities greater than 10 g/day, or where the acceptance limit for any contaminant in any component of the dietary supplement exceeds the individual component limit. With this approach the individual ingredients are analyzed according to Chapter <233> and the concentration of each contaminant is calculated. The amount of each contaminant in the daily dosage should be below its respective PDE limit.
Although the validation procedures described in Chapter <233> are strongly recommended, the level of validation is at the discretion of the manufacturer and the regulatory authority.
Elemental Contaminant
PDE Limits(μg/day)
Individual Component Limit, Based on a Dosage of
10g/day (μg/g)Arsenic (Inorganic) As 15 1.5
Cadmium Cd 5 0.5
Lead Pb 5 1.0
Mercury Hg 15 (total) 1.5 (total)
Methyl Mercury CH3Hg 2 0.2
Table 4. USP Chapter <2232> elemental contaminant limits in dietary supplements or components.
“In order for a dietary supplement to comply with the
limits for elementalcontaminants, the
concentration of each impurity in the
finished product should be below the
respective limit.”
18 The Medicine Maker × Thermo F isher Scient i f ic � 19The Medicine Maker × Thermo F isher Scient i f ic �

Now we have run through the basics of the new methodology described in USP Chapters <232>, <233> and <2232>, let’s turn our attention to choosing the best analytical technique for our determination and offer some guidance on how to approach sample preparation.
Which technique should you use?
So which technique is best for your pharmaceutical products and ingredients? If you are an experienced user of both ICP-OES and ICP-MS instruments, with unrestricted budget, this choice may be straightforward. However, if you
have been tasked with evaluating and purchasing new instrumentation for this analysis for the first time, you will need to understand relative performance and capabilities of instrumentation available for your budget, balanced against the skillsets of people in your laboratory.
There is a great deal of information in the public domain about the strengths and weaknesses of both ICP-OES and ICP-MS [9], so we will take a brief look at the major differences between them.
ICP-OES
ICP-OES is a multi-element technique that uses inductively coupled plasma, Figure 4, to excite ground-state atoms to the point where they emit wavelength-specific photons of light that are characteristic of a particular element. The number of photons produced at an element-specific wavelength is measured by high-resolving-power optics and a photon-sensitive device such as a photomultiplier or a solid state detector. This emission signal is directly
related to the concentration of that element in the sample. The analytical temperature of an ICP is about 6000–7000°K (for comparison, a flame is typically 2500–4000°K).
• Radial view ICP-OES: Has a detector perpendicular to the ICP flame. Typical radial ICP-OES systems can achieve comparable LOQs to flame atomic absorption for the majority of the Chapter <232> suite of elements, but with up to nine orders of linear dynamic range (LDR) and it has the advantage of offering much better performance for the refractory and rare earth elements.
• Axial view ICP-OES: The plasma is viewed end-on, or axially. The benefit is that more photons are seen by the detector and as a result, detection limits can be circa 5–10 fold lower. The LDR is the same as a radial ICP-OES, but as a result of the lower detection capability, the
Tips for the Analysis of Pharmaceutical Materials
Element J-Value(μg/g)
ICP-MS MDL[10]
(μg/g)
ICP-OESMDL [11]
(μg/g)
ICP-MSFD
( J/MDL)
ICP-OESFD
( J/MDL)Cadmium Cd 0.5 0.0004 0.0040 1250 125
Lead Pb 0.5 0.0014 0.0620 357 8
Arsenic (Inorganic) As 1.5 0.0102 0.0700 147 21
Mercury (Inorganic) Hg 1.5 0.0120 0.0500 125 30
Iridium Ir 10.0 0.0258 0.0340 388 294
Osmium Os 10.0 0.0114 0.0310 877 323
Palladium Pd 10.0 0.0030 0.0550 3333 182
Platinum Pt 10.0 0.0002 0.0850 50000 118
Rhodium Rh 10.0 0.0002 0.0950 50000 105
Ruthenium Ru 10.0 0.0002 0.0510 50000 196
Molybdenum Mo 18.0 0.0050 0.0220 3600 818
Nickel Ni 60.0 0.0030 0.0150 20000 4000
Vanadium V 12.0 0.0042 0.0120 2857 1000
Copper Cu 130.0 0.0030 0.0080 43333 16250
Table 5. Example USP <233> J-values compared to both ICP-OES and ICP-MS MDLs.
20 The Medicine Maker × Thermo F isher Scient i f ic � 21The Medicine Maker × Thermo F isher Scient i f ic �

QUICK TIPLDR is shifted down an order of magnitude.
• Most commercially available ICP-OES instrumentation offers both radial and axial viewing in the same instrument.
ICP-MS
The fundamental difference between ICP-OES and ICP-MS is that in ICP-MS, the plasma is not used to generate photons, but to generate positively charged ions. The ions produced are transported and separated according to their mass-to-charge ratio (m/z) using a mass-filtering device such as a quadrupole. The generation of such large numbers of positively charged ions allows ICP-MS instruments to achieve detection limits in the low parts per trillion range, typically three orders of magnitude lower than ICP-OES. Another advantage of ICP-MS is that it is capable of delivering nine linear orders of dynamic range. However,
one of the major limitations of ICP-MS is its intolerance to high dissolved solids. When analyzing samples by ICP-MS, the levels of total dissolved solids (TDS) should ideally be kept below one percent, although high matrix sample introduction systems are now commercially available.
What’s the right tool for the job?
Now we've covered the basics of each technique, how do you decide which one is right for your product? Let us focus on axial ICP-OES and ICP-MS, which are the most prevalent techniques in pharmaceutical quality control (QC) and contract testing labs.
Comparison data for ICP-OES and ICP-MS are shown in Table 5. The ‘factor difference’ (FD) for each instrument is calculated based on J-value divided by experimental method detection limit (MDL) values, Equation 2.
Equation 2 Calculation of FD JFD = MDL
FD provides indication of whether the elemental target concentrations can be determined with good accuracy and precision. Values above 1 are required – the higher the FD value, the more reliable the result.
It should be emphasized that instrument detection limits are not a true reflection of the measurement capability of the technique in real samples. It is generally accepted that a MDL, where a blank is taken through the entire sample preparation process, is a better assessment of the limit of detection in the sample matrix under test. This is why we have chosen to use published MDL
values in this case. However, please note that the MDLs were calculated using different blanks and standards.
Table 5 shows that ICP-OES offers good possibilities for monitoring oral drugs because all of the improvement factors are significantly higher than one. These numbers could be further improved, especially for the heavy metals, by using a much higher sample weight in the sample preparation procedure without compromising the method.
In addition, it can be seen in Table 5 that ICP-MS shows significantly lower MDLs for all impurities. FD values are variable between the two techniques. However, for the four heavy metals, there appears to be ample opportunity to monitor them with good accuracy and precision.
The added benefit of using ICP-MS is that it would also be suitable for the other methods of pharmaceutical delivery, such as intravenous or inhalation, where the PDE levels are typically an order of magnitude lower. It is unlikely that axial ICP-OES would be suitable for these methods of delivery. Additionally, if total arsenic or mercury levels were found to be higher than the PDE levels, it would be relatively straightforward to couple ICP-MS with IC or LC to monitor the speciated forms of these elements.
Figure 4. ICP torch.
“Now we've covered the basics of
each technique, how do you decide which one is right for your product?”
Under ideal circumstances the sample under investigation is in a liquid form, so it can be diluted in an aqueous or organic solvent or aspirated without any prior sample preparation. However, if the sample is a solid or powdered material, chances are that it will have to be digested either via an open-vessel hot plate dissolution technique using concentrated mineral acids, or with a closed-vessel, microwave digestion procedure.
Sample Preparation Tips
22 The Medicine Maker × Thermo F isher Scient i f ic � 23The Medicine Maker × Thermo F isher Scient i f ic �

Why use microwave digestion?
Chapter <233> recommends the use of closed-vessel microwave digestion to completely destroy and dissolve insoluble matrices. Microwave digestion systems, (Figure 5), are a popular choice to get insoluble samples into solution, because they are simple to use and can rapidly process many samples in parallel, which makes them ideally suited for high sample throughput pharmaceutical production environments [12].
Pressurized microwave digestion offers the best way to get samples into solution, because:
• Dissolution temperatures above the boiling point of the solvent can be achieved – which dramatically increases extraction efficiency.
• The oxidation potential of reagents is higher at elevated temperatures, which means digestion is faster and more complete.
• Under these conditions, concentrated nitric acid and/or hydrochloric can be used for the majority of pharmaceutical materials.
• Microwave dissolution conditions and parameters can be reproduced from one sample to the next.
• Safer for laboratory personnel, as there is less need to handle hot acids.
• Samples can be dissolved very rapidly.
• The digestion process can be fully automated.
• High sample throughput can be achieved.
• Hazardous fumes are contained.
Typically, 0.5g of sample is weighed into a plastic vessel along with appropriate acids. The contents of the vessel are then
sealed with a tight-fitting cap to create a pressurized environment. Once samples are digested, which typically takes 10–30 minutes, depending on the matrix, the resulting liquid is then transferred to a flask and diluted volumetrically using high-purity water.
Which acids?
The choice of acids used for the preparation of digested samples is also important. Typically concentrated nitric and/or hydrochloric acids are used in various ratios, depending on the sample type. The presence of hydrochloric acid is useful for stabilization of the platinum group elements, but can sometimes produce insoluble chlorides, particularly if there is any silver in the sample. The presence of chloride can also be detrimental when ICP-MS is the chosen technique as the chloride ions combine with other ions in the sample matrix and the argon plasma to generate polyatomic spectral interferences. Examples of this are the formation of the 40Ar35Cl polyatomic ion in the determination of 75As and the formation of 35Cl16O in the determination of 51V. These polyatomic interferences can usually be removed by the use of collision or reaction cell technology if the ICP-MS system offers that capability. The use of this technology can reduce sample throughput, due to stabilization times that have to be built into a multi-element method to determine analytes that require both cell and no-cell conditions.
Nitric acid and hydrogen peroxide are often used for the dissolution of organic matrices as they are both strong oxidizing agents that effectively destroy organic matter. However, care must be taken when testing for osmium as this can form volatile osmium oxides, which are easily lost from the sample. In some cases hydrofluoric acid (HF) may be needed to dissolve certain silicate-based
excipients and fillers that have been used in the final product. In cases where HF is required, plastic (PTFE) sample introduction components need to be used. Buffering agents such as boric acid may also be used to dissolve insoluble fluorides and neutralize excess HF. It should be emphasized that HF is a highly corrosive acid and extreme caution should be taken whenever it is used [13].
The more complex the sample preparation, the longer the analytical procedure will become, which will have a negative impact on the overall analysis time, particularly in a lab with a high sample workload. In addition, the sample preparation steps could potentially affect the overall TDS levels, so it is important to consider this when choosing a preparation method. There are published microwave digestion procedures that have been proven to be applicable for many types of pharmaceutical and nutraceutical materials [14].
Why dissolve samples?
Sample dissolution using acid digestion can add a significant amount of time to the overall analytical procedure. For that reason, it is important to fully understand the benefits of working with a solution, which include:
• Solid sampling techniques are notoriously prone to formulation inhomogeneity (distribution of the components is variable across the solid).
• Solution-based analysis takes a representative sample by collecting various drug doses (e.g., dozens of tablets) homogenizing
and diluting. Taking a single solid sample (e.g., one tablet) can produce erroneous results, as data may not be truly representative of the batch of samples.
• Measurements take a finite amount of time where the signal must stay constant – dissolving the sample and obtaining a clear solution is the best way to achieve signal stability.
It is also important to understand that the sample weight and final volume will be dictated by the expected impurity levels and TDS limitations of the instrumental technique being used. However, it is fair to say that if the dissolution technique
requires a microwave digestion system, it introduces a level of complexity, which needs to be addressed.
In addition, the dilution factor used in the sample preparation step will ultimately have an impact on the ability of the technique to detect the impurity levels. In many application examples, there will be a certain level of compromise between the digestion and dilution incurred during sample preparation and the resulting levels of trace metals and TDS in the final solution. You need to ensure that the instrument has sufficient matrix tolerance and sensitivity to accurately measure the prepared sample.
Figure 5. Microwave digestion system, CEM MARS6.
“Microwave digestion systems
are a popular choice to get insoluble
samples into solution, because
they are simple to use and can rapidly
process many samples in
parallel.”
24 The Medicine Maker × Thermo F isher Scient i f ic � 25The Medicine Maker × Thermo F isher Scient i f ic �

QC labs of pharmaceutica l manufacturers and pharmaceutical contract labs typically require high sample throughput capability, because of the large volumes of tests they have to perform on incoming raw materials and final products. With the increasing demand to analyze more and more samples, there are a number of vendors
designing automated sampling systems to maximize sample throughput, minimize sample preparation times and increase productivity, such as Figure 6.
In addition, there are also systems, like Figure 7, on the market that carry out automated dilutions, calibration/QC standard preparation, and additions of internal standards as well as performing on-line chemistry procedures [15].
Depending on the application requirements, there a number of different ways of doing this, including multiport/switching valves, loops, vacuum/piston/syringe pumps, mixing chambers and ion-exchange/pre-concentration
Figure 6. Auto-sampler - Teledyne CETAC Technologies ASX-560.
Figure 7. ESI prepFAST Auto-dilution system integrated to iCAP Q ICP-MS
27The Medicine Maker × Thermo F isher Scient i f ic �
columns. Some of the commonly used methods include:
• Achieving faster analysis times by optimizing sample delivery to the instrument.
• Performing on-line dilutions, internal standard additions and calibrations to save manual operations.
• Carrying out automated chemistry on-line to remove sample matrices and/or pre concentrate the samples to reduce interferences and minimize labor intensive, manual sample preparation steps.
• Let’s take a more detailed look at each of these approaches.
Fast sampling
Intelligent auto-samplers significantly reduce analysis times by optimizing the sample delivery process to reduce the pre- and post-measurement times. There are a number of these systems on the market, which work slightly differently, but all use piston/syringe/vacuum pumps, switching valves and loops to control the delivery of the sample and standards to and from the instrument. In addition to achieving significantly faster analysis times, other benefits of these systems include:
• Improved precision and accuracy due to on-line dilution and addition of internal standards
• Reduced carry-over• Longer lifetime of sample
introduction consumables • Constant flow of solutions reduces
plasma stabilization times • Smaller sample volume used • Lower argon consumption • Reduced cost of consumables • Less routine maintenance • Less chemical waste
There is no question that all these benef its can make a signif icant improvement in the overall cost of analysis, especially in high-workload pharmaceutical manufacturing and contract laboratories.
Fast, intelligent samplers and auto-diluters
A new range of automated sampling accessories have recently been developed. These accessories perform very precise and accurate in-line auto-dilutions
1. Vacuum load sample into loop
2. Syringes add internal standard and dilute sample into second loop
3. Diluted sample is injected and sample loop is cleaned
4. Sample and dilution loops are cleaned
Sample
Vacuum
Carrier
To iCap Q
S4: Internal standard
S2: Carrier
S3: Dilutent
Carrier
To iCap Q
Carrier
To iCap Q
Sample
Vacuum
S1: Rinse
WasteCarrier
To iCap Q
Figure 8. prepFAST operation steps, showing the shortest sample transfer distance reducing uptake delays to just a few seconds, thereby improving sample throughput.
How Can I Increase Productivity?
26 The Medicine Maker × Thermo F isher Scient i f ic � 27The Medicine Maker × Thermo F isher Scient i f ic �

and auto-calibration procedures using syringe/piston pumps (Figure 7). Samples are rapidly and reproducibly loaded from each auto-sampler location into a sample loop (Figure 8). From there the sample is injected into a diluent liquid stream and transported to a tee located between the valve and nebulizer. The internal standard is added in the tee to obtain final dilution factors defined by the operator. At the heart of the system is a syringe pump, which delivers the sample over a wide range flow rates to ensure rapid and reliable in-line dilutions. The benefits of fully automated in-line auto-dilution and auto-calibration for running Chapter <232>, <233> methodology includes:
• Auto-sampler can be loaded at the start of the run, so no additional tubes/reagents are required
• Use of one stock standard, means that multiple dilutions can be
carried out to optimize the calibration range for each sample type
• Eliminates time-consuming manual dilutions
• Reduces the errors associated with manual dilution steps
• Real-time dilutions of samples can be made if they are outside the calibration range
• No need for manual addition of internal standards
• Rapid sample uptake and washout maximizes throughput
• Automation and less operator involvement lowers risk of contamination
There is no question that use of an in-line auto-dilution and auto-calibration system significantly lowers the risk of human error, as well as contamination of the samples, standards, or blanks.
As a result, the approach is well-suited for the demands of a high-throughput pharmaceutical laboratory with inexperienced operators, by fully automating the labor-intensive steps of calibration, sample dilution, and the addition of internal standards.
Automatic system set-up and calibration
All analytical systems require some instrument set-up routines, warm up times, calibration and tuning. Correct set-up of systems can be conducted by skilled, experienced staff. Alternatively, there are systems capable of intelligent set-up routines that automate typically manual tasks each day before analyses are performed (Figure 9). This type of automation reduces time spent at the instrument and frees staff for other tasks in the laboratory.
“There is no question that use of an in-line auto-dilution and auto-calibration system significantly lowers the risk of human error, as well as contamination of the samples, standards, or blanks”
Get ready
Performance check
Auto tune
Corrective action (e.g. callibration)
Performance check
Performace OK
User action
Process queued labbooks
Export data
Compliant software
In addition to the requirements described in the USP documents, any ICP-OES or ICP-MS system used for the analysis of pharmaceutical materials must also comply with the FDA 21 CFR Part 11 regulations regarding electronic records and validation of electronic signatures. These regulations are concerned with ensuring the integrity and authenticity of any electronic records and electronic signatures that persons create, modify, maintain, archive, retrieve or transmit. Control software used by analytical instruments in pharmaceutical production must therefore incorporate tools to maintain the integrity of the analytical method and subsequent results. In order to provide a transparent pathway to data generation, the control
software should include support for audit trails and electronic signatures as well as security features to ensure that alterations cannot be made without a clear indication of what has been changed, who changed it and why. A complete review of regulatory issues in the pharmaceutical industry and solutions for compliance are available online [16].
Reporting
It is important to select a software that has incorporated reporting tools to enable automatic reporting of results in a format specifically for USP <232>, <233> validation. These calculations can be done on a spreadsheet. However, it is better to have this functionality inside the compliant, auditable, environment of the system software to avoid errors and simplify compliance audits.
System qualification
Specially designed qualification kits are
available to enable simple installation and operational qualification of your chosen system [17], these kits contain software qualification tools that allow qualification tests and reports to be prepared for you.
Tools for Regulatory Compliance
Figure 10. IQ/OQ system qualification kits.
“Microwave digestion systems are
a popular choice to get insoluble samples into solution, becausethey are simple to use
and can rapidly process many samples
in parallel.”
28 The Medicine Maker × Thermo F isher Scient i f ic � 29The Medicine Maker × Thermo F isher Scient i f ic �
SummaryThe objective of this primer is to educate the pharmaceutical and nutraceutical manufacturing communities on the new USP methods and ICH guidelines on elemental impurities in pharmaceutical materials and dietary supplements. In particular, we aimed to give less experienced personnel, who are not familiar with the terminology used in USP & ICH documentation, some suggestions about the best analytical techniques and procedures to use.
We hope we have delivered on this aim, but we strive to continue to update our customers on the changing tides of regulatory methods and technically innovations. So please don’t forget to check out our pharmaceutical QA/QC community web pages to keep up to date with the latest information.
www.thermoscientific.com/usp232
Acknowledgements
We would like to thank a number of our strategic partners – Robert Thomas, CEM Corporation, Teledyne CETAC Technologies, and Elemental Scientific Inc. – for their valuable assistance in preparing this primer.
References1. United States Pharmacopeia General Chapter <231> Heavy Metals Test in USP National Formulary (NF): Second Supplement to USP 37–NF 32, 2014. 2. "USP Elemental Impurities Website: Key Issues," [Online]. Available: http://www.usp.org/usp-nf/ key-issues/elemental-impurities.3. "European Medicines Agency (EMA) Guideline on the Specification Limits for Residues of Metal Catalysts," [Online]. Available: http://www.ema.europa.eu/ema/index. jsp?curl=pages/regulation/general/general_ content_000356. jsp&mid=WC0b01ac0580028e8c.4. "United States Pharmacopeia Update Communication, January 14, 2015," [Online]. Available: http://www.usp.org/ usp-nf/key-issues/elemental-impurities.5. "ICH Q3D Step 4 - Guideline for Elemental Impurities," [Online]. Available: http://www. ich.org/fileadmin/Public_Web_Site/ICH_ Products/Guidelines/Quality/ Q3D/Q3D_Step_4.pdf.6. "United States Pharmacopeia General Chapter <232> Elemental Impurities in Pharmaceutical Materials – Limits: Second Supplement to USP 37–NF 32, December, 2014," [Online]. Available: http://www.usp.org/usp-nf/ development-process/ publication-comment-schedule.7. "USP General Chapter <730> Guidelines on Plasma Spectrochemistry: : Second Supplement to USP 37–NF 32, December, 2014," [Online]. 8. "USP General Chapter <211>: Determination of Arsenic (As)," [Online]. 9. R. Thomas, Practical Guide to ICP-MS: A Tutorial for Beginners, 3rd Edition, Boca Raton. FL: CRC Press, 2013. 10. "Multi-element determination in pharmaceutical preparations using the Thermo Scientific iCAP Q ICP-MS," [Online]. Available: http://www. thermoscientific.com/content/dam/tfs/ATG/ CMD/cmd-support/icap/applicationnotes/ AN43143_E%2003-13C%20 ICP-MS%20Pharma.pdf.11. G. Lecornet, "Analysis of elemental impurities in drug products using the Thermo Scientific iCAP 7600 ICP-OES Duo," [Online]. Available:
http://www.thermoscientific.com/content/dam/ tfs/ATG/CMD/cmd-support/icap/ applicationnotes/Analysis%20 of%20elemental%20impurities%20 in%20drug%20products%20using%20 the%20Thermo%20Scientific.pdf.12. C. Corporation, "CEM Solutions for USP Chapters <232> and <233>," [Online]. Available: http://cem.com/content978.html.13. "The National Institute for Occupational Safety and Health (NIOSH): Safe Use of Hydrogen Fluoride and Hydrofluoric Acid," [Online]. Available: http://www.cdc.gov/niosh/ ershdb/emergencyresponsecard_29750030.html.14. C. Corp., "Microwave Digestion of Pharmaceutical Samples Followed by ICP-MS Analysis for USP Chapters <232> and <233>," [Online]. Available: https://cem.sharefile. com/download.aspx?id=sc6d12fed0084ab4b#.15. J. D. Wills, "Automated, Intelligent Sample Preparation: Integration of the ESI prepFAST Auto-Dilution System with the Thermo Scientific iCAP Q ICP-MS," [Online]. Available: http://www. thermoscientific.com/content/dam/tfs/ ATG/CMD/cmd-documents/sci-res/ app/ea/icp-ms/TN-43208-ICP-MS-ESI- prepFAST-iCAPQ-TN43208-EN.pdf.16. T. Scientific, "Qtegra Intelligent Scientific Data Solution (ISDS) for 21 CFR Part 11 Compliant Laboratories," [Online]. Available: http://www.thermoscientific.com/content/ dam/tfs/ATG/CMD/cmd-support/icap-q/ manuals-and-instructions/technical-bulletins/ Thermo-Scientific-Qtegra-Intelligent-Scientific- Data-Solution-ISDS-for-21-CFR-Part-11.pdf.17. D. Kutscher, "Easy and Rapid System Quantification using the iCAP Series Qualification Kit," [Online]. Available: http://www.thermoscientific.com/content/ dam/tfs/ATG/CMD/cmd-documents/oper/ iq-oq-pq/ea/icp-ms/TN43172-Pharma-IQ- OQ-Qualification-Kit- iCAP-Q-iCAP-Series.pdf.18. "United States Pharmacopeia (USP) and The National Formulary (NF) Online (USP-NF)," [Online]. Available: www.usp.org/usp-nf.
30 The Medicine Maker × Thermo F isher Scient i f ic �
© 2
015
Ther
mo
Fish
er S
cien
tifi c
Inc.
All
right
s re
serv
ed. A
ll tr
adem
arks
ar
e th
e pr
oper
ty o
f The
rmo
Fish
er S
cien
tifi c
Inc.
and
its
subs
idia
ries.
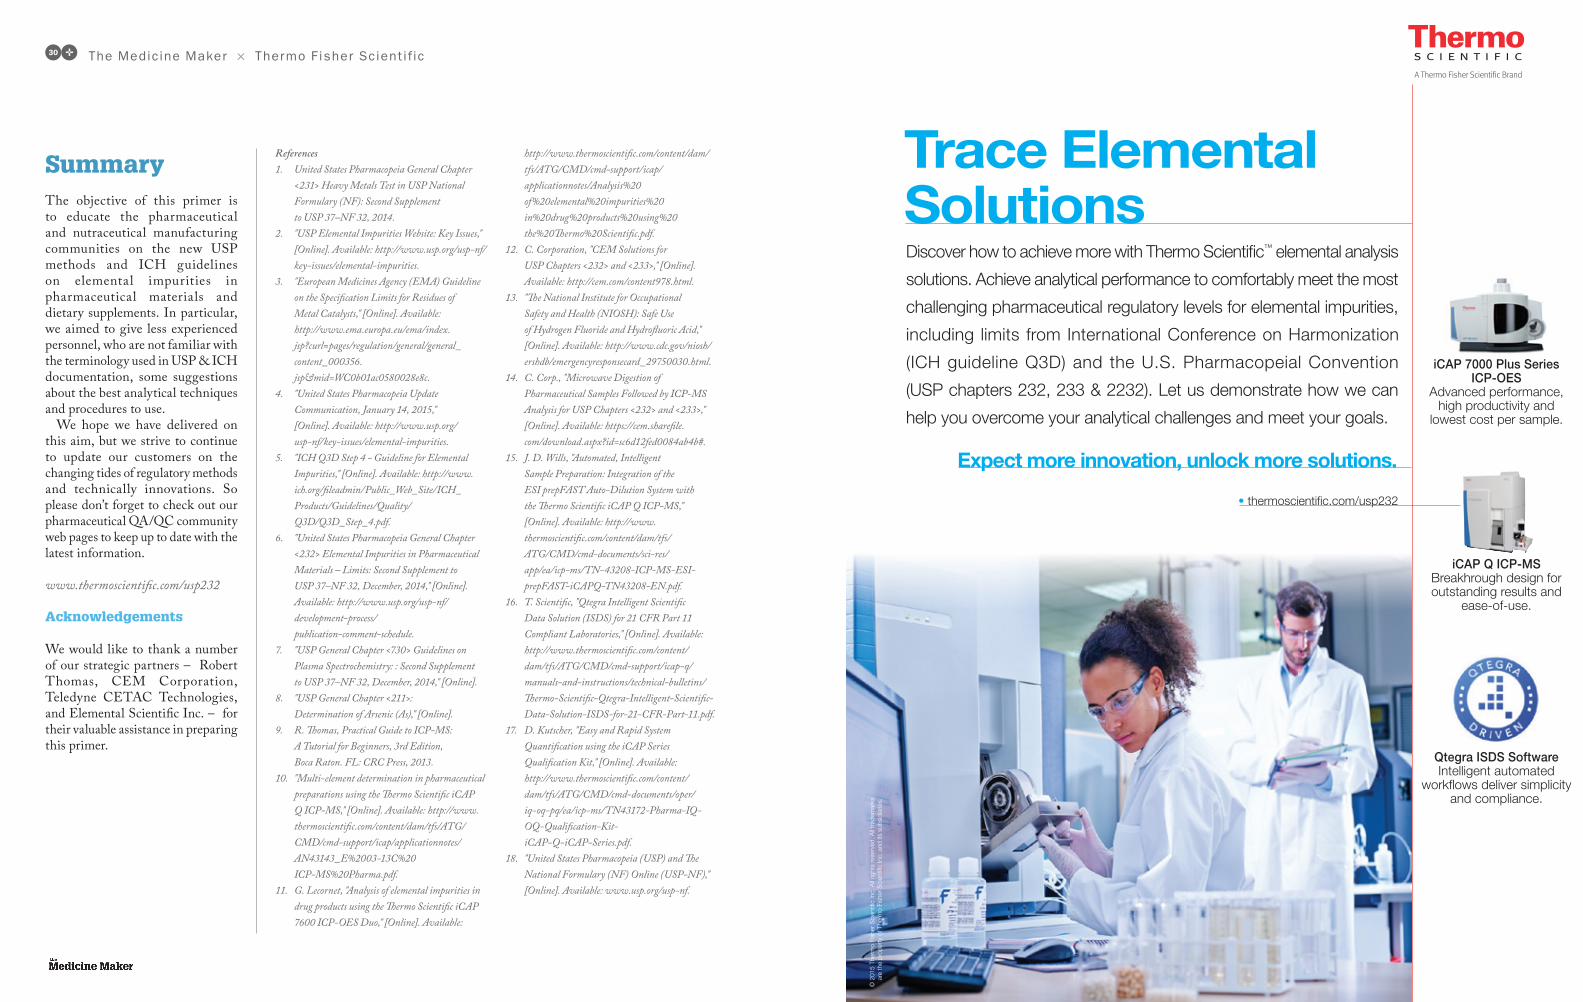
Trace Elemental Solutions Discover how to achieve more with Thermo Scientifi c™ elemental analysis
solutions. Achieve analytical performance to comfortably meet the most
challenging pharmaceutical regulatory levels for elemental impurities,
including limits from International Conference on Harmonization
(ICH guideline Q3D) and the U.S. Pharmacopeial Convention
(USP chapters 232, 233 & 2232). Let us demonstrate how we can
help you overcome your analytical challenges and meet your goals.
• thermoscientifi c.com/usp232
Expect more innovation, unlock more solutions.
iCAP 7000 Plus Series ICP-OES
Advanced performance, high productivity and
lowest cost per sample.
Qtegra ISDS SoftwareIntelligent automated
workfl ows deliver simplicity and compliance.
iCAP Q ICP-MSBreakhrough design for outstanding results and
ease-of-use.
111782 TEA Pharma Advert stg-1.indd 1 27/07/2015 16:44

©2015 Thermo Fisher Scientific Inc. All rights reserved. prepFAST is a trademark of Elemental Scientific. MARS is a trademark of CEM Corporation. All other trademarks are the property of Thermo Fisher Scientific and its subsidiaries. This information is presented as an example of the capabilities of Thermo Fisher Scientific products. It is not intended to encourage use of these products in any manners that might infringe the intellectual property rights of others.