determining physical and chemical properties of canebrakes
TRANSCRIPT

Determining Physical and Chemical Properties of Canebrakes in western North Carolina Senior Thesis
Katie McDowell
Abstract Development and agriculture has severely impacted native river cane (Arundinaria gigantea) habitat. The Eastern Band of Cherokee Indians (EBCI), who use river cane for native crafts, are now concerned about the future of the species. Therefore, Western Carolina University (WCU) and the EBCI have initiated a River Cane Restoration Project. This study is a small portion of the restoration effort, focusing on the soil physical and chemical properties across one river cane floodplain. Chemical analyses of the macro and micronutrients (Ca, Mg, K, P, Zn, Cu, Mn & Fe) were performed on both bulk and grain sized separated portions of six samples across the floodplain. Nutrient content varied across the floodplain, peaking 30 meters from the channel. The macronutrients had a clear preference for the clay sized particles, and the micronutrients had a more variable distribution between silt and clay. Moderate positive correlations were also found between percent silt plus clay and macronutrient concentrations, and only weak correlations with micronutrients. 1. Introduction 1.1 Project Significance Native river cane (Arundinaria gigantea) was once a vital part of riparian ecosystems throughout the southeastern states. Prior to European settlement, dense monotypic patches of river cane called “canebrakes” covered floodplains of rivers and streams throughout the region. Agricultural development, such as the construction of pastures and crop fields, has been the primary factor in the destruction of A. gigantea habitat (Platt and Brantley, 1997). According to historical studies conducted by Noss et al. (2001), canebrakes are endangered and less than 2% of the original distribution remains. Interest in the conservation of river cane has grown throughout western North Carolina (WNC), as well as throughout the southeastern U.S. Canebrakes provide habitats for a variety of wildlife including species of birds, mammals and reptiles (Platt et al., 2001). Dense stands of cane can act as buffers, filtering and removing contaminants, nutrients and sediments (Schoonover et al., 2006). The complex network of rhizomes (underground horizontal roots) that river cane produces may be efficient at bioaccumulating nutrients and toxins, retaining sediments, and stabilizing streambanks (Lee et al., 2003; Welsh, 1991; Geyer et al., 2000). Locally, the awareness about canebrake destruction has been heightened by Native Americans, specifically the Eastern Band of the Cherokee Indians (EBCI). Culms (cane stalks) need to be approximately 2 cm in diameter or greater for traditional artisan crafts that use cane, such as basket and blowgun making. However, much of river cane that persists today is not of proper size for these crafts. Therefore, the EBCI has suffered a huge cultural loss due to the diminishing stands of A. gigantea. Currently, Western Carolina University (WCU) is partnered with the EBCI in a River Cane Restoration Project. 1.2. Canebrake Ecology A. gigantea, a member of the grass family Poaceae, is a native monopodial bamboo commonly found along floodplains of rivers and streams below 760-m in elevation. River cane is often a part of the understory beneath a variety of deciduous and evergreen forest types. Culms grow upright from an intricate and compact system of rhizomes found within the first 15-30 cm
1

of soil. Historical records indicate that culms may have reached up to 12 m in height and 0.1 m in diameter (Michaux, 1889; Stoddard, 1812; Lyell, 1849). Recently, however, the largest culms reported range from 4.5-6 m in height and up to 0.03 m in diameter (Platt et al., 2001). 1.3. Past Research on River Cane One study in southern Illinois tested forested riparian zones and canebrakes for their potential to filter nitrate from runoff. Both were adequate riparian buffers, however, canebrakes filtered the water in substantially shorter distances (3.3 m compared to 6.6 m). Leaf litter, high infiltration rates and stem density all contributed to this filtration (Shoonover et al., 2003). Blattel et al. (2003) focused on the sequestration of phosphates in both mixed hardwood and river cane riparian buffer zones. Both zones decreased the concentration of dissolved reactive phosphates (DRP) in the groundwater at a distance of 1.5 m into the buffer zones. However, there was no significant difference in the amount of DRP sequestered between the two types of riparian zones. Streambank erosion is a natural process that can be accelerated by numerous factors. One important control on erosion rate is the amount and type of bank vegetation. Woody vegetation proved to be the most effective riparian type for protecting streambanks from erosion in a study of a 1993 flood in central Kansas (Geyer et al., 2000). According to Dattilo et al. (2003), woody perennial grasses are efficient at providing streambank stability because of their dense rhizomes, quick growth and ability to re-sprout. River cane is present in variety of sediment, light and moisture conditions. However, some conditions are more conducive for the formation of large canebrakes. Cirtain et al. (2004) experimented with controls on the growth and propagation of A. gigantea. Moisture was the major controlling factor on cane growth. Well drained sites (watered daily with 13.2% average moisture content) proved to be more conducive for plant growth than flooded sites (2-day saturated, 5-day well drained cycles). Although A. gigantea is categorized as a facultative wetland species by the USDA plant database (2007), poorly drained soils had much less shoot growth than the well drained soils. Past research (Cirtain et al., 2003) has shown that available light is also an important variable. Most canebrakes are located under thin or no canopy cover and not under full forest canopies. 1.4. Nutrient Importance Soil nutrients are essential for plant growth, development and reproduction. If nutrients, sunlight and water are present in sufficient amounts, plants can create all the compounds needed for typical development (Epstein and Bloom, 2005). Past research focuses on moisture, nitrogen fertilization and light as controls on river cane growth, but fails to specifically address the relationship between grain size and soil nutrients. Several studies look at the ability of canebrakes to remove nitrate and phosphate (Cirtain et al., 2004); however, it is unclear if either is limiting at river cane sites. The larger River Cane Restoration project is looking at the variability of soil characteristics across numerous canebrakes in western North Carolina. However, to understand all the elements that might be controlling the placement and growth of river cane on a particular floodplain, a more intense look at the characteristics of the soil across one site is needed. 1.5. Nutrient Sources Macronutrients (Ca, Mg and K) are commonly available to plants as exchangeable cations (Ca 2+, Mg 2+ and K +). These cations provide an immediate source of nutrients for plants, but some insoluble sources may exist. These can include calcium and magnesium carbonates, potassium feldspars and an interlayer of K+ in micaceous clays (White, 2006).
2

Bedrock in the study area is commonly gneissic, containing an abundance of feldspars and micas. Besides the weathering of these rocks and minerals, macronutrients can also be sourced from precipitation, dry deposition, and the mineralization of organic matter (White, 2006). Many nutrients such as Ca, Mg, and K also have anthropogenic sources such as agricultural fertilizers (North Carolina Department of Agriculture, 2006). Micronutrients, such as Cu, Mn and Fe, are generally derived from parent materials, such as ferromagnesian minerals and basic igneous rocks (White, 2006). Ferromagnesian minerals include olivine, pyroxene, amphibole and biotite, all which can be found in the region. 1.6. Nutrients and Grain Size Correlations Nutrients are commonly available to plants in ion form, either in soil solution or adsorbed to the soil particles (White, 2006). Smaller sediments, such as clays, have high specific surface areas, and therefore have more locations for adsorption of molecules and ions. Clays also have a permanent negative charge, which can attract cations such as Ca 2+, Mg 2+ and K+. These factors control the potential for adsorption onto a particle, or Cation Exchange Capacity (CEC). The higher the CEC, the more likely cations will be adsorbed to the surface. Generally, clays have high CEC values, but values vary between different clay minerals. Kaolinites and Illites, for example, have fairly low values, while Smectites and Vermiculites have high CEC values (White, 2006). Previous studies have shows that nutrients and other contaminants are often concentrated in finer grained soils. Nitrogen and sulfur have repeatedly shown positive correlations with percent clay in wetland zones (Zhou et al., 2007; Bai et al., 2005) as well as in riparian zones (Steiger and Gurnell, 2002). A study of the Garonne River in France (Steiger and Gurnell, 2002) reported a strong positive correlation (R2=0.85) between the percent silt plus clay and the concentration of total nitrogen, but had no significant correlation with total phosphorous. However, Andrieux-Loyer and Aminot (2001) found that both Fe and Al were positively correlated with percent fine material, as was the phosphorous bound to these elements. Other elements have also been studied for correlation with fine textured particles. Martin (2004) found only weak correlations between metal concentrations (Cu, Zn, Cd, and Pb) and percent clay. These studies show that element concentrations are dependent to a limited extent by sediment texture and size. However, other factors may also strongly influence the variation in concentration across floodplains. For example, factors such as parent material composition, distance from the active channel, amount of atmospheric deposition and distance from upslope sources also play important roles in this distribution (Martin, 2004; Brewer and Taylor, 1997; Middlekoop, 2002). Finer grained sediments usually increase away from the channel, creating a fining outward sequence. Because nutrients are commonly associated with these sediments, we would expect the nutrient gradient to follow this trend and increase across the floodplain. This Senior Thesis will comprise a small portion of the overall River cane Restoration Project. The following hypotheses are proposed for the river cane sites: a) soil nutrient levels are related to sediment grain size and b) there is a nutrient gradient across the floodplain. 2. Study Site 2.1. Study Area The study area is in the Southern Appalachian Mountains of western North Carolina and within the northwest corner of Jackson County (Figure 1). Elevations in Jackson County range from approximately 600-1950 meters (North Carolina Department of Agriculture, 2006).
3

Jackson County is within the Tuckasegee River watershed and topography ranges from flat on large floodplains to almost vertical along the steep mountainsides. Land use is highly variable due to the mountainous terrain.
Figure 1. Study area within the southeastern U.S. as well as Jackson County, NC.
2.2. Sampling Site Jack O runs between the Tuckasegee River and U.S. West Highway 74 in Whittier, NC (Figure 2). This section of the Tuckasegee drains about 580 km2 and has a mean annual discharge of approximately 270 m3 s-1 (NWIS USGS, 2005-2006). The site is at approximately 585 m in elevation and the cane brake is 55 m wide and 100 m long.
4
Figure 2 (bottom) Transect location on an IR image, between the Tuckasegee River and US Highway 74. The point closest to the river is 0 m.

We sampled along a 52 m transect running perpendicular to the stream flow of the Tuckasegee River, cutting across Jack O (Figure 2). The 0-m position is on the bank of the river, on a 1.5 m high steep incline (Figure 3). The cane is growing as a dense forest next to the Tuckasegee, but becomes sparse at the 30-m position (Figure 5), and ends approximately 34 m from the channel. From this point, little to no cane grows, and at 48 m the soil becomes increasingly saturated due to slow moving water from a small road drainage pipe. At the 52-m (Figure 6) interval, the core was completely saturated directly below the ground surface. Species composition varies depending on the position along the transect. A. gigantea is the primary understory species from 2 m to 28 m beneath trees such as Sycamore (Plantanus occidentalis) and Black Walnut (Juglans nigra). The second section of the transect (30 m +) contains numerous species of trees, shrubs, grasses and even invasives such as Japanese Honeysuckle (Lonicera japonica).
0 m 2 m
30 m 52 m
Figure 3 (top left) shows the 0-m position, looking up from the river. Figure 4 (top right) shows the 2-m position on the levee. Figure 5 (bottom left) shows the sparse cane at 30 m. Figure 6 (bottom right) shows the 52-m position and approximate location of the drainage pipe (in red).
5

3. Methods and Materials 3.1. Field Data Collection A bucket auger was used to take samples at 2 m intervals along the 52 m transect. The samples included the top 30 cm of soil, the approximate rooting depth of river cane, and had dry weights of 400-750 grams each. The first core (0-m) was retrieved directly next to the river, and the last (52-m) was taken near the slope bank next to the highway. All of the samples were bagged and returned to the laboratory. Six samples (0 m, 12 m, 20 m, 30 m, 40 m & 52 m) were used for further chemical analyses. Soil profile characterizations were completed every 4 m along the transect to a depth of 1 m. These included textural measurements, such as Munsell color and soil type of the horizons. A Dutch auger was used to retrieve these samples and the soil characterizations were completed on site (Figure 7). 3.2. Particle Size Analysis Soil samples were dried at 60° C for several days. Macroscopic organic matter, including coarse root material and plant litter, was set aside and weighed separately. Mortar and pestle was necessary to break up soil aggregates formed in the drying oven. Grain size analysis was performed on a portion of each sample using a standard six sieve set and RO-TAP devices (screen sizes of: > 2 mm, 1-2 mm, 0.5-1 mm, 0.25-.05 mm, 0.125-0.25 mm, 0.063-0.125 mm and <0.063 mm). The mass of each grain size was recorded and calculations of percent finer and percent of total were carried out. The finest material (<0.063 mm), as well as a portion of the bulk material were removed for further analyses. The <0.063 mm grain size portion was further separated into two sizes by repeated centrifugation. This method uses Stokes Law and settling velocities to divide grains by particle diameter. For this study, a centrifuge (Fisher Centrific* Model 225A) with a 45° fixed angle rotor, holding twelve 15-ml tubes was run at a speed of approximately 2200 rotations per minute (RPM) for 65 seconds. The centrifugation split the material at approximately 0.02 mm in diameter. The particles that that were still entrained after the 65 seconds (<0.02 mm) are referred to as clay and particles that were settled at the base of the tubes are referred to as silt (>0.02 mm). Centrifugation began with splitting the fine grained samples into sections with masses of approximately 5-7 grams each. These smaller samples were placed into the 15-ml centrifuge tubes and filled with deionized (DI) water. Prior to centrifugation, each tube was shaken manually and with a reciprocal shaker to ensure even distribution of the particles. The samples were run for 65 seconds multiple times (3-5) and were re-shaken between each cycle. After the samples were centrifuged, the fluid containing suspended clay particles was poured off into beakers and the silt was removed using additional DI water. After this fractionation, the different particle-size fractions were dried at 60° C. 3.3. Nutrient Analysis Chemical analysis was done on the silt, clay and bulk portions at each of the six intervals across the floodplain. All samples were manually split using a standard device, and sample duplicates were analyzed to calculate sub-sample differences. Run duplicates were also carried out by running the same sample multiple times. The Mehlich III method (Mehlich, 1984) was used to extract the bio-available portion of the following micro and macronutrients: K, Ca, Mg, Mn, Zn, Fe, and Cu. Atomic-Absorption Spectroscopy (AA) was used to determine K concentrations. Inductively Coupled Plasma- Atomic Emission Spectroscopy (ICP-AES) was used to determine concentrations for the remaining nutrients. Coefficients of variation for both
6

sub-sample duplicates as well as run duplicates were calculated for the elements at each location. Zn and Cu had extremely high values, but this can be attributed to concentrations that were near the lower detection limit of the ICP-AES. Overall, there was a 17.4% coefficient of variation for the sample duplicates, and a 7.1% coefficient of variation for the run duplicates (excluding Zn and Cu, Table 2). 4. Results 4.1. Site Soil Characterizations Six of the soil profile characterizations are reported in Figure 7. Most of the profiles were loamy, but soil textures ranged from loose sandy loam near the stream to silty clay 20 m away from the channel. Most of the Munsell soil hues were either 7.5 YR or 10 YR, with the exception of the profiles near the pipe at the 52-m position. These soils became much more saturated and had a Munsell hue of 2.5 Y.
0.0 m 20.0 m 32.0 m 40.0 m 48.0 m 12.0 m
Loam7.5 YR 3/4
Sandy loam7.5 YR 3/3
Loamy Sand7.5 YR 4/3
LostLikely Sand
Loamy Sand 7.5 YR 4/4
Loam7.5 YR 3/4
Sandy loam7.5 YR 3/3
Loamy Sand7.5 YR 4/3
LostLikely Sand
Loamy Sand 7.5 YR 4/4
Silt Clay7.5 YR 4/4
Silt Clay Loam7.5 YR 4/4
Silt Loam7.5 YR 3/4
Silt Clay Loam7.5 YR 3/3
LostLikely Sand
Loam 7.5 YR 3/3
Silt Clay7.5 YR 4/4
Silt Clay Loam7.5 YR 4/4
Silt Loam7.5 YR 3/4
Silt Clay Loam7.5 YR 3/3
LostLikely Sand
Loam 7.5 YR 3/3
Loam7.5 YR 3/3
Clay Loam10 YR 3/3
Clay Loam10 YR 3/4
Could Not Reach
Loam7.5 YR 3/3
Clay Loam10 YR 3/3
Clay Loam10 YR 3/4
Could Not Reach
Loam7.5 YR 3/3
Clay Loam10 YR 3/6
Clay Loam10 YR 3/3
Could Not Reach
Loam7.5 YR 3/3
Clay Loam10 YR 3/6
Clay Loam10 YR 3/3
Could Not Reach
Loamy Sand 10 YR 3/6
Loam 10 YR 3/3
Loam 2.5 Y 4/3
Loamy Sand2.5 Y 4/2
Loam10 YR 4/2
Clay Loam2.5 Y 3/2
Could Not Reach
Loamy Sand 10 YR 3/6
Loam 10 YR 3/3
Loam 2.5 Y 4/3
Loamy Sand2.5 Y 4/2
Loam10 YR 4/2
Clay Loam2.5 Y 3/2
Could Not Reach
Silt Clay7.5 YR 4/4
Silt Clay Loam 7.5 YR 4/4
Silt Clay Loam 7.5 YR 3/2
Mottling of 7.5 YR 4/4
Silt Clay Loam 7.5 YR 3/2
Lost
Silt Clay7.5 YR 4/4
Silt Clay Loam 7.5 YR 4/4
Silt Clay Loam 7.5 YR 3/2
Mottling of 7.5 YR 4/4
Silt Clay Loam 7.5 YR 3/2
Lost
UP
Figure 7. Soil Profile characterization across the floodplain, red indicates ground surface
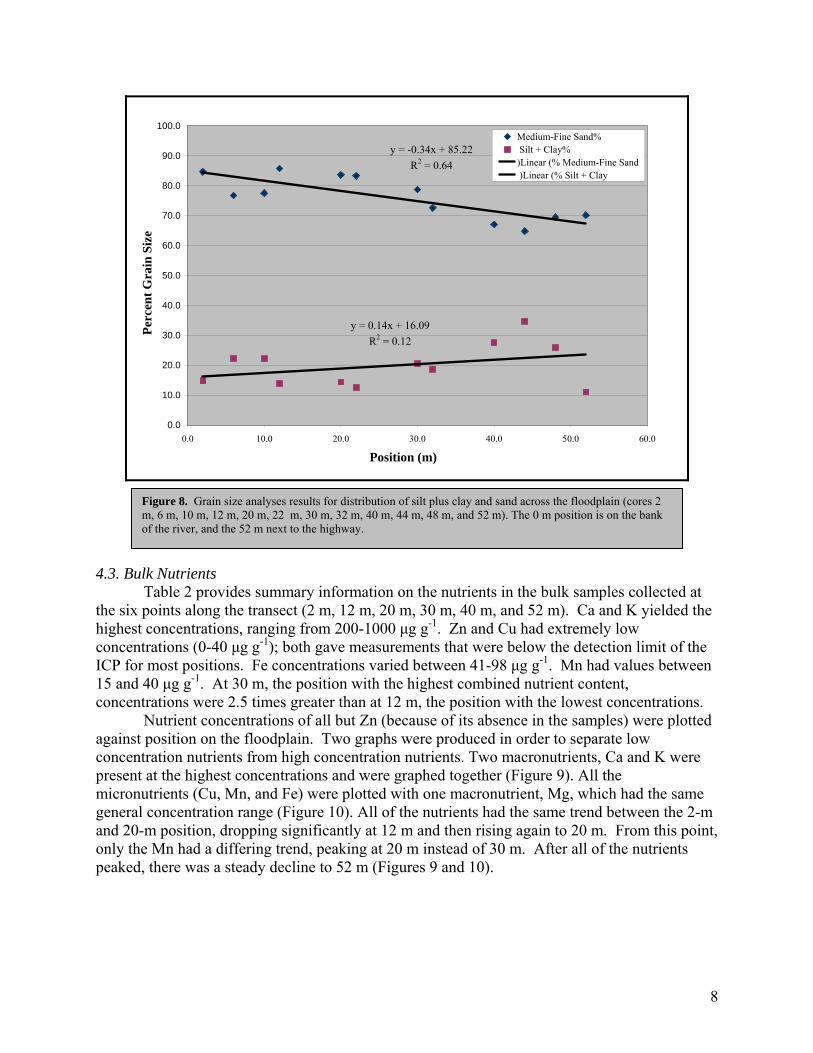
4.2. Grain Size Percent of each grain size was determined for twelve positions along the transect (Table 1). For most locations, the 0.125-0.25 mm sand fraction yielded the highest overall percentage (27-50 %). All of the samples had little to no large grain sizes (> 1 mm). Major trends across the floodplain are shown with the plot of percent sand and percent silt plus clay versus position (Figure 8). The three finest sand fractions (0.5 mm-0.063 mm) were used for the percent sand calculations and the finest portion (< 0.063 mm) was used for the silt plus clay fraction. The sand fraction had a moderate negative correlation (R2 = 0.64) with position on the floodplain. The percent of silt plus clay was more variable across the floodplain, but did have a slight positive correlation (R2 = 0.12, Figure 8).
7
y = -0.34x + 85.22R2 = 0.64
y = 0.14x + 16.09R2 = 0.12
0.0
10.0
20.0
30.0
40.0
50.0
60.0
70.0
80.0
90.0
100.0
0.0 10.0 20.0 30.0 40.0 50.0 60.0
Position (m)
Perc
ent G
rain
Siz
e Medium-Fine Sand% Silt + Clay% )Linear (% Medium-Fine Sand )Linear (% Silt + Clay
Figure 8. Grain size analyses results for distribution of silt plus clay and sand across the floodplain (cores 2
m, 6 m, 10 m, 12 m, 20 m, 22 m, 30 m, 32 m, 40 m, 44 m, 48 m, and 52 m). The 0 m position is on the bank of the river, and the 52 m next to the highway.
4.3. Bulk Nutrients Table 2 provides summary information on the nutrients in the bulk samples collected at the six points along the transect (2 m, 12 m, 20 m, 30 m, 40 m, and 52 m). Ca and K yielded the highest concentrations, ranging from 200-1000 μg g-1. Zn and Cu had extremely low concentrations (0-40 μg g-1); both gave measurements that were below the detection limit of the ICP for most positions. Fe concentrations varied between 41-98 μg g-1. Mn had values between 15 and 40 μg g-1. At 30 m, the position with the highest combined nutrient content, concentrations were 2.5 times greater than at 12 m, the position with the lowest concentrations. Nutrient concentrations of all but Zn (because of its absence in the samples) were plotted against position on the floodplain. Two graphs were produced in order to separate low concentration nutrients from high concentration nutrients. Two macronutrients, Ca and K were present at the highest concentrations and were graphed together (Figure 9). All the micronutrients (Cu, Mn, and Fe) were plotted with one macronutrient, Mg, which had the same general concentration range (Figure 10). All of the nutrients had the same trend between the 2-m and 20-m position, dropping significantly at 12 m and then rising again to 20 m. From this point, only the Mn had a differing trend, peaking at 20 m instead of 30 m. After all of the nutrients peaked, there was a steady decline to 52 m (Figures 9 and 10).
8

0.0
100.0
200.0
300.0
400.0
500.0
600.0
700.0
800.0
900.0
1000.0
2.0 12.0 20.0 30.0 40.0 52.0
Position (m)
Nut
rien
t Con
tent
(ug
elem
ent/g
ram
soil)
Ca
K
0.0
20.0
40.0
60.0
80.0
100.0
120.0
2.0 12.0 20.0 30.0 40.0 52.0
Position (m)
Nut
rien
t Con
tent
(ug
elem
ent/g
ram
soil)
CuFeMgMn
4.4. Silt & Clay Nutrients The clay fraction of the macronutrients (Ca, Mg and K) had much higher concentrations than the silt portions, with the exception of Ca and Mg at 20 m and 40 m. Even here the silt has only slightly higher concentrations than the clay. Overall, the macronutrients had concentrations more than 1.5 times higher in the clay portions than in the silt portion (Figure 11). The micronutrients had more variable silt and clay concentrations. With the exception of 2 m, all of the locations had at least one micronutrient concentration that was higher in the silt. Again, the 20-m and 40-m positions contained the most nutrient concentrated silt and at these points, and Cu, Fe and Mn all displayed the same trend (Figure 12).
0
200
400
600
800
1000
1200
1400
1600
1800
2 12 20 30 40 52
Position (m)
Nut
rient
con
tent
(ug
elem
ent/g
ram
soi
l) Ca Clay Ca Silt
Mg Clay Mg Silt
K Clay K Silt
0
50
100
150
200
250
300
350
400
450
2 12 20 30 40 52
Position (m)
Nut
rient
Con
tent
(ug
elem
ent/g
ram
soi
l)
Cu Clay Cu Silt
Fe Clay Fe Silt
Mn Clay Mn Silt
Figures 11 & 12. Nutrient content for the macronutrients (Ca, Mg, and K) and micronutrients (Cu, Fe and Mn) in the clay and silt portions.
Figures 13 and 14 show the correlation between nutrient concentrations and percent silt plus clay. The percent silt plus clay showed a moderate positive correlation (R2 = 0.38-0.59) with macronutrients (Figure 13). A weak positive correlation (R2 = 0.16-0.21) was found between silt plus clay and the micronutrients (Figure 14).
9

R2 = 0.39
R2 = 0.59 R2 = 0.41
0.00
5.00
10.00
15.00
20.00
25.00
30.00
0.0 100.0 200.0 300.0 400.0 500.0 600.0 700.0 800.0 900.0 1000.0
Nutrient Concentrations (ug element/gram soil)
Perc
ent S
ilt +
Cla
y
CaMgK)Linear (Ca)Linear (Mg)Linear (K
R2 = 0.16 R2 = 0.21
0.0
5.0
10.0
15.0
20.0
25.0
30.0
0.0 20.0 40.0 60.0 80.0 100.0 120.0 140.0
Nutrient Concentrations (ug element/gram soil)
Perc
ent S
ilt +
Cla
y
FeMn)Linear (Mn)Linear (Fe
Figures 13 & 14. Scatter plots and best-fit regressions of percent silt plus clay and nutrient concentrations for Ca, Mg, K and Fe and Mn, with associated R2 values.
5. Discussion 5.1. Sediment characteristics The most distinct change in this transect is the presence of low chroma soil at the non- river cane inhabited 48.0 m position (Figure 7). These cores were completely saturated at sampling time and hydric soils were present. The USDA plant database (2005) lists A. gigantea as a facultative wetland species, but no cane was present where these soils were located. In addition, none of the canebrakes inventoried thus far have been found on histosols, and observations indicate that river cane often ends where these soils begin. Most alluvial systems display similar soil textural patterns moving across the floodplains. When rivers flood, water is carried onto the floodplain and the coarse material is deposited first near the levee, with the finer material settling out further from the channel. This process produces a fining outward sequence for the surface sediments. Our transect showed percent sand decreasing across the floodplain, in agreement with this model. Percent fine material was more variable, especially in the furthest points from the channel. However, both the 48-m and 52-m positions were close to the highway, which may be in part responsible for the major reverse trends in sand, silt and clay percentages (Figure 8). Silt and clay drops significantly at these locations, and sand increases. These locations could have been anthropogenically altered. For example, the locations next to the road may have additional fill on the surface from the road construction. Also, a pipe drains next to these samples that could bring in foreign sediment. The road itself could also have an affect on the variable grain sizes at these locations. 5.2. Nutrient Patterns The geomorphology of this system likely plays a role in the nutrient distribution across the floodplain, as all of the nutrients have the same general trend. Nutrient concentrations were greater next to the channel than at the next sampling point (12 m), which could be explained by additional nutrients coming from the river. Nutrient distribution vaires within the dense portion of the canebrake, decreasing from 2 m to 12 m, and then increasing again at 20 m. Most of the nutrients are at their maximum concentrations at the 30-m interval. At this location the canebrake becomes less dense and the canopy becomes open, allowing for other understory species to grow. Also, the sample was at a slightly lower elevation, in a depression at the base of an atypical ridge running at an angle across the floodplain. Because leaves and organic matter
10

often accumulates in these depressions, the spike in nutrients at the 30-m position could partly be explained by the additional surface organics leaching nutrients into the soil. By the 40-m and 52-m positions, there is little to no cane, more saturated soils, and much lower nutrient concentrations. These lower concentrations could be explained by the anomalous increase in grain size at 52-m position. Also, nutrients can become more mobile in reducing conditions (which is likely the case at 52 m), allowing for nutrient flushing from the soil. 5.3. Nutrient-grain size relationships Macronutrients often show correlations with clay sized deposits, due to the high surface area, negative surface charges of clay minerals, and high CEC values (White, 2006; Gerrard, 2001). The results from this study indicate that these macronutrients (Ca, Mg, and K) have a clear preference for the clay sized particles along the transect (Figure 11). Percent silt plus clay also showed moderate correlations with the nutrient levels for the macronutrients (Figure 13), indicating that the silt and clay fractions hold a large portion of the plants’ available nutrients. This study is consistent with previous work showing that clay content is related to high nutrient concentrations (Zhou et al., 2007; Bai et al., 2005). These relationships can be used to explain some of the variability in nutrient content along this transect. According to Smith (2006), heavy metals such as Cu, Fe and Mn are commonly associated with soil organic matter instead of clay content. Our results agreed with previous research (Martin, 2004) showing only a weak correlation between silt plus clay and the micronutrients Cu, Mn and Fe (Figure 14), as well as no clear preference for clay sized particles over silt sized particles (Figure 12). 6. Conclusions Floodplain sediments in this canebrake have mean concentrations of Ca, Mg, K, Cu, Fe, and Mn that follow almost identical patterns across the floodplain, indicating that the same processes may control the distribution of all the nutrients. Three of these nutrients, Ca, Mg and K, show moderate correlations with the silt plus clay percent, indicating that these soils’ nutrient levels are partly related to grain size. The majority of the nutrients peak 30 m from the channel, in a small depression, where the river cane becomes less dense. Unusual patterns of grain size and nutrient concentrations at 40 m and 52 m may be attributed to the anthropogenic influence of the nearby highway and drainage pipe. A more intense study of the sources of these nutrients is needed to completely understand the distribution patterns. 7. Current and Future Work Concentrations of phosphorous, nitrogen, carbon, and sulfur will soon be analyzed along this transect. These results have been delayed by the intense extraction process needed for P, as well as arrival of the new CNS analyzer at WCU. For the River Cane Restoration Project, other soil characteristics such as bulk density, hydraulic conductivity, Eh and pH are being measured at canebrakes throughout WNC. Beginning the summer of 2007, chemical and physical analyses of a second transect will be completed.
11

Acknowledgements: Funding for this study was provided by the Eastern Band of Cherokee Indian through the Revitalization of Traditional Cherokee Artisan Resources Program. Thanks to everyone who has helped make this project successful: My advisors- Ben Tanner, Dave Kinner and Rob Young, the Geosciences and Natural Resource Management Department at WCU, David Cozzo, Laura DeWald, Joni Bugden-Storie, Kathy Matthews and THE CREW- Megan Arrington, Chad Harrold, Andrew Moore, Mike Yow, & Sean Caulfield.
12

Literature CitedAndrieux-Loyer, F and A. Aminot. (2001). Phosphorus forms related to sediment grain size and
geochemical characteristics in French coastal areas. Estuarine, Coastal and Shelf Science. 52: 617-629.
Bai, J. et al. (2005). Spatial distribution characteristics of organic matter and total nitrogen of marsh soils in river marginal wetlands. Geoderma. 124: 181-192.
Blattel, C.R., Williard, K. W. J., Baer, S., & Zaczek, J. J. (2003). Abatement of ground water phosphate in giant cane and forest riparian buffers. Journal of the American Water Resources Association. 41(2): 301-307.
Brewer, P.A., and M.P. Taylor. (1997). The spatial distribution of heavy metal contaminated sediment across terraced floodplains. Catena 30: 229-249.
Campbell, J.N. (1985). The land of cane and clover: presetttlement vegetation in so-called Bluegrass region of Kentucky. Herbarium Report, University of Kentucky, Lexington.
Cirtain, M.C., Franklin, S.B, & Pezeshki, S.I. (2004) Effects of nitrogen and moisture regimes on Arundinaria gigantea (Walt.) Muhl. seedling growth. Natural Areas Journal. 24: 251-257.
Datillo, A.J. (2003). Riparian Restoration: reference forest characterization and canebrake establishment in the Western Knobs of Kentucky. Masters Thesis. University of Kentucky, Department of Forestry, Lexington.
Epstein, E. and A. Bloom. (2005). Mineral nutrition of plants: Principles and perspectives. Sunderland, MA: Sinauer Associates.
Geyer, W.A., T. Neppl, K. Brooks, and J. Carlisle. (2000). Woody vegetation protects streambank stability during the 1993 flood in central Kansas. Journal of Soil and Water Conservation. 55: 483-486.
Lee, K.H., T.M. Isenhart, and R.C. Schultz. (2003). Sediment and nutrient removal in an established multi-species riparian buffer. Journal of Soil and Water Conservation. 58:1-8.
Lyell, C. (1849). A second visit to the United States of North America. Volumes 1 and 2. Harper and Row, New York.
Martin, C. (2004). Heavy metal storage in near channel sediments of the Lahn River, Germany. Geomorphology. 61: 275-285.
Michaux, A. (1793-1796). Journal of travels into Kentucky. P. 25-104. In: Thwaites, R.G. (ed.). 1996. Early western travels: 1748-1846. Volume 3. AMS Press, Inc., New York.
Middlekoop, H. (2002). Reconstructing floodplain sedimentation rates from heavy metal profiles by inverse modeling. Hydrologic Processes 16: 47-64.
Noss, R.F., Laroe, E.T. and J.M. Scott. (1995). Endangered ecosystems of the United States: a preliminary assessment of loss and degredation. U.S. Department of the Interior, National Biology Service. Biol. Rep. 28.
North Carolina Department of Agriculture. (2006). Plant Nutrients. http://www.ncagr.com/cyber/kidswrld/plant/nutrient.htm
Platt S.G., C.G. Brantley, and T.R. Rainwater. (2001). Canebrake fauna: Wildlife diversity in a critically endangered ecosystem. Journal of the Elisha Mitchell Scientific Society. 117:1-19.
Platt S.G., and Brantley. (1997). Canebrakes: An ecological and historical perspective. Castenea. 62: 8-21.
13

Shoonover, J.E. and K.W.J. Williard. (2003). Ground water nitrate reduction in giant cane and forest riparian buffer zones. Journal of the American Water Resources Association. 39: 347-354.
Schoonover, J. E., Williard, K. W. J., Zaczek, J. J., Mangun, J. C., & Carver, A. D. (2006). Agricultural sediment reduction by giant cane and forest riparian buffers. Water, Air, and Soil Pollution. 169: 303-315.
Steiger, J. and A. Gurnell. (2002). Spatial hydrogeomorphological influences on sediment and nutrient deposition in riparian zones: observations from the Garonne River, France. Geomophology. 49: 1-23.
Stoddard, A. (1812). Sketches, historical and descriptive of Louisiana. Mathew Carey Printer, Philadelphia.
Taiz, L and E. Zeiger. (2006). Plant Physiology. Sunderland, MA: Sinauer Associates. Welsch, D.J. (1991). Riparian forest buffers: function and design for protection and
enhancement of water resources. United States Department of Agriculture, Forest Service, United States Government Printing Office, Washington D.C.
White, R.E. (2006). Principles and practice of soil science. United Kingdom: Blackwell Ltd. Zhou, J et al. (2007). Spatial variations of carbon, nitrogen, phosphorus and sulfur in the salt
marsh sediments of the Yangtze Estuary in China. Estuarine, Coastal and Shelf Science. 71: 47-59.
14