determining the effects of co2 ocean … oceanica marine ecology - ocean acidification • can form...
TRANSCRIPT

MARINE ECOLOGY - OCEAN ACIDIFICATION
Biological Consequences of Ocean Acidification
Jon. Havenhand
Dept. Marine Ecology - Tjärnö

MARINE ECOLOGY - OCEAN ACIDIFICATION

MARINE ECOLOGY - OCEAN ACIDIFICATION

MARINE ECOLOGY - OCEAN ACIDIFICATION
review: why is this an issue?review: why is this an issue?
CO2 + H20 H2CO3 HCO3- + H+ CO3
2- + 2H+
CO32- + Ca2+ CaCO3
CO2
CO2 in seawater:pHcarbonate saturationcalcification
air – sea exchange
1% 91% 8%
atmospheric CO2 and the marine carbonate systematmospheric CO2 and the marine carbonate system

MARINE ECOLOGY - OCEAN ACIDIFICATION
review: why is this an issue?review: why is this an issue?
Fabry et al. 2008 ICES J. Mar. Sci.
units = µmol.kg-1

MARINE ECOLOGY - OCEAN ACIDIFICATION
calcification in marine organisms
• aragonite is twice as soluble as calcite
Raven et al. 2005 Royal Society

MARINE ECOLOGY - OCEAN ACIDIFICATION
calcite & aragonitecalcite & aragonite
http://webmineral.com/data/Aragonite.shtml
http://webmineral.com/data/Calcite.shtml

MARINE ECOLOGY - OCEAN ACIDIFICATION
Orr et al. 2005 Nature
A1F1
changes in aragonite saturationchanges in aragonite saturation

MARINE ECOLOGY - OCEAN ACIDIFICATION
changes in aragonite saturation: Atlanticchanges in aragonite saturation: Atlantic
Orr et al. 2005 Nature
• aragonite saturation horizon will rise closer to surface
- depth varies with model and scenario
• Ωaragonite of 1 ≈ pH 7.7

MARINE ECOLOGY - OCEAN ACIDIFICATION
spatial variation in ocean pH
GLODAP / Royal Society 2005

MARINE ECOLOGY - OCEAN ACIDIFICATION
spatial variation in ocean pH
Kleypas, J. et al. (2006) NSF, NOAA, USGS

MARINE ECOLOGY - OCEAN ACIDIFICATIONFeely, R. et al. (2008) Science
seasonally low pH
- June 2007
- much lower than previously known

MARINE ECOLOGY - OCEAN ACIDIFICATION
pH variation in the BalticpH variation in the Baltic
• greater seasonal variation at lower salinities
• seasonal variation exceeds predicted changes due to CO2-induced acidification
7.1 - 8.5
8.0 - 8.4
7.9 - 8.4
7.9 - 8.6
seasonal pH variation, 10-20mseasonal pH variation, 10-20m
http://produkter.smhi.se/pshark/datamap_nationell.php?language=e

MARINE ECOLOGY - OCEAN ACIDIFICATION
pH variation at one site:
Gotland Deep
pH variation at one site:
Gotland Deep
• interannual trends in pH vary with depth
y = 0.0043x - 0.2992 R2 =
7.5
8
8.5
9
1992 1994 1996 1998 2000 2002 2004 2006 2008
Surface
y = -0.002x + 12.281
7.5
8
8.5
9
1992 1994 1996 1998 2000 2002 2004 2006 2008
pH
20 m
y = -0.010x + 27.986
7.5
8
8.5
9
1992 1994 1996 1998 2000 2002 2004 2006 2008
pH
50 m
y = -0.010x + 27.751
7
7.5
8
8.5
1992 1994 1996 1998 2000 2002 2004 2006 2008
pH
100 m

MARINE ECOLOGY - OCEAN ACIDIFICATION
temporal variation in the Baltictemporal variation in the Baltic
• models predict pattern of surface water pH
• pH is declining throughout the deeper waters of the Baltic
• rate of decline is greater than that due to CO2-induced acidification
Omstedt, A. et al. (2009) Coast. Shelf Sci.
Andersson, P. et al. (2008) SMHI Oceanogr. Rep. 92

Dore, J. et al. (2009) PNAS2000 20061994
MARINE ECOLOGY - OCEAN ACIDIFICATION
temporal variation in Pacifictemporal variation in Pacific
• data for open ocean off Hawaii
rate = - 0.0019.yr-1rate = - 0.0019.yr-1

MARINE ECOLOGY - OCEAN ACIDIFICATION
temporal variation on small timescalestemporal variation on small timescales
• intertidal zone, US Pacific coast
• clear decadal changes (B)- 0.045 pH units.yr-1
• seasonal pH change ≤ 0.9 units (A)
• diurnal pH excursions ≤ 0.5 units (A)
• similar magnitude in western Sweden
Wootton T. et al 2008 PNAS
pH algal belt, Ursholmen, 2009-06-29
7.5
7.9
8.3
8.7
9.1
16
;42
19
;02
21
;42
23
;42
01
;02
07
;12
08
;32
10
;02
11
;22
12
;52
15
;02
pH algal belt, Ursholmen, 2009-06-29
7.5
7.9
8.3
8.7
9.1
16
;42
19
;02
21
;42
23
;42
01
;02
07
;12
08
;32
10
;02
11
;22
12
;52
15
;02
range of pH variation inopen water 2009-06-30

MARINE ECOLOGY - OCEAN ACIDIFICATION
what impacts will this have?
calcificationcalcification primary production
ecosystem effects physiology© Greenpeace

MARINE ECOLOGY - OCEAN ACIDIFICATION
1765 280 ppm
Aragonite saturation state
© R. Feely, A. Dickson

MARINE ECOLOGY - OCEAN ACIDIFICATION
2008 385 ppm
© R. Feely, A. Dickson
Aragonite saturation state

MARINE ECOLOGY - OCEAN ACIDIFICATION
2050 560 ppm
© R. Feely, A. Dickson
Aragonite saturation state

MARINE ECOLOGY - OCEAN ACIDIFICATION
2100 788 ppm
© R. Feely, A. Dickson
Aragonite saturation state

MARINE ECOLOGY - OCEAN ACIDIFICATION
• unicellular algae, bearing calcite plates (“coccoliths”)
• globally abundant- ~50% of all Carbon exported to deep ocean is dead coccoliths
• carbonate “ooze” forms from coccoliths & foraminiferans- covers half of the deep ocean floor ≤ 600 m thick
effects on phytoplankton - coccolithophores
Emiliania huxleyiGephyrocapsa oceanica

MARINE ECOLOGY - OCEAN ACIDIFICATION
• can form massive blooms- > 100,000 km2
- dominant sp. ( > 90% of algal cells)
effects on phytoplankton - coccolithophores
Emiliania huxleyi

MARINE ECOLOGY - OCEAN ACIDIFICATION
• acidification causes decreases in:- specific growth rate - cell size, coccolith size- calcification per cell
(Riebesell 2004, Engel et al. 2005)
Riebesell, U. (2004) J. Oceanogr.
effects on phytoplankton - coccolithophores
Engel, A. et al. (2005) Limnol. Oceanogr.
Riebesell, U. (2004) J. Oceanogr.

Iglesias-Rodriguez, D. et al. (2008) Science
MARINE ECOLOGY - OCEAN ACIDIFICATION
effects on phytoplankton - coccolithophores

MARINE ECOLOGY - OCEAN ACIDIFICATION

MARINE ECOLOGY - OCEAN ACIDIFICATION
effects on phytoplankton - coccolithophores
Langer, G. et al. (2009) Biogeosciences Disc.
• effects of acidification differ between strains
- no consistent trend in effects of pCO2 on growth, PIC, POC, or production
Langer et al. 2009 Biogeosci. Disc.

MARINE ECOLOGY - OCEAN ACIDIFICATION
effects on phytoplankton - Baltic coccolithophores
effects on phytoplankton - Baltic coccolithophores
• largely absent- none found in 2006 survey (Tyrell et al 2008)
- due to low Ωaragonite ?
- present in SMHI data (rarely: 1998-2007)
MARINE ECOLOGY - OCEAN ACIDIFICATION
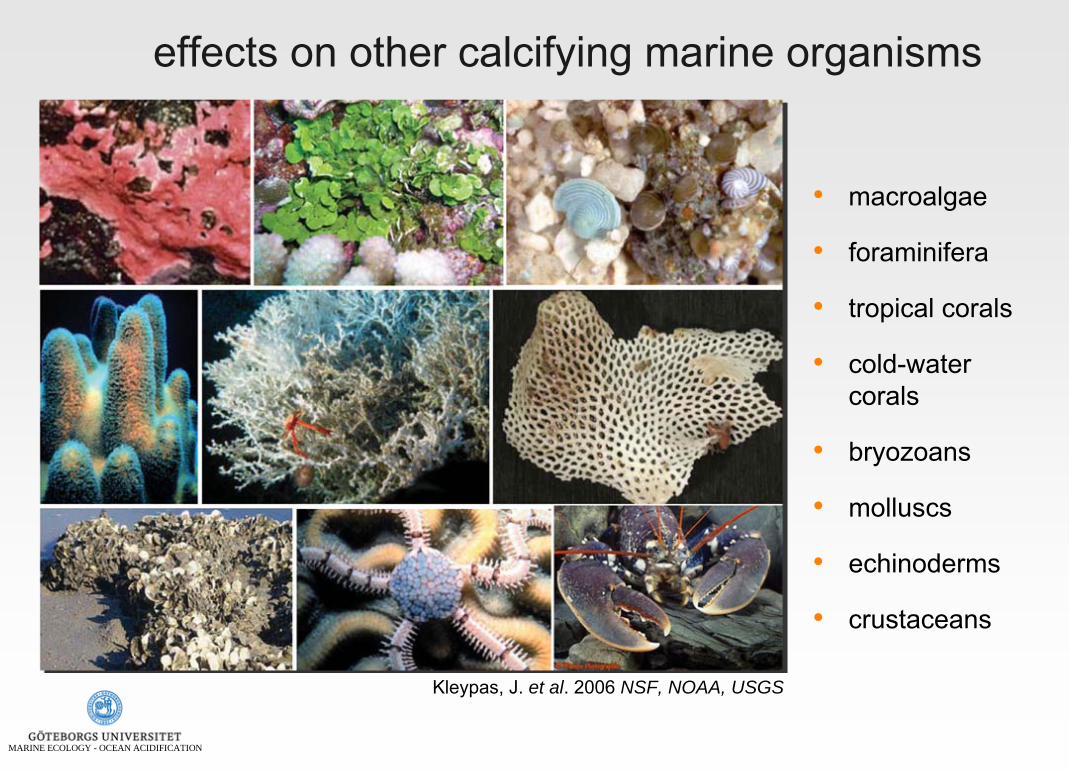
• macroalgae
• foraminifera
• tropical corals
• cold-water corals
• bryozoans
• molluscs
• echinoderms
• crustaceans
effects on other calcifying marine organisms
Kleypas, J. et al. 2006 NSF, NOAA, USGS

MARINE ECOLOGY - OCEAN ACIDIFICATION
• macroalgae
• foraminifera
• tropical corals
• cold-water corals
• bryozoans
• molluscs
• echinoderms
• crustaceans
Baltic, Kattegatt, Skagerrak
Kattegatt, Skagerrak only
effects on other calcifying marine organisms
Kleypas, J. et al. 2006 NSF, NOAA, USGS

MARINE ECOLOGY - OCEAN ACIDIFICATION
bivalve calcification ratesbivalve calcification ratesca
lcifi
catio
n ra
te
Gazeau et al. 2007 Geophys. Res. Lett.

MARINE ECOLOGY - OCEAN ACIDIFICATION
bivalve growth ratesbivalve growth rates
• shell growth of Mytilus edulis only affected at very low pH- pH 7.4 ≈ 2000 ppm CO2
Berge et al. 2006 JEMBE
• does “no difference” mean “no effect” ? ?
Berge, J.A. et al. 2006 J. Exp. Mar. Biol. Ecol.

MARINE ECOLOGY - OCEAN ACIDIFICATION
assumptions of statistical tests: α and βassumptions of statistical tests: α and β
• α = probability of concluding an effect when no effect is present- we determine this (usually α = 0.05)
• β = probability of concluding no effect when an effect is present- we usually don’t control this- ?? free to vary - often very high !
• Power = 1 - β- depends on:
- effect size- variance- sample size
Power (1 - β) effect size x α x √nvariance

MARINE ECOLOGY - OCEAN ACIDIFICATION
Power AnalysisPower Analysis
G*power
MARINE ECOLOGY - OCEAN ACIDIFICATION
importance of Power Analysis in climate change research
importance of Power Analysis in climate change research
• we need to know when climate change / acidification will have an effect and when it will not have an effect
• cannot conclude absence of effect from absence of significance in (eg) t-test, ANOVA
• need:- tests of similarity between treatment groups- Power Analysis of results
- pilot studies to ensure sufficient power in main study

MARINE ECOLOGY - OCEAN ACIDIFICATION
larval bivalve growth rateslarval bivalve growth rates
• embryos & larvae of marine organisms are typically the most sensitive life-stages- Mytilus galloprovincialis
- 20% reduced growth at 2000 ppm CO2 (pH 7.4)
- Crassostrea gigas- 30% reduced growth at
2000 ppm CO2
- only 6% of larvae survived to D-stage in high CO2 (68% in controls)
- Mercenaria mercenaria- high mortality in
juveniles settling in low
Kurihara, H. et al. 2009 Aq. Biol.
380 ppm CO2 2000 ppm CO2 2000 ppm CO2380 ppm CO2
Kurihara, H. et al. 2007 Aq. Biol.

pH 8,1 pH 7,7
pH 8,1 pH 7,9 pH 7,7
pH 7,7
larval brittle-star growth rateslarval brittle-star growth rates

MARINE ECOLOGY - OCEAN ACIDIFICATION
effects on fertilizationeffects on fertilization
predicted fertilization
no effect
no effect
- 52 %
- 26 %
observed fertilization
- 25 %
early development
no effect
no effect
no effect
no effect
no effect
( + 61 % )
Strongylocentrotus droebachiensis
( - 6 % )
no effectAsterias rubens
no effect
( 0 - 88 % )
effects of acidification by 0.4 pH units in comparison to controls
• different impacts on different life stages of the same species
• different impacts on closely related species

larval growth& development
fertilization
MARINE ECOLOGY - OCEAN ACIDIFICATION
marine invertebrate life-cyclemarine invertebrate life-cycle
adultspawning
settlement & metamorphosis
juvenile

MARINE ECOLOGY - OCEAN ACIDIFICATION
1765 280 ppm
Aragonite saturation state(from corals’ point of view)
Extremely low Optimal
© R. Feely, A. Dickson

MARINE ECOLOGY - OCEAN ACIDIFICATION
2008 385 ppm
Aragonite saturation state(from corals’ point of view)
Extremely low Optimal
© R. Feely, A. Dickson

MARINE ECOLOGY - OCEAN ACIDIFICATION
2050 560 ppm
Aragonite saturation state(from corals’ point of view)
Extremely low Optimal
© R. Feely, A. Dickson

MARINE ECOLOGY - OCEAN ACIDIFICATION
2100 788 ppm
Aragonite saturation state(from corals’ point of view)
Extremely low Optimal
© R. Feely, A. Dickson

MARINE ECOLOGY - OCEAN ACIDIFICATION
• growth rates of Porites on GBR are 21% lower - than pre-1990 (Hoegh-Guldberg at al, Science 2007)
• predicted 40% reduction in calcification of corals within 40 years- Biosphere project, tropical corals (Kleypas & Langdon, Coast. Est.
Stud. 2006)
• reduced density increases breakage loss of habitat integrity
loss of refugia
fewer niches
reduced resilience (Mumby et al, Nature 2007)
effects on corals

MARINE ECOLOGY - OCEAN ACIDIFICATION
effects on corals
• data for the past 420,000 years
• ocean pH varied by ± 0.1 pH units
Hoegh-Guldberg et al. Science 2007
reef growth ceases ( Ω aragonite ≈ 3.3)

MARINE ECOLOGY - OCEAN ACIDIFICATION
effects on corals
Source: Hoegh-Guldberg et al. Science 2007
2007 ≤ 21002050

MARINE ECOLOGY - OCEAN ACIDIFICATION
calcificationcalcification primary production
ecosystem effects physiology© Greenpeace

MARINE ECOLOGY - OCEAN ACIDIFICATION
• “community-level” investigation of pCO2
- mixed populations in experimental mesocosms- pCO2 = 350 ppm, 700 ppm, 1,050 ppm
• increasing pCO2 had positive effect on diatoms - no effect on coccoliths
- no effects on dinoflagellates
• positive effects on C uptake
effects on phytoplankton communities
diatoms
coccoliths
(dino)flagellates
Riebesell et al, Nature 2007

MARINE ECOLOGY - OCEAN ACIDIFICATION
effects on seagrasseseffects on seagrasses
• Hall-Spencer et al, 2008 Nature
• natural CO2 seeps in Italy- local acidification

MARINE ECOLOGY - OCEAN ACIDIFICATION
effects on seagrasseseffects on seagrasses
Hall-Spencer et al (2008) Nature
QuickTime™ and a decompressor
are needed to see this picture.

MARINE ECOLOGY - OCEAN ACIDIFICATION
effects on seagrasseseffects on seagrasses
• increased seagrass growth rate at low pH- increased shoot density
- no increase in photosynthetic rate
- strong -ve correlation between calcareous epiphytes and shoot density
• increased growth rate due to decreased competition
• indirect effect

MARINE ECOLOGY - OCEAN ACIDIFICATION
calcificationcalcification primary production
ecosystem effects physiology© Greenpeace

MARINE ECOLOGY - OCEAN ACIDIFICATION
mechanisms of physiological stressmechanisms of physiological stress
• effects of increasing pCO2
depend on duration of exposure - acute extreme effects:
- respiratory stress- behavioural changes
- chronic intermediate effects:- hormonal changes
- reproduction / growth
• more pronounced in “lower”invertebrates- fewer compensation mechanisms
- eg cuttlefish respiration, calcification unaffected by 4000 ppm CO2 (Gutowska et al. 2009)
Pörtner H. 2008 Mar. Ecol.Prog.Ser.

MARINE ECOLOGY - OCEAN ACIDIFICATION
mechanisms of physiological stressmechanisms of physiological stress
• in “lower” organisms, ambient pH affects internal pH regulation
• eg acorn worm Sipunculus - metabolic rate is lower when
internal pH is low
- but only when external pH is low
- causes reduced aerobic capacity
• acid-base regulation can be expensive- ≤ 50% of energy budget
- limits “scope for growth”
Pörtner et al, 2004 J.Oceanogr.
oxyg
en c
onsu
mpt
ion
(% o
f co
ntro
l)
controlelevated CO2

Metzger et al, 2007 J. Therm. Biol.
oxyg
en c
onte
nt o
f blo
od (k
Pa)
MARINE ECOLOGY - OCEAN ACIDIFICATION
synergies create additional stresssynergies create additional stress
• pCO2 acts in synergy with other stressors- eg Cancer pagurus
- pCO2 in “control” blood depends on T°:
- normal ≤ 16°C (“Tp”)- minimal ≥ 20°C (“Tc”)
- at high external pCO2
- Tp drops to ~11°C- Tc drops to ~16°C
• increased pCO2 reduces thermal tolerance

MARINE ECOLOGY - OCEAN ACIDIFICATION
synergistic effects on physiological stresssynergistic effects on physiological stress
T° / pH
T° / pH
SpawnersGrowing Adults
Juveniles
Eggs, early larvae
Pörtner 2008 Nature
• generalised pattern of thermal tolerance
• increased pCO2 reduces thermal tolerances

MARINE ECOLOGY - OCEAN ACIDIFICATION
calcificationcalcification primary production
ecosystem effects physiology© Greenpeace

MARINE ECOLOGY - OCEAN ACIDIFICATION
ecosystem effectsecosystem effects
• hard to assess:
• closely related species respond differently to similar pCO2 / pH changes
• very few species studied to date- especially at environmentally relevant pCO2 / pH levels ( ≤ 1000 ppm, ≥ 7.7)
• negative data hard to interpret without Power Analysis- was there really no effect, or were there too few replicates / too much
variability to detect one ?
• most studies done over short timescales- almost no multi-generational data
- capacity for adaptation ?

MARINE ECOLOGY - OCEAN ACIDIFICATION
will species be able to adapt ?will species be able to adapt ?
• adaptive capacity depends on:- generation time- heritable variation- gene-flow
• average generation time for key taxa:
- microalgae 1 d - 2 weeks- copepods ≈ 3 weeks- barnacles ≈ 1 year- macroalgae, echinoderms 1 - 5 years- large crustaceans 2 - 20 years- bivalves 1 - 50 years- deep water corals ?

MARINE ECOLOGY - OCEAN ACIDIFICATION
ecosystem effects - potential losers?ecosystem effects - potential losers?
• natural CO2 seeps, Ischia, Italy
• fewer calcifying species in low pH
• few differences in non-calcifying species
• representative ?
Hall-Spencer et al (2008) Nature

MARINE ECOLOGY - OCEAN ACIDIFICATION
ecosystem effects - potential winners?ecosystem effects - potential winners?

Richardson et al 2009 TREEMARINE ECOLOGY - OCEAN ACIDIFICATION
effects of acidification on jellyfisheffects of acidification on jellyfish
overfishing
eutrophication
warming
acidification ?

MARINE ECOLOGY - OCEAN ACIDIFICATION
effects of acidification on jellyfisheffects of acidification on jellyfish
Attrill M. et al 2007 Limnol. Oceanogr.
Richardson & Gibbons 2008 Limnol. Oceanogr.
survey area

MARINE ECOLOGY - OCEAN ACIDIFICATION
• distribution & abundance of species will change
• more affected:- calcifyers, spp. from more environmentally stable areas, long generation times
• which species are candidate indicators ?- ecological engineers: mussels ?
- keystone spp: phytoplankton, fish
• reducing other stressors will increase resilience
• probable extreme socio-economic impacts- marine ecosystem services globally valued at ≈ $27 trillion
ecosystem effectsecosystem effects

MARINE ECOLOGY - OCEAN ACIDIFICATION
ecosystem effectsecosystem effects
• species composition in functional groups will change
• interactions withinfunctional groups will change
• interactions betweenfunctional groups maychange . . .- and be replaced by?
Simplified Baltic Food Web - from Österblom et al. 2007 Ecosystems

MARINE ECOLOGY - OCEAN ACIDIFICATION
one last thing . . .

MARINE ECOLOGY - OCEAN ACIDIFICATION
Collaborators - and many thanks (!) to:Collaborators - and many thanks (!) to:
• Sam Dupont, Elin Renborg, Peter Schlegel (Marine Ecology, University of Gothenburg)
• Mike Thorndyke (Royal Swedish Academy of Sciences, Kristineberg)
• Jane Williamson, Steph Mifsud, Fenina Buttler (Macquarie University, Australia)
• Gerry Quinn (Deakin University, Australia)
• Jessica Marks (University of Oslo, Norway)
• Pia Andersson, Ann-Turi Skjevik (SMHI)
• Ove Hoegh-Guldberg (University of Queensland, Australia)
• Martin Wahl, Andrea Frommel (IFM-GEOMAR, Kiel, Germany)
• Andrew Dickson (Scripps Institute, USA)
• Jim Barry (Monterey Bay Aquarium Res. Inst., USA)

MARINE ECOLOGY - OCEAN ACIDIFICATION

MARINE ECOLOGY - OCEAN ACIDIFICATION
Skagerrak 0-50 m -0.0028 P = 0.136
> 75 m -0.0026 P = 0.156
Kattegat 0-25 m -0.0044 P < 0.0001
> 30 m -0.0079 P < 0.0001
S. Baltic 0-20 m -0.0041 P = 0.094
30-60 m -0.0142 P < 0.0001
> 70 m -0.0156 P < 0.0001
Central & N. Baltic 0-20 m +0.0024 P = 0.347
30-60 m -0.0102 P < 0.0001
> 70 m -0.0063 P < 0.0001
• annual Δ pH (1993 - 2007):
pH variability in Sweden
Source: Lars Andersson, SMHI
• current pH (Anholt, 30 m) = 8.1
• at 0.0025 units.yr-1 , 2050 pH = 7.96, 2100 pH = 7.83
• at 0.0051 units.yr-1 , 2050 pH = 7.78, 2100 pH = 7.53