detrmining the assimilation capacity of lake · lake tana is a complete mixed system reactor type...
TRANSCRIPT

DETRMINING THE ASSIMILATION
CAPACITY OF LAKE TANA: FOCUSING ON ANTHROPOGENIC ACTIVITIES
By : Hailu Sheferaw
June 2013

CONTENTS BACK GROUND OF THE PROBLEM OBJECTIVE METHODOLOGY RESULT & DISCUSSION CONCLUSION RECOMMENDATION LIMITATIONS
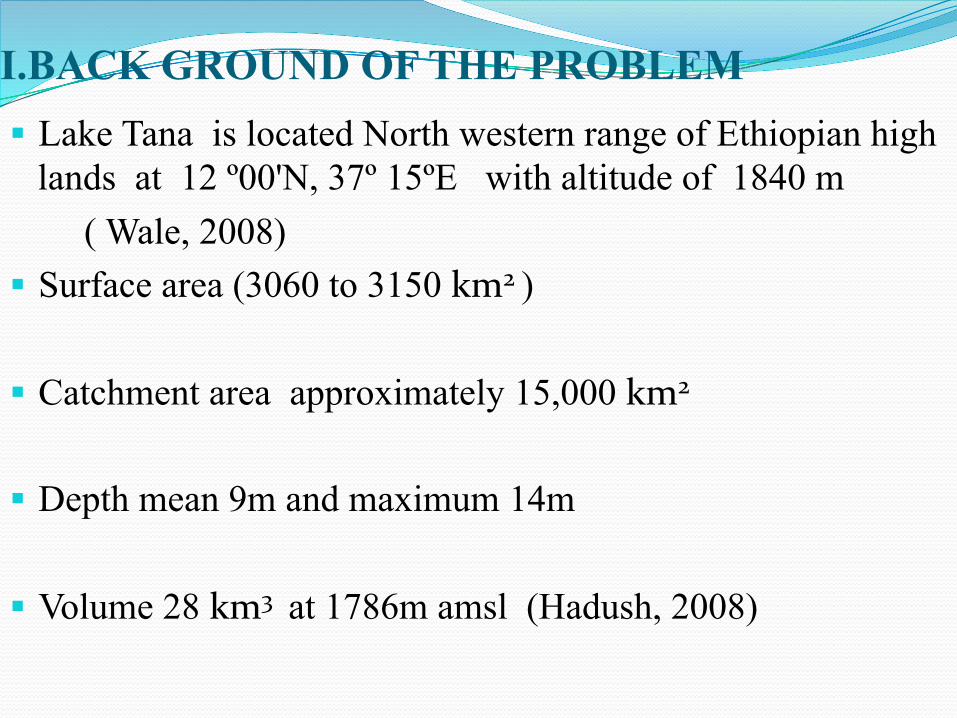
I.BACK GROUND OF THE PROBLEM Lake Tana is located North western range of Ethiopian high
lands at 12 º00'N, 37º 15ºE with altitude of 1840 m ( Wale, 2008) Surface area (3060 to 3150 km2 ) Catchment area approximately 15,000 km2
Depth mean 9m and maximum 14m Volume 28 km3 at 1786m amsl (Hadush, 2008)

CONTINUED
Maximum length 84 km and maximum width 64 km Major influent river Gilgel Abay, Ribb, Gumera & Megeche Effluent river Blue Nile (Hadush, 2008) The lake is home town of 2 million population in its
catchment and wet lands ( Gardone, 2007)
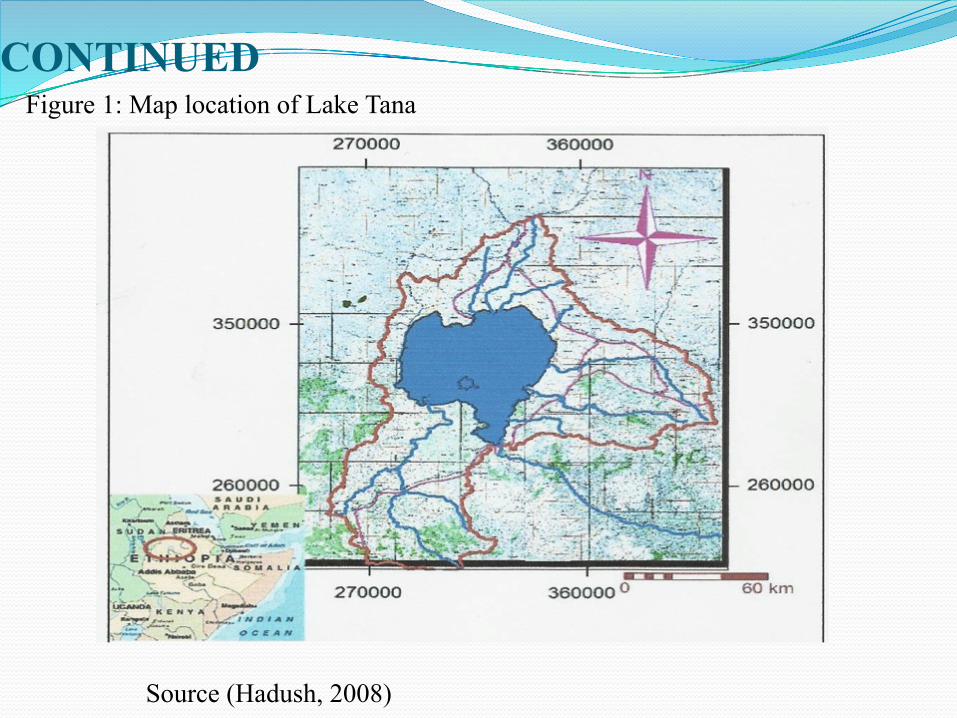
CONTINUED Figure 1: Map location of Lake Tana Source (Hadush, 2008)

CONTINUED
Lake pollution Wasn’t a major problem Until large centre of population developed ( Mirolav & Vladimir, 2006)
Pollution of surface water (lake) α related to anthropogenic activities and growing population(Zmek et al, 2005)
Lake Tana feed by streams from different catchment area HL1.pptx
The lake used as a basket for dumping of industrial & domestic wastes from Bahir-Dar city (Goraw et al., 2010)
There is continues loading of pollutant in to the lake and its concentration varies in the shore line specially in Bahir -Dar gulf (Mengistu, 2003)

CONTINUED Lakes pollution become a problem when the waste load in to
a lake; exceeds itself purification mechanism No research have been done in lake Tana in estimating its
waste holding capacity (Assimilation capacity)
To kept the lake property of carrying waste material without adverse effects on the environment or on users of its resources?
A great attention should be given in estimating the
assimilation capacity of Lake Tana
II. OBJECTIVE Scope:-
Aimed on estimation of transfer function in order to estimate the relative assimilative capacity in terms of different water quality parameters
Objectives:- Determine the concentration of various WQP in the different
inflow streams entering the lake and in the lake Determine the temporal variations of WQP concentration in
the inflow streams joining the lake and in the lake Develop a test to check whether there is a difference in the
transfer function estimation respective to each WQP across time interval

III. HOW ? Sampling :-
Gelgele Abay, Gelda , Gumera, Ribb, & Megech are selected covers 93% of the inflow to the lake
Bahir-Dar City sources because of its anthropogenic • One sampling point was selected on each river
15 sampling points from the open lake were taken based on their importance : at a place from where water is discharged from the lake at a place where feeder tributary meets the lake at a central place of the lake
5 sampling points were taken on the out late river
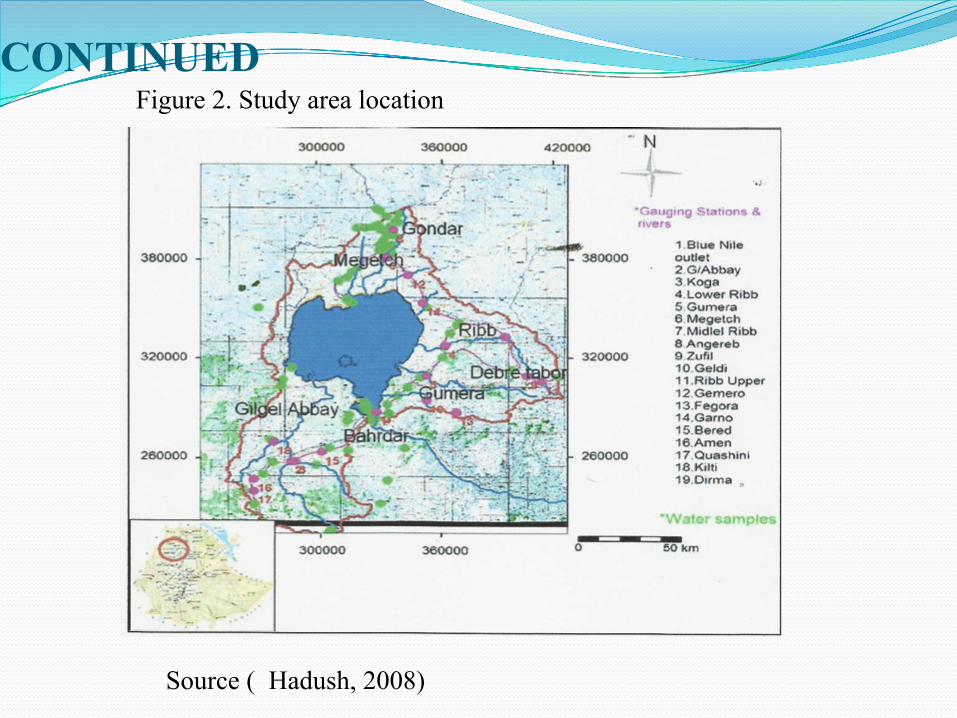
CONTINUED Figure 2. Study area location
Source ( Hadush, 2008)
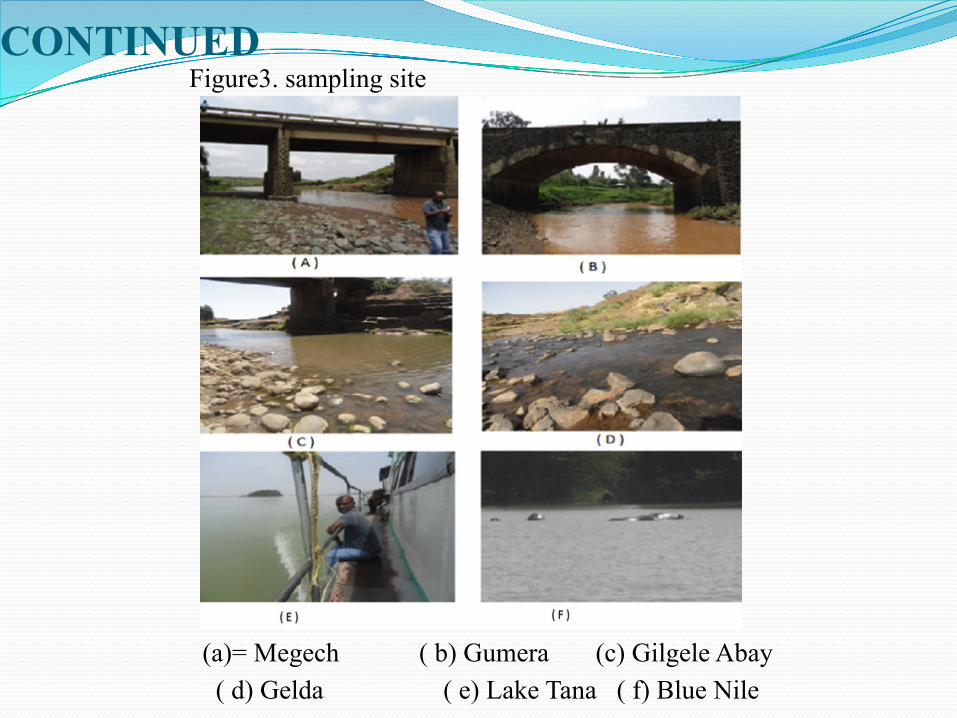
CONTINUED Figure3. sampling site (a)= Megech ( b) Gumera (c) Gilgele Abay ( d) Gelda ( e) Lake Tana ( f) Blue Nile
CONT’D

CONTINUED Sampling procedure:
Samples were taken 1 time per month for 3 months from inflow stream , open lake and the out late river. HL2.docx
Samples were taken using PVC plastics bottle Sample from the lake were taken in the morning session
when ratification of lakes were absent Composite sample were taken from the bank and middle part
of the rivers Data Type:
Secondary data from review of literature physical facts and figures of lake Tana
Primary Data from measurement of WQP in situ and chemical analysis in Laboratory
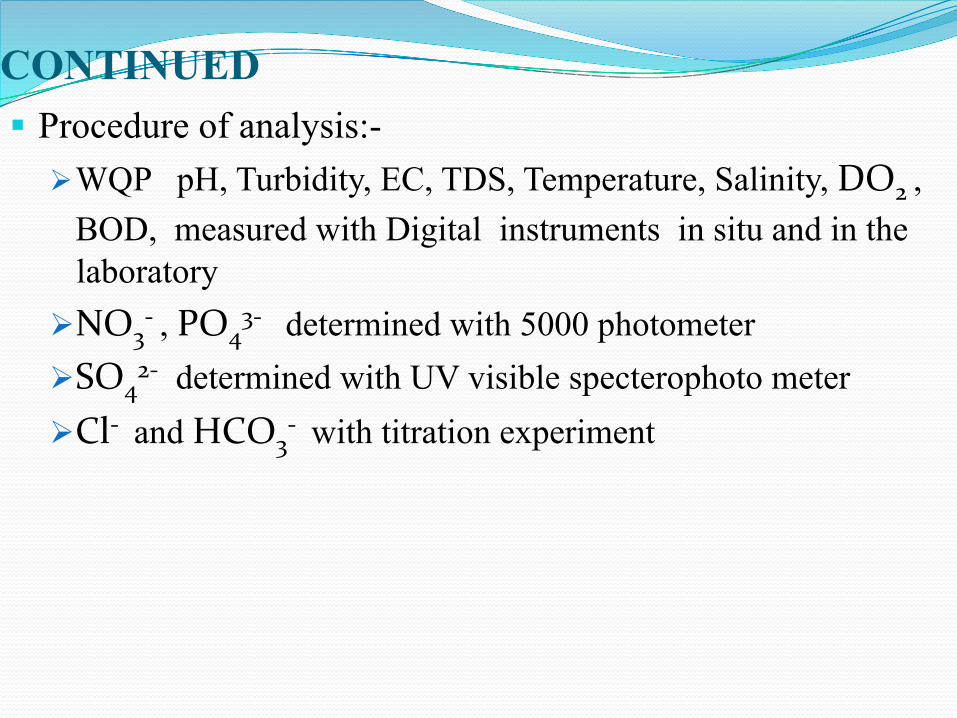
CONTINUED Procedure of analysis:-
WQP pH, Turbidity, EC, TDS, Temperature, Salinity, DO2 , BOD, measured with Digital instruments in situ and in the
laboratory NO3
-‐ , PO43-‐ determined with 5000 photometer
SO42-‐ determined with UV visible specterophoto meter
Cl-‐ and HCO3-‐ with titration experiment
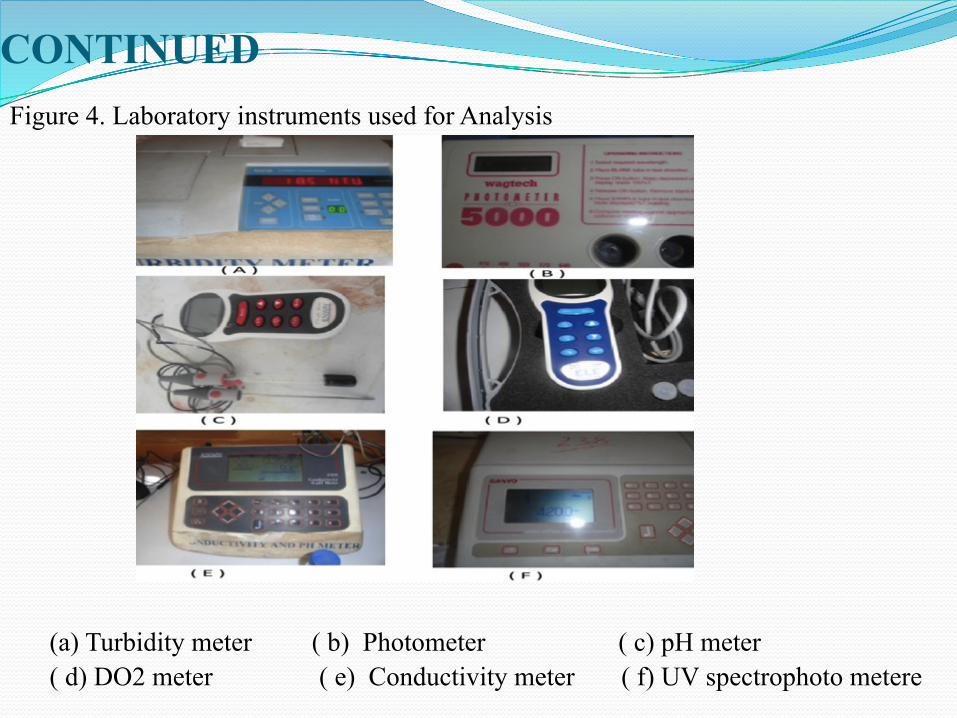
CONTINUED Figure 4. Laboratory instruments used for Analysis (a) Turbidity meter ( b) Photometer ( c) pH meter ( d) DO2 meter ( e) Conductivity meter ( f) UV spectrophoto metere
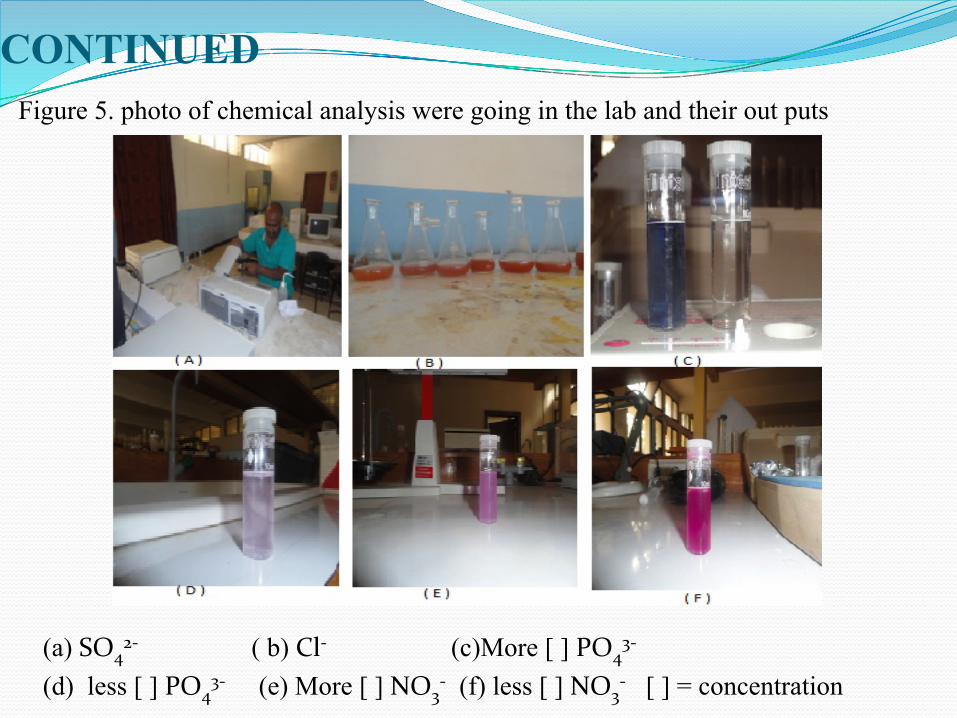
CONTINUED Figure 5. photo of chemical analysis were going in the lab and their out puts (a) SO4
2-‐ ( b) Cl-‐ (c)More [ ] PO43-‐
(d) less [ ] PO43-‐ (e) More [ ] NO3
-‐ (f) less [ ] NO3-‐ [ ] = concentration

CONTINUED Estimation of transfer function
β = C in lake/ C inflow β << 1 = the lake has good assimilation capacity β → 1 = the lake waste removal mechanism are weak where β = transfer function C in lake = in lake concentration of WQP C inflow = concentration of WQP inflow stream (Chapra, 1996)

CONTINUED Out put data analysis:-
An independent two sampled T- test Pearson correlation and scatter plot graph between BOD
and DO2 and EC and TDS One way ANOVA was employed
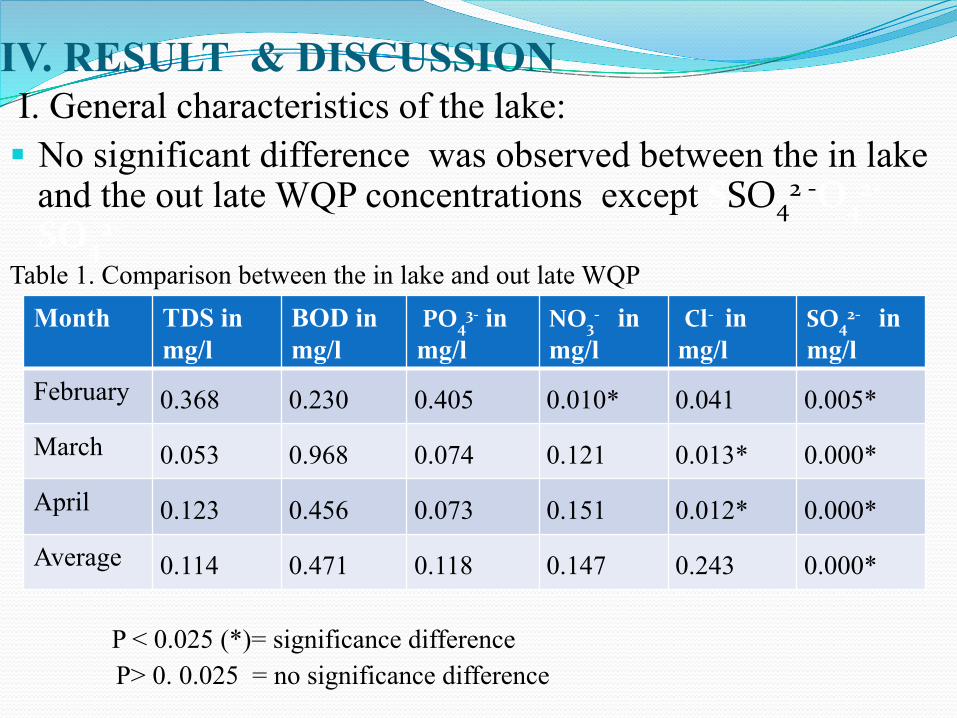
IV. RESULT & DISCUSSION I. General characteristics of the lake: No significant difference was observed between the in lake
and the out late WQP concentrations except SSO42 -‐O4
2-‐ SO4
2-‐ Table 1. Comparison between the in lake and out late WQP
P < 0.025 (*)= significance difference P> 0. 0.025 = no significance difference
Month TDS in mg/l
BOD in mg/l
PO43-‐ in
mg/l NO3
-‐ in mg/l
Cl-‐ in mg/l
SO42-‐ in
mg/l February 0.368 0.230 0.405 0.010* 0.041 0.005*
March 0.053 0.968 0.074 0.121 0.013* 0.000*
April 0.123 0.456 0.073 0.151 0.012* 0.000*
Average 0.114 0.471 0.118 0.147 0.243 0.000*

CONTINUED The correlation between EC and TDS and BOD and DO2
are strong both in the inflow and in the in lake water bodies Table 2. Correlation between EC& TDS and BOD &DO2 HL3.docx
r > o.75 implies strong correlation O.5< r < 0.75 implies medium correlation r < 0.5 implies weak correlation (Hoshamand, 1998)
Month Inflow stream In lake
TDS &EC(+ve)
BOD &DO2(-ve)
TDS &EC (+ve)
BOD &DO2(-ve)
February 1.00 0.996 0.803 0.764 March 1.00 0.958 0.747 0.782 April 0.995 0.982 0.656 0.662 Average 0.999 0.992 0.770 0.828

CONTINUED
The above two findings clearly showed that lake Tana is a complete mixed system reactor type of lake in which the out late and in lake concentration equal and homogeneity of chemical species exist
This finding is similar to the definition given for a complete
mixed system lake by Chapra (1996) HL4.pptx But contrast results was found by Goraw (2007) regarding
homogeneity of WQP concentration & by Megsitu (2003) concentration of pollutants varies in the shore line specially
in 8 km Bahir -Dar gulf
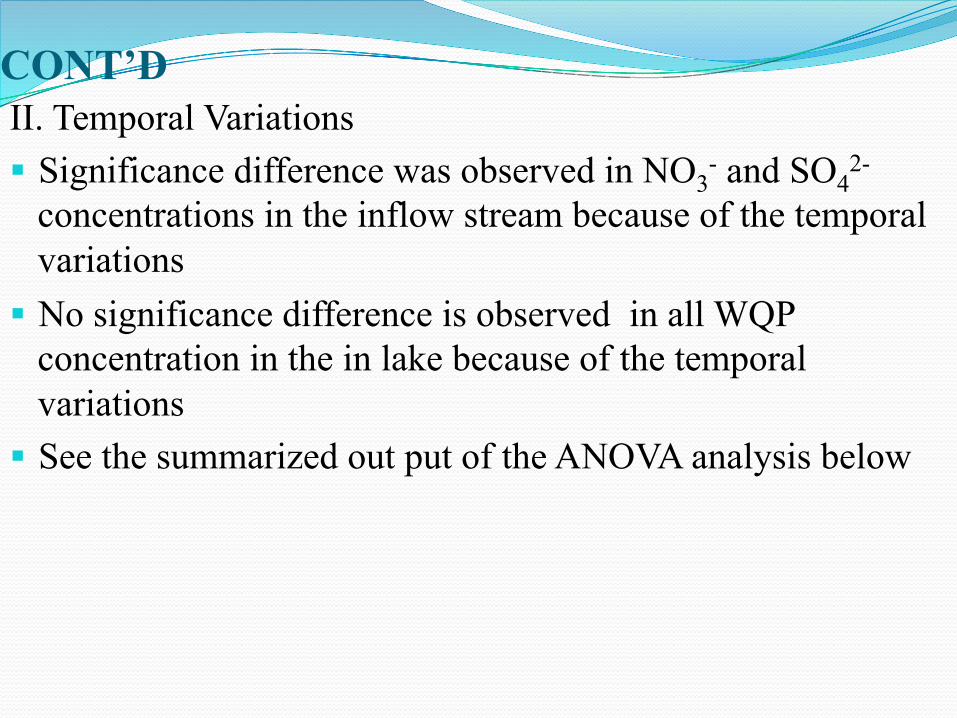
CONT’D II. Temporal Variations Significance difference was observed in NO3
- and SO42-
concentrations in the inflow stream because of the temporal variations
No significance difference is observed in all WQP concentration in the in lake because of the temporal variations
See the summarized out put of the ANOVA analysis below

CONTINUED Table 3. Temporal variation as independent variable
P< 0.025 (*) = Significance difference P> 0.025 = no significance difference
The significance difference which is observed in the SO42-‐
and NO3-‐ in case of the inflow may be attributed to the
sudden emission of these pollutants from Bahir-Dar city sources
( HL5.pptx 5.1 & HL2.docx ( table 1,4,7 )
Water quality parameters
TDS BOD PO43-‐ NO3
-‐ Cl-‐ SO42
P-Value (inflow ) 0.210 0.179 0.09 0.013* 0.159 0.003*
P- Value ( in lake)
0.398 0.374 0.407 0.189 0.260 0.141
CONTINUED
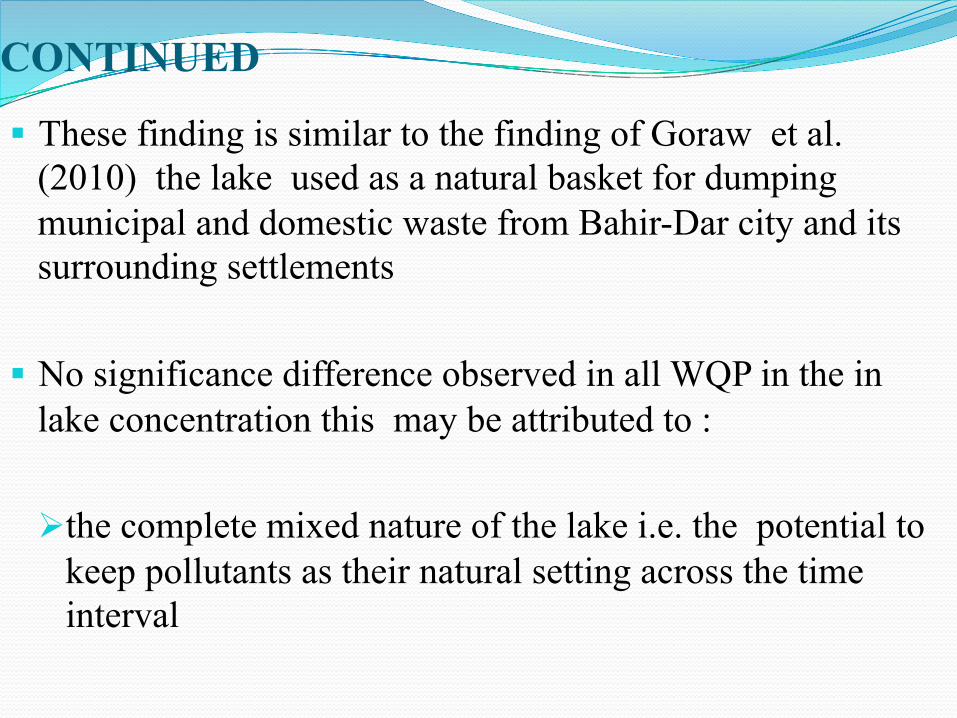
These finding is similar to the finding of Goraw et al. (2010) the lake used as a natural basket for dumping municipal and domestic waste from Bahir-Dar city and its surrounding settlements
No significance difference observed in all WQP in the in
lake concentration this may be attributed to : the complete mixed nature of the lake i.e. the potential to
keep pollutants as their natural setting across the time interval

CONT’D III. Estimation of transfer function The transfer function estimated on the average
concentration of the study period showed that the lake have good assimilating capacity to all of the WQP (i.e. β <<1)

CONTINUED Table 4. Transfer function β → 1 lake has poor assimilation capacity (*) β << 1 lake has good assimilation capacity (Chapra, 1996)
The finding implies the lake has a potential to self purified to all of WQP until the inflow concentrations equal to the in lake (Chapra, 1996)
Month Water quality parameters
TDS BOD PO4-3 NO3
- Cl- SO4-2
February 0.440 0.890 0.234 0.777 0.555 0.452 March 0.498 0.871 1.50* 1.32* 0.768 0.669 April 0.526 0.897 0.964 1.31* 0.893 0.668 Average 0.485 0.886 0.523 0.859 0.718 0.751
CONTINUED
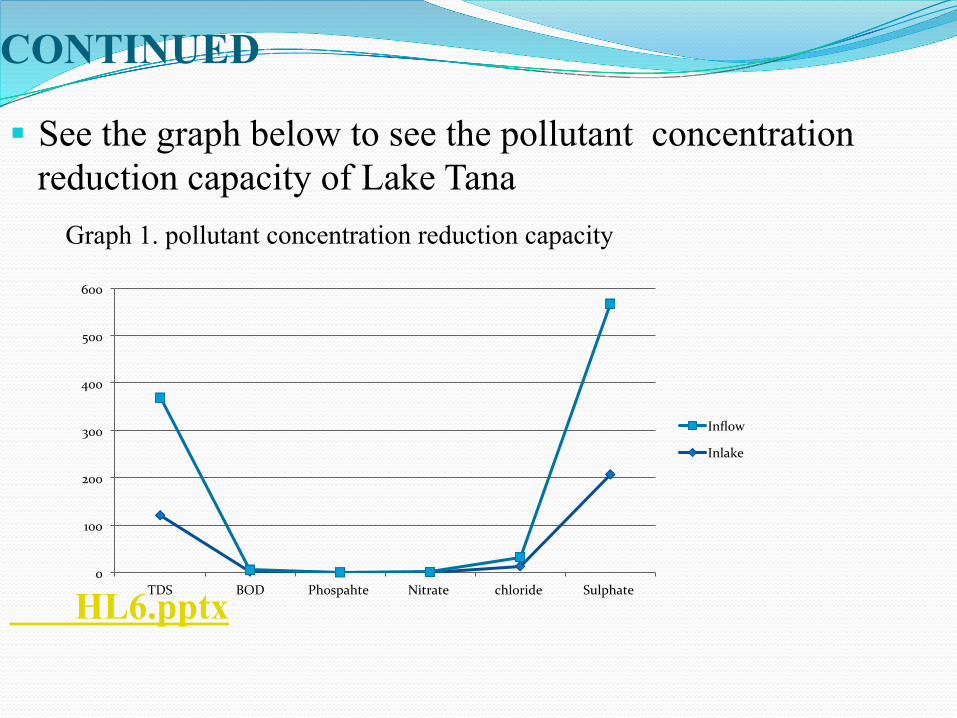
See the graph below to see the pollutant concentration reduction capacity of Lake Tana
Graph 1. pollutant concentration reduction capacity
HL6.pptx
0
100
200
300
400
500
600
TDS BOD Phospahte Nitrate chloride Sulphate
Inflow
Inlake
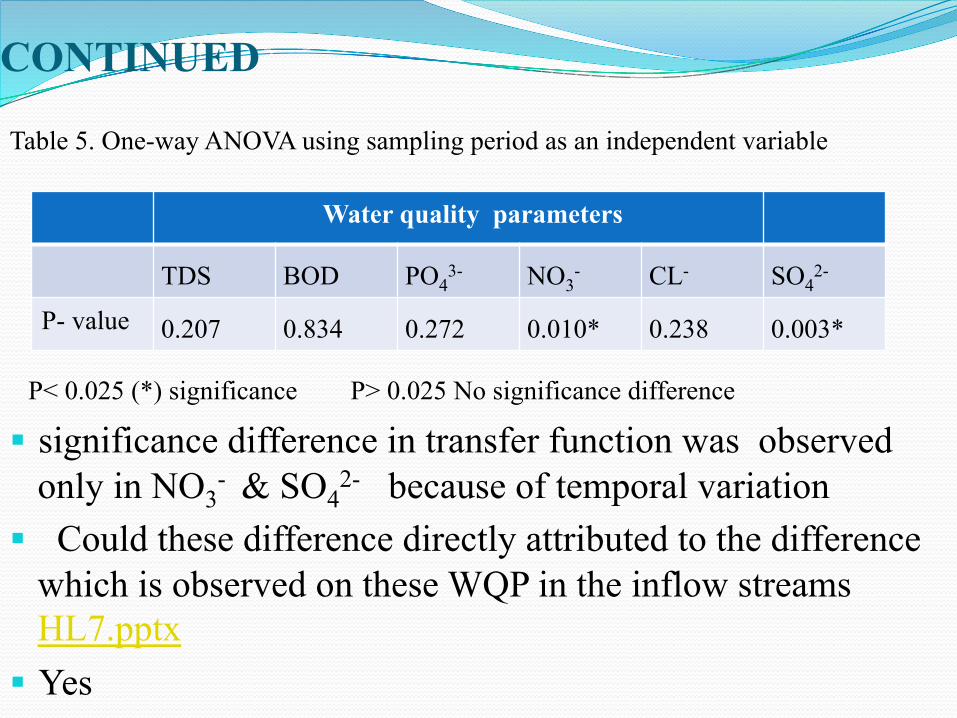
CONTINUED Table 5. One-way ANOVA using sampling period as an independent variable
P< 0.025 (*) significance P> 0.025 No significance difference significance difference in transfer function was observed
only in NO3- & SO4
2- because of temporal variation Could these difference directly attributed to the difference
which is observed on these WQP in the inflow streams HL7.pptx
Yes
Water quality parameters
TDS BOD PO43- NO3
- CL- SO42-
P- value 0.207 0.834 0.272 0.010* 0.238 0.003*

CONTINUED The general trend observed here is: As there is temporal variation in concentration of WQP in
the inflow water stream there is also transfer function value variation but this need additional investigation i.e. simple or
multiple regression to check which one has more contribution to the variation of transfer value????

V. CONCLUSION Lake Tana is a complete mixed system reactor type of lake
in which the out late and in lake concentration equal and homogeneity of chemical species exist
There is variation in NO3- and SO4
2- concentrations in the inflow stream because of the temporal variations
No significance difference is observed in all WQP concentration in the in lake because of the temporal variations
The lake have good assimilating capacity to all of the WQP (i.e. β <<1) in the study period
As there is temporal variation in concentration of WQP in the inflow water stream there is also transfer function value variation

VI. RECOMMENDATION
To reduce pollution of surface water bodies; emission from the environment should be fall in the range of permissible limit

VII. LIMITATIONS Accessibility of sampling points in the inflow water stream Determination of sedimentation rate and reaction constant
Determination of atmospheric flux
Determination of ground water discharge contribution The project needs at least 1 year to see the complete
assimilative property of Lake Tana in the four season
REFRENCES 1/ Goraw ,G. et al. 2010.Assessment of Lake Tana water quality for
sustainable and integrated water Resources Development: Tana Sub basin and Abbay Basin Authority Annual Report. Gonder : Fasildes.
2/Hadush, G., 2008. Ground Water Contribution and Recharge
Estimation in the Upper Blue Nile flows, Ethiopia. M.Sc. International Institute for Geo-information Science and Observation, the Netherlands.
3/Mirsolv, R. and Vladimir, N.2006. Practical Environmental Analysis.
2nd ed. London: Royal society of chemistry. 4/ Kebede, S., Travia, Y., Alemayehu, T. and Marc, V. 2005.Water
balance of lake Tana and its sensitivity to fluctuations in rain fall, Blue Nile basin, Ethiopia. Journal of Hydrology, 316 (2006), PP.233-247.
CONTINUED 5/Shapra, S.C., 1996. Surface Water Quality modeling.1st ed.McGraw-‐Hill Higher Education.
6/ Shimelis, G.S., Ragahavan, S. and Bijan, D., 2008. Hydrological
Modeling in the Lake Tana Basin, Ethiopia Using SWAT model. The Open hydrology journal ,2, pp.49-62.
7/ Wale, A., 2008. Hydrological Balance of Lake Tana Upper Blue Nile
Basin, Ethiopia. M.Sc. International Institute for Geo-information Science and Observation, the Netherlands.
8/ Zmeke, F. et al. 2005. Land use changes under economic boom
impact on water quality; Case Study of the Tainu Lake Basin in China. Journal of Ekologia (Bratislava) , Vol-24, pp.124-138.

ACKNOWLEDGEMENT Prof. Dr. Prateek Sharma & Dr. Belyneh Ayele for Their constructive feed back and moral support
Sindicatum Climate Change Foundation & TERI University for Their Financial and Material support
Bahir-Dar University Civil & Water Resource Engineering and College of Agricultural and Environmental Science for The Major project placement and Laboratory Facility

THANK YOU