deutsche bahn 2018 integrated report · at a glance selected key figures 2018 2017 change absolute...
TRANSCRIPT

Deu
tsch
e B
ahn
20
18
Int
egra
ted
Rep
ort
Deutsche Bahn 2018 Integrated ReportOn track towards a better railway

At a glance
Selected key figures 2018 2017
Change
absolute %
KEY FINANCIAL FIGUR E S (€ MILLION)
Revenues adjusted 44,024 42,704 + 1,320 + 3.1Revenues comparable 44,486 42,703 + 1,783 + 4.2Profit before taxes on income 1,172 968 + 204 + 21.1Net profit for the year 542 765 – 223 – 29.2EBITDA adjusted 4,739 4,930 – 191 – 3.9EBIT adjusted 2,111 2,152 – 41 – 1.9Equity as of Dec 31 13,592 14,238 – 646 – 4.5Net financial debt as of Dec 31 19,549 18,623 + 926 + 5.0Total assets as of Dec 31 58,527 56,436 + 2,091 + 3.7Capital employed as of Dec 31 36,657 35,093 + 1,564 + 4.5Return on capital employed (ROCE) (%) 5.8 6.1 – –Redemption coverage (%) 17.6 18.7 – –Gross capital expenditures 11,205 10,464 + 741 + 7.1Net capital expenditures 3,996 3,740 + 256 + 6.8Cash flow from operating activities 3,371 2,329 + 1,042 + 44.7KEY PER FOR MAN CE FIGUR E S
Passengers1) (million) 4,669 4,685 –16 – 0.3R AIL PA S SENGER TR ANSP ORT
Punctuality DB passenger transport (rail) in Germany (%) 93.5 94.1 – – Punctuality DB Long-Distance (%) 74.9 78.5 – –Passengers (million) 2,581 2,564 +17 + 0.7 thereof in Germany 2,087 2,075 +12 + 0.6 thereof DB Long-Distance 147.9 142.2 + 5.7 + 4.0Volume sold (million pkm) 97,707 95,854 +1,853 +1.9Volume produced (million train-path km) 781.3 779.0 +2.3 + 0.3R AIL FR EIGHT TR ANSP ORT
Freight carried (million t) 255.5 271.0 –15.5 – 5.7Volume sold (million tkm) 88,237 92,651 – 4,414 – 4.8TR ACK INFR A STRUC TUR E
Punctuality (rail) in Germany 2) (%) 92.9 93.6 – – Punctuality DB Group (rail) in Germany (%) 93.4 93.9 – –Train kilometers on track infrastructure (million train-path km) 1,086 1,073 +13 +1.2 thereof non-Group railways 349.3 331.4 +17.9 + 5.4
Share of non-Group railways (%) 32.2 30.9 – –Station stops (million) 154.1 153.2 + 0.9 + 0.6 thereof non-Group railways 37.0 36.1 + 0.9 +2.5BUS TR ANSP ORT
Passengers 1) (million) 2,087 2,121 –34 –1.6Volume sold 3) (million pkm) 6,942 7,220 –278 –3.9Volume produced (million bus km) 1,602 1,616 –14 – 0.9FR EIGHT FORWAR DING AND LO GISTIC S
Shipments in land transport (thousand) 106,468 100,452 + 6,016 + 6.0Air freight volume (export) (thousand t) 1,304 1,300 + 4 + 0.3Ocean freight volume (export) (thousand TEU) 2,203 2,169 + 34 +1.6
Warehouse space contract logistics (million m²) 8.3 8.0 + 0.3 + 3.8ADDITIONAL KEY FIGUR E S
Order book for passenger transport 1) as of Dec 31 (€ billion) 91.0 94.9 –3.9 – 4.1Length of line operated (rail network) as of Dec 31 (km) 33,440 33,488 – 48 – 0.1Passenger stations as of Dec 31 5,663 5,660 + 3 + 0.1Rating Moody’s/S&P Global Ratings Aa1/AA– Aa1/AA– – –Employees as of Dec 31 (FTE) 318,528 310,935 + 7,593 + 2.4Employee satisfaction (SI) 3.7 – – –Employer attractiveness (rank in Germany) 13 13 – –Share of women in Germany as of Dec 31 (%) 23.2 23.0 – –Specific greenhouse gas emissions in comparison to 2006 (%) –33.2 –29.5 – –Share of renewable energies in the DB traction current mix (%) 57.2 44.0 – –Track kilometers noise remediated in total as of Dec 31 (km) 1,758 1,701 + 57 + 3.4Quiet freight cars in Germany as of Dec 31 50,409 39,604 +10,805 +27.3
1) Previous year’s figure adjusted.2) Non-Group and DB Group train operating companies.3) Excluding DB Arriva.
√

10-year summary
(€ million) 2018 2017 2016 2015 2014 2013 2012 2011 2010 2009
STATEMENT OF IN COME
Revenues 44,065 42,693 40,557 40,403 39,728 39,107 39,296 37,979 34,410 29,335Overall performance 47,156 45,593 43,298 43,102 42,422 41,756 41,910 40,436 36,617 31,271Other operating income 2,998 2,954 2,834 2,772 2,824 2,853 3,443 3,062 3,120 3,864Cost of materials – 22,258 –21,457 –20,101 –20,208 –20,250 –20,414 –20,960 –20,906 –19,314 –15,627Personnel expenses – 17,301 –16,665 –15,876 –15,599 –14,919 –14,383 –13,817 –13,076 –11,602 –11,115Depreciation – 2,688 –2,847 –3,017 – 4,471 –3,190 –3,228 –3,328 –2,964 –2,912 –2,825Other operating expenses – 6,088 – 5,890 – 5,677 – 5,750 – 5,057 – 4,817 – 4,719 – 4,375 – 4,092 –3,360Operating profit (EBIT) 1,819 1,688 1,461 –154 1,830 1,767 2,529 2,177 1,817 2,208Results from investments accounted for using the equity method 12 14 33 22 8 3 14 19 17 9Other financial result – 14 –30 –16 0 –3 –15 –13 3 –23 – 4Net interest income – 645 –704 –772 – 800 – 898 – 879 –1,005 – 840 – 911 – 826Profit before taxes on income 1,172 968 706 – 932 937 876 1,525 1,359 900 1,387Net profit for the year 542 765 716 –1,311 988 649 1,459 1,332 1,058 830Dividend payment (for previous year) 450 600 850 700 200 525 525 500 – –VALUE MANAGEMENT
EBITDA adjusted 4,739 4,930 4,797 4,778 5,110 5,139 5,601 5,141 4,651 4,402EBIT adjusted 2,111 2,152 1,946 1,759 2,109 2,236 2,708 2,309 1,866 1,685Capital employed as of Dec 31 36,657 35,093 33,066 33,459 33,683 33,086 32,642 31,732 31,312 28,596Return on capital employed (ROCE) (%) 5.8 6.1 5.9 5.3 6.3 6.8 8.3 7.3 6.0 5.9Redemption coverage (%) 17.6 18.7 18.1 19.0 20.3 20.8 22.2 22.0 18.8 20.4Net debt/EBITDA (multiple) 4.8 4.5 4.6 4.3 4.0 3.9 3.7 3.8 4.3 4.0C A SH FLOW/C APITAL E XPENDITUR E S
Cash flow from operating activities 3,371 2,329 3,648 3,489 3,896 3,730 4,094 3,390 3,409 3,133Gross capital expenditures 11,205 10,464 9,510 9,344 9,129 8,224 8,053 7,501 6,891 6,462Net capital expenditures 3,996 3,740 3,320 3,866 4,442 3,412 3,487 2,569 2,072 1,813BAL AN CE SHEET A S OF DEC 31
Non-current assets 46,646 45,625 45,290 45,199 45,530 43,949 44,241 44,059 44,530 41,308 thereof property, plant and equipment
and intangible assets 44,487 43,207 42,575 42,821 43,217 41,811 41,816 41,541 42,027 39,509Current assets 11,881 10,811 11,034 10,860 10,353 8,945 8,284 7,732 7,473 5,995 thereof cash and cash equivalents 3,544 3,397 4,450 4,549 4,031 2,861 2,175 1,703 1,475 1,470Equity 13,592 14,238 12,657 13,445 14,525 14,912 14,978 15,126 14,316 13,066 Equity ratio (%) 23.2 25.2 22.5 24.0 26.0 28.2 28.5 29.2 27.5 27.6Non-current liabilities 29,104 27,510 28,525 28,091 28,527 26,284 25,599 24,238 24,762 23,359 thereof financial debt 20,626 19,716 20,042 19,753 19,173 18,066 17,110 16,367 16,394 14,730 thereof pension obligations 4,823 3,940 4,522 3,688 4,357 3,164 3,074 1,981 1,938 1,736Current liabilities 15,831 14,688 15,142 14,523 12,831 11,698 11,948 12,427 12,925 10,878 thereof financial debt 2,618 2,360 2,439 2,675 1,161 1,247 1,503 1,984 2,159 1,780Net financial debt 19,549 18,623 17,624 17,491 16,212 16,362 16,366 16,592 16,939 15,011Total assets 58,527 56,436 56,324 56,059 55,883 52,894 52,525 51,791 52,003 47,303R AIL PER FOR MAN CE FIGUR E S
PA S SENGER TR ANSP ORT
Passengers (million) 2,581 2,564 2,365 2,251 2,254 2,235 2,152 1,981 1,950 1,908 Long-distance transport 148 142 139 132 129 131 131 125 126 123 Regional transport 2,433 2,422 2,226 2,119 2,125 2,104 2,021 1,856 1,824 1,785Volume sold (million pkm) 97,707 95,854 91,651 88,636 88,407 88,746 88,433 79,228 78,582 76,772 Long-distance transport 42,827 40,548 39,516 36,975 36,102 36,777 37,357 35,565 36,026 34,708 Regional transport 54,880 55,306 52,135 51,661 52,305 51,969 51,076 43,663 42,556 42,064FR EIGHT TR ANSP ORT
Freight carried (million t) 255.5 271.0 277.4 300.2 329.1 390.1 398.7 411.6 415.4 341.0Volume sold (million tkm) 88,237 92,651 94,698 98,445 102,871 104,259 105,894 111,980 105,794 93,948INFR A STRUC TUR E
Train kilometers on track infrastructure (million train-path km) 1,086 1,073 1,068 1,054 1,044 1,035 1,039 1,051 1,034 1,003 thereof non-Group railways 349 331 322 290 261 247 231 220 195 170S O CIAL DIMEN SION
Employees (annual average; FTE) 316,901 308,671 302,204 297,170 296,094 293,765 286,237 282,260 251,810 239,888Employees as of Dec 31 (FTE) 318,528 310,935 306,368 297,202 295,763 295,653 287,508 284,319 276,310 239,382Employer attractiveness (rank in Germany) 13 13 16 20 11 21 26 – – –Employee satisfaction (SI) 3.7 – 3.7 – 3.7 – 3.6 – – –ENVIRONMENTAL
Specific greenhouse gas emissions in comparison to 2006 (%) –33.2 –29.5 –27.3 –24.5 –22.8 –18.6 –12.0 – 9.9 –7.8 –3.3Quiet freight cars in Germany as of Dec 31 50,409 39,604 32,396 20,460 14,334 8,408 7,349 – – –
√
To the interactive key figure comparison

DeutscheBahnUniverse
Deutsche Bahn Universe
The enclosure is missing? “Deutsche Bahn Universe” is also available Œonline.

About this reportIntegrated reporting – what does it mean?Integrated reporting is more than just a simple combination of the Annual Report and the Sustainability Report. Our aim is to present a comprehensive and overarching overview of DB Group and the implementation of our sustainable DB 2020+ strategy with its three dimensions: economic ¿, social † and environmental ¥.
How to use this report?In order to simplify use of this report, we have added a few supportive features.
Online reportYou can find an online version and a PDF version on the Internet: Œdb.de/ib-e.
Further information within the reportWe link to additional information contained within a certain section of the Integrated Report, marked as follows: µxxx.
In-depth informationWe highlight individual topics of particular interest to us with an exclamation point.
Critical topicsWe mark important topics with a lightning icon and explain them in greater detail; these topics are critical to our success, but neither we nor third parties are yet performing as required.
This is green.“This is green.” serves to show the milestones and diversity of our green projects. Every project is marked with its own number and a message. We have marked them as follows: project no. XY.
Where is a specific GRI standard covered?The GRI Content Index will show you where you can find information regarding a specific indicator. We have marked the respective locations with the symbol GRI next to the text and listed the indicators below it.
√ Table available online to download The download icon √ indicates that the corre-sponding content can be downloaded online as an Excel file.
Link collectionYou can find further information in the online report on our link page at Œdb.de/links_ir18 or on the Internet. The respective links are marked with the symbol Œterm.
GRI

Contents 1 Becoming better 2 Our Agenda for a Better Railway 4 Expand 12 Improve 20 Digitalize
27 To our stakeholders 28 Chairmanʼs letter 32 Report of the Supervisory Board 36 Corporate Governance report 43 Sustainability management
49 Group management report 50 Fundamentals 65 Targets and strategy 73 Customer and quality 82 Social 88 Environmental 94 Business development 112 Development of business units 166 Opportunity and risk report 174 Events after the balance sheet date 175 Outlook
181 Consolidated financial statements 182 Consolidated statement of income 183 Consolidated balance sheet 184 Consolidated statement of cash flows 185 Consolidated statement of changes in equity 186 Notes to the consolidated financial statements 250 Independent auditor’s report
253 Notes to sustainability 254 Sustainability reporting 254 Compliance 256 Data protection 257 Security 258 Purchase/procurement 259 Deutsche Bahn Foundation 259 Social 263 Environmental 266 Independent Practitioner’s Report
on a Limited Assurance Engagement on Sustainability Information
267 Additional information 268 GRI Content Index 269 UN Global Compact Index 270 Glossary 274 List of abbreviations
Cover U2 At a glance U3 10-year summary U4 Deutsche Bahn Universe U5 Contact information and financial calendar U7 About this report

BECOMING BETTER
OUR AGENDA FOR A
BETTER RAILWAY

Deutsche Bahn AG Management Board (from left to right): Martin Seiler, Berthold Huber, Prof. Dr. Sabina Jeschke, Dr. Richard Lutz (Chairman), Alexander Doll, Ronald Pofalla ΠCVs
The trend toward more railway use continues unabated. One thing is for certain: the railway will
be the mode of transport of the 21st century – reliable, safe, comfortable,
environmentally friendly and digital. Through our Agenda for a Better Railway, we want to
ensure the future viability of DB Group and especially of the integrated rail system.
Our target is becoming better and better for our customers. The first step is our five-point plan,
which should already yield concrete improvements in 2019.
OUR AGENDA FOR A BETTER RAILWAY
Deutsche Bahn Group 2018 Integrated Report

OUR FIVE-POINT PLAN FOR 2019:
EXPAND,IMPROVE, DIGITALIZE
[ 2 ]We are investing more
than ever.
To ensure our long-term, sustainable growth, we
are improving the capacity and availability of
key resources, such as infrastructure, vehicles
and staff.
[ 3 ]We offer more reliable
information and improved comfort.
We want our customers to have a comfortable
journey. For example, new digital services create
more time for on-board train services and
keep customers better informed.
[ 4 ]We are expanding
our offers.
We are consistently broadening our rail offers
while developing new, innovative offers
to complement rail transport.
[ 1 ]We are progressively
improving our punctuality.
We want to offer high levels of punctuality, quality
and reliability. So that we can make improvements right away, we have introduced
comprehensive immediate actions and expect to
achieve a trend reversal.
[ 5 ]We are restructuring
DB Cargo and becoming even greener.
We are working on our target to shift more passenger
and freight transport onto the environmentally
friendly rail. A crucial pre- req uisite for this is
also to improve the perfor- mance capability of
DB Cargo.
3

EXPA
ND
The rail system has a huge amount of potential, but we
are reaching the limits because our growth is leading to
bottlenecks. We need more capacity to cope with the
traffic of today and tomorrow. That is why we are deter-
mined to expansion – in the network, with new trains
and more employees. This forms the basis for our sustain-
able success and further growth.
CAPACIT Y AND
AVAILABILIT Y ARE
THE DECISIVE
FUNDAMENTALS
FOR GROWTH
4
Deu
tsch
e B
ahn
Gro
up —
——
——
——
——
201
8 In
tegr
ated
Rep
ort

5
BECOMING BETTER — ExpaNd

INCREASING NETWORK CAPACITY
The utilization of our rail network capacity has
strongly increased since the 1994 rail reform, with
the intensity of use per track kilometer increasing
by a massive 50 %. Having a high-performance infra-
structure is the key to a stronger shift of traffic
from the road to the rail. We must increase the capac -
ity of our rail tracks accordingly. An essential part
of this is to improve the management of our construc-
tion sites. In the so-called plan corridors we want
to keep to a minimum the effects on the overall system
that spread from sensitive sections.
About
9billion euros will be invested together with the Federal Government in the existing network and in network expansion in 2019 alone.
6
Deutsche Bahn Group 2018 Integrated Report

Over 800construction sites per day are putting pres-sure on our network at peak times. Con- solidated construction sites and professio n - al management, including through our construction management center, help to reduce restrictions caused by construc- tion sites. A special team coordinates all construction activities within DB Group and minimizes daily disruption caused by these activities.
7
BECOMING BETTER — ExpaNd

more trains than ever before need to be able to travel through construction sites. This requires additional staff, the shifting of closure times to peripheral low-traffic regions, and the use of high-performance machines.
1/3
8
Deutsche Bahn Group 2018 Integrated Report

BRINGING MORE TRAINS ONTO THE RAIL
Some of our work to keep our customers’ journeys reliable
includes consistently expanding our long-distance transport
fleet and modernizing existing vehicles. Over the next five
years we will make comprehensive capital expenditures in the
fleets of DB Long-Distance, DB Regional and DB Cargo. In
2019, we will already deploy significantly more trains with the
new ICE 4 and IC 2 trains, as well as through the moderniza-
tion programs for the ICE 3 and IC 1 trains. Through improved
maintenance, we also hope to increase availability. In total,
at least 225 ICE trains are therefore available every day, which
is an increase of 5 %.
137ICE 4 trains will become part of our ICE fleet by 2025. The fleet is currently being expanded.
9
BECOMING BETTER — ExpaNd

More than
200new employees will be hired in 2019 for the improvement of maintenance, includ- ing in our ICE facilities in Hamburg and Cologne. At the same time we are pushing forward the digitalization of mainte- nance processes.
10
Deutsche Bahn Group 2018 Integrated Report

HIRING ADDITIONAL EMPLOYEES
With more employees, we make our products better and more
reliable. In 2019 we will increase the number of employees
in the integrated rail system in Germany by about 8,000. Our
primary focus is on recruiting train drivers, dispatchers,
employees from the construction industry, maintenance tech-
nicians and IT experts. At the same time we will also increase
our capacity in training and development by one-third.
11
BECOMING BETTER — ExpaNd

OUR CUSTOMER S ARE
AT THE CENTER OF WHAT
WE DO. OUR FOCUS:
CUSTOMER AND QUALITY
Our clear target is to increase punctuality, quality and
reliability. Our efforts are primarily focused on improving
the journey experience for our customers, progressively
increasing punctuality, and providing more reliable infor-
mation to our customers throughout the travel chain. We
want to bring more traffic to the environmentally friendly
rail network, particularly in freight transport.
IMPR
OVE
12
Deu
tsch
e B
ahn
Gro
up —
——
——
——
——
201
8 In
tegr
ated
Rep
ort

13
BECOMING BETTER — IMpROvE

About
21percentage points: the level of improve-ment we achieved in the percentage of on-schedule departures at the ten biggest long-distance hub stations with our Plan-Start program. The PlanStart activities were expanded all over Germany, and along- side on-schedule departures, they also focus on hub exits and adherence to stop-ping times at selected stations. In addi- tion, plan corridors were set up to optimize our traffic on highly frequented lines.
MAKING TRAINS MORE PUNCTUAL
Whether it’s regional and long-distance transport or
freight trains, the continuous growth of traffic on the
German rail network needs ever more effective con-
trol and coordination. Our PlanStart teams are a good
example of this. They ensure that trains depart on
schedule. There are additional strains on punctuality
due to the continually increasing levels of construc-
tion activity. By optimizing capacity during con-
struction, including through consolidation, faster con-
struction procedures and additional construction
infrastructure, we can markedly reduce the burden.
14
Deutsche Bahn Group 2018 Integrated Report

90percent of our long-distance trains should depart on schedule from the ten most highly fre-quented long-distance sta- tions. This is thanks to our hub coordinators, who analyze different factors and influences that can cause operational delays and then initiate mea-sures to address them.
15
BECOMING BETTER — IMpROvE

80stations are to be switched over to a new passenger information system by the end of 2019. The new system is consistent with other information channels and has improved displays. By 2024, we plan to switch over more than 6,000 selection dis -plays, about 800 automatic announce-ment systems and all of the about 6,600 dynamic text displays. This will fundamen-tally improve passenger information.
16
Deutsche Bahn Group 2018 Integrated Report

INFORMING CUSTOMERS BETTER
We want to continually modernize and develop stations
as needed. The passenger information of the future project
is about focusing on the central needs of our customers to
have complete, prompt and consistent passenger information
through all information channels. A crucial element of this
project is the complete replacement of the entire backend
system. By further developing IRIS to the new IRIS+ system,
we are investing in an up-to-date and, most importantly,
future-proof system. We will also be introducing a new gener-
ation of displays, monitors and panels at our stations,
which will be installed successively over the coming years.
17
BECOMING BETTER — IMpROvE

80
SHAPING CLIMATE CHANGE
We are drivers of the environmental trans-
port transition in Germany. We fulfill this re-
sponsibility not only by implementing green
measures throughout the entire added
value chain of DB Group, but also by offer -
ing our customers green products and
services. Today, DB Group is already the
largest user of green electricity in Germany.
By 2050, we want to become a climate-
neutral group. In doing so, we make a major
contribution to managing climate change
in Germany.
percent renewable energies is to be achieved by 2030. An addi-tional target for 2030 is to halve the specific greenhouse gas emissions from all global trans-port and stationary facilities in Germany in DB Group com-pared to 2006.
18
Deutsche Bahn Group 2018 Integrated Report

SEIZING GROWTH OPPORTUNITIES
We are driving forward the restructuring of DB Cargo: by
stabilizing production and achieving a more competitive cost
structure, making additional capital expenditures in new
trains, freight cars and green technologies, as well as a sales
campaign, we will bring even more goods onto the rails.
We want to seize growth opportunities, expand our market
share and win new customers.
19
BECOMING BETTER — IMpROvE

THROUGH INNOVATIVE
PLATFOR MS AND SERVICE
OFFER S, WE ARE CREAT-
ING NEW S OLUTIONS FOR
OUR CUSTOMER S
DIG
ITAL
IZE
Digitalization and new technologies are also
changing our core business. We use digitalization
technologies and methods to offer attractive
new products and to strengthen those we already
have. Whether on board the train, at the station
or on the rail, going digital enables us to enhance
or simplify our services. In doing so we increase
our capacity, as well as becoming more environ-
mentally friendly.
20
Deu
tsch
e B
ahn
Gro
up —
——
——
——
——
201
8 In
tegr
ated
Rep
ort

21
BECOMING BETTER — dIGITalIzE

Up to
20
DIGITALIZING THE NETWORK
Not least thanks to new technologies, we are
already creating a more robust rail infrastructure
in the short term to minimize negative impacts on
our customers. The consistent optimization of com-
mand and control technology is playing a particu larly
important role here. Our program Digital Rail for
Germany represents a technological quantum leap
for the entire railway industry.
percent higher capacity in the rail network achieved through a standardized, digital system. Our aim here is to achieve improved performance, better quality, greater effi-ciency and more growth on the rail net-work. Digital rail is also providing a boost for Germany as an industrial location.
22
Deutsche Bahn Group 2018 Integrated Report

23kilometers of the Hamburg S-Bahn (metro) is being pre-pared for highly automated driving by 2021, and four vehi-cles are being equipped with the technol ogy needed to con-trol them digitally.
23
BECOMING BETTER — dIGITalIzE

About
112,000
ENABLING FLEXIBILITY
We want to offer modern, flexible and individual
mobility solutions and services that are accessible
to all. On-demand services such as ioki and Arriva-
Click place customers and their mobility needs at the
center, complementing public transport with inno-
vative and digital services. In Summer 2018, DB Arriva
launched an innovative, demand-based trans-
port system in Liverpool using minibuses, which
also covers John Lennon Airport.
journeys, significantly more than in the previous year, were made with our ioki fleet in 2018. The size of the fleet and the num- ber of journeys made using our new mobility offerings such as ioki are constantly in -creasing, thanks to the expansion of our offers and services.
24
Deutsche Bahn Group 2018 Integrated Report

–90
TESTING INNOVATIVE SOLUTIONS
DB Schenker and Einride have launched the first commer-
cially used, fully electric, autonomous truck on DB Schenker
prop erty in Jönköping, Sweden – the T-Pod. The T-Pod
drives to and from a warehouse entirely autonomously. In
2019, the T-Pod is also set to receive approval for driving
on roads in Sweden, and will then drive autonomously on
public roads for the first time.
percent CO₂ emissions: the result of switching from diesel-powered to electric trucks. The T-Pod operates entirely on batteries.
25
BECOMING BETTER — dIGITalIzE

million comfort check-ins since the service was launched in July 2017. Most of these check-ins were for the Munich — Hamburg line.
Over
2
SIMPLIFYING ACCESS
Whether on board a train or at the station,
we work hard to make our customers more
comfortable, and we make their journeys
easier through digitalization. For example,
we now offer new functions in our travel
apps DB Navigator and DB Route Agent. For
long-distance journeys, comfort check-
in is available for all ICE passengers with a
mobile or online ticket. We are extending
WiFi services on IC trains, local public trans-
port, and at our stations, too.
26
Deutsche Bahn Group 2018 Integrated Report

To our stakeholders
28 Chairmanʼs letter 32 Report of the Supervisory Board
◊ Four ordinary and two extraordinary meetings, one strategy meeting and one two-day strategy retreat
◊ Michael Odenwald elected Chairman of the DB AG Supervisory Board
36 Corporate Governance report ◊ The Corporate Governance report is a component of the Group management report
◊ Good corporate governance is fundamental to the business success of the company
◊ Compliance with recommendations of the Public Corporate Governance Code with one exception
43 Sustainability management ◊ Nine material sustainability topics ◊ Focus on six SDGs ◊ Very good positions in sustainability ratings
TO
OU
R S
TA
KE
HO
LD
ER
SS
US
TA
INA
BIL
ITY
FIN
AN
CIA
L S
TA
TE
ME
NT
SG
RO
UP
MA
NA
GE
ME
NT
RE
PO
RT

Chairman’s letter
DR . RICHARD LUTZ CEO and Chairman of the Management Board
of Deutsche Bahn AG
Deutsche Bahn Group 2018 Integrated Report
28

Ladies and gentlemen,
2018 was an eventful year for Deutsche Bahn. In particular in the railway business – in terms of punctuality and comfort – we had to fight. One thing is clear: we have to get better in 2019. And we are already on the way to a better railway.
Several of our challenges have a common cause: scarce capacity. The sustained growth of rail transport is becoming increasingly noticeable – unfortunately too often our cus-tomers are noticing it, too. The solution: additional capital expenditures. If we want to make the railway more reliable and attractive, we must create more capacity, whether in the infrastructure, in the vehicle fleet or in our staff.
More capacity is the key both to further growth and to good operational quality and high punctuality. Of course, the capital expenditures required are not small. But they are essential if we wish to make the railway system in Germany fit for the future, and create growth and employment.
We at Deutsche Bahn, together with the Supervisory Board and our owner, have therefore made the necessary decisions: in favor of more capacity and availability, additional ex penses to benefit customers and improve quality, and, not least, further capital ex pen ditures in digitalization and innovation. We brought all of this together at the end of 2018 into the Agenda for a Better Railway, a wide-ranging package of measures to achieve real improve-ments, which will also be used as the basis in 2019 of a newly formulated DB Group strategy.
Growth in the rail business provides us with a tailwind: never before have so many people expressed their trust in us. Nearly 148 million customers used our long-distance trains in the year under review. That is about six million more than in the previous year – an increase of four percent. This means that we have again broken the record for the number of passengers in long-distance transport.
The high-speed Berlin — Munich route also contributed to this. One year after the line was given the green light, the new connection has become the number 1 means of transport between the two major cities – beating flying and driving! About 4.9 million passengers traveled on the route – twice the number of the previous year.
2018 was also a demanding year for Deutsche Bahn from an economic perspective. With revenues of about 44 billion euros, we are significantly ahead of the previous year’s figure – to the tune of some 1.3 billion euros. The adjusted EBIT was 2.1 billion euros, and was thus in line with our July forecasts. DB Netze Track, DB Long-Distance and DB Schenker showed particularly strong development.
102-14
GRI
TO
OU
R S
TA
KE
HO
LD
ER
S
29
TO OUR STAKEHOLDERS — CHAIRMAN’S LETTER
FIN
AN
CIA
L S
TA
TE
ME
NT
SS
US
TA
INA
BIL
ITY
GR
OU
P M
AN
AG
EM
EN
T R
EP
OR
T

As I already mentioned above, punctuality failed to meet our expectations in 2018. The average of 93.5 percent achieved did not fully match the 94.1 percent achieved in the previous year. In long-distance transport, annual average punctuality was 74.9 percent and 94.0 percent in regional transport.
In all of the challenges, one thing is clear: people are as mobile as ever. That benefits not only us but also the environment. As a green mode of transport, we make a substantial contribution to the issue of climate change and fulfill our particular responsibilities as a supplier of mobility and logistical services. Our new, ambitious target: to cover a whole 80 percent of our traction current requirement with renewable energies by 2030. In 2018, it was already 57 percent. All the divisions of DB Group in Germany make a contribution here: take, for example, the Hamburg S-Bahn (metro), which since 2018 has been running completely on renewable energies.
At the same time, we are advancing digitalization across our rail network – for example, through the Digital Rail for Germany program jointly initi ated across the sector. In 2018, the first digital interlocking in Europe was put into operation in Annaberg-Buchholz. The project heralded the start of a technological re v olution in command and control technology. It marks the starting point for the further development and nationwide implementation of an innovative generation of interlocking systems. This will make the railway more reliable and high-performing.
Another giant leap towards the improved attractiveness of the railway: we will be investing an additional one billion euros in new and modernized trains for long-distance transport. Spe cifically, we are ordering more ICE 4 trains and extending those we have already or dered. In addition, we are investing in the modernization of ICE 1. For our customers, more and longer trains mean more seats and more comfort as a result of more capacity. We have also agreed a framework contract for up to 100 long-distance trains. As a first batch, we have ordered 23 new trains with a capital expenditure value of about 550 million euros. The first trains should be operational from 2023. This increases the planned mid-term capital expen ditures to more than seven billion euros overall.
We are also forging new paths in how we interface with our customers. Today, the journey to or from the station using the subway, S-Bahn (metro), tram or bus is now included in the train ticket in over 120 German cities. And by integrating ever more transport associa-tions, we are transforming our DB Navigator app into a hub for all local and long-distance transport. In the year under review, we also began offering our customers the comfort check-in function in the app: once checked in, there are no ticket checks on board, making the journey even more relaxing.
Smart mobility offers are also available from ioki, our business division for intelligent on- demand mobility. For the first time, an on-demand offer from ioki provided through the digital on-demand bus in Wittlich was integrated into the existing public passenger
Deutsche Bahn Group 2018 Integrated Report
30

transport system. We currently offer services like these in rural areas, but we are only just getting started in urban areas. For example, in Hamburg we have joined with partners to start an individual shuttle service, which is ordered through an app and offers flexible routes to bring passengers to their destinations, in a process that is fully integrated into the regional transport offer.
DB Regional won a large amount of the regional transport services awarded in 2018. Our aim remains to secure our existing transport contracts and to win new ones. This also requires innovations that excite customers. For example, we are currently trialing free WiFi on the Munich S-Bahn (metro). DB Regional is also continuing to work on the Idea Train (Ideenzug) project that we presented to the public in 2018.
In international logistics we have also established innovations that we are systematically developing further. Thus, DB Schenker and Cisco in Houston have opened a joint Innova-tions Lab, where new technologies in the field of logistics are tested and marketed. Via the eSchenker portal, customers can also configure and order 3D printing.
The DB Cargo freight car fleet in Germany is to be fitted with the latest telematics and sensors by 2020. About 10,000 refitted freight cars are already on the way. The knowledge gained should accelerate the introduction of freight cars that are quieter, more energy efficient and more economic than those currently in operation.
One thing is clear: we are already on the way to the future. In 2019, our focus is on concrete improvements for our customers and on implementing the Agenda for a Better Railway in a disciplined manner. To that end, we and our nearly 198,000 employees in Germany will give our all. And throughout all our efforts, we will always bear the issue of sustainability in mind. For Deutsche Bahn has explicitly committed to the principles of the UN Global Compact.
We have compiled the current integrated report for you with all of the information on the 2018 financial year. At the same time, we are looking forward, too: forward to what moves us and what we want to undertake. For it is our mission to help truly shape the future of mobility and logistics. We look forward to what awaits us!
Sincerely,
Dr. Richard LutzCEO and Chairman of the Management Board of Deutsche Bahn AG
TO
OU
R S
TA
KE
HO
LD
ER
S
31
TO OUR STAKEHOLDERS — CHAIRMAN’S LETTER
FIN
AN
CIA
L S
TA
TE
ME
NT
SS
US
TA
INA
BIL
ITY
GR
OU
P M
AN
AG
EM
EN
T R
EP
OR
T

MICHAEL ODENWALDChairman of the Supervisory Board
of Deutsche Bahn AG
Report of the Supervisory Board
33 Meetings of the Supervisory Board33 Meetings of the Supervisory Board committees34 Corporate governance
34 Annual financial statements35 Changes in the composition of the Supervisory
Board and the Management Board
Deutsche Bahn Group 2018 Integrated Report
32

In the year under review, the Supervisory Board of Deutsche Bahn AG (DB AG) observed the entirety of the responsibil-ities incumbent upon them by virtue of the law, the com-pany’s statutes and its bylaws. The Supervisory Board ex -tensively advised and supervised the Management Board in the management of the company and business opera-tions. The Management Board reported regularly, without delay and in detail to the Supervisory Board regarding cor-porate planning and the economic, strategic and financial development of DB AG and its subsidiaries. All significant business events were discussed by the Supervisory Board and the responsible committees based on reports of the Management Board. Significant deviations in actual busi-ness development were explained by the Management Board and reviewed by the Supervisory Board. The Chair- man of the Supervisory Board maintained close contact at all times with the Chairman of the Management Board, who regularly reported on the latest business developments at DB AG, upcoming business decisions and risk management.
Meetings of the Supervisory Board
The Supervisory Board was involved in all decisions of fun-damental significance for DB AG.
In the year under review, the Supervisory Board held four ordinary meetings and two extraordinary meetings, as well as one strategy meeting and one further two-day strategy retreat. The Supervisory Board also received de -tailed responses to questions on the Stuttgart 21/Wend-lingen — Ulm project and the annual financial statements in two information meetings.
All Supervisory Board members fully participated in at least half of the meetings in the year under review. In the reporting period, any decisions were recorded in written form. Meetings of the Executive Committee, the Personnel Committee and the Audit and Compliance Committee were held in preparation for the meetings of the Supervisory Board of DB AG.
The main issues discussed in the plenary meetings were the development of Deutsche Bahn Group’s (DB Group’s) revenue, profit and employment situation, as well as signif-icant capital expenditure and equity investment projects.
The Supervisory Board regularly discussed the progress and the cost development of the major Stuttgart 21/Wend-lingen — Ulm project in its scheduled meetings and also in one special meeting during the reporting period, on each occasion joined by the Chairman of the Advisory Board of DB Projekt Stuttgart — Ulm GmbH.
In another extraordinary meeting of the Board, Michael Odenwald was elected as Chairman of the Supervisory Board of DB AG, following the departure of the previous Chairman, Prof. Dr. Dr. Utz-Hellmuth Felcht.
As part of the annual strategy meeting, the Board dis-cussed the measures for the railway in Germany to be derived from the Federal Government’s transport policy as set out in the coalition agreement of the 19th legislative period. In addition, the Supervisory Board discussed oper-ational conditions, particularly punctuality and operational quality and the customer and digitalization campaigns in long-distance and passenger transport.
In a further two-day strategy retreat, the Supervisory Board discussed in detail the measures necessary to stabi-lize and improve operational quality. Issues discussed in-cluded the management and improvement of network capacity, improvement of vehicle availability, the economic and operational situation of individual business units and the overarching measures to stabilize and optimize processes.
The Supervisory Board went on to make the necessary decisions, having received appropriate advice on significant individual circumstances, such as the procurement of addi-tional ICE 4 train sets.
In addition, in December 2018, the Supervisory Board provided advice on mid-term planning for 2019 to 2023 for DB Group and approved DB Group’s budget for the 2019 financial year and DB Group’s capital expenditure plan for 2019 to 2023.
Meetings of the Supervisory Board committeesThe Supervisory Board of DB AG has established four per-manent committees to facilitate its work efficiently.
The Supervisory Board’s Executive Committee met six times in the year under review and was in regular contact with the Management Board regarding all major business policy issues. In its meetings, it focused in particular on preparing the focal topics for each of the Supervisory Board meetings.
102-18
GRI
!!!!!!
TO
OU
R S
TA
KE
HO
LD
ER
S
33
TO OUR STAKEHOLDERS — REPORT OF THE SUPERvISORY BOARD
FIN
AN
CIA
L S
TA
TE
ME
NT
SS
US
TA
INA
BIL
ITY
GR
OU
P M
AN
AG
EM
EN
T R
EP
OR
T

The Audit and Compliance Committee met six times in the year under review, addressing, in particular, the current economic situation of DB Group and of individual business units, the risk reporting, and the quarterly and half-year financial statements. The Audit and Compliance Committee discussed the progress and cost development of the major Stuttgart 21 project on the basis of the quarterly reporting from the Management Board, which was accompanied by a review from the auditors and an engineering firm, and, in a separate meeting, advised in detail on the further devel-opment of reporting to the Supervisory Board and the com-mittee. In its December meeting, the committee also dis-cussed in detail the budget and capital expenditure plan submitted and the mid-term planning of DB Group. The situation of another major capital expenditure project – the S21 section of the Berlin S-Bahn (metro) – was submitted for separate review and discussed in detail by the com-mittee. The committee also continued to address updates in corporate governance and the internal control system necessitated by the Accounting Law Modernization Act (Bilanzrechtsmodernisierungsgesetz; BilMoG). The Audit and Compliance Committee also received regular infor-mation on compliance-related investigations and in ternal audit findings. In addition, the committee discussed the hiring of the auditor for the financial statements and the progress of the auditing process for the reporting period. The committee also received information on economically significant individual circumstances, such as on the vehicle situation at DB Regional (once again taking up an issue that had already been considered in 2018), the changes in staff- ing requirements and availability, staff management key indicators, and questions on IT governance, the IT project portfolio and cybersecurity. The Chairman of the Audit and Compliance Committee was in regular contact with the Man agement Board and the external auditor, and reported regularly and in detail on the committee’s work to the full Supervisory Board.
In the year under review, the Personnel Committee held four regular meetings and two extraordinary meetings or telephone conferences to prepare Management Board- related matters for discussion by the Supervisory Board, and discussed questions regarding compensation for the members of the Management Board, and prepared the cor-responding resolutions for the Supervisory Board as a result.
The Mediation Committee established in accordance with section 27 (3) of the Co-Determination Act (Mitbestimmungs- gesetz; MitbestG) did not have occasion to meet in the year under review.
Corporate governance
During the year under review, the Management Board and Supervisory Board of DB AG again considered the further development of corporate governance. In a Cabinet deci-sion on July 1, 2009, the Federal Government adopted the Public Corporate Governance Code (PCGK). The PCGK sets out the essential provisions of applicable law governing the management and monitoring of non-listed companies in which the Federal Republic of Germany holds a majority stake, while outlining the internationally and nationally acknowledged principles of good and responsible corporate governance. The Supervisory Board of DB AG dealt with the application of the PCGK within DB Group and adopted the necessary resolutions.
Annual financial statements
The annual financial statements and management report of DB AG, as prepared by the Management Board, and the consolidated financial statements and Group management report for the period ending on December 31, 2018 were audited and awarded an unqualified audit opinion by Price-waterhouseCoopers GmbH Wirtschaftsprüfungsgesellschaft (PwC), the auditor appointed by resolution of the Annual General Meeting. The auditor also reviewed the risk man-agement system as part of the annual audit of the financial statements, noting no objections.
The auditors’ report was reviewed by the Audit and Compliance Committee in its meeting held on March 22, 2019, and was discussed in full at the Supervisory Board’s financial statements meeting held on March 27, 2019 in the presence of the auditors who signed the audit reports. The auditors reported on the salient audit findings and were available to answer questions. The Supervisory Board con-curred with the audit findings.
!!! !!!
Deutsche Bahn Group 2018 Integrated Report
34

The Supervisory Board reviewed the annual financial state-ments and management report of DB AG, the consolidated financial statements and Group management report for the year under review, and the proposal for the disposition of profit, noting no objections. The DB AG annual financial statements for the 2018 financial year were approved and thereby adopted.
The auditor additionally reviewed the report on rela-tionships with affiliated companies prepared by the Man-agement Board. The auditors issued an unqualified audit opinion and reported on their audit findings.
The Supervisory Board also reviewed this report, raising no objections concerning the Management Board’s con-cluding declaration contained in the report or the result of the audit conducted by PwC.
Changes in the composition of the Supervisory Board and the Management Board
In the reporting period, the following changes were made in the Management Board and Supervisory Board of DB AG:
Martin Seiler took up his position as member of the Man agement Board responsible for Human Resources and Legal Affairs on January 1, 2018. Alexander Doll took up his position as member of the Management Board responsible for Freight Transport and Logistics on April 1, 2018. Both Board members were appointed previously in 2017. Since January 1, 2019, Alexander Doll has been managing the Finance, Freight Transport and Logistics Board division of DB Group, following the merging of the finance functions previously managed by the Board division of the CEO with the business units of the Freight Transport and Logistics division.
Prof. Dr. Dr. Utz-Hellmuth Felcht resigned his mandate on the Supervisory Board of DB AG and position as Chair- man of the Supervisory Board as of the end of March 31, 2018. Following his resignation from the Federal Ministry of Transport and Digital Infrastructure (Bundesministerium für Verkehr und digitale Infrastruktur; BMVI), the second-ment of former Secretary of State Michael Odenwald to the Supervisory Board of DB AG was terminated with effect from the end of April 10, 2018. He was appointed member of the Supervisory Board of DB AG during the extraordinary Annual General Meeting on April 10, 2018 with effect from April 11, 2018 and succeeded Prof. Felcht; and in the extraordinary meeting of the Supervisory Board of DB AG on April 17, 2018, he was elected Chairman of the Supervi-sory Board of DB AG for the duration of his term.
As successor to former Secretary of State Michael Odenwald, Secretary of State Guido Beermann (BMVI) was seconded to the Supervisory Board of DB AG with effect from April 11, 2018. In the context of his resignation from the Federal Ministry of Economics and Energy (Bundesministerium für Wirtschaft und Energie; BMWi), Parliamentary State Secre-tary Uwe Beckmeyer resigned from the Supervisory Board of DB AG with effect from April 30, 2018. His position on the Supervisory Board of DB AG was succeeded by Parliamentary Secretary of State Oliver Wittke (BMWi) with effect from July 31, 2018. Dr. Michael Frenzel and Dr. Jürgen Großmann both resigned their mandates on the Supervisory Board of DB AG with effect from the end of July 18, 2018. Their suc-cessors, Eckhardt Rehberg (Member of the Federal Parlia-ment) and Stefan Müller (Member of the Federal Parliament), were elected as members of the Supervisory Board of DB AG at the extraordinary Annual General Meetings of September 20, 2018 and November 20, 2018 respectively. Ludwig Koller resigned his Supervisory Board mandate with effect from July 31, 2018. As successor, Jürgen Knörzer was appointed as a member of the Supervisory Board by judicial decision of the Regional Court of Charlottenburg (Amtsgericht Char-lottenburg) with effect from September 11, 2018.
The Supervisory Board thanks the departing members of the Supervisory Board for their committed and construc-tive support of the company.
The Supervisory Board would also like to thank the Management Board, the employees and the works council representatives of DB AG and affiliated companies for their achievements in the year under review.
Berlin, March 2019
For the Supervisory Board
Michael OdenwaldChairman of the Supervisory Boardof Deutsche Bahn AG
!!!!!! !!!
TO
OU
R S
TA
KE
HO
LD
ER
S
35
TO OUR STAKEHOLDERS — REPORT OF THE SUPERvISORY BOARD
FIN
AN
CIA
L S
TA
TE
ME
NT
SS
US
TA
INA
BIL
ITY
GR
OU
P M
AN
AG
EM
EN
T R
EP
OR
T

Corporate Governance report
36 Statement of compliance36 Cooperation between the Management
Board and Supervisory Board38 Transparency38 Risk management
38 Compliance38 Accounting and auditing38 Efficiency audit of the Supervisory Board39 Compensation report
Corporate governance rules are intended to ensure good, responsible, value-focused corporate management. On July 1, 2009, the Federal Government adopted the Public Cor-porate Governance Code (PCGK) regulating the principles of good corporate and investment management. The PCGK sets out the essential provisions of applicable law governing the management and monitoring of non-listed companies in which the Federal Republic of Germany holds a majority stake, while outlining the internationally and nationally acknowledged principles of good and responsible corpo-rate governance. The objective of the PCGK is to make the corporate management and oversight of companies more transparent and easier to understand as well as to establish more precisely the role of the Federal Government as a share-holder in such companies. Concurrently, the intention is to increase awareness of good corporate governance.
We are convinced that good corporate governance is fundamental to the success of DB Group. Our aim is to sus-tainably increase the enterprise value so as to promote the interests of customers, business partners, investors, em -ployees and the public, while maintaining and expanding trust in DB Group.
Statement of compliance
The Management Board and Supervisory Board of DB AG jointly state:
“Since the last statement of compliance was published on March 21, 2018, DB AG has complied with the recommen-dations adopted by the Federal Government on July 1, 2009 concerning the PCGK, with the exception of point 3.3.2 (the insurance deductible when taking out D & O liability insur-ance for the Supervisory Board). DB AG will continue to comply with the recommendations of the PCGK in the future, with the exception mentioned above until a decision is reached concerning deductibles for the Supervisory Board.”
Cooperation between the Management Board and Supervisory Board
As a German Aktiengesellschaft (joint stock corporation), DB AG is subject to a two-tier management and monitoring structure in the form of the Management Board and Super-visory Board. These two bodies are strictly segregated in terms of both their membership and their competencies. The Management Board manages the company solely on its own joint responsibility. The Supervisory Board moni-tors the activities of the Management Board and is respon-sible for appointing members to, and dismissing members from, the Management Board.
In the interests of optimum company management, we see it as very important for the Management Board and the Supervisory Board to maintain continuous dialog with each other and to work together efficiently and in an atmosphere of mutual trust for the benefit of the company. The Manage-ment Board provides the Supervisory Board with regular, prompt, comprehensive information on all matters rel evant to the company, particularly those concerning plan ning, business development, risk position and risk management, as well as the internal control system.
An overview of the members of the Management Board
and of the Supervisory Board µ247 ff. of DB AG, including the mandates they hold, is provided in the Notes to the consol-idated financial statements.
Management BoardThe Management Board manages the company solely on its own joint responsibility. It is required to safeguard the interests of the company and is committed to achieving the sustainable growth of enterprise value. It specifies the busi-ness goals and defines the strategies to be implemented in order to attain these targets. The Management Board is re sponsible for making decisions on all matters of funda-mental and key importance for the company.
102-16102-18
GRI
Deutsche Bahn Group 2018 Integrated Report
36

Martin Seiler took up his position as member of the Manage- ment Board responsible for Human Resources and Legal Affairs on January 1, 2018. Alexander Doll took up his posi-tion as member of the Management Board responsible for Freight Transport and Logistics on April 1, 2018. Both Board members were appointed previously in 2017. Since January 1, 2019, Alexander Doll has been managing the Finance, Freight Transport and Logistics Board division of DB Group, following the merging of the finance functions previously managed by the Board division of the CEO with the busi-ness units of the Freight Transport and Logistics division.
The Management Board of DB AG therefore continues to consist of six divisions. In addition to the Board division of the CEO, the Management Board is also responsible for the “Human Resources and Legal Affairs,” “Digitalization and Technology,” “Passenger Transport,” “Finance, Freight Trans-port and Logistics,” and “Infrastructure” Board divisions.
Management Board members must discuss any conflicts of interest with the Supervisory Board immediately and must also provide their colleagues on the Management Board with information about any such conflicts. There were no conflicts of interest during the year under review.
Supervisory BoardThe Supervisory Board advises and monitors the Manage-ment Board in its management of the company.
In line with the requirements of the Co-Determination Act (Mitbestimmungsgesetz; MitbestG), the Super visory Board of DB AG consists of 20 members, of whom ten members are shareholders’ representatives and ten members are em -ployee representatives. Some of the share hold ers’ represen-tatives are seconded to the Supervisory Board and some are elected at the Annual General Meeting. The em ployees’ representatives on the Supervisory Board are elected in line with the requirements of the Co-Determination Act.
The Chairman of the Supervisory Board of DB AG is Michael Odenwald as of April 17, 2018, following the resig-nation of the previous Chairman, Prof. Dr. Dr. Utz-Hellmuth Felcht as of the end of March 31, 2018. The personal or business relations of individual members of the Supervisory
Board of DB AG µ236 are given in the Notes to the consoli-dated financial statements.
Supervisory Board members must immediately disclose any conflicts of interest with the Supervisory Board and must also provide the Supervisory Board with information about any such conflicts. In the reporting period, no such incidents arose.
Transactions of fundamental importance and other Manage-ment Board decisions with a major impact on the business operations and on the assets, financial or income situation of DB Group require the authorization of the Supervisory Board. The Management Board reports to the DB Supervi-sory Board on the development of business and the position of DB Group at least once every quarter. The Management Board also reports to the Supervisory Board regularly on all measures implemented within DB Group that are inten ded to ensure compliance with laws and corporate regulations. In addition, the tasks of the Supervisory Board in clude the auditing and approval of DB AG’s annual financial state-ments and the auditing of DB AG’s management report, the consolidated financial statements, and the DB Group man-agement report. The Supervisory Board also monitors the accounting process, the effectiveness of the internal con-trol system, the risk management system and the internal audit system, as well as the process of auditing the annual financial statements.
In addition, the Chairman of the Supervisory Board is in regular contact with the Management Board and particularly the Chief Executive Officer to discuss company strat egy, business development and risk management. The Chairman of the Supervisory Board receives regular reports from the Chief Executive Officer on all events that are of key impor-tance for assessing the company’s situation and develop-ment, as well as for its management.
There were no consultancy agreements or other com-parable service agreements or contracts for services be -tween the members of the Supervisory Board and DB AG in the year under review.
Supervisory Board committeesIn order to enable it to carry out its monitoring activities to the best of its abilities, the Supervisory Board of DB AG has made use of the option of setting up further committees in addition to the Mediation Committee, which has to be set up in accordance with the Co-Determination Act, and has set up an Executive Committee, an Audit and Compliance Committee and a Personnel Committee. An overview of the committee members µ249 can be found in the Notes to the consolidated financial statements. Details of the work per-
formed by the individual committees µ33 f. in the year under review are included in the report of the Supervisory Board. ŒDetails of the functions of the individual committees can be found on our Web site.
!!! !!!
TO
OU
R S
TA
KE
HO
LD
ER
S
37
TO OUR STAKEHOLDERS — CORPOR ATE GOvERNANCE REPORT
FIN
AN
CIA
L S
TA
TE
ME
NT
SS
US
TA
INA
BIL
ITY
GR
OU
P M
AN
AG
EM
EN
T R
EP
OR
T
Share of women on the Management Board and Supervisory BoardFive women currently serve on the Supervisory Board of DB AG. A target of a 30% share of women on the Supervisory Board of DB AG was set, with a deadline of June 30, 2022.
One woman currently serves on the Management Board of DB AG. A target of a 30% share of women on the Manage-ment Board of DB AG was set, with a deadline of June 30, 2022.
At the other management levels of DB AG, the following targets have been set (deadline December 31, 2020): at the first management level below the Management Board a 25.5% share of women, and at the second management level below the Management Board a 28.6% share of women.
Transparency
All important information regarding the consolidated and annual financial statements, the interim report, the financial calendar and information on security transactions subject to a reporting obligation can be found on our ŒWeb site. In addition, we provide regular information on current devel-opments within the framework of our investor relations activities and corporate communication.
Risk management
Good corporate management also encompasses a responsi- ble approach to the risks and opportunities arising in connec- tion with business operations. The early identification and limitation of business risks is therefore of paramount im por- tance to the Management Board and the Supervisory Board.
The Management Board is responsible for ensuring ade-quate risk management and monitoring it within the com-pany, and for continuously improving both. The Accounting Law Modernization Act (Bilanzrechtsmodernisierungs-gesetz; BilMoG) precisely defines the responsibilities of the Supervisory Board with regard to monitoring theaccounting process and ensuring the effectiveness of the internal control system, the risk management system and the internal audit system. For the Supervisory Board to be able to discharge this responsibility, it must be provided with suitable infor-mation based on which it can form an opin ion on the ad e-quacy and effectiveness of the sys tems. Regular reports are made to the Audit and Compliance Committee concern ing the adequacy and effectiveness of the internal control sys-tem. In addition, the Management Board reports to the Audit and Compliance Committee regarding risks of major importance to the Group companies and the handling of
these risks by the Management Board. It also controls whether the early warning system for risks meets the requirements of section 91 (2) of the Stock Corporation Act (Aktien gesetz; AktG).
Compliance
Compliance is an integral component of the corporate and leadership culture in DB Group. To us, compliance means ensuring our business activities comply with the relevant laws and regulations that apply to them.
Our compliance activities focus on preventing and con-sistently combating corruption and other corporate crime. Mandatory compliance policies serve to protect DB Group, our employees and our executives. Increasing awareness among our employees and executives remains of great importance, because only risk-aware employees can recog-nize risks and successfully avoid or, at least, minimize them.
The compliance work of DB Group includes the early detection of compliance risks as well as the introduction of relevant countermeasures. This work includes conducting compliance programs, constant communication and pro-cess improvements.
Additional information on the subject of Œcompliance can be found in the Notes to sustainability µ253 f. and on our Web site.
Accounting and auditing
On March 21, 2018, the Annual General Meeting of DB AG appointed PwC, Berlin, as auditor for the 2018 financial year. The Audit and Compliance Committee prepared the proposals of the Supervisory Board regarding the election of the auditor and, following the election of the auditor by the Annual General Meeting, defined the key audit aspects in conjunction with the auditor. Once again this year it was agreed with the auditor that the Chairman of the Audit and Compliance Committee will be notified immediately of any possible reasons for exclusion or prejudice that emerge in the course of the audit. It was also agreed that the Chair- man of the committee will be notified immediately by the auditor of any separate findings and any irregularities in the statement of compliance.
Efficiency audit of the Supervisory BoardThe Supervisory Board regularly monitors the efficiency of its activities. An efficiency audit is carried out every two years. The efficiency audit was last carried out in 2017.
405-1
GRI
Deutsche Bahn Group 2018 Integrated Report
38

Compensation report
The compensation report outlines the compensation sys-tem and lists the individual compensation of the members of the Management Board and the Supervisory Board.
The compensation system of the Management Board The compensation system for the Management Board of DB AG aims to provide appropriate compensation to the Management Board members in accordance with their duties and areas of responsibility, while at the same time directly taking into account the performance of each Management Board member and the success of the company.
The appropriate level of compensation is reviewed reg-ularly using a comparison process. This review examines the level of Management Board compensation both in compar-ison to the external market (horizontal appropriateness) and in comparison to other levels of compensation within the company (vertical appropriateness). If the review shows a need to adjust the compensation system or the level of compensation, the Personnel Committee of the Supervisory Board submits its proposals in this regard to the Supervi-sory Board for approval. The appropriateness of Manage-ment Board compensation was last reviewed in 2016.
Compensation componentsThe total compensation for Management Board members consists of a fixed salary, a performance-linked annual di -rec tor’s fee and a long-term incentive plan based on multi-year figures. Total compensation also includes benefit com-mitments, other commitments and ancillary benefits.
The fixed salary is cash compensation linked to the financial year. It is based on the scope of responsibility and the experience of each Management Board member. The individually defined fixed income is paid out in 12 equal installments.
The annual performance-linked director’s fee is calcu-lated using a factor linked to the achievement of business targets (director’s fee factor) and the achievement of indi-vidual targets (performance factor). There is a multiplica-tive link between the director’s fee factor and the perfor-mance factor. The director’s fee factor depends on the level of success in attaining the business targets set out by cor-porate planning. The parameters for this relationship are in equal parts operational success (operating income after interest) and return on capital employed (ROCE).
The performance factor reflects success in meeting per-sonal targets. The target fee corresponds to the annual di -rector’s fee paid to the Management Board member in a “normal financial year” for fully meeting performance targets
(meeting targets). If the Group results do not meet planned objectives, the director’s fee factor can, in extreme cases, be reduced to zero, regardless of personal performance. This means that the annual director’s fee can be zero. If plan ned objectives are sufficiently exceeded and the max-imum performance factor is also achieved, the annual direc-tor’s fee can amount to 2.6 times the target director’s fee.
The business and personal targets of the Management Board members are decided by the Supervisory Board each year based on recommendations from the Personnel Com-mittee, and are then agreed in writing with the Manage-ment Board members.
Together with the corporate planning adopted by the Supervisory Board, the personal targets form the basis for assessing the annual director’s fee. This means that all of the key parameters for total compensation are established at the beginning of the financial year.
At the end of each financial year, the director’s fee and the personal performance factor are calculated for each Management Board member based on Group results. Target income is attained if both business goals and individual targets have been met in full. The final decision on this matter is made by the Supervisory Board and is prepared by the Personnel Committee.
The methodology for calculating the long-term incen-tive plan for the Management Board has been changed since the 2017 tranche. The basis for assessing the long-term element of compensation is now a customary return on cap ital, based on equity value. Aligning the long-term in -centive to the equity value rewards sustainable increases in the value of the company. After the end of each planning period, the increase in value achieved in comparison to the company’s original planning and the payment factor are calculated. The term of each plan is four years. The pay-ment amount for the long-term incentive plan has an upper limit and can vary between 0% and 250%. Claims from the long-term incentive plan are inheritable.
The Management Board members are entitled to an ap -propriate severance package if their contract is terminated before the contractually stipulated termination date, pro-vided that the Management Board member was not person-ally responsible for the termination through his or her actions. The severance package is based on the remaining term of the contract, the agreed target salary and, where applicable, the pension benefits already owed by DB AG for the remainder of the contract.
TO
OU
R S
TA
KE
HO
LD
ER
S
39
TO OUR STAKEHOLDERS — CORPOR ATE GOvERNANCE REPORT
FIN
AN
CIA
L S
TA
TE
ME
NT
SS
US
TA
INA
BIL
ITY
GR
OU
P M
AN
AG
EM
EN
T R
EP
OR
T

In accordance with the recommendations of the PCGK, a severance payment cap is included in all contracts of DB AG Management Board members. This cap means that pay-ments made to a Management Board member due to pre-mature termination of Management Board duties without good cause as defined by section 626 of the Civil Code (Bürgerliches Gesetzbuch; BGB) cannot exceed the value of two years’ salary, including variable compensation com-ponents, and must not provide compensation for more than the remaining term of the employment agreement.
Management Board members do not receive any addi-tion al compensation for mandates exercised in control bodies of Group companies or affiliated companies.
Group-wide compensation system for executivesThe compensation system for executives aims primarily to closely link compensation to the sustainable success of the company in the sense of the business success of the inte-grated rail system and of the Group as well as the alignment of all divisions toward this objective.
The annual director’s fee for executives and employees not subject to wage agreements in the integrated rail sys-tem are structured as profit shares. Personal goals are then agreed with executives as part of a regular process. The achievement of the goals is regularly included in the assess-ment when making decisions on increases to the fixed salary.
If the executives are members of bodies of DB AG sub-sidiaries, the respective subsidiary’s Supervisory Board is responsible for discussing the personal goals if possible until the end of a financial year. Where applicable, the respective decision-making will take place after the DB AG Supervisory Board meeting in which the mid-term planning and the targets for the Group’s Management Board are adopted. This chronological sequence of the handling of personal goals in the Supervisory Boards of the subsidiaries is due to the Group structure of DB AG.
In some cases, given the regulatory requirements, DB Netz AG is subject to separate regulatory requirements which take even greater account of the business success of DB Netz AG.
Pension entitlementsThe Supervisory Board of DB AG has set a general retire-ment age of 65 for Management Board members. After leaving the company, Management Board members are entitled to pension payments. At the latest upon reaching
the age of 65, a Management Board member is entitled to a lifelong pension if the term of employment ends due to permanent invalidity, or if the contract is terminated before the agreed termination date or is not extended, where the Board member was not responsible for the termination, or if the Management Board member refuses to continue the contract under the same or more beneficial conditions.
The system governing benefit commitments to Manage-ment Board members was amended in 2017. Members appointed to the Management Board for the first time in 2017 and thereafter receive a defined benefit commitment under which a capital stock is saved up for the Board mem-ber for the duration of their employment and paid out when they reach retirement age. An annual amount derived as a specific percentage of fixed salary is paid into the de fined contribution plan.
Company pension commitments for Management Board members already in office are based on a percentage of the basic salary depending on the length of time that the Man-agement Board member has been with the company. Pen-sion commitments include lifelong retirement and surviving dependent benefits. There is no lump-sum payment option.
In addition to Management Board member contracts entered into before January 1, 2009, a reinsurance policy was concluded to cover company pension benefits.
Contractual ancillary benefitsThe contractual ancillary benefits for members of the Man-agement Board include a company car with driver for busi-ness and personal use, a personal BahnCard 100 First free travel card and standard insurance coverage. A housing allowance is provided for second homes where these are re quired for business purposes. Where these monetary benefits cannot be granted on a tax-free basis, they are taxed as non-monetary benefits for which the Management Board members are fully responsible. Management Board members, like any other member of the Group’s executive staff, can choose to take part in the company’s deferred compensation program.
The members of the Management Board are covered by liability insurance against financial losses incurred due to DB AG’s business operations (D & O insurance). In the year under review, this insurance was designed as a Group insur-ance policy with the deductible provided for under law; it provides coverage for financial losses that may occur during the performance of Management Board activities. The in-surance coverage of the existing D & O insurance policy is valid for a period of five years after the termination of activ-ities as a member of the Management Board.
!!!!!! !!!
Deutsche Bahn Group 2018 Integrated Report
40

Total compensation of the Management Board (€ thousand)
Fixed compensation
Compen- sation in
connection with the early
termination of service
Variable compensation
Other 3) Total 4)Short-term 1)
Long-term (payment
in 2018) Long-term 2)
Incumbent members of the Management Board of DB AG as of Dec 31, 2018
Dr. Richard Lutz 900 – 892 – 107 17 1,809
Ronald Pofalla 650 – 560 – 185 31 1,241
Berthold Huber 650 – 560 – 185 28 1,238
Martin Seiler 400 394 225 28 822
Alexander Doll 300 – 256 – 206 22 579
Prof. Dr. Sabina Jeschke 400 – 394 – 142 16 810
Total 3,300 – 3,055 – 1,049 143 6,498
Individual figures are rounded and therefore may not add up.1) Subject to the decision of the Supervisory Board.2) Long-term variable compensation refers to additions to and releases of provisions for long-term incentives (LTI).3) Monetary benefits accruing from travel discounts, usage of company cars, and insurance and housing allowances.4) Total without long-term variable compensation.
In the year under review, no members of the Management Board of DB AG received benefits or promises of benefits from a third party with regard to their activities as a mem-ber of the Management Board.
Pension benefits for the Management Board for the 2018 financial year During the year under review, an amount totaling € 1,222 thousand was added to the pension provisions.
Additions to pension provisions (€ thousand) 2018
IN CUMBENT MEMBER S OF THE MANAGEMENT B OAR D OF DB AG A S OF DEC 31 , 201 8
Dr. Richard Lutz 236
Ronald Pofalla 0
Berthold Huber 471
Martin Seiler 202
Alexander Doll 136
Prof. Dr. Sabina Jeschke 177
Total 1,222
Pension provisions for former members of the Management
Board µ236 are shown in total in the Notes to the consoli-dated financial statements.
Compensation of the Supervisory Board for the 2018 financial yearCompensation of the Supervisory Board of DB AG was most recently regulated by the Annual General Meeting resolu-tion of September 21, 2010. In addition to being reimbursed for their cash outlays and the value-added tax due on their compensation and cash outlays, the Supervisory Board mem- bers each receive fixed annual compensation of € 20,000, plus performance-linked annual compensation. The perfor-mance-based compensation is calculated based on the rela-tionship between operating profit (EBIT) as disclosed in the consolidated financial statements for the financial year com-pared to the previous year’s figures, and the attaining of specific operational performance figures. Performance- based compensation is limited to a maximum of € 13,000. The Chairman of the Supervisory Board receives twice this amount, while his deputy receives one and a half times the above figure. This compensation is increased by a quarter for every position held on a committee by the individual Supervisory Board member. This compensation increases by 100% for the Chairman of the Executive Committee and the Chairman of the Audit and Compliance Committee, and by 50% for the Chairman of the Personnel Committee. This does not include membership or chairmanship of the committee that is formed under the terms of section 27 (3) MitbestG.
!!!
Compensation for the 2018 financial yearThe director’s fee for the previous financial year is due at the end of the month in which the company’s Annual Gen-eral Meeting takes place.
The members of the DB AG Management Board will receive the following compensation for their work during the year under review:
!!!
TO
OU
R S
TA
KE
HO
LD
ER
S
41
TO OUR STAKEHOLDERS — CORPOR ATE GOvERNANCE REPORT
FIN
AN
CIA
L S
TA
TE
ME
NT
SS
US
TA
INA
BIL
ITY
GR
OU
P M
AN
AG
EM
EN
T R
EP
OR
T

In addition, the members of the Supervisory Board of DB AG receive an attendance fee of € 250 for each meeting of the Supervisory Board and its committees at which they are present. The members of the Supervisory Board also have the choice between a personal BahnCard 100 First and five free train tickets.
The members of the Supervisory Board are covered by liability insurance against financial losses incurred due to DB AG’s business operations (D & O insurance). This insur-ance is designed as a Group insurance policy with no de-ductible and provides coverage for financial losses that may occur during the performance of Supervisory Board activi-ties. There is also a Group accident insurance policy in place for members of the Supervisory Board. The relevant company pays the premiums for these policies.
Supervisory Board members who have only been mem-bers for part of the respective financial year receive a twelfth of the total compensation for each month or part of a month of their membership. This rule also applies to the increase in compensation for the Chairman of the Supervisory Board and his or her deputy and to the increase in compensation for membership and chairmanship of a Supervisory Board committee.
Compensation is paid after the conclusion of the Annual General Meeting that votes to ratify the Supervisory Board’s activities in the previous financial year.
Taxes due on compensation received, including the per-sonal BahnCard 100 First and the five free train tickets, are the individual responsibility of each Supervisory Board member.
Supervisory Board members currently hold no shares in the company, nor do they hold options entitling them to purchase shares in the company.
Subject to the approval of the activities of the Supervi-sory Board by the Annual General Meeting on March 27, 2019, the members of the Supervisory Board of DB AG will receive the following compensation for their work during the year under review:
Total compensation of the Supervisory Board (€ thousand)
Annual compensation 2018
Fixed compen-
sation
Variable compen-
sation
Atten- dance
feeAncil-
lary fee Total
IN CUMBENT MEMBER S OF THE SUPERVI S ORY B OAR D OF DB AG A S OF DEC 31 , 201 8 1)
Michael Odenwald 61.7 18.5 3.8 0.9 84.8
Alexander Kirchner 40.0 12.0 3.5 7.2 62.7
Guido Beermann 26.3 7.9 2.8 – 36.9
Jürgen Beuttler 20.0 6.0 2.0 – 28.0
Dr. Ingrid Hengster 20.0 6.0 1.8 – 27.8
Jörg Hensel 25.0 7.5 3.0 0.9 36.4
Dr. Levin Holle 20.0 6.0 3.0 – 29.0
Klaus-Dieter Hommel 20.0 6.0 1.3 7.2 34.5
Prof. Dr. Susanne Knorre 20.0 6.0 2.0 7.2 35.2
Jürgen Knörzer 6.7 2.0 0.8 – 9.4
Dr. Jürgen Krumnow 40.0 12.0 3.0 0.9 55.9
Kirsten Lühmann 20.0 6.0 2.0 0.9 28.9
Heike Moll 20.0 6.0 1.8 7.2 35.0
Stefan Müller 3.3 1.0 0.5 – 4.8
Eckhardt Rehberg 6.7 2.0 0.8 – 9.4
Mario Reiß 20.0 6.0 1.8 7.2 35.0
Regina Rusch-Ziemba 25.0 7.5 2.5 7.2 42.2
Jens Schwarz 30.0 9.0 3.5 7.2 49.7
Veit Sobek 20.0 6.0 2.0 7.2 35.2
Oliver Wittke 2) 10.0 3.0 – – 13.0MEMBER S WHO LEF T THE SUPERVI S ORY B OAR D OF DB AG DUR ING THE YE AR UNDER R EVIE W 1)
Uwe Beckmeyer 6.7 2.0 0.8 – 9.4
Prof. Dr. Dr. Utz-Hellmuth Felcht 17.5 5.3 1.0 – 23.8
Dr. Michael Frenzel 11.7 3.5 0.8 – 15.9
Dr. Jürgen Großmann 11.7 3.5 1.0 – 16.1
Ludwig Koller 11.7 3.5 0.5 – 15.7
Compensation for further Supervisory Board mandates in DB subsidiaries 90.3
Total 865.0
Individual figures are rounded and therefore may not add up. 1) Some Supervisory Board members state that their compensation is to
be donated to the Hans Böckler Foundation in line with the directive of the German Trade Union Confederation (Gewerkschaftsbund).
2) Parliamentary Secretary of State Wittke did not accept the compensation for his activities as member of the Supervisory Board.
There are no pension obligations for members of the Super-visory Board.
The members of the Supervisory Board did not receive any compensation in the year under review for any person-ally provided services.
!!!
Deutsche Bahn Group 2018 Integrated Report
42

Sustainability management
43 Materiality through focusing44 Sustainability organization
45 Social acceptance resulting from open stakeholder dialog
47 Responsibility and social commitments
Materiality through focusing
We are working on issues that are material to us and our stakeholders. The Œ2016 Stakeholder Survey allowed us to identify key sustainability topics and to continuously pursue them further in the year under review. The impacts of the topics both within and outside DB Group are analyzed.
The central ambitions of our stakeholders are focused on ensuring DB Group is fit for the future and securing its performance capabilities, as well as addressing topics relating to security and the environment. Thus, the mea-sures implemented as part of the Group programs µ70 ff. on the one hand and the competence center Digitalization µ78
and the change management division µ85 on the other hand included the material topics of digitalization µ77 ff., innova-
tion µ77 ff. and performance capability µ85 f. Our Group pro-grams and the Agenda for a Better Railway µ66 ff. also take
up these material topics. The material topic security µ257
was addressed through increased activities in the areas of employee security and cybersecurity. The fact that the fourth employee survey took place in the year under review underlines the importance that we place on em ployee satis-
faction µ87. We respond to the issue of climate protection, which is
classified as a material topic, in our climate targets µ90. DB Group’s target system µ67 forms the basis for the se -
lec tion of the key figures relevant to management. Further topics are reported based on an internal assessment of their significance. This includes the topics of social commit-
ments µ47 f. and supply chains µ258, which are given as high a priority as climate protection in our sustainability port-folio. Furthermore, the topics of air quality control µ264 and nature conservation µ264 f. were reported on.
102-43102-44102-46102-47102-49
GRI
Material sustainability topics 2018
Key figures (relevant to management)
Allocated UN Sustainable Development Goals
Management approach Measures
Product quality ◊ Customer satisfaction ◊ Punctuality ◊ High-performance infrastructure ◊ Customer and transport information ◊ Interlinked mobility
◊ Customer satisfaction index (µ75) ◊ Punctuality (µ76) ◊ Facilities quality (µ160) ◊ Supply reliability (µ163) SDG 9 , SDG 11 µ74
µ68, 70 ff., 76 f., 77 ff., 108 f., 116 f., 121 f., 123, 128, 143, 148 ff., 155, 158 f., 257
Digitalization and innovation — SDG 9 , SDG 11 µ77 f.
µ69 f., 70 ff., 79 ff., 86, 117, 122, 128, 137, 142 f., 147, 155, 159, 163, 165
Profitability ◊ Profitability ◊ Financial stability
◊ ROCE (µ104) ◊ Redemption coverage (µ106) SDG 8 µ103 f. µ94 ff.
Employee satisfaction
◊ Employee satisfaction index (µ87) ◊ Follow-up workshops implementation
rate (µ87) SDG 8 µ83
µ85 ff., 87, 116, 120, 127, 136 f., 142, 154, 158, 162, 257, 259, 260 ff.
Employer attractiveness ◊ Rank in Germany (µ83) SDG 8 µ82 f.µ83 ff., 85 ff., 260 ff.
Climate protection
◊ Specific greenhouse gas emissions compared to 2006 (µ90)
◊ Share of renewable energies in the DB traction current mix (µ90) SDG 12 , SDG 13 µ89
µ90 f., 116, 118, 121, 122, 127, 128, 137, 142, 143, 154, 158, 162 f.
Noise reduction
◊ Noise remediated tracks (µ92) ◊ Quiet freight cars in operation at
DB Cargo in Germany (µ92) SDG 3 , SDG 11 µ89µ92 ff., 137, 155, 263
Security — SDG 3 , SDG 9 µ257 µ257
Performance capability — SDG 8 , SDG 9 µ83µ75, 85 f., 108 f., 142
TO
OU
R S
TA
KE
HO
LD
ER
S
43
TO OUR STAKEHOLDERS — CORPOR ATE GOvERNANCE REPORT | SUSTAINABILIT Y MANAGEMENT
FIN
AN
CIA
L S
TA
TE
ME
NT
SS
US
TA
INA
BIL
ITY
GR
OU
P M
AN
AG
EM
EN
T R
EP
OR
T

Our commitment to the UN Sustainable Development GoalsThe 17 Sustainable Development Goals (SDGs) were adopted in September 2015. The 17 SDGs cover environ-mental, social and economic objectives of sustainable development. As such, the United Nations has agreed on a World Future Treaty that defines a common Agenda 2030. DB Group is expressly committed to the ten principles of the United Nations Global Compact (UNGC) µ269. For this reason, we also feel committed to the objectives of the Agenda 2030 and the SDGs.
Achieving the ambitious objectives for 2030 will require the commitment and cooperation of all stakeholders. We have reinforced the dialog with our stakeholders regarding the SDGs and will continue down this path. The Federal Government’s national sustainability strategy forms an important basis for this discussion, having been agreed at the beginning of 2017 on the basis of the SDGs and amongst those updated in June 2018 during the 19th legislative term of the German Parliament.
In 2016 we prioritized six SDGs in which our products, offers and sustainability management could make the greatest impact:
In the year under review, various communication mea-sures were implemented to promote DB Group’s engage-ment with the SDGs. For example, photography exhibitions such as the Canon Young People program were displayed in stations. Long-distance transport timetables were print- ed with individual SDGs in order to promote passenger awareness that making their journey by railway and taking advantage of other mobility offers such as CleverShuttle actively contribute to climate protection and smart mobility.
An SDG photo competition on the theme of “We are creating sustainable cities” was held for our employees, in order to inform them of the 17 goals for sustainable development.
Sustainability organization
The Chief Sustainability Officer is responsible for the issue of sustainability. The CEO, Dr. Richard Lutz, holds this office. Responsibility for the content of the sustainability theme falls to the specialist departments and business units. The sustainability management and future research depart-ment, which is incorporated into the corporate strategy division, is responsible for coordination and further devel-opment of this theme. One of its areas of focus in this re -spect is to strengthen governance.
Sustainability is an important element of our strategy and forms the basis of our entrepreneurial trade. The range of issues dealt with by sustainability management covers all dimensions of sustainability. In terms of the interactions between economic, ecological, social and, increasingly, dig-ital elements, we will actively continue to embed sustain-ability as an integral part of DB Group’s business processes as much as possible. Topics such as digital responsibility, sustainable cash investments, technical innovations for sus-tainability in supply chains, and employee development may be held up as exemplary sustainability management practice that is both proactive and opportunity-based.
Sustainability ratingsOutside perspectives give us an important indication of where we stand and where we can improve. Our ambition is to rank very highly in the key sustainability ratings.
Sustainability ratings 2018 2017 2016 Scale
ISS-oekom – Corporate Rating B–° B– B– A+ to D–
MSCI ESG Research A AA AA AAA to CCC
CDP – Climate Scoring A A A– A to F
EcoVadisGold (67) Gold Gold
Gold (62 to 100) Silver (46 to 61)
Bronze (37 to 45)
◊ In its Corporate Rating 2018, the rating agency ŒISS-
oekom assessed DB Group’s sustainability activities. DB Group has achieved a “B–” as in previous years, and with this rating has reached top position in the field of transport and logistics. This is reflected in the “Prime” status, which is awarded to companies that are leaders in their industries.
◊ DB Group has been assessed since 2013 in the ESG Rating from ŒMSCI ESG Research. In 2018, it received a rating “A” in the “Road & Rail Transport” field, this rating placing it at the forefront of the field.
102-12102-16
GRI
!!!
Deutsche Bahn supports the SDGs
U N S U S TA I N A B L E D E V E L O P M E N T G O A L S
Deutsche Bahn Group 2018 Integrated Report
44

◊ Again, the international rating organization ŒCDP
awarded DB Group the best rating of “A” in its Climate Scoring 2018 and ranked us the most environmentally friendly railway company in Europe. This rating places DB Group in the very top group, numbering 137 compa-nies worldwide.
◊ ŒEcovadis again awarded DB Group Gold status. The areas of environment and working conditions and sus-tainable purchasing received particularly positive as -sess ments.
Membership of sustainability networks ◊ Our commitment to the UNGC µ269 is underscored by
the annual presentation of our progress along the ten principles of the Global Compact (Communication on Progress). In addition, we are committed to the German Global Compact Network (Deutsches Global Compact Netzwerk; DGCN), the German multi-stakeholder forum to implement and promote the principles of the UNGC, as well as the SDGs µ44. DB Group is a member of the Steering Committee of the DGCN.
◊ As a signatory of the ŒGerman Sustainability Code (Deut-
scher Nachhaltigkeitskodex; DNK), we also provide a clear signal in Germany for the transparent presentation of our sustainability performance.
◊ DB Group is an active member of Œeconsense, the Forum for Sustainable Development of German Business. To -gether with some 35 German companies and organiza-tions with global operations, we are committed to initi-ating and developing solutions for sustainable economic activity. We are particularly committed to the issues of strategic direction, SDGs and digitalization.
◊ In addition, DB Group has been a member of ŒThe Con-
ference Board since the year under review and plays an active role in the issue of sustainability. Founded in 1916, The Conference Board is an independent global eco-nomic association working in the public interest. It aims to help managements to conquer the largest challenges for companies and better serve society.
◊ As part of the fight against corruption, DB Group is a cor- porate member of ŒTransparency International. Our anti-corruption efforts involve the regular exchange of experience regarding systems and procedures for the fight against corruption.
◊ DB Group is a founding member of the ŒRailsponsible sector initiative. This initiative aims to create transpar-ency regarding social, environmental and socioeco-nomic effects along the entire supply chain and to sup-port suppliers in improving their sustainability practices. Other significant European companies in the field are members of the initiative.
Social acceptance resulting from open stakeholder dialogClear guidelines for stakeholder dialogThe acceptance of stakeholders is an essential prerequisite of our sustainable business success. For this reason, we are committed to holding collaborative dialog with stake-holders as partners and working with all stakeholder µ46 groups in an atmosphere of mutual trust. Our Œstakeholder
charter provides the foundation and guidelines for all dialog activities. It serves as the basis for an open discussion of our stakeholders’ expectations and for fostering cooperation, so that we can learn from each other and develop viable solutions.
Regular dialog with policymakers and the publicBeing one of the largest mobility and logistics services pro-viders, DB Group attracts a lot of public and political atten-tion in Germany. We have an important role in advancing the railway system in Germany and Europe. We are there-fore sought after as a dialog partner in public discussions, and also actively engage in dialog with the entire sector. We establish our own transport policy positions at the national and international level in dialog with political and administrative institutions as well as parties, associations and relevant scientific areas. DB Group seeks to use logical arguments to contribute to a constructive debate process. The following memberships have particular relevance for political dialog at a national and international level:
◊ Pro-Rail Alliance (Allianz pro Schiene; ApS) ◊ Mobility and Transport Services Association
(Arbeitgeber- und Wirtschaftsverband Mobilität und Verkehr; Agv MoVe)
◊ Comité international des transports ferroviaires (CIT) ◊ Community of European Railway and Infrastructure
Companies (CER) ◊ German Transport Forum (Deutsches
Verkehrsforum; DVF) ◊ Union Internationale des Chemins de Fer (UIC) ◊ Association of German Transport Companies (Verband
Deutscher Verkehrsunternehmen; VDV)The principles of the stakeholder charter also apply to dialog with policymakers. In addition, we have set strict internal standards for participation in political processes, which are summarized as “Group Principles Ethics Code of Conduct” and which are binding Group-wide.
102-12102-13
GRI
102-42102-43102-40
GRI
TO
OU
R S
TA
KE
HO
LD
ER
S
45
TO OUR STAKEHOLDERS — SUSTAINABILIT Y MANAGEMENT
FIN
AN
CIA
L S
TA
TE
ME
NT
SS
US
TA
INA
BIL
ITY
GR
OU
P M
AN
AG
EM
EN
T R
EP
OR
T

Passenger Advisory Board makes a valuable contributionSince its founding, the Passenger Advisory Board has made valuable contributions from its 30 meetings and numerous workshops and surveys, and it has also successfully initia ted
measures. The Passenger Advisory Board, which is com-prised of 30 private customers of DB Group, convenes for ordinary meetings twice a year, and it provides support and advice on numerous projects in all areas related to cus-tomers. In the year under review, the Passenger Advisory
102-44
GRI
Stakeholders Key topics in 2018 Key dialog formats
Passengers
◊ Schedule alterations and improvements
◊ Punctuality
◊ Digitalization (WiFi/route agent)
◊ Journey comfort/customer service/improvements to passenger information
◊ Integration of local fare calculation into the DB Navigator
◊ Vehicle modernization/Idea Train
◊ New vehicles (S-Bahn (metro) in Munich and Berlin)
◊ Passenger advisory board
◊ Online dialog platforms/social networks
◊ Customer dialog (telephone)/customer enquiries
◊ Dialog forum with BahnCard 100 customers/top customer events
◊ Own dialog events and customer events
◊ Trade fairs and product conferences (Innotrans 2018)
◊ Train or bus labs
◊ Labs (d.lab, DB mindbox)
Business customers
◊ Punctuality and reliability
◊ Digitalization
◊ Customer dialog
◊ Innovative freight cars
◊ Green logistics
◊ Implementation of Railway of the Future @ DB Cargo
◊ Direct exchange with customers, including trade fairs and discussions
◊ Own dialog and customer events
◊ Customer workshops
◊ Annual customer satisfaction survey at DB Schenker and DB Cargo
◊ Surveys, e.g. monthly satisfaction check
Policymakers/regulators
◊ Infrastructure development and financing
◊ Digitalization
◊ Germany in sync (Deutschland-Takt)
◊ Intermodal competition
◊ Future of financing public transport
◊ Regulatory frameworks
◊ Climate protection in transport
◊ Parliamentary evenings
◊ Association activities
◊ Participation in discussion rounds and expert presentations
◊ Participating in dialogs arranged by the BMVI
◊ Our own events, such as competition symposiums or fireside evenings
Employees
◊ Collective bargaining negotiations
◊ Employee satisfaction
◊ Talent acquisition
◊ Demographic preparedness/generation management
◊ Digitalization
◊ Knowledge management
◊ Targeted group employer branding campaigns
◊ Generational contracts as a sponsorship model
◊ DB Planet (exchange platform)
◊ DB Lernwelt (central learning platform)
◊ Employee-specific conferences and network formats
◊ Worldwide employee survey
Investors
◊ Competitive situation/regulatory environment
◊ Indebtedness
◊ Development of factor costs
◊ Profitability
◊ Roadshows
◊ One-on-ones
◊ Direct contacts
◊ Investor relations Web site
Suppliers
◊ Quality/qualification
◊ Innovation/digitalization
◊ Antitrust law
◊ Ombudspersons
◊ Supplier management
◊ Cooperation in mutual trust
◊ Meeting deadlines
◊ Reviews of business partners
◊ Sustainability in the supply chain
◊ Innotrans (including supplier rating, Supplier Innovation Award)
◊ Direct supplier development meetings
◊ Innovation workshops
◊ Roundtables and specialist presentations on compliance-dialog with business partners
◊ Railsponsible industry network
◊ Dialogs on competition
◊ Innovation partnerships
◊ Dialogs regarding supplier sustainability assessments
◊ Supplier days in the product areas
Associations/specialist public
◊ Infrastructure development and financing
◊ Energy policy framework
◊ Noise remediation
◊ Compliance/anti-corruption
◊ Climate protection in transport
◊ Annual conference of the Association of German Transport Companies (VDV)
◊ Environmental Forum workshop
◊ High-level talks and exchanges on special topics with passenger, environmental and industry associations and the public transport authorities
◊ Member of the Administrative Board of the German Compliance Institute (Deutsches Institut für Compliance e. V.; DICO)
◊ Corporative member of Transparency International Deutschland e. V.
Media
◊ Railway of the Future
◊ Employer attractiveness
◊ Digitalization projects
◊ Upgrade of digital services
◊ Quality in the existing network
◊ New climate targets, species protection and noise remediation activities
◊ Press Web site
◊ Press trips and dates
◊ Background discussions
◊ Interviews
◊ Social media (Facebook, Twitter)
102-40102-43102-44
GRI
Deutsche Bahn Group 2018 Integrated Report
46

Board continued to be involved from an early stage in issues surrounding the strategic direction of various projects. The key aim of this collaboration was to improve passenger information during widespread distributions and to opti-mize the catering offer on board trains.
Main activities Sixth DB Sustainability Day“Sustainable Cities Require Smart Products” was the leading theme of the sixth DB Sustainability Day no. 113 on March 1, 2018 in Berlin. Throughout one entire day, the Group Man-agement Board spoke with 190 invited representatives of various stakeholder groups about ideas and expectations for better quality of life in cities and a contribution to a society that is fit for the future. Among the guests of the event were Olaf Scholz (former First Mayor of the Free and Hanseatic City of Hamburg), Clare Jones (Chief Customer Officer of what3words) as well as representatives of the cities of Copenhagen, London and Darmstadt.
Hosting of the 22nd Environmental ForumEvery year, DB Group invites representatives of environ-mental associations and representatives from industry, sci-ence and politics to the public dialog. Already in its 22nd year, the Environmental Forum took place on June 13 – 14, 2018 in Berlin with participants from WWF, Environmental Action Germany (Deutsche Umwelthilfe) and Nature and Biodiversity Conservation Association (Naturschutzbund Deutschland e.V.; NABU) as well as the environmental policy representatives of the parliamentary factions. In podium discussions and workshops, representatives of DB Group and of the economy discussed the transition away from fossil fuels. Prof. Dr. Sabina Jeschke gave an overview of the digi-talization of the tracks. Prof. Dr. Ernst Ulrich von Weizsäcker, Co-President of the Club of Rome, spoke on the subject of environmental policy challenges in the transport sector.
Summit meeting with environmental associations Since 2000, DB Group management has been meeting with the management of environmental associations to examine current environmental topics. In the year under review, representatives from Greenpeace, WWF, Deutscher Umwelt-hilfe, NABU, BUND (Friends of the Earth Germany) and VCD (Transport Club Germany) came together in Berlin in Oc -to ber 2018. Together with the Chairman of the DB Manage-ment Board, Dr. Richard Lutz, and member of the DB Man-agement Board, Prof. Dr. Sabina Jeschke, the heads of the associations discussed, amongst other issues, the challenges of climate protection and adapting to climate change using predictable vegetation control.
Responsibility and social commitments
DB AG created ŒDeutsche Bahn Foundation gGmbH in order to bring its charitable commitments and the DB Museum µ48 together under one roof and to fulfill its social responsibility even more effectively. Deutsche Bahn Foundation seeks to co-create an equitable society, and improve social cohesion. It combines railway history with signaling future directions. For this reason, it operates the DB Museum, is committed to integrating those on the edges of society, and supports vol-untary work. The mission statement “Ensuring a connection. Creating links. Setting the course.” summarizes its task.
Language as the key to integrationDeutsche Bahn Foundation, together with the ŒReading
Foundation (Stiftung Lesen), is heavily involved in reading and language support. One expression of this shared com-mitment is the nationwide reading aloud day and the annual reading aloud study. The reading aloud kits, filled with reading materials specifically chosen for the target groups, have been presented to more than 8,500 institu-tions in re cent years. Deutsche Bahn Foundation publishes three Œreading aloud stories for children online every week for free.
Strengthening volunteeringIn the year under review, Deutsche Bahn Foundation for the third time supported DB employees who donated their free time to charitable organizations. We were able to increase the promotional volume of the employee program, which is re-tendered annually, to € 115,000. These funds go di rect- ly to concrete projects that benefit charitable organizations. An independent jury determines the amount to be donated. About 500 projects have been supported since the begin-ning of the program.
To recognize and reward societal engagement, Deutsche Bahn Foundation was for the first time one of the main sup- porters of the German Engagement Prize (Deutscher En -gage mentpreis), along with the Federal Ministry for Fami-lies, Seniors, Women and Youth, and the German Television Lottery.
Humanitarian aid Deutsche Bahn Foundation works closely with the Railway Station Missions (Bahnhofs missionen) and their supporting institutions, which provide support to over 100 stations in Germany, and in doing so engages with the area around the stations. Together with the Conference for Church Rail- way Station Mission (Konferenz für Kirchliche Bahnhofs-mission), Deutsche Bahn Foundation carries out an annual ten der on a specific theme, which allows Railway Station
102-16
GRI
102-12
GRI
102-12
GRI
TO
OU
R S
TA
KE
HO
LD
ER
S
47
TO OUR STAKEHOLDERS — SUSTAINABILIT Y MANAGEMENT
FIN
AN
CIA
L S
TA
TE
ME
NT
SS
US
TA
INA
BIL
ITY
GR
OU
P M
AN
AG
EM
EN
T R
EP
OR
T

Missions across the country to apply for funds for needs-based projects and actions to benefit the guests of the Rail- way Station Missions. In 2018, it supported lower-threshold training programs on the subject of Learning for Life, which allowed long-standing guests of the Railway Station Mis-sions to develop new perspectives on life.
In 2018, Deutsche Bahn Foundation’s video interpreting pilot project and the Conference for Church Railway Station Mission made it possible for assistance to be given to non-Ger man-speaking guests in a total of 60 languages at six locations, with the aim of improving the quality of advice they received.
Deutsche Bahn Foundation also supported an ambulatory clinic near the Berlin Central Station, where people without health insurance could receive medical assistance at any time of the year and free of charge. Beyond that, Deutsche Bahn Foundation offered structured discussions to those with mental and psychological issues through “Courage Provid- ers at the Station” at the Berlin Central Station. The Courage Pro viders gave help, and where necessary connected them to the social and psychiatric health system in Berlin.
Promoting mental healthDeutsche Bahn Foundation, together with the ΠGerman
Depression Aid Foundation (Stiftung Deutsche Depressions-
hilfe) has been involved since 2014 in working to destigma-tize depression as a mental illness in society. As part of this, it supports the German Federation against Depression (Deutsches Bündnis gegen Depression) which operates in more than 80 cities and regions. In the year under review, the construction in Leipzig of the country’s first depression research center that is treatment-based and independent of the pharmaceutical industry was successfully agreed. The Germany Depression Barometer (Deutschland-Baro meter Depression) study from the Foundation German Depression Aid (Deutsche Stiftung De pres sionshilfe) and Deutsche Bahn Foundation in the year under review investigated the key topic of relationships, which resonated particularly strongly in the media.
Learning through engagementTraining posts remain unfilled because many high school students are not aware of what jobs are available and which would suit them. Deutsche Bahn Foundation and the Learn- ing through En gagement Foundation (Stif tung Lernen durch Engagement) developed the “Ap point ed heroes – learning through engagement for career opportunities” (“Berufene Helden – Lernen durch Engagement für Chancen im Beruf”) project to intervene in this area. Trained teachers assist their high school students in planning and implement ing a project based on their own social environment that en courages
career orientation and/or skills needed for training. The stu-dents organize and reflect on their projects, ac quir ing spe-cific training competences and skills, thereby laying the foundation for their future professional lives.
DB Museum – living historyThe Œ DB Museum has three sites. The permanent exhibition at the Nuremberg Museum of the history of the rail way in Germany was completed in June 2018 with the open- ing of the “Ger many of the two Railways” (“Im Deutsch- land der zwei Bah nen”) sec-tion. Suc cess ful temporary exhibitions such as the “TEE meets Vindobona” (“TEE trifft Vin do bona”) and “Clas- sified Rail way” (“Ge heim-sache Bahn”) and an educa-tion and events program supplemented the offer. Here, the museum’s edu- cational program has been completely revised and ex -panded. Surprising offers such as Open Locomotive Days (Tage der of fenen Loks), escape rooms, theat-rical performances or kids’ rallies allowed it to reach new target groups.
With a total of more than 600 locomotives and cars across Germany, the DB Mu seum possesses one of the most important ve hi- cle collections in the world. Most of the locomotives and trains from the German Federal Railway (Koblenz) and the East German Na tional Railway (Halle) on display are freely accessible. Both branches of the museum receive significant support from former em ployees as part of the BSW & EWH Foundation Family (Stif tungs familie BSW & EWH).
In the year under review, the DB Museum successfully increased its visitor number by 2% to over 218,000 visitors. The sites at Koblenz (+11%) and Halle (+39%) were able to achieve particularly significant growth, whilst the Nurem-berg Museum experienced a slight drop as a result of con-struction work (–2.5%).
102-12
GRI
102-12
GRI
H E L P F O R H O M E L E S S
C H I L D R E N
In 2018, Deutsche Bahn Foundation
unveiled the traveling exhibition
“decoupled” (“entkoppelt”) at the
Berlin Central Station. Twenty large-
format photographs and texts draw
attention to the issue of youth home-
lessness. Every year in Germany,
up to 2,500 young people end up on
the streets, or experience hidden
homelessness as so-called sofa-
hoppers. Together with the Off Road
Kids Foundation, Deutsche Bahn
Foundation helps to prevent runaways
and sofa-hoppers from having to
live on the streets. Beginning in 2018,
through the online platform and
the first virtual Streetwork-Station in
Germany, at-risk youths can access
qualified contact and advice points
all over Germany for the first time.
Here, young people can discuss prob-
lems with street advisors and get
help anonymously.
Deutsche Bahn Group 2018 Integrated Report
48

94 Business development ◊ Weakened condition of the business environment ◊ Income situation not satisfactory ◊ Financial and asset situation stable ◊ Value management figures under pressure
112 Development of business units ◊ DB Long-Distance shows positive development ◊ Revenue growth in Infrastructure ◊ International business units continue to grow
166 Opportunity and risk report ◊ DB Group well positioned to exploit opportunities ◊ Considerable risks within the Human Resources and Production and Technology divisions
◊ Risk portfolio unchanged with no threats to DB Group as a going concern
174 Events after the balance sheet date ◊ Three bonds issued ◊ Collective wage negotiations completed successfully
◊ Long-distance train orders
175 Outlook ◊ Slightly weaker economic outlook ◊ Growth course expected to continue
50 Fundamentals ◊ International provider of mobility and logistics solutions
◊ Voluntary application of the CSR directive ◊ A business model with a clear customer focus
65 Targets and strategy ◊ Agenda for a Better Railway ◊ A new ecosystem for promoting innovation introduced
◊ Continuation of the Group programs
73 Customer and quality ◊ Overall customer satisfaction declining ◊ Weak punctuality performance ◊ Innovative solutions driven forward for quality improvements
82 Social ◊ New hires at record levels ◊ Fourth Group-wide employee survey conducted ◊ Collective wage negotiations completed successfully
88 Environmental ◊ Progress in climate protection ◊ Number of freight cars with whisper brakes increased further
◊ Recycling rate again at a high level
Group management report
GR
OU
P M
AN
AG
EM
EN
T R
EP
OR
TF
INA
NC
IAL
ST
AT
EM
EN
TS
SU
ST
AIN
AB
ILIT
Y

Passenger Transport Freight Transport and Logistics
Infrastructure
B A S I C U N D E R S TA N D I N G O F D B G R O U P
Integrated rail system
DB Group
Deutsche Bahn Group (DB Group) is an international pro-vider of mobility and logistics services operating globally in more than 130 countries. Its headquarters are in Berlin. DB Group has more than 318,000 employees, with almost 40% employed outside Germany. We design and operate the transport networks of the future. By integrating transport and rail infrastructure, as well as through the economically and environmentally intelligent linking of all modes of transport, we move both people and goods.
In passenger transport, we transport about 12.8 million people each day on our trains and buses throughout Europe. In freight transport and logistics, our networks transport over 255 million t of goods per year by rail, and over 106 million shipments by road. Our global networks move more than 1.3 million t of air freight and nearly
2.2 million TEU of ocean freight. At about 33,000 km, our rail network in Germany is Europe’s longest. We are also one of Germany’s largest energy providers.
The main components of our integrated rail system are our passenger transport activities in Germany, our rail freight transport activities, the operating service units and the rail infrastructure companies (RIC).
Deutsche Bahn AG (DB AG) is the parent company of DB Group. It has been a stock corporation under German law since it was founded in 1994 and accordingly has a dual management and control structure comprising a Manage-ment Board and a Supervisory Board. It is wholly owned by the Federal Republic of Germany (Federal Government).
Within DB Group, DB AG manages all the business units in its function as an operating management holding com-pany and supports the business units via various central group functions (including legal, corporate development, Group controlling and finance and treasury) and adminis-
trative service units µ53. In addition, operating service units, as legally independent DB AG subsidiaries, primarily provide services for intra-Group customers. These include DB Systel GmbH, DB Sicherheit GmbH, DB Services GmbH and DB Kommunikationstechnik GmbH. The DB Group RIC are legally independent companies with separate balance sheets and statements of income, and thus fulfill all un -bundling requirements under European and national law. There is also a functional unbundling, which guarantees the independence of decisions by DB Netz AG on infrastructure access and charges. Reliability and stability form the basis of a high quality of the infrastructure. The essential corner-stones for profitable business are sustainable financing of the existing infrastructure and its expansion as required. The Performance and Financing Agreement (Leistungs- und
Finanzierungsvereinbarung; LuFV) µ234 f. contributes signifi-cantly to ensuring the maintenance of the existing network.
102-1102-3102-4102-5102-7
GRIGRIGRIGRI
Fundamentals
50 DB Group55 Non-financial Group statement56 Business model with a clear customer focus
58 Development in relevant markets61 Legal and political topics
Deutsche Bahn Group 2018 Integrated Report
50

Corporate Governance reportThe Corporate Governance report µ36 ff. is part of this Group management report.
Changes in the composition of the Super- visory Board and the Management BoardThe changes in the composition of the Supervisory Board and
the Management Board µ35 are presented in the Supervisory Board report.
Service and financial relationships in DB GroupWithin DB Group, because of strong operational intercon-nections and dependencies, there are service and financial relationships between the management holding company DB AG and the individual business units, as well as between business units.
These can be organized into four groups: ◊ Operational business relationships between two com-
panies, which may arise through the use of infrastruc-ture, such as when DB Regio AG uses the rail network of DB Netz AG, for which it pays train-path usage fees.
◊ Business relationships with the Group management: DB AG is responsible for providing services for the oper-ating companies such as central purchasing, which orga-nizes and controls the procurement process for trains.
◊ Group financing: DB AG performs and consolidates the financing function in DB Group. In this context, DB AG obtains funds on the capital market through its fi nanc- ing subsidiary Deutsche Bahn Finance GmbH (DB Finance)
µ102 and transfers these funds as loans to the Group companies.
◊ Domination and profit and loss transfer agreements: In Germany, domination and profit and loss transfer agree-ments are used for the formation of a consolidated tax group that allows companies to offset tax losses against profits. In DB Group, the company ultimately subject to tax in Germany is DB AG.
The arm’s length principle serves as the fundamental characteristic of business relationships. This means that compensation is always based on market prices. In DB Group this applies to charges for operational business rela-tionships, service units and Group financing. Intra-Group customers pay the same fees for utilizing train-paths as non-Group customers. The prices of intra-Group services are reviewed regularly on the basis of market analyses to ensure that they are in line with the market. The terms of financing transactions are based on prevailing market con-ditions in the financial and capital markets.
Group functions µ53 perform controlling and monitoring functions. These services are generally not charged. By con trast, the services of the service units µ52 f. are gener-ally charged to the intra-Group recipients of the service, in relation to the service provided.
The reasons and motivation for aligning the costs of business relationships in DB Group with market conditions are as follows:
◊ A value-based corporate management approach can only be successful if it is embedded at all levels in DB Group. This, in turn, can only be achieved through busi-ness relationships at fair market conditions. Success and failure must be transparent in order to facilitate economic control.
102-10
GRI
102-10
GRI
CEO and Chairman Digitalization and Technology
Human Resources and Legal Affairs Passenger Transport Finance, Freight
Transport and Logistics Infrastructure
DB Group
D B G R O U P O R G A N I Z AT I O N C H A R T
Business units
DB Long-Distance DB Cargo DB Netze Track
DB Regional DB Schenker DB Netze Stations
DB Arriva DB Netze Energy
As of January 1, 2019
GR
OU
P M
AN
AG
EM
EN
T R
EP
OR
T
51
GROUP MANAGEMENT REPORT — FUNDAMENTALS
FIN
AN
CIA
L S
TA
TE
ME
NT
SS
US
TA
INA
BIL
ITY

Business relationships with Group managementDB Group incorporates various Group and service functions that, with a few regulatory exceptions, perform functions for the entire DB Group. The costs of Group functions are not passed on to the business units (no Group charges).
Expenses for administrative service units are only passed on if these result from direct service relationships with the business units or expenses that are directly attributable to a specific service. This applies in particular to expenses on the use of real estate, central purchasing and technology services and for centrally consolidated insurance expenses.
!!!
◊ The RIC are legally required to provide their services without discrimination. The Federal Network Agency (Bundesnetzagentur; BNetzA) assesses whether prices are in line with the market. Prices are transparent for everyone.
◊ Alignment of business relationships with market condi-tions is also both necessary and stipulated for tax rea-sons and from the perspective of minority shareholders.
The effects of domination and profit and loss transfer agreements within DB Group on profits and payments are not qualified as business relationships, but are a conse-quence of DB Group’s status as a domestic contract group and the associated rights and obligations of all the incor-porated domestic companies.
Operational business relationshipsThe most extensive operational business relationships result from the use of the track infrastructure and the pro-curement of energy. As for non-Group customers, fees for the use of infrastructure are based on the published pricing systems (train-path pricing system, facility pricing system and station pricing system). The procurement of energy includes the purchase of traction energy (diesel fuel and traction current) as well as electricity for stationary facili-ties (such as switch heaters and train preheating systems).
The main effects of the intra-Group settlement of busi-ness relationships between the various DB Group business units for services rendered in infrastructure utilization are illustrated in the table below:
Intra-Group business relationships from infrastructure utilization in 2018 (€ million)
DB Long- Distance
DB Regional
DB Arriva
DB Cargo
DB Schenker
DB Netze Track
DB Netze Stations
DB Netze Energy
Subsidiaries Other
Train-path utilization – 984 –2,312 –1 –382 – + 3,675 – – + 4
Use of local infrastructure –31 – 53 – –138 – +225 – 0 –2 –1
Station use –101 – 592 – 0 – – + 6 + 686 – +1
Energy charges –344 – 631 +2 –271 – 0 –135 –73 +1,493 – 41
Significant intra-Group relationships.
S I G N I F I C A N T O P E R AT I O N A L B U S I N E S S R E L AT I O N S H I P S ( I N T E G R AT E D R A I L S Y S T E M )
Operating service units
◊ Vehicle maintenance
◊ IT services
◊ Security
◊ Cleaning
◊ Sales
◊ …
DB Long-Distance
◊ Business trips
◊ Employee journeys
Rail infrastructure companies
DB Engineering&Consulting
◊ Project planning and management
DB Netze Track
◊ Train-path utilization
◊ Facility utilization
DB Netze Stations
◊ Station use
DB Netze Energy
◊ Traction current
◊ Stationary energy
◊ Diesel
DB Regional
◊ Business trips
◊ Employee journeys
DB Cargo
◊ Construction transport and logistics
◊ Other freight transport and logistics services
Train operating companies
Deutsche Bahn Group 2018 Integrated Report
52

Group functions, not directly attributable and not charged.
Service units, attributable and charged in case of direct business relationships.
B U S I N E S S R E L AT I O N S H I P S W I T H G R O U P M A N A G E M E N T
Operating service units
◊ DB Services GmbH
◊ DB Systel GmbH
◊ DB Vertrieb GmbH
◊ DB Sicherheit GmbH
◊ DB Fahrzeuginstand- haltung GmbH
◊ DB Connect GmbH
◊ …
Group management
Business units
◊ DB Long-Distance
◊ DB Regional
◊ DB Arriva
◊ DB Cargo
◊ DB Schenker
◊ DB Netze Track
◊ DB Netze Stations
◊ DB Netze Energy
Administrative service units
◊ DB Management Consulting
◊ DB JobService
◊ DB Real Estate
◊ DB Temporary employment
◊ DB Procurement
◊ …
Group functions
◊ Compliance
◊ Finance/controlling
◊ Communication
◊ Group development
◊ Group marketing
◊ …
Infrastructure
◊ DB Netze Track
◊ DB Netze Stations
◊ DB Netze Energy
Deutsche Bahn AG
G R O U P F I N A N C I N G
Money market Capital market
DB Finance
Passenger Transport
◊ DB Long-Distance
◊ DB Regional
◊ DB Arriva
Freight Transport and Logistics
◊ DB Cargo
◊ DB Schenker
Market interest + credit surcharge
Market interest
Market interest
Market interest
Market interest
The Group job market performs an important central func-tion. DB JobService GmbH employs staff whose jobs in German companies of DB Group have been lost, with the aim of finding another intra-Group job for them. It there-fore plays a key role in the functioning of the intra-Group labor market. DB Zeitarbeit GmbH provides companies in DB Group with temporary employees.
Group financing Group Treasury at DB AG is responsible for DB Group financ-
ing µ101 ff. This ensures that all Group companies are able to borrow and invest funds at optimal terms and condi-tions. Before obtaining funds from external sources, we
first conduct intra-Group financing transactions. When bor-rowing external funds, DB AG takes out short-term loans in its own name, whereas long-term capital is generally obtained through the Groupʼs financing company, DB Finance. The funds are passed on to the Group companies as short-term credit lines, which can be utilized as part of cash pooling on internal current accounts and/or through fixed short-term credit, or in the form of long-term loans. This concept enables us to pool risks and resources for the entire Group. Further advantages arise from the consolida-tion of our know-how, realized synergy effects and mini-mized refinancing costs.
!!!
GR
OU
P M
AN
AG
EM
EN
T R
EP
OR
T
53
GROUP MANAGEMENT REPORT — FUNDAMENTALS
FIN
AN
CIA
L S
TA
TE
ME
NT
SS
US
TA
INA
BIL
ITY

The Group Treasury operates as an in-house bank, al though it provides a service function rather than acting as a profit center. The Group companies have business relationships with the Treasury (foreign exchange transactions, cash pool ing, cash investments and taking up of loans). The con-ditions are agreed at arm’s length at market rates. This means that the agreed interest rates are in line with those quoted by the banks if they were not intended to yield a profit. Market rates also mean that credit margins are adjusted in line with creditworthiness: the credit margin for the infrastructure companies is largely in line with the credit margins of DB AG in the financial and capital market. The credit margins for non-infrastructure companies are higher and are based on an internal metric-based credit rating and the credit margins quoted on the capital market.
Consolidation of the Group finance function in DB AG gives us a uniform market presence in the financial and cap- ital markets, and allows us to achieve economies of scale and cost benefits. In addition, central Group financing en -ables us to adequately monitor financial transactions and achieve comprehensive risk management.
Domination and profit and loss transfer agreements Profit transfers and losses offset do not constitute business relationships. On the contrary, the profit and loss transfer agreement stipulates that the amount of profit distributed or the sum required to offset losses is not reset every year but is calculated automatically. The flow of capital is based on the shareholder’s right to profits or obligation to com-pensate any losses. Notwithstanding this, DB Group en-sures that Group companies have sufficient equity despite the obligation to offset potential losses generated by indi-vidual companies within the Group.
Investors are only willing to provide capital if amortiza-tion and returns are ensured. A purely debt-based fi nancing model is not commercially viable, as it is associated with high risks. Profits are essential for maintaining DB Group’s capital expenditure capacity. Profits generated are either retained or distributed to the Federal Government as the sole shareholder. The share of profit retained in DB Group increases the capital expenditure and borrowing capacity.
!!!!!!
Infrastructure
◊ DB Netze Track
◊ DB Netze Stations
◊ DB Netze Energy
Deutsche Bahn AG
D O M I N AT I O N A N D P R O F I T A N D L O S S T R A N S F E R A G R E E M E N T S
Passenger Transport
◊ DB Long-Distance
◊ DB Regional
◊ DB Arriva
Freight Transport and Logistics
◊ DB Cargo
◊ DB Schenker
Dividend
Federal Republic of Germany (owner)
Profit transfer/capital measure.
Tax group in Germany; integration into DB AG profit and loss transfer agreement with the automatic transfer of profits respectively compensation for losses.
Partial tax group in Germany.
No tax group in Germany.
Deutsche Bahn Group 2018 Integrated Report
54

Non-financial Group statement
The CSR Directive Implementation Act (CSR-Richtlinien- Umsetzungsgesetz; CSR-RUG) implementing EU Directive 2014/95/EU (CSR Directive on disclosure of non-financial and diversity information by certain large companies and groups) came into force on April 19, 2017. This must contain information on their business model, on environmental, employee and social affairs, on respect for human rights and on combating corruption. Although DB Group does not fall within the scope of the CSR-RUG, in the previous year we decided to comply with its content voluntarily.
Under our integrated report approach, DB Group already reports fully on all material sustainability topics µ43. In order to meet the reporting obligations of CSR-RUG, we have also supplemented the information on legally defined materiality thresholds.
The contents of the non-financial Group declaration in accordance with sections 315b and 315c Commercial Code (Handelsgesetzbuch; HGB) can be found in the relevant chapters of the Group Management Report and were pro-duced in accordance with the International GRI Standards
(core option) µ268 f., and taking into account the reporting requirements of the UNGC µ269. The information is clearly displayed in the following table.
102-16
GRI
Cash flows between DB AG and DB infrastructure companies (€ million) 2000 2001 2002 2003 2004 2005 2006 2007 2008 2009 2010 2011 2012 2013 2014 2015 2016 2017 2018 Total
FROM PROFIT AND LOSS TRANSFER AGREEMENT
DB Netz AG +790 +181 + 548 + 324 +183 +260 +212 –146 –338 –768 + 44 –307 –197 – 66 –217 – 81 –280 –390 – 509 –757
DB Station&Service AG +70 – 0 +251 –37 – 55 – 69 – 52 – 90 –190 –150 –141 –155 –160 –169 –188 –203 –176 –186 –190 – 1,890
DB Energie GmbH –34 –2 –29 – 43 – 47 – 44 –111 –106 –18 – 91 –38 + 38 – 62 + 37 –39 – 51 –35 – 59 –12 –746FROM C APITAL IN CR E A SE S BY DB AG
DB Netz AG – – – – – + 600 – – – – + 620 – – + 5 – – – +1,000 – +2,225
DB Station&Service AG – – – – – – – +286 – +28 +111 +14 – – – – – – – + 439
(+) Inflow of capital to subsidiary.
(–) Outflow of capital to DB AG.
Content of non-financial Group statement according to section 289c (2) HGB DB topics Reference
Business model ◊ DB Group (µ56 f.) —
Environmental matters
◊ Greenhouse gas emissions (µ90) ◊ Renewable energies (µ90 f.) ◊ Protecting biological diversity (µ264 f.) ◊ Air quality control (µ264) ◊ Water consumption (µ265) —
Employee matters
◊ Gender equality (µ86 f.) ◊ Working conditions (µ260 f.) ◊ Respecting the rights of trade unions (µ85) ◊ Safety in the workplace (µ257, µ261) ◊ Health protection (µ261 f.) —
Social matters
◊ Dialogue at local and regional level (µ45 f.) ◊ Protection/development measures
for local communities (µ45 f.) —
Respect for human rights ◊ Preventing human rights
violations (µ255 f.)We also report on the subject of respect for human rights in addition to the material topics identified in the stakeholder survey.
Combating corruption and bribery ◊ Instruments for combating corruption
and bribery (µ254 f.)
We also report on the subject of combating corruption and bribery in addition to the material topics identified in the stakeholder survey.
GR
OU
P M
AN
AG
EM
EN
T R
EP
OR
T
55
GROUP MANAGEMENT REPORT — FUNDAMENTALS
FIN
AN
CIA
L S
TA
TE
ME
NT
SS
US
TA
INA
BIL
ITY

Business model with a clear customer focus DB Group offers attractive, customer-focused and environ-mentally friendly mobility, transport and logistics solutions and networks from a single source. We selectively use the possibilities of digital technologies µ77 ff. to improve our operational and administrative processes, to continually further develop offers for the customer, to integrate new services, and to simplify the customer interface. Our cus-tomers are individuals, business customers and contracting organizations in local and regional transport.
The integrated railway system µ50 is at the heart of our business activities. In addition, we are gradually expanding our business portfolio in order to meet our customers’ needs more effectively and respond to new market demands.
◊ Our passenger transport business activities are broadly diversified. They comprise not only bus and rail trans-port, but also intelligent linkage with other modes of transport such as the car and bicycle. We offer long dis -tance rail passenger transport within Germany and into neighboring countries. Furthermore, we have regional and local transport operations throughout Europe that enable us to benefit from increasing market potential in the bus and rail transport markets.
102-2102-4102-7
GRI
!!!
1) Key products and services. 2) Internal and external consequences and results from business activities and outputs along the entire value-added chain.
Resources/inputs
D B G R O U P B U S I N E S S M O D E L
Customer segments
◊ Retail customers
◊ Business customers
◊ Contracting organizations
Employees Networks and infrastructure
Value proposition
◊ DB Group offers attractive, customer- focused and environmentally friendly mobility, transport and logistics solu-tions and networks from a single source.
Customer access and retention
◊ Direct customer access
◊ Digital offers
◊ Customer loyalty programs
Key activities
Operating services based on all modes of transport
Looking after customers
Fleet management
Operating and optimizing regional and global networks
Delivering additional services close to our core business
Managing interfaces
Services/outputs 1)
Quantities/volumes
Volume sold
Volume produced
EBIT ¿
µ97 ff.
Employee † satisfaction
µ87
Greenhouse ¥ gas emissions
µ90
Customer ¿ satisfaction
µ75
Attractiveness † as an employer
µ83 f.
Noise ¥
µ92 f.
Punctuality ¿
µ76 f.
Outcomes 2)
Vehicles Additional production factors
Deutsche Bahn Group 2018 Integrated Report
56

◊ Our business activities in the freight transport and logistics market were moved to an international plat-form very early on. DB Cargo and DB Schenker operate first and foremost in the business-to-business segment. We offer our customers industry-specific solutions in rail freight, in land transport, in global air and ocean freight as well as in global contract logistics. Covering all rele-vant modes of transport allows us to offer complex com-bined logistics services and to make use of synergies in our networks for the benefit of our customers.
As an operator of networks and provider of services in pas-senger transport, freight transport and logistics, as well as track infrastructure, our economic success is influenced by the general economic environment µ95 and the specific development of the various relevant markets µ58 ff.:
◊ Demand for passenger transport is driven first and fore-most by the growth of urban areas, the size of the pop-ulation, the number of people in employment, and real disposable incomes. The competitive situation relative to the car is markedly influenced by the trend in fuel prices.
◊ Our freight transport and logistics operations depend largely on economic developments. Due to our global networks we monitor the development not only of global gross domestic product (GDP) and world trade, but also of economic growth in the regions, countries, and trade relations in which we have a high market share or in which high growth rates in the exchange of goods can be expected. Customary early-warning indicators of the business climate and of the expectations of purchasing managers are an integral part of our monitoring system.
The market environment of DB Cargo is particularly influ-enced by the manufacturing industry’s production output and the development of the iron, coal and steel, and chem-ical industries. Furthermore, the cross-border movement of goods within Europe is growing in importance.
◊ The services of the Infrastructure business units cover important elements of their customers’ value-added chains. In this respect, the development of demand is a factor that is largely determined by upstream passenger and freight transport markets. The area of marketing in DB Netze Stations is also important. Consumer trends in the general public are an important factor here, much as they are in general retail in Germany.
The development of the economic and early-warning indi-cators, as presented above, influences how we manage our market activities and resources. Opportunities and risks µ168 ff. can therefore be recognized early on, and as a result short-term management activities and long-term positioning can be focused accordingly. At the same time we work sys-tematically on optimizing our operating value drivers.
Operating regional and global transport networks often necessitates a high level of capital employed, long invest-ment cycles and distinctive fixed-cost structures. In this respect, achieving optimal capacity utilization of our net-works and systematically developing, integrating, and cost-effectively operating these networks with the efficient use of resources are important to DB Group’s economic development. Ensuring and improving service quality for our customers is at the center of our activities. By expand- ing what we offer our customers, particularly digital ser-vices and customer loyalty programs, we intend to gain additional customers in order to realize increasing volumes and economies of scale.
We generally use operating performance data to mea-sure capacity utilization in our networks and our relative shares of the transport markets. In order to determine a relative return, we calculate ratios comparing this perfor-mance data with the revenues generated (specific revenues).
With its comprehensive portfolio, DB Group has an effective business model. This allows DB Group to offer services from one single source and means that it operates successfully in all segments of the transport market with its national and international services.
In most of our business units, incoming orders are not a relevant performance indicator, and the majority of the Group’s revenues are generated independently of long-term contracts.
DB Regional and DB Arriva are an exception to this rule, together accounting for about one-third of Group revenues. In these business units, the order book in the form of long-term transport contracts entered into with the public trans-port authorities of Germany’s Federal states and franchisers in other European countries constitutes a key performance metric for business development. There are also long-term contractual relationships with customers in DB Schenker’s contract logistics line of business, which gen erates about 6% of Group revenues.
GR
OU
P M
AN
AG
EM
EN
T R
EP
OR
T
57
GROUP MANAGEMENT REPORT — FUNDAMENTALS
FIN
AN
CIA
L S
TA
TE
ME
NT
SS
US
TA
INA
BIL
ITY

There are five key success factors in the development of DB Group, which are a central component of DB Group’s business model:
◊ Entrepreneurial approach to business: In the course of the German rail reform DB Group has established itself as a commercial enterprise. Particularly worth men-tioning in this context are the establishment of a modern and efficient organization and a value-based corporate management approach.
◊ Integrated Group: As a system integrator in Germany, DB Group optimizes the integrated rail system. In doing so, it serves as an important driving force for technolog-ical innovation. The integrated Group structure enables us to achieve positive synergies and align our infra-structure to support efficiency, market orientation and profitability.
◊ Cross-modal transport solutions: We offer our customers door-to-door mobility and logistics solutions from a single source. We use digital technologies to intelli-gently link various modes of transport in an economical and environmentally friendly way. In addition, we offer complementary products and services in the freight transport and logistics market.
◊ International direction: Due to our focus on Germany and Europe in passenger transport as well as our European and global orientation in the areas of freight transport
and logistics activities, DB Group has an excellent posi-tion in the relevant markets. As a result, we are respond- ing to the increasing demand for cross-border solutions. At the same time, we are best positioned to take advan-tage of growth opportunities.
◊ Digitalization: Digitalization and new technologies are changing the face of our core business. We are harness- ing digitalization technologies and methods to offer attractive products to our customers. This means, on the one hand, that we are incorporating new transport offers into our product portfolio, such as on-demand mobility µ79, and establishing new platforms for our customer interfaces. On the other hand, we support our internal processes using such technologies as arti-ficial intelligence. In order to tap into growth potential and provide a modern offer for our customers, we are establishing an innovation ecosystem µ69 f., consisting of in- house developments, affiliated companies and partnerships.
Development in relevant markets
DB Group provides national and international services. We operate globally and have leading market positions around the world:
!!!
102-6
GRI
Market positions in passenger transport (2017)
No. 2 in European long-distance rail passenger transport (based on revenues)
No. 1 in European regional rail passenger transport (based on revenues)
No. 4 in European public road passenger transport (based on revenues)
1. Société Nationale des Chemins de fer Français (SNCF) 1. DB Group 1. Régie autonome des transports Parisiens (RATP)
2. DB Group 2. SNCF 2. Transdev
3. Ferrovie dello Stato (FS) 3. Nederlandse Spoorwegen (NS) 3. SNCF
4. Swiss Federal Railways (SBB) 4. FS 4. DB Group
5. Red Nacional de los Ferrocarriles Españoles (RENFE) 5. Go Ahead 5. Transport for London
Information for competitors based on business/research reports and internal calculations.
Market positions in freight transport and logistics (2017)
No. 1 in European rail freight transport (based on tkm)
No. 1 in European land transport (based on revenues)
No. 3 in worldwide air freight (based on t)
1. DB Cargo 1. DB Schenker 1. DHL
2. Fret SNCF 2. Dachser 2. Kuehne + Nagel
3. Rail Cargo Group 3. DHL 3. DB Schenker
4. PKP Cargo 4. DSV 4. Panalpina
5. Mercitalia Rail 5. Kuehne + Nagel 5. Expeditors
No. 4 in worldwide ocean freight (based on TEUs)
No. 5 in worldwide contract logistics (based on revenues)
1. Kuehne + Nagel 1. DHL
2. DHL 2. XPO Logistics
3. Sinotrans 3. Kuehne + Nagel
4. DB Schenker 4. CEVA Logistics
5. Panalpina 5. DB Schenker
Information for competitors based on business/research reports and internal calculations.
Deutsche Bahn Group 2018 Integrated Report
58

Passenger transportIn passenger transport our target is to maintain our strong market position in the rail and bus transport market in Ger-many over the long term, while benefiting from market opportunities in Europe.
Throughout Europe, regional and local transport con-tracts are being increasingly put out to tender. Through DB Arriva we have operations in the bus and/or rail transport business in 14 European countries. This constitutes a good position for further growth. The liberalization of the Euro-pean passenger transport markets is still, however, prog-ressing at different speeds across Europe.
Outside Europe a new market for rail operation and maintenance projects is developing, for which international operators are increasingly being sought. This is the task of DB International Operations µ72.
Germany’s passenger transport market shows stable development
Passenger transport market in Germany (% based on volume sold)
Growth rate Market share
2018 2017 2018 2017
Motorized individual transport + 0.0 –1.5 1) 84.0 84.3
Rail passenger transport + 3.0 +1.4 8.9 8.5
DB Group + 3.5 +2.6 7.7 7.3
Non-Group railways + 0.5 + 5.4 1.2 1.2
Public road passenger transport + 0.0 +2.0 6.3 6.3
DB Group –3.4 –7.7 0.6 0.6
Air transport (domestic) –1.0 + 0.9 0.9 0.9
Total market + 0.2 + 1.3 100.0 100.0
Figures for 2017 and 2018 are based on information and estimates available as of February 2019. Market shares for each mode of transport have been rounded.1) Reduction due to a methodological adaptation of the German Institute for Economic Research.
The passenger transport market in Germany µ112 showed stable development in 2018:
◊ Motorized individual transport remains slightly below the level of the previous year.
◊ Rail passenger transport posted marked growth. ◊ Public road passenger transport stagnated. ◊ Air transport decreased slightly.
This was largely due to developments in the prevailing socio-economic conditions, which – though less dynamic – were still positive, as well as to special factors:
◊ Employment figures and disposable income showed solid growth, but at the same time the cost of fuel rose strongly and inflation increased slightly.
◊ The price level of flights decreased slightly while rail and long-distance bus prices showed a moderate in -crease, with car journeys becoming noticeably more expensive.
◊ Adverse weather caused heavy infrastructure damage and significant transport restrictions.
Marked increases in bus and rail travel in Europe
European passenger transport market (% based on volume sold)
Growth rate
2018 2017
Rail passenger transport +2.0 + 4.0
DB Group +1.9 + 4.6
Figures for 2017 and 2018 are based on information and estimates available as of February 2019. Growth rates for each mode of transport have been rounded up or down to the nearest half percentage point.
The European passenger transport µ112 ff. environment showed positive developments in 2018:
◊ European rail passenger transport grew significantly by about 2.0%.
◊ Long-distance bus transport in Europe showed mod-erate growth, driven largely by the expanded offer of FlixBus.
Employment and real disposable incomes rose moderately in many European states, while annual average fuel prices increased considerably.
Steps toward market liberalization often stimulated European bus and rail transport:
◊ The French Senate decreed a rail reform µ64, which in-cludes progressively opening the national passenger transport market to competition. DB Arriva signed a strategic partnership with the French regions on the development of passenger rail transport.
◊ The Finnish Ministry of Transport and the state-owned railway VR Group signed an agreement on opening the national rail market. In the first stage, vehicle and prop-erty companies were hived off and placed under the direct control of the Ministry of Transport.
◊ Norway awarded its first tendered transport contract in October 2018 to the British company Go Ahead, thus opening the railway market to competition.
GR
OU
P M
AN
AG
EM
EN
T R
EP
OR
T
59
GROUP MANAGEMENT REPORT — FUNDAMENTALS
FIN
AN
CIA
L S
TA
TE
ME
NT
SS
US
TA
INA
BIL
ITY

Freight transport and logisticsWith DB Cargo and DB Schenker, we are positioned in the freight transport and logistics market as one of the world’s leading logistics services providers. The demand for inter-national freight transport services is rising further owing to the ongoing shift toward cross-border production struc-tures and flows of goods and the continuing trend for the outsourcing of logistics services. We aim to make use of this opportunity to maintain and/or expand our excellent market positions. DB Cargo is Europe’s leading rail freight service operator, with a presence in all major markets. We use our own European production network for this. In this network, national and cross-border transport is conducted in a customer-oriented and environmentally friendly man-ner. DB Cargo is focused on the automotive, building mate-rials, industrial and consumer goods, chemicals, iron, coal and steel, and combined transport industries.
DB Schenker supports industry and trade through global and integrated logistics, which involves land transport, worldwide air and ocean freight, contract logistics and sup-ply chain management. DB Schenker occupies excellent positions in the automotive, technology, consumer goods, trade fair forwarding, special transport and services for major sporting events.
German road freight transport: still posting above-average growth
German freight transport market (% based on volume sold)
Growth rate Market share
2018 2017 2018 2017
Rail freight transport ~+1.7 + 0.8 18.7 18.6
DB Group ~– 5.0 –1.6 9.1 9.7
Non-Group railways ~+ 9.0 + 3.6 9.6 8.9
Road freight transport ~+ 3.2 ~+2.4 72.0 70.7
Inland waterways ~–12.0 +2.2 6.9 8.0
Long-distance pipelines ~– 5.5 –2.8 2.4 2.6
Total market ~+ 1.5 ~+ 2.0 – –
Figures for 2017 and 2018 are based on information and estimates available as of February 2019. The market share for each mode of transport has been rounded.
On the basis of initial, still preliminary assessments, the positive development of demand in the German freight trans-
port market µ133 continued with a further increase in per-formance in its sixth year. In this regard, it is also important to take into account the statistical corrections performed in the specified period for road and rail freight transport
due to the volume sold of trucks in Germany registered abroad having been previously underestimated, as well as due to the expansion of the reporting scope of the Federal Statistical Office of Germany for freight railways active in Germany. These adjustments have led to a deviation from the previous representations.
Above all, the sustained positive economic effects of robust domestic demand and further improvements in international trade increased the need for transport, which put growing pressure on available resources and therefore on the development of costs. The recent, significant rise in fuel costs also contributed to this.
◊ Nevertheless, truck transport once again showed above- average development, including as a result of strong stimulation from expanding construction output.
◊ In rail freight transport, there was continued growth due to the extended reporting scope. Alongside stimu-lation from the strong overall economic development, the railways also profited from a positive baseline effect following several weeks of closure of the Rhine Valley section at Rastatt in the previous year. Dampening ef-fects resulted from factors such as the continued decline in coal transport as a result of the energy transition, as well as portfolio adjustments by the energy producers, problems in the automotive industry, weak steel produc-tion, strikes in France and weather-related constraints.
◊ The extremely low water levels had a crucial impact on development on the German waterways. In the late summer months performance fell by 40% at times, which led to a two-digit shortfall in full-year perfor-mance compared to the previous year.
International markets with growth in demand
International freight transport and logistics markets (%)
Growth rate
2018 2017
European rail freight transport (based on tkm) ~+2.0 +2.7
European land transport (based on revenues) + 3.9 + 4.8
Air freight (based on t) + 3.5 +10.0
Ocean freight (based on TEUs) + 4.6 + 4.7
Contract logistics (based on revenues) + 4.4 + 4.2
Figures for 2017 and 2018 are based on information and estimates available as of February 2019.
Deutsche Bahn Group 2018 Integrated Report
60

The positive developments of the international transport
and logistics markets µ134 continued, albeit at a slightly weaker level.
InfrastructureIn Germany, we have assumed dual responsibility for rail transport as a result of our integrated Group structure: we are both the operator and primary user of the track infra-structure. The resulting greater focus on customers and efficiency in our infrastructure benefits all train operating companies (TOC) without discrimination. In addition to the Group’s internal code of conduct, competitive neutrality of our track infrastructure is ensured by means of regulation that is considered strict by international standards.
Increasing demand for track infrastructure
DB track infrastructure in Germany: selected key figures 2018 2017
Change
absolute %
Infrastructure customers 440 431 + 9 +2.1
DB Group 18 17 +1 + 5.9
Non-Group 422 414 + 8 +1.9
Train-path demand (million train-path km) 1,085 1,073 +12 +1.1
DB Group 736.2 741.7 – 5.5 – 0.7
Non-Group railways 349.2 331.3 +17.9 + 5.4
Share of non-Group railways (%) 32.2 30.9 – –
Station stops (million) 154.1 153.2 + 0.9 + 0.6
DB Group 117.1 117.1 – –
Non-Group railways 37.0 36.1 + 0.9 +2.5
Train-path demand showed a further positive development in total for 2018. In line with the trend shown for many years, non-Group railways gained a further market share, while demand for intra-Group railways declined.
Legal and political topics
Legal issuesProceedings regarding additional financing contributions for Stuttgart 21At the end of 2016, in order to avoid risks under the statute of limitations, we initiated proceedings in the Stuttgart Administrative Court against our project partners seeking additional financing contributions on the basis of what is known as the negotiation clause. The project partners gave a comprehensive response to the lawsuit in Spring 2018. The court granted DB Group the opportunity to state its position by the end of February 2019 in response to the statement of defense. A verbal negotiation regarding the lawsuit is not anticipated until the second half of 2019 at the earliest. This is also due to the fact that the project partner will be given the option to provide a written response to the statement of defense before the verbal negotiations.
Civil proceedings on infrastructure usage feesAccording to a ruling by the Federal Supreme Court (Bun des- gerichtshof; BGH) in 2011, fees for the use of rail infrastruc-ture could be reviewed by the civil courts for fairness under legislation prevailing before the entry into force of the Railway Regulation Act (Eisenbahnregulie rungs gesetz; ERegG), according to the standard set out in section 315 of the Civil Code (Bürgerliches Gesetzbuch; BGB), even if BNetzA did not object to the fees and they were effective according to regulatory law. In 2016, the ERegG created legal certainty by introducing approval of train-path and station-use charges by BNetzA and legally excluding a par-allel review of approved charges by the civil courts on the basis of proceedings under section 315 BGB.
However, a number of legal disputes between DB Netz AG, DB Station&Service AG, and TOC or public transport authorities or Federal states continue to be based on the previous legal situation.
Additional information can be found in the 2017 Integrated
Report µ54 and Events after the balance sheet date µ174.
GR
OU
P M
AN
AG
EM
EN
T R
EP
OR
T
61
GROUP MANAGEMENT REPORT — FUNDAMENTALS
FIN
AN
CIA
L S
TA
TE
ME
NT
SS
US
TA
INA
BIL
ITY

Lawsuit by the Federal state of Saxony-AnhaltThe Federal state of Saxony-Anhalt filed a lawsuit against DB Netz AG, DB Regio AG and DB AG claiming compensa-tion for damages under antitrust law due to allegedly illegal train-path pricing by DB Netz AG through the levying of regional factors between 2005 and 2011. The lawsuit was extended to include the assertion of corresponding claims against DB Regio AG for 2003 and 2004. DB Group opposed this lawsuit in every respect. For its part, DB Regio AG is suing the Federal state of Saxony-Anhalt for reimburse-ment of outstanding transport contract-related receivables relating to increased infrastructure utilization costs be- tween 2008 and 2014. The Federal state has offset its alleged claims for compensation under antitrust law for 2003 and 2004 against the receivables owing to DB Regio AG. The ruling of the ECJ on the non-applicability of section 315 BGB has improved our prospects of success in both cases. By the ruling of November 8, 2018, the Frankfurt State Court (Landgericht Frankfurt am Main) entirely re jected the claim of the Federal state of Saxony-Anhalt. The ruling is not yet legally binding. It remains to be seen as to when a decision will be made regarding the proceedings initiated by DB Regio AG.
Political environmentWe regularly report on the development of competition on the rail in our brochure ŒCompetition Report.
Federal Government makes strong commitment to rail transportIn the coalition agreement of February 7, 2018, the Union parties Christian Democratic Union (CDU) and Christian Social Union (CSU) as well as the Social Democratic Party of Germany (SPD) have committed to strengthening the railway in Germany and to an integrated DB Group. The coalition agreement includes numerous topics that are important to the entire industry. The political target is to double passenger numbers by 2030 and to bring more freight transport to the rails. Focus topics for the sector from a DB Group perspective include:
◊ Continued capital expenditure increase providing the funds needed, in particular, for the existing network (LuFV III) as well as for expansion and new construc-tion measures, implementation of a Planning Acceler-ation Act (Planungsbeschleunigungsgesetz), and ap -pli cation of building information modeling (BIM) µ147;
◊ Implementation of the master plan for rail freight trans-
port µ63, in particular with train-path price support, reali zation of the 740 m network µ150, and establishment of a Federal program Future of Rail Freight Transport for innovations;
◊ First steps into Digital Rail for Germany µ71, includ- ing the accelerated expansion of European command and control technology ETCS no. 145 and digital inter-lockings;
◊ Further work on a synchronized timetable for all of Ger- many (Deutschlandtakt) including a target schedule and appropriate infrastructure measures;
◊ Strengthening of the rail mode of transport within the context of climate and environmental protection, includ- ing appropriate measures in the planned Climate Pro-tection Law (Klimaschutzgesetz), a program for electri-fication and alternative drives, as well as continued commitment to noise reduction no. 25.
Regulatory and transport policy topicsNational platform future of mobility launchedThe national platform set up by the Federal Government, future of mobility (Zukunft der Mobilität), began its work with the constitutive meeting of the steering committee on September 26, 2018. The aim of the cross-modal platform is to develop recom mendations for action. The work of the platform is subdivided into six working groups: Climate protection in transport; Sustainable mobility: alternative drives and fuels; Digitalization, automated driving and new mobility concepts; Securing the mobility and production site, battery cell production, raw materials and recycling, training and qualifications; Integrated energy (especially linking traffic and energy networks); Standardization, nor-malization, certification and approval. DB Group is repre-sented in the steering committee and in the working groups Climate protection in transport and Digitalization.
Rail Future Alliance starts its workOn June 5, 2018, Federal Minister of Transport Andreas Scheuer announced the launch of the Rail Future Alliance (rail pact), which will swiftly address the targets and mea-sures of the Federal Government with regard to rail policy. The Future Alliance, under the management of the parlia-mentary Secretary of State Enak Ferlemann, began its work on October 9, 2018. The contents of the Future Alliance were developed and discussed within five thematic working groups: introduce a synchronized timetable for all of Ger-many (Deutschlandtakt), build capacity, strengthen the
Deutsche Bahn Group 2018 Integrated Report
62

competitiveness of rail, reduce noise emissions, and digita-lization, automation, and innovations. DB Group participates in all the working groups and in the steering committee.
Master plan for rail freight transport is being implemented furtherThe implementation of the master plan for rail freight transport will continue as per the procedure thus far in order to supplement the work of the Rail Future Alliance. The rail freight transport round table held another meeting with the key representatives of the BMVI and from the sector on September 25, 2018. The implementation and associated monitoring required for all ten areas of action with the 66 measures should be continued with the highest priority. The immediate measure of train-path price support began in 2018. The associated funding directive was pub-lished following EU approval in December 2018 and apply retroactively from June 2018 for a period of five years. In 2018, funding of € 175 million was available, while in 2019, € 350 million is earmarked in the Federal budget. Immediate measures to be taken also include the Federal program Future of Rail Freight Transport, which seeks to strengthen innovation in the sector. There are plans for concrete finan-cial backing and the development of a funding guideline.
Guideline on promoting the energy efficiency of electric rail transportWith the funding guideline that entered into force on August 9, 2018, the BVMI supports the TOCs if they improve the efficiency of their electric volume sold. The funding is combined with an annually achieved percentage improve-ment of energy efficiency in traction current usage. In 2018 and 2019, the initial limit for claiming the funding is subject to achieving a 1.75% specific annual energy- efficiency improvement, while in 2020, 2021 and 2022 the requirement is for a 2% annual efficiency improvement. A special bonus is granted if a threshold of 3% is achieved. In addition, evidence must be given of expenses for measures applied to improve energy efficiency. The grant amount is a maximum of 50% of the expenses for the measures applied to improve energy efficiency in the relevant ac -counting year. Each year, a grant amount of € 100 million is available. The program runs until the end of 2023.
Law to accelerate planning and approval processesAfter publication in the Federal Gazette, the Law to Accel-erate Planning and Approval Procedures in the Transport Sector (Gesetz zur Beschleunigung von Planungs- und Ge -nehmigungsverfahren im Verkehrsbereich) entered into force on December 7, 2018. This law will streamline the planning and approval procedures for the expansion and new construction of transport infrastructure. From De cem- ber 6, 2020, the Federal Railway Au thority (Eisenbahn- Bundesamt; EBA), as well as being responsible for plan approval procedures, will also be responsible for upstream hearing procedures. During rail projects, traffic develop-ment forecasts will only be updated during the course of the approval procedure if a significant increase in traffic and noise can be expected or if the emission limit value is exceeded for the first time. In addition, in certain cases preparatory measures or partial measures can be initiated even prior to the plan approval decision being issued. In this case, the measures must be reversible and in the public interest. Furthermore, among other stipulations, the law stipulates that all plan approval documentation must be published online.
BNetzA defines tender awarding conditions for 5G frequenciesAt the end of November 2018, the President’s Chamber of BNetzA determined that tendering and auction proceed-ings be conducted for the awarding of the 5G frequency contract planned for early 2019. The supply conditions it contains will be used to predefine the minimum require-ments for mobile communications network operators, including for the coverage of transport routes. For rail, the decision is that “highly frequented lines” with over 2,000 passengers per day will be provided with coverage of 100 Mbit/s per licensee by 2022, and all remaining railway lines will be provided with coverage of 50 Mbit/s per licensee by 2024. This comprises about two-thirds of the total network. It is expected that the newly determined conditions will result in an improved mobile communications supply situ-ation for rail passengers. The mobile communications net -work operators are criticizing the conditions under which the tender was awarded and have submitted an appeal against the decision. However, there are no legal barriers to performing an auction because the appeal does not have any suspensive effect. BNetzA has not yet indicated a con-crete auction date.
GR
OU
P M
AN
AG
EM
EN
T R
EP
OR
T
63
GROUP MANAGEMENT REPORT — FUNDAMENTALS
FIN
AN
CIA
L S
TA
TE
ME
NT
SS
US
TA
INA
BIL
ITY

Substantial parts of Mobility Package I renegotiatedSubstantial parts of Mobility Package I must be renegoti-ated after the European Parliament’s rejection in July 2018 of the recommendations made by the responsible traffic committee on work and social conditions as well as market access to the European road transport business. The main contentious point continues to be the conditions under which the regulations of individual states on employment conditions in international road freight traffic should apply (deployment), what number of loading and unloading oper-ations outside of the home state is permitted within what time frame (cabotage), and how driving and rest peri ods should be arranged in the future. A majority of members of parliament spoke in favor of aligning the employment con-ditions in Europe, although the position of Central and Eastern European states is opposed to that of the Western EU countries. This mindset is also reflected in the Council of the European Union. Nevertheless, the representatives of the member states communicated a common position in December 2018. A common position is still outstanding in the European Parliament. As a result, it remains to be seen whether an agreement can be reached between the Council and the Parliament before the new elections of the Euro-pean Parliament at the end of May 2019.
Long-term strategy for reducing greenhouse gas emissionsIn November 2018, the European Commission presented its new strategy for reducing greenhouse gas emissions in the period 2030 to 2050. In doing so, it presented a strategic vision for a modern, competitive and climate-neutral econ- omy for Europe and gave an indication of how Europe should move toward climate neutrality by 2050. According to the Commission, common measures must be developed in seven strategic areas, including mobility, energy efficiency, and the use of renewable energies. In the transport sector, a cross-modal, integrated approach is to phase out the use of fossil fuels by 2050. The Commission calls on the other EU institutions to review this vision and to support it with appropriate measures.
Proposals for a multi-year EU financial frameworkOn May 2, 2018, the Commission proposed a budget amounting to € 1,279 billion for the new EU budget (MFF) for the years 2021 to 2027. The funds of the Connecting Europe Facility (CEF) are to be increased to € 42.3 billion for investments in trans-European transport, digital and energy networks, of which approximately € 31 billion are earmarked for investments in transport networks. In the current financial framework, the budget for transport net-works is about € 24 billion. Top-ups come from a separate budget of € 6.5 billion for transport networks with a dual civil and military use. In 2018, the European Parliament argued in favor of additional resources of € 7 billion for the transport network. The Council of the European Union has not yet taken a position on the matter. Since the discussion on the CEF budget is embedded in the negotiations on the financial framework of the EU, no result is expected before the second half of 2019.
French rail reform resolvedThe main topics of the rail reform in France as enacted in June 2018 are the gradual opening of the national rail pas-senger transport market to competition (market opening in regional rail passenger transport between December 2019 and December 2023, with longer periods for the Paris metropolitan area, in long-distance transport operated on a purely commercial basis as of 2020), the reorganization of the SNCF into a stock corporation permanently owned by the government, the removal of public servant status for new employees at the SNCF as of the start of 2020, the assignment of the passenger stations segment to the rail infrastructure operator SNCF Réseau and the order ar rang- ing an employee transfer in the event of an operator change in regional rail passenger transport. Alongside this, the government is planning to relieve SNCF group of debts to the tune of € 35 billion. Widespread strikes occurred in France from April to July 2018 in connection with the rail reform.
Deutsche Bahn Group 2018 Integrated Report
64

Targets and strategy
65 Trend efforts include change in the environment66 Getting DB Group ready for the future72 Using expertise internationally
Trend efforts include change in the environmentWe monitor changes in our environment and use them to develop strategies, new business models and innovative products and services. We also identify future requirements based upon specific visions that consolidate assumptions about future developments that are directly relevant to DB Group.
In the year under review, we expanded our Network of the Future – which is made up of market, strategy, person nel, sales and technology experts – and continued to promote cooperation within this network. We have carried out a systematic trend analysis and assessment in the fields of markets, society, technology and politics, and amalgamated them to produce a consistent and comprehensive view of the future. This analysis focuses on how future developments will impact on DB Group’s business operations or on our markets and the urgency of these effects. The individ ual topics are highly interconnected and constantly changing.
In the year under review, our trend monitoring focused upon four themes. In all these areas, it is particularly im port ant that we take the correct approach now to ensure that our business is fit for the future.
Digitalization and automationNew digital technologies and intelligent, learning IT systems are enabling the full digitalization of many sectors. This process is being facilitated, in particular, by the automation of a number of work stages. However, tasks that call for intelligence and creativity cannot be automated. In
these fields, human beings are increasingly being assisted by new systems based upon artificial intelligence such as selfdriving cars or digital assistants, that can learn independently and respond to unforeseen situations.
In railway operations, too, digitalization and automation are opening up promising opportunities for development. Digital interlockings µ81 and the European Train Control System (ETCS), as well as the associated digital applications for rail operations, are allowing us to alleviate the quality problems caused by outdated systems and im pend ing personnel shortages, reduce operating costs and expand network capacity in the long term.
On-demand offeringsDigitalization is changing people’s expectations regarding consumption. Products and services need to be available immediately and at any time, that is on demand. Increasingly, this is resulting in sameday or even samehour deliveries, which tend to be supplied as smaller, more frequent shipments. This calls for new logistical concepts and delivery methods such as drones, delivery robots or cargo bikes.
In individual mobility, too, there is a clear trend towards offerings that are available in real time. In the foreseeable future, we will start seeing autonomous vehicles that adapt dynamically and efficiently to passenger demand rather than buses with fixed routes and timetables. Public passenger transport will thus be extended to include individual public transport.
Against this backdrop, DB Group is positioning itself both as a platform provider and an operator, firstly enabling third parties – that is public transport authorities and trans port companies – to offer ondemand transport in their own name and gradually integrate autonomous driving on the road into public transport, and secondly operating our own ondemand mobility services that serve as a feeder for rail passenger transport.
GR
OU
P M
AN
AG
EM
EN
T R
EP
OR
T
65
GROUP MANAGEMENT REPORT — FUNDAMENTALS | TARGETS AND STR ATEGy
FIN
AN
CIA
L S
TA
TE
ME
NT
SS
US
TA
INA
BIL
ITy

Smart and sustainable citiesBecause people generally like urban living and because both job opportunities and services tend to be better in towns and cities, it is predicted that the proportion of people living in urban environments will rise to almost 85% by 2050. At the same time, mobility requirements for both people and goods are growing, posing challenges for cities and conurbations.
Cities are responding to these changes firstly by im pos ing regulations such as bans on diesel vehicles and, secondly, by promoting innovative solutions that aim to promote efficiency, technological progress and social and ecological improvements in urban life. They often do this in collaboration with partners from industry. We support cities especially with our product development organization Smart Cities. We are working on topics such as cowork ing spaces in stations and a comprehensive data analysis platform to optimize urban products and services and identify new business potential.
Digital platformsDigital platforms are becomingly increasing commonplace and they are revolutionizing spheres of life and business such as logistics, purchasing and communication. Such platforms offer participants a digital network structure that makes it easy to exchange information and services, meaning that their benefits and attractiveness increase with the number of users.
Conventional business models are increasingly being driven out by Internet platforms such as Amazon, Zalando or Booking.com, and social networks such as Facebook and Instagram have spawned completely new needs and markets. The companies behind these platforms systematically collect and exploit user data so that they can offer services or products faster, more cheaply and with greater flexibility and choice. In the logistics sector, in particular, networking via digital platforms allows customers and suppliers to find each other more quickly, thereby optimizing the provision of transport services.
We, too, are active in the platform business and are devel oping digital platforms such as ŒBox2Rail (for the easy and transparent booking of rail transport) so that we can offer our customers and business partners new options relating to our product portfolio.
Getting DB Group ready for the future
Our DB2020+ strategy puts a strategic framework in place for DB Group. Regular reviews of the DB2020 target system have led to the following changes in the year under review:
◊ Economic ¿: we have adjusted our ROCE targets to reflect persistently low interest rates.
◊ Environmental ¥: As a result of capacity constraints in maintenance at DB Cargo, we have slightly extended the process of the conversion of freight cars to whis per brakes.
In 2019, we will finish developing our future strategic orienta tion up to 2030. This is based on the Agenda for a Better Railway set in the year under review to improve service quality and on our new ecosystem management system µ69 f. to im prove DB Group’s innovative strength and digitalization µ77 ff.
Agenda for a Better RailwayIn the integrated rail system µ50 our Railway of the Future program represented a commitment to eliminate the key annoyances for our customers and significantly improve the quality of our services, in particular in terms of punctuality, passenger information and the cleanliness of stations. Our survey of the situation in the year under review showed that we have been unable to achieve the desired progress in key areas. Since 2015, we have made improvements in areas that matter to customers – such as malfunctions, trackchange information and onschedule departures – but we still fell short of our targets, particularly in terms of quality and punctuality. Our successes were also eclipsed by capacity problems in infrastructure, vehicles and personnel. In the year under review, we therefore developed our Agenda for a Better Railway so that we could continue working on the subjects from Railway of the Future and augment them at key points. The focus will remain on the integrated rail system, and we will concentrate our activities on topics that are critical for success, ensuring that the measures in question are implemented. To help us achieve these objectives, we are strengthening line organizations and overall process responsibility.
1021010248
GRI
Deutsche Bahn Group 2018 Integrated Report
66

Eco
no
mic
Soci
alE
nvi
ron
me
nta
l
¿
†
¥
0%
88% 100%
200%
O U R TA R G E T S
Culture of quality
Operational excellence and customer focus
Digital expertise
Innovative solutions in our core and new businesses
Performance capability
Shared responsibility and strong performance
O U R A R E A S O F A C T I O N
Profitable quality leader
Starting value
DB2020 2017
2018Target
DB2020+
Behind schedule On schedule Ahead of schedule Prog-
ress 20 40 60 80 100 120 140 160 180
Customer satisfaction –Passengers (SI) – 75.8 75.1 ~79
Customer satisfaction – freight transport and logistics (SI) – 70.5 65.5 ≥ 73
Product quality – punctuality DB Group (rail) in Germany (%) 94.4 93.9 93.4 ≥ 95
Reasonable rate of return – ROCE (%) 8.3 6.1 5.8 ≥ 7.0
Financial stability – redemption coverage (%) 22.2 18.7 17.6 ≥ 25
As a profitable quality leader we offer our customers first-class mobility and logistics solutions, that is excellent quality at affordable costs.
As a top employer, we attract and retain qualified employees who are enthusiastic about working for us and our customers.
As an eco-pioneer, we set benchmarks with our products for the efficient use of available resources.
Top employer
Starting value
DB2020 2017
2018Target
DB2020+
Behind schedule On schedule Ahead of schedule Prog-
ress 20 40 60 80 100 120 140 160 180
Employee satisfaction (SI) 3.6 – 3.7 4.0
Follow-up workshop implementation rate (%) – 97.1 – –
Employer attractiveness (rank in Germany) 26 13 13 ≤ 10
2018
Eco-pioneer
Starting value
DB2020 2017
2018Target
DB2020+
Behind schedule On schedule Ahead of schedule Prog-
ress 20 40 60 80 100 120 140 160 180
Climate protection – specific greenhouse gas emissions compared to 2006 (%) –12.0 –29.5 –33.2 –30
Climate protection – share of renewable energies in the DB traction current mix (%) 24.0 44.0 57.2 45
Noise reduction – quiet freight cars in Germany as of Dec 31 7,349 39,604 50,409 63,000
Noise reduction – track kilometers noise remediated in total as of Dec 31 (km) 1,200 1,701 1,758 2,000
2018
2018
2018
2018
2018
2018
2018
2018 Progress. Are we progressing as planned? (Difference between control and 100 % shows delay/lead as a proportion of the actual deviation from target value)
2018
2018
2018
O U R A S P I R AT I O N O U R S T R AT E G Y DB2020+ Implementation status for 2018:
We drive progress and shape the future.Sustainable business success and social acceptance.
Behi
nd sc
hedule
On schedule
Ahead of schedule
Progress (weighted degree of target attainment)
GR
OU
P M
AN
AG
EM
EN
T R
EP
OR
T
67
GROUP MANAGEMENT REPORT — TARGETS AND STR ATEGy
FIN
AN
CIA
L S
TA
TE
ME
NT
SS
US
TA
INA
BIL
ITy

The Agenda for a Better Railway is made up of three subject areas:
◊ In terms of infrastructure, constantly increasing traffic volumes must be operated on a network that is heavily overloaded in many areas, whilst maintaining operational quality. To achieve this we firstly need to continue and intensify the capital expenditure initiative re gard ing the maintenance, new construction and expansion of the rail network. Secondly, more intelligent construction site management and the organizational realignment of DB Netze Track will help to achieve higher levels of punctuality and quality. The Digital Rail for Germany µ71 project will also be an essential factor in the future success of the system as a whole. By investing heavily in new trains, we are putting in place the conditions for growth and better service, and by improving maintenance we will increase the availability of our fleet. We are thus further expanding our workshop capacities by taking advantage of the opportunities offered by digitalization, for example the possibility of detecting ve hicle damage at an early stage. We will also meet the re sult ing staffing requirements.
◊ To meet our growth targets we are increasing the at trac tiveness of our product portfolio, placing special em pha sis on increasing basic quality. Our main aim is to im prove customer experience. In terms of passenger transport, we have set ourselves the target of expanding our mobility portfolio to create a seamless, doortodoor digital customer experience. The main focus of our efforts is on enhancing our customers’ travel experience, gradually increasing punctuality, getting more reliable information to our customers throughout the travel chain and offering travelrelated services. In freight transport, our main concern is continuously im proving the quality of transport and building upon the advantages of the rail system. We are responding to changing customer requirements with products from a comprehensive logistics solution provider.
◊ To improve performance, we align our process design, control logic and management model with interlinked production in the integrated railway system, focusing on greater customer orientation during service provision. Because performance depends on a large number of business units, we create continuous processes with clearly defined responsibilities and manage these processes based upon key indicators that matter to our customers, giving our management team the resources they need to effect this transformation.
In 2019, we are following a fivepoint plan to implement the Agenda for a Better Railway:
◊ Better punctuality: We want to reduce delays caused by bottlenecks in vehicle availability µ116 f. We are therefore systematically expanding our longdistance transport fleet and modernizing existing vehicles. We also want to make progress by improving our maintenance. In addition, better management of our construction sites is of decisive importance for punctuality. The construction management center is a great help, too.
◊ Capital expenditures: In 2019 we, together with the Federal Government, aim to increase capital expenditures in the rail network to new levels, thereby increasing the capacity of infrastructure and vehicles alike. We are also investing in digitalization and plan to hire about 22,000 staff. The existing PlanStart team µ76 f. will be doubled. And, in the socalled plan corridors µ76 f., we want to keep the congestion effects of problematic sections on the system as a whole to a minimum.
◊ Information: An increased number of digital services allow us to offer reliable information and greater convenience. We want to significantly reduce irritations. We are expanding WiFi µ79 on IC trains, in local public transport and at our stations.
◊ Expansion of services: Since the timetable change in midDecember 2018, we have expanded our longdistance services by 4%. The SBahn (metros) in Munich and Hamburg are further modernizing their fleets to cope with the growing number of passengers. We will also be procuring new vehicles for regional transport.
◊ Climate protection: This year will see us increase our lead as the most environmentally friendly means of transport, with the share of renewable energies in the DB
traction current mix µ90 f. set to increase further in 2019. To help fight climate change in Germany we will increase the volume of freight we carry by rail.
!!!
Deutsche Bahn Group 2018 Integrated Report
68

…
Infrastructure
Retail
Smart Logistics
Smart Production
…
DB New Mobility Partner GmbH
New ecosystem management for greater innovative capacityDigitalization and new technologies are changing our core business. Due to much shorter innovative cycles, new markets are arising much more quickly than before and innovative pressure is rising. Tapping into growth potential and ensuring that DB Group remains innovative and competitive in the long term calls for an ecosystem approach.
A central managing and controlling ecosystem holding company is being established to permit effective ecosystem management in DB Group. The primary objectives of ecosystem management are to enhance DB Group’s core business over the long term, develop new business models and enrich our classic core business by innovation. Ecosystems that relate to specific subject areas but are organizationally separate from our core business will be set up within this holding company. An ecosystem comprises a portfolio of:
◊ inhouse and joint developments, ◊ investments by the acquisition of shares in external
com panies (majority and minority interests including venture capital financing), and
◊ strategic partnerships with and without an equity stake.
Each ecosystem interacts with the core business, allowing portfolio companies to benefit from access to customers, network and other DB resources. This gives rise to knowledge transfer, rapid scaling, and access to new technologies and markets, creating opportunities and increasing innovative power. The value of each investment is increased by active management. We define relevant ecosystems in the context of current dynamics in the marketplace, as well as our strategic orientation. In 2019, we will launch the New Mobility and Smart Production ecosystems.
◊ New Mobility: To retain our position as the largest mo bil ity service provider in Germany and one of the lead ing providers in Europe, we are establishing DB New Mobility Partner GmbH, which is organizationally assigned to the Passenger Transport division, for this eco system. The company’s main job is to continuously formulate DB Group’s strategic approach in the New Mobility market segment and to implement this strategy by building a portfolio of new mobility business es. This will allow us to combine existing business with new types of mobility, thereby becoming an integrated service provider for our end customers and partners such as transport associations and cities. The portfolio includes companies we have founded, such as ioki µ79 and Mobimeo µ71, as well as investments in GoKid µ70, Ridecell µ70 and verimi µ79.
E C O S Y S T E M H O L D I N G C O M P A N Y O R G A N I Z AT I O N A L C H A R T
Ecosystem management
OKM Ökosystem Management GmbH
Deutsche Bahn Digital Ventures GmbH
Divisions
Ecosystems
Spin-off companies
Control/coordination/alignment
Management
GR
OU
P M
AN
AG
EM
EN
T R
EP
OR
T
69
GROUP MANAGEMENT REPORT — TARGETS AND STR ATEGy
FIN
AN
CIA
L S
TA
TE
ME
NT
SS
US
TA
INA
BIL
ITy

◊ Smart Production: We want this ecosystem to focus on Groupwide digitalization and increase the flexibility of operating processes in our core markets of mobility, infrastructure and logistics. The digitalization of production processes and the linking of vehicles or track infrastructure will allow us to increase the efficiency of value creation in operational processes by cost savings, capacity increases and quality improvements.
An ecosystem can be hived off as an independent management company, transferred to an existing business unit or kept in the ecosystem holding company in the long term. If the first option is taken, the ecosystem holding company remains responsible for the execution of all investment types and close coordination continues.
DB Digital Ventures with five new investmentsŒDeutsche Bahn Digital Ventures GmbH (DB Digital Ventures) is part of our ecosystem management system and invests in datadriven business models to take advantage of the opportunities of digitalization. Its purpose is to intensify cooperative arrangements relating to startups and to simplify equity investments in other companies. In addition, DB employees are able to turn their own business ideas into reality under ideal conditions as founders of their own startups. In the year under review, the portfolio grew by a further five to ten investments:
◊ ŒGoKid is a platform for carpooling and lift sharing to get children to school or leisure activities.
◊ ŒRidecell provides an intelligent software platform for the operation of car sharing, carpooling and autonomous fleet management.
◊ ŒTrillium develops cybersecurity software to protect networked vehicles against hacker attacks.
◊ ŒCoord provides a cloudbased platform for a wide range of mobility data and offers developers of mobility companies access to this data.
◊ ŒKepler is a satellite communications company that is building a satellite network to permit standardized realtime connectivity for any Internet of Things (IoT) device.
Group programs continuedOur Group programs are devoted to subjects that address relevant trends µ65 f. and drive the development of DB Group. As part of the further development of our strategy
µ66, we will continue to focus our 2019 program portfolio µ175 and address the main issues of the integrated rail system. We are streamlining our committees and directing attention towards the Agenda for a Better Railway µ66 ff., again with the objective of increasing the functionality of the integrated rail system and thereby guaranteeing the best possible customer experience.
Ecosystem management DB Group
O V E R V I E W O F T H E E C O S Y S T E M M A N A G E M E N T B Y T H E E C O S Y S T E M H O L D I N G C O M P A N Y
Investments
◊ Minority/majority holdings in external companies
◊ Full acquisition
◊ Sale of shares, where appropriateDevelopments
◊ In-house/joint developments
◊ Development of competence
◊ Spin-offs
Partnerships
◊ Group-wide with and without capital investment
◊ Ecosystem-specific
◊ Technology transfer
Opportunities
◊ Scouting expertise
◊ Establishment of networks
◊ Regular reviews and systematic implemen-tation, for example disinvestment in the event of lack of scaling
Scaling
◊ Support by DB assets and Group functions
◊ Faster handling outside Group processes
Management
◊ Close measurement of success along key indicators and business plan
◊ Fertilization of core business
◊ Realization of synergies between ecosystem teams
Portfolio
Activities
Deutsche Bahn Group 2018 Integrated Report
70

Digital Rail for Germany The aim of the Digital Rail for Germany no. 145 project is to significantly increase the reliability – and in particular the punctuality – of rail transport. Our vision is digitalized rail transport with an integrated system of capacity management and operational implementation. Traffic control based on artificial intelligence techniques for coordinating train operations, realtime determination of train positions, highperformance data exchange between train and infrastructure, and sensorbased detection of obstacles lay a firm foundation for making this vision a reality. The technologies required for the implementation of the target image were identified in the year under review and their degree of matu rity was assessed. Work has begun to develop functional and technical specifications. In order to ensure that Europewide standards are created, we work closely with other rail ways. The feasibility studies for pilot projects (and, in particular, Hamburg SBahn (metro)) emphasize the ad van tages of technological change on the rail. A cooperative agreement between the City of Hamburg, Siemens and DB Group has been signed for the Digital S-Bahn (metro) Ham-
burg pilot project µ81. A system architecture has already been developed in collaboration with industrial partner Siemens and the specification phase has begun. The start of the accelerated rollout of ETCS in combination with the digital interlocking was introduced at InnoTrans in the year under review. Investment projects on this scale can only be implemented by working with partners from industry and commerce, customers and owners. In 2019, we will therefore be aiming to develop and implement a suitable partnering concept, as well as further expanding our organization.
iokiIn the Œioki project our focus is on developing modern, flexible and digital mobility solutions. ioki µ79 is a fullservice provider for types of roadbased digital mobility that make traffic more sustainable and efficient. These are sustainable, economically viable and socially equitable solutions that safeguard our mobility in the long term whilst protecting the environment and ultimately improving qual ity of life. ioki is developing an open environment for on demand mobility that is closely integrated into local public transport and permits seamless mobility. ioki offers all system modules such as platform and app, driverbased and autonomous vehicle concepts or mobility analytics from a single source, allowing third parties, cities or local public transport authorities to operate ondemand public trans
port mobility offerings under their own name. The company is piloting ondemand mobility, autonomous driving and mobility analytics to make them commercially viable for customers and partners.
MobimeoMobility platforms are increasingly gaining ground against existing providers with customercentric, digital offerings. The analog customer interfaces that have been in use up to now will become less important than digital ones in the future. In response to these changes, we are continuing to pursue the goal of adjusting and developing our digitalization activities at the customer interface in passenger transport in order to make them fit for the future. Within the Mobimeo project, we have forged ahead with the creation of a team of industry and digital experts. In the year under review, our focus was on product development, the expansion of the platform and the first minimum viable product (MVP) launches. Testing has begun on the first multimodality and live navigation (Companion) products. This included a test involving the public transport association Berliner Verkehrsbetriebe (BVG) in September 2018, in which volunteers using the app tested an initial range of Companion products for two weeks with the aim of validating the customer benefits, user experience and the technical functionality of product features. The implementation of live navigation in the BVG travel info app is planned for the second quarter of 2019. A public beta version was launched in Stuttgart in November 2018 and the market launch of new apps for the SBahn (metro) Berlin and Stuttgart is planned for the second quarter of 2019.
Smart cities Our aim is to build upon existing infrastructures to offer solutions for the intelligent and environmentally friendly networking of mobility and logistics, with the railway station forming the basis for our product portfolio. A Memorandum of Understanding with the City of Hamburg places the focus on Harburg and Dammtor stations. We are responding to the growing challenges in the world of work by integrating coworking spaces into railway stations. Railway stations offer an idea platform for creating a stationary link to new mobility solutions. In cooperation with ioki feeder stations in the service area, for example Hamburg Elbgaustraße station, will become on-demand service
no. 142 stops. In the year under review, a successful
GR
OU
P M
AN
AG
EM
EN
T R
EP
OR
T
71
GROUP MANAGEMENT REPORT — TARGETS AND STR ATEGy
FIN
AN
CIA
L S
TA
TE
ME
NT
SS
US
TA
INA
BIL
ITy

escooter pilot was conducted amongst DB employees in Frankfurt am Main to test the service as a supplementary mobility module. We are also working on setting up a data platform to identify locations for the services and to optimize operations in the long term.
TecEXOur aim with the Group program TecEX (Technical Excellence) is to make it possible to implement technology projects more quickly. TecEX functions as a competence platform for developments across multiple business units, from the scaling of joint solutions across business units to the use of bundling to get around resource bottlenecks. TecEX is pursuing three approaches with 13 projects for the further development of railway production and the implementation of the technology strategy:
◊ The development and implementation of ideas to achieve short and mediumterm improvements in returns and quality.
◊ Strategic projects and rollout preparation to improve quality and productivity in the medium to long term.
◊ Projects to head off risks to rail operations by the design and development of pilots. In the year under review, for example, the existing FASSI system was integrated into dynamic “green functions” of train control no. 118 in the DB Regional Networked Driving Assistance System project to generate recommendations for energysaving driving based upon the current operating situation. In the CBM Infrastructure (conditionbased maintenance) project, 3,400 switch heaters no. 91 were connected to the central DIANA diagnostics platform µ155.
Using expertise internationally
DB International OperationsDB International Operations GmbH (DB International Operations) acquires, starts up and is responsible for rail operations and maintenance projects outside Europe. In the year under review, the focus of market development was on the core markets of North America, Asia and the Near and Middle East.
◊ The California HighSpeed consulting project, in which DB International Operations will also set up operations as an Early Train Operator for the first phase, has got off to a successful start.
◊ In the Etihad Rail DB Operations joint operation, DB International Operations acquired a 49% stake from DB Cargo UK within the Group as of January 1, 2018. Etihad Rail DB Operations is responsible for the operation and maintenance of the national rail network in the United Arab Emirates. In the year under review, the contracts were extended, securing the collaboration for a further eight years.
Deutsche Bahn Group 2018 Integrated Report
72

¿
¿
Behind schedule On schedule Ahead of schedule
20 40 60 80 100 120 140 160 180
2018
Behind schedule On schedule Ahead of schedule
20 40 60 80 100 120 140 160 180
2018
Behind schedule On schedule Ahead of schedule
20 40 60 80 100 120 140 160 180
2018
Customer and quality
74 The customer is at the center of our actions75 OPEX program becomes Excellence System75 Customer satisfaction showing weaker development
76 Focus on punctuality77 Driving innovative solutions
O U R A R E A S O F A C T I O N
Punctuality
Improvements in both passenger and freight transport.
Infrastructure availability
Preventive maintenance and eliminating bottlenecks through targeted expansion.
Reliability
Securing travel chains and ensuring transport quality.
Modernization of the vehicle fleet
Improvement in vehicle availability and increase in passenger comfort.
Passenger information
Timely and comprehensive communication.
Customer orientation
Customer-oriented products and services.
O U R A S P I R AT I O N
As a profitable quality leader, we offer our customers first-class mobility and logistics solutions – that means excellent quality at affordable costs.
O U R TA R G E T S
2018 Progress. Are we progressing as planned? (Difference between control and 100 % shows delay/lead as a proportion of the actual deviation from target value)
Where do we stand in 2018 on the path to achieving our targets for 2020? (%)
Base 2012 –
2017 75.8
2018 75.1
DB2020+ target ~79
Customer satisfaction – passengers (SI)
Base 2012 –
2017 70.5
2018 65.5
DB2020+ target ≥73
Customer satisfaction – freight transport and logistics (SI)
Base 2012 94.4
2017 93.9
2018 93.4
DB2020+ target ≥ 95
Product quality – punctuality – DB Group rail in Germany (%)
GR
OU
P M
AN
AG
EM
EN
T R
EP
OR
T
73
GROUP MANAGEMENT REPORT — TARGETS AND STR ATEGY | CUSTOMER AND qUAliT Y
FiN
AN
CiA
l S
TA
TE
ME
NT
SS
US
TA
iNA
Bil
iTY

The customer is at the center of our actions We are working on issues that are material to us and our stake holders µ46. You can find an overview of our material
sus tainability themes µ43 in the chapter “To our stakeholders.”There are a number of levers that increase product
quality, but for us, improving punctuality is the most important starting point. Other important levers include the use of modern vehicles, reliable and comprehensive customer and transport information, the quality and reli-ability of services offered, as well as reasonable travel and transport times. That is why we continually invest in our fleet and infrastructure and optimize cooperation with our suppliers and sector partners. We place a strong emphasis on tapping into the opportunities of digitalization. The majority of our initiatives for increasing product quality and improving customer satisfaction are linked with our Agenda
for a Better Railway µ66 ff. and the Operational Excellence
(OPEX) program µ75. We place customers at the center of our actions. Cus-
tomer satisfaction µ75 is therefore the most crucial indi-cator of our service quality. It provides us with the insights we need to determine concrete measures for improvement. In addition to the various aspects of product quality, the continuous optimization of the price-performance ratio and product innovations µ77 ff., especially in the context of dig-italization, are the main levers for increasing customer sat-isfaction. We work extremely hard to provide a high-quality basic service and focus on optimizing product and service quality. We offer our customers comprehensive services for their information needs. Our goal is to provide our mobility and logistics solutions at a reasonable price-performance ratio in order to meet the expectations of our customers. The focus is on measures that increase the quality of our ser vices and the efficiency of our processes. In order to as -sess the success of our measures from the customer’s per-spective, we use direct indicators such as revenue and the number of customers. In addition to this we use the results of regular surveys to measure our success and find poten-tial areas for improvement.
Some particularly important indicators of customer satis-faction include passenger satisfaction levels for passen ger transport and infrastructure (stations) and the satisfaction levels of freight transport and logistics customers. We mea-sure success based on the targets achieved along the devel-opment path defined in our strategy DB2020+ µ67.
Punctuality µ76 f. is a central component of our perfor-mance promise. Internal punctuality controls are based on lost units (number of delayed trains). To measure punctu-ality, we compare the target arrival time to the actual time for every train run. A stop is considered on time if the sched- uled arrival time is exceeded by less than six minutes in passenger transport or less than 16 minutes in freight trans-port. We summarize the arrival of trains on schedule or up to a defined maximum delay using a degree of punctuality. The figures are recorded daily and made available online to the executives and employees involved in punctuality man-agement. In addition, punctuality data, together with the associated indicators, are prepared regularly and used by the Group Management Board to determine what currently needs to be acted upon and where decisions are required. Punctuality is the key indicator of product quality and is a determining factor in calculating the variable remuneration amount for executives of the integrated rail system µ50.
The performance capability and capacity of the infra-structure also has a significant influence on quality and punctuality. Capital expenditures for maintaining a high- performance infrastructure form the subject matter of the luFV ii µ234 f. Alongside maintain ing the existing infra -structure, optimizing available capac ity during construc-tion work, in creas ing capacity and the digitalization of infrastructure are also very important for the performance capability of the infrastructure and thus for infrastructure users. Together with the Federal Government, we are working on a range of comprehensive measures.
Interlinked mobility is the combination of different modes of transport in order to individualize the design of the mobility and transport chain; this is made possible by the digital information service for travel and transport plan-ning. For us, interlinked mobility is crucial in order to offer our customers individualized and tailored solutions. Digi-talization offers new opportunities to provide innovative services. Existing combined services, such as our door-to-door mobility portfolio for passenger transport (Flinkster
no. 7 and Call a Bike no. 14) are being steadily developed to future mobility platforms, such as autonomous driv- ing, on-demand transport services and platforms for cus-tomers to use these services in future. We are developing new approaches, including as part of our New Mobility µ69 ecosystem. Within logistics, we are driving forward new forms of mobility, including through our truck platooning
project µ80.
102-43103
GRI
!!!!!!
Deutsche Bahn Group 2018 Integrated Report
74

OPEX program becomes Excellence SystemThe start of 2017 saw the launch of the OPEX program with the overarching themes maintenance, jointly coordinated construction and skills development. OPEX supports the goal of sustainably changing the performance culture at DB Group. Through OPEX, we are advancing the transforma-tion that has already begun – for quality that persuades and performance that delights our customers.
In the OPEX maintenance sub-program, the transforma-tion at about 72 locations has begun in four phases. It involves initiating and implementing sustainable process improvements using a standardized procedure. In order to achieve this employees will be trained in OPEX/lean skills and in how to apply and further develop this new working method. Additional areas of focus include implementing a consistent performance dialogue and continual improve-ment aiming to reduce wastefulness. As part of OPEX, a portfolio of key figures was developed to cover all business units and is communicated on a daily basis in the Digital Situation Room.
Aligned with DB Group’s focus on operational excel-lence, in the sub-program skills development the OPEX portfolio was developed. The OPEX portfolio offers the framework for developing the relevant OPEX capability and skills across business units. The qualifications offered enable employees and executives to successfully carry out the transformation, acquire the skills they need and poten-tially expand existing knowledge. In this way, the portfolio provides the basis for working differently. Since April 2018, the OPEX Portfolio 2.0 has been available to all executives and employees in DB Lernwelt (DB online platform for learn- ing). It means that employees can benefit from the appro-priate learning offers at any time, wherever they are. The OPEX Fitness Check was also developed as part of the skills development sub-program. It is part of DB Lernwelt and supports users by way of an anonymous survey that helps them choose the appropriate content from the qualifica-tions offered.
In 2019, an additional 25 maintenance locations will begin the OPEX transformation as part of phases five and six. The locations involved in phases one to four will con-tinue to be appraised by way of regular maturity assess-ments to determine the progress of the program and will also receive ongoing implementation support.
We wanted to harness the experiences and successes of OPEX for other topics, so we further developed the OPEX approach: from early May until December 2018, an OPEX
team with members from throughout the Group worked on the DB Excellence System, a production system for DB Group. The DB Excellence System is based on experience and best practices from all business units, the market and the OPEX phases to date. The DB Excellence System continued the proven approaches and supplemented them by further standardized principles. Among other things, the digitali-zation module was added. Our mission is to provide flaw-less, cost-effective vehicles, infrastructures and services through outstanding processes.
The DB Excellence System consists of a holistic, stan-dardized approach to optimizing and transforming pro-cesses and/or organizations. It also incorporates principles and standards on pursuing excellence as a goal, on using excellence as a basis for assessment and on employing the methods for excellence to pave our way.
Customer satisfaction showing weaker development
Customer satisfaction (SI) 2018 2017 2016
Passengers 75.1 75.8 76.0
DB Long-Distance 77 77 77
DB Regional (rail) 66 68 69
DB Regional (bus) 74 74 75
DB Arriva (bus and rail, Great Britain) 79 80 81
DB Netze Stations (passengers/visitors) 68 69 69
DB Sales 82 82 81
DB Connect (car-sharing) 79 78 76
DB Connect (Call a Bike) 79 79 77
Freight transport and logistics 1) 65.5 70.5 –
DB Cargo 1) 60 67 –
DB Schenker 1) 71 74 –
1) Survey annually since 2017.
Regular measurement of customer satisfaction is very im -portant to us. The data is gathered in each case by indepen-dent market research institutes. It is based on nearly 160,000 interviews with end customers and business customers.
In the year under review, overall customer satisfaction declined. While the development for passengers remained relatively stable, at DB Cargo µ137 and DB Schenker µ144 it declined noticeably. DB long-Distance µ118, DB Regional
Bus µ123 and DB Sales maintained the same level, while at DB Regional Rail µ123, in particular at the S-Bahn (metro) systems and DB Netze Stations µ160, it deteriorated.
The development of customer satisfaction is therefore below our forecasts as seen in the 2017 integrated Report
µ162.
102-43
GRI
GR
OU
P M
AN
AG
EM
EN
T R
EP
OR
T
75
GROUP MANAGEMENT REPORT — CUSTOMER AND qUAliT Y
FiN
AN
CiA
l S
TA
TE
ME
NT
SS
US
TA
iNA
Bil
iTY

Focus on punctuality
Mostly weak development
Punctuality (%) 2018 2017 2016
DB Group (rail) in Germany 93.4 93.9 94.3
DB rail passenger transport in Germany 93.5 94.1 94.4
DB Long-Distance 74.9 78.5 78.9
DB Regional 94.0 94.4 94.8
DB Cargo (Germany) 72.9 73.4 76.2
DB Arriva (rail: Great Britain, Denmark, Sweden, the Netherlands and Poland) 89.8 92.3 91.0
DB Regional (bus) 91.0 90.5 90.6
DB Cargo (Europe) 72.8 72.7 75.6
The punctuality of our rail products in Germany showed an unsatisfactory development in the year under review. Both passenger and freight transport saw punctuality fall signifi-cantly below the values of the previous year.
Punctuality suffered from a higher utilization of the infra-structure. Further growth in rail transport combined with the expansion of the construction program and the associ-ated reduction in network capacity had negative impacts on the development of punctuality. In contrast, it was possible to further reduce construction-related delays (delays that can be clearly linked to a construction site). The in creas ing traffic volume caused bottlenecks in both the infrastructure and with regard to staff and vehicle availability.
On the operational side, a large number of incidents in command and control technology and an increase in vehicle faults and incidents related to the provision of vehicles had a negative impact on punctuality.
In addition, in the year under review the number of external disruptions increased again slightly compared to the already very high levels of the previous year. One of the causes was the long heat wave during the summer. The excessively dry conditions, combined with high tempera-tures, resulted in two major embankment fires, one in Kassel in July 2018 and the other in Siegburg in August 2018. There was an additional strain due to weather-related restrictions, including due to the severe winter weather in February and March 2018 and the Friederike, Burglind and Fabienne storms, which caused major road undercutting and extensive line closures due to fallen trees.
Other external factors that negatively influenced punc-tuality development in the year under review included a fire on an ICE train on the high-speed Cologne — Rhine/Main line in October 2018, which caused line closures lasting several weeks and required comprehensive diversions and the Railway and Transport Workers Union (Eisenbahn- und Verkehrsgewerkschaft; EVG) strike in December 2018.
The development of punctuality is therefore on weak level within the range of our adapted forecast from the integrated
interim Report for January – June 2018 µ51.
Comprehensive improvement measures are underwayIn order to achieve a trend reversal in punctuality develop-ment, three lines of action were pursued in the year under review:
◊ Consistently continue measures from Railway of the Future.
◊ Set up a punctuality management center to create short-term stability.
◊ Implement the Group project on capacity manage- ment to develop countermeasures for the negative punc tuality effects of increasing levels of traffic and construction.
Development in the year under review led to a comprehen-sive review of punctuality and measures. This review demonstrated that the planned improvements were being realized more slowly than anticipated, in particular due to the additional capacity required. Consequently, the plan
values for 2019 µ178 and the subsequent years were with-drawn and the decision was made to intensify the measures of the Agenda for a Better Railway µ66 ff.
Expanding and further developing PlanStartIn the year under review, the PlanStart team at DB Long- Distance focused on transferring the improvements reached in on-schedule departures at the hub stations to the jour- ney on the line and on increasing adherence to stop times during mid-journey stops.
At DB Cargo, PlanStart teams were deployed at seven further train formation yards in the year under review to increase departure punctuality.
In addition, the year under review saw a plan corri dor set up on the Cologne — Dortmund line as a pilot project whereby interdisciplinary teams work even more inten-sively to control punctuality. The model follows the suc-cessful PlanStart approach. By intensifying joint train control (between DB Netze Track and TOCs) as well as mea-sures to support the mission to achieve zero errors in the corridor (such as through preventive replacement of large switch parts and mobile maintenance at turning points), we hope to see significant increases in punctuality in the cor-ridor. The pilot corridor proved very successful in the year under review and further corridors will therefore be intro-duced in 2019.
!!! !!!
Deutsche Bahn Group 2018 Integrated Report
76
Punctuality Management CenterIn response to the decrease in punctuality, we created the Punctuality Management Center in March 2018, which is managed by the Infrastructure Board division and develops and realizes measures for the short- and long-term improve-ment of punctuality on an operating level across all busi-ness units. The measures of the Punctuality Management Center, which also incorporates non-Group TOCs, include activities to optimize schedules in order to stabilize punc-tuality, improve adherence to stop times, increase the avail-ability of command and control technology and stabilize S-Bahn (metro) traffic.
Punctuality Competence Center at DB RegionalThe Punctuality Competence Center at DB Regional has in ten sified its work with regional punctuality managers and with the Punctuality Management Center, which works across business units. For example, DB Regional is deploy- ing train boarding guides at the central stations in Munich and Frankfurt am Main. After the positive impact these em ployees had working in the S-Bahn (metro), further board ing guides will be deployed for regional transport in Frankfurt am Main.
quality program for S-Bahn (metro) trafficWith a view to increasing punctuality and availability, com-prehensive measures were taken for all S-Bahn (metro) sys-tems. These include extending and renovating the infra-structure, as well as improving information provided by passenger controllers or by new display technology and renovating the appearance of stations.
As a result, the program improved the punctuality of the Berlin and Rhine-Main S-Bahn (metro) systems com-pared to the previous year.
implementing the action plan for vegetation The year under review began with the implementation of the vegetation action plan, which sought to reduce the negative impacts of increasingly extreme weather on rail operations.
In addition to continuing proven measures such as pre-ventatively cutting back trees and bushes alongside tracks, the plan also includes thinning out vegetation. This can significantly stabilize the tree population along the tracks even beyond the trimming zone of six meters. As part of the reforestation measure, trees that have a stable height and suitable growth patterns will be planted, as will bushes and copses.
Up to 150 inspectors will join the existing workforce of over 1,000 forestry workers in order to inspect the vegetation. About € 125 million was earmarked for vegetation manage-ment in the year under review. The experience gained in the year under review resulted in further development of the concept. In the next five years, we are planning to spend about € 660 million on the care and management of the plant population.
Project capacity managementThe Group capacity management project was launched in order to provide a more realistic evaluation of the medi-um-term effects of increasing traffic volumes and the high levels of construction on punctuality and to develop countermeasures accordingly. The initial result in the year under review was the development of a new method to extrapolate punctuality targets based on the consideration of all capacity effects. This method was already used to set targets for 2019. Capacity measures encompassing all busi-ness units were derived from the knowledge gained as a result. However, many of these measures will only take effect from 2020. This is because, among other reasons, construction-based infrastructure measures take time.
In 2019, the results obtained from the year under review will be extended to include TOCs in the form of an improved punctuality simulation.
Driving innovative solutions
Digitalization and innovation as focal areas of action We intend to harness the potential of digitalization and play a decisive role in shaping tomorrow’s mobility and logistics. Digital technologies not only make it possible to further develop our existing business, but also pave the way for new business models. Our goal is to provide our customers with the best possible, digitally supported expe-riences and processes. Digitalization and innovation are therefore among our focal areas of action, which we are driv- ing forward across all business units. In doing so, we are aligning with the digitalization strategy, which defines our strategic direction and frames our activities in the three key areas of core business digitalization, new digital business and digital transformation. The Digitalization Competence Center is responsible for operationalizing the digitalization strategy. This committee regularly brings together digita-lization decision makers from different business units and Group functions to propel digitalization within DB Group (ŒDB Digital).
!!!
103
GRI
GR
OU
P M
AN
AG
EM
EN
T R
EP
OR
T
77
GROUP MANAGEMENT REPORT — CUSTOMER AND qUAliT Y
FiN
AN
CiA
l S
TA
TE
ME
NT
SS
US
TA
iNA
Bil
iTY

In the year under review, we implemented digital initiatives, achieved adapt-able structures and sup-ported the digital transfor-mation.
◊ Digitalization of core business: A decisive cus- tomer benefit could be achieved, for example, through comfort check- in µ117. With MyRailPor-
tal µ137 by DB Cargo, the customer interface was digitalized further. We are working with partners in the railway sector to automate and digitalize our infrastruc-ture and production as part of the Digital Rail for Ger-
many µ71 program. ◊ New digital business: It is very important to us to build
up new digital business models in our target markets. Particularly noteworthy examples include Mobimeo µ71
and ioki µ79. In the year under review, DB Group was also involved with verimi µ79. DB Schenker, together with MAN, piloted the platooning µ80 project and in the process achieved important milestones in autonomous driving.
◊ Digital transformation: For us, this term means achiev- ing the necessary conditions in DB Group. The central focus areas are building a data-driven innovation eco-system and most importantly bringing in executives and employees and giving them the skills they need. Our Digital Basecamp event series reached about 1,200 executives, conveying digital expertise and promoting networking in DB Group. The launch of DB lernwelt µ85 in April 2018 has provided Group-wide online and offline learning content. The DataOps program is establishing binding principles that will optimize data preparation, generation and use in DB Group on a technical and op -er ational level.
We have further professionalized our cooperation with start-ups.
◊ In particular, we have achieved this through Œbe-
yond 1435, our open innovation platform launched in the previous year to promote mobility innovations. We are working with our partners Siemens, Swiss Federal Rail-ways (Schweizerische Bundesbahnen; SBB) and Bombar-
dier with the aim of identifying new technol ogies and evaluating them for our own business devel opment. We intend to develop and scale disruptive business models together with the start-ups and with the help of the in -novation platform.
◊ ŒDB mindbox is a co -working space and a cen tral location where DB employees can ex -change knowledge and cooperate with start- ups. The central fund ing program, ŒDB Start up -
Xpress, identifies prom- ising start-ups and tests their ideas to gether with DB Group’s business units. The start- ups should be able to imple-ment their digital solu-tions quickly in co op er-ation with the busi ness units. Since 2015, well over 1,000 start- ups from around 30 coun-tries have ap plied for the DB mind box pro gram. With more than 30 start-ups, we are now working on concrete improvements to the integrated rail system.
◊ At DB Digital Ventures µ70 we have been able to realize five further investments.
◊ We are responding to developments within digitaliza-tion and new technologies, as well as to the changing markets, with the ecosystem approach µ69 f. we defined in late 2018. We will be founding a central ecosystem holding company to enable effective ecosystem man-agement in DB Group alongside DB Digital Ventures.
!!!
D I G I TA L B A S E
At the end of 2018, DB Group gained
a new location for its digital business
in Berlin with DB Digital Base. The
site has 360 available workspaces
on nine floors. Digital Base is an
event venue, network and platform
for exchange. It aims to create
syn er gies between different digital
projects and to promote a lively
ex change of knowledge. With this in
mind, the space is open plan so
that all internal and external part-
ners can work together to imple ment
digital transformation projects and
experience new working methods.
B E S T I N N O VAT I O N L A B S
For the second time, business maga-
zine Capital presented a number of
its awards for 2018 to German digital
laboratories in three categories. In
fact, DB Group was represented sev-
eral times: Skydeck, amspire and d.lab
are in the top 24 in the Best Inno-
vation Labs category, DB mindbox
achieved third place in the Best
Accelerators category and the Intra -
preneurship program made it on
to the leaderboard in the Best Com-
pany Builder category.
Deutsche Bahn Group 2018 Integrated Report
78

New product and service conceptsNew partnership for standardized log-in solutionDB Group is a new shareholder of Œverimi. The cross-in-dustry identity and data platform combines a convenient, central log-in (single sign-on), top security and privacy standards under European law and the ability for users to determine how their own personal data is used. DB Group is currently establishing the IT requirements for a stan-dardized log-in to DB services. The solution is scheduled for integration in 2019.
New digital services in local transportDB Regional is working with numerous contracting organi-zations to progressively install WiFi technology on board trains. In addition, an information portal has been devel-oped that offers news, entertainment, current trip informa-tion and tourist information. In addition to numerous pilot projects, such as in S-Bahn (metro) Munich, we have already equipped a few local transport networks with WiFi; these are, among others, Elbe-Saale-Bahn, Expresskreuz Bremen, Main-Neckar-Ried-Express, RE-Netz Süd west (SÜWEX), S-Bahn (metro) systems in Rhine-Main, Stuttgart and cen-tral Germany, and various networks in Schleswig-Holstein and Baden-Württemberg. We are in negotiations with addi-tional public transport authorities. Currently, Hamburg’s S-Bahn (metro) stations are equipped with WiFi.
Further development of the idea Train DB Regional has developed a new and unique travel ex -perience in regional transport with the Idea Train, which combines new product and service concepts for regional transport with visionary technological applications. In order to become the industry’s innovation leader, DB Regional wants to help shape the development of vehicle interiors itself.
During the year under review new components were installed or redesigned. Unique themed worlds are set to become a reality. The Free State of Bavaria and DB Group signed a corresponding declaration at Innotrans 2018 in Berlin. With the redesign of a double-deck car for Südost-bayernbahn, we will create nine themed worlds by 2020.
DB Group has decided to work with Siemens Mobility on the Idea Train. The train will be opened as a development environment for partners from the vehicle industry to test components and prototypes. Siemens Mobility is the first system manufacturer to join the cooperative effort. The aim is to persuade more regional transport contracting organizations and public transport authorities to think about innovative, customer-oriented ideas when submit-ting future tenders.
ioki expands its offersWith Œioki, we are bringing on-demand mobility and autonomous driving into public transport. We have ex -panded our offer:
◊ ioki is working with public transport provider BVG on autonomous driving projects. As part of a pilot project, a self-driving minibus no. 41 made journeys around the EUREF Campus in Berlin between April and December 2018. The test opera-tion tested autonomous driving linked with an on-demand service for the first time using a new developed app. The plan for 2019 is to ex -tend the test op eration to public roads.
◊ The first driver-based on-demand service fol-lowed in May 2018 as part of the local pub-lic transport with integra-tion into the existing fares in the town of Wittlich in Rhineland- Palatinate. The Wittlich Shuttle supplements existing transport infra-structures and brings customers to their des-tination on flexible and varying routes de pend- ing on the travel desti-nation. The service can be conveniently booked using an app. Holders of season tickets or sin gle tickets pay a convenience surcharge of € 1.90 for the new ser-vice.
◊ As part of DB Group’s Smart City Partnership with the City of Hamburg, ioki has been operating the driv-er-based on-demand shuttle service ioki Hamburg
no. 142 since July 2018, which is connected to Hamburg’s public passenger transport services.
◊ In the first year, 20,000 passengers had already traveled with the autonomous minibus no. 41 in Bad Birnbach.
I O K I H A M B U R G – A N
O N - D E M A N D S H U T T L E
S E R V I C E
In the Hamburg districts of Lurup
and Osdorf, transport company Ham -
burg-Holstein GmbH (VHH) oper-
ates in cooperation with ioki an on-
demand bus service – ioki Hamburg.
Since July 2018, electrically powered
vehicles made by British manufac-
turer LEVC have been providing
on-demand journeys. The service
can be booked around the clock
using the ioki Hamburg app. The ioki
Hamburg Shuttle is licensed as a
scheduled bus service. The vehicles
each have six seats and boast easy
wheelchair and baby stroller access.
Further ioki stops have been set
up at distances of no more than 200
m apart to optimize area coverage.
GR
OU
P M
AN
AG
EM
EN
T R
EP
OR
T
79
GROUP MANAGEMENT REPORT — CUSTOMER AND qUAliT Y
FiN
AN
CiA
l S
TA
TE
ME
NT
SS
US
TA
iNA
Bil
iTY

Cooperation work to develop self-driving trucksDB Schenker, in cooperation with MAN and Fresenius University, is carrying out a platooning project which is funded by the BMVI. In the year under review, preparatory activities were also carried out for piloting autonomous truck runs on terminal premises. MAN provided DB Schenker with the test vehicles for the truck platooning pro j- ect in February 2018. Reg-ular test runs of the net-worked trucks began in June 2018 on the 145-km section of road between Munich and Nuremberg. The trucks were tested without loads until early August 2018. Since Sep-tember 2018, the platoons have been on the move, carrying out up to three runs per day, doing every- day logistics work, carrying general cargo such as ma -chine parts, beverages and paper.
T-Pod becomes the first autonomous electric truckIn November 2018, DB Schenker and Einride launched the first commercially used, fully electric, autonomous truck on DB Schenker property in Jönköping, Sweden – the T-Pod. The T-Pod by Einride has dispensed with the driver’s cab. Instead, it is monitored remotely and can be controlled even from distances of several hundred kilometers away. Since it has no driver’s cab, there was the scope for a much more efficient design. At the same time it offers higher load capacity, greater flexibility, lower production and operating costs, as well as optimized energy consumption. The T-Pod operates entirely on batteries.
Tests are underway on an automated vehicle used for swap body transportsDB Schenker is the first logistics provider worldwide to test the use of an automated “Wiesel” (weasel) at its Nurem-berg branch office. This vehicle, produced by KAMAG, is designed for transporting swap bodies on logistics yards and can move these autonomously. Swap bodies are con-tainers mounted on trucks that can be set down on fold-out legs for loading and unloading.
Utilizing blockchain technologyBlockchain is considered to be one of the most disruptive technologies ever. DB Group is testing various applica-tions – from logistics supply chains and the clearing of internal services via smart contracts, as well as the distri-bution of proceeds in regional transport, to digital iden-tity – that of trains but also of passengers. The DB Systel blockchain team pushes the blockchain and distributed ledger technology implementation forward.
Digitalization in rail operationsRail system should be digitalized According to the results of a study commissioned by the BMVI, Germany’s rail network should be digitalized. This could achieve a capacity gain of up to 20% in passenger and freight transport. This would also lay the foundations for coping with Germany’s growing traffic volumes. With the Digital Rail for Germany µ71 program, the entire rail industry seeks to advance the wide-scale introduction of new com-mand and control technology and digital interlockings throughout the approximately 33,000 km rail network.
The feasibility study for digitalizing the railway as pre-sented in September 2018 came to the conclusion that it makes sense to equip the German rail network with the latest generation of European command and control tech-nology ETCS no. 145, while at the same time introducing digital interlocking technology, and that this work should begin shortly.
Its effects will create positive benefits for the wider economy:
◊ Increasing reliability: New technology and systems for quality and punctuality.
◊ Increasing capacity on the rails: Accommodating growth in transport and the potential to shift traffic off the roads.
◊ Increasing energy efficiency and reducing greenhouse gas emissions: Energy-saving control and shifting to the rails.
◊ Reduced maintenance and operating costs. ◊ Ensuring strength in the face of demographic change:
Dealing with reduced operating staff numbers due to ageing and staff turnover.
◊ Borderless rail transport: European system interoper-ability.
The Federal Government will now review and evaluate the proposals. Digitalization will play a crucial role in the future viability of the railway.
P L AT O O N I N G
Platooning is a road traffic vehicle
sys tem whereby at least two trucks
drive one behind the other on
the highway in close proximity using
technical driving assistance and
control systems. All the vehi cles driv-
ing in the platoon are connected to
each other by an electronic drawbar
via car-to-car communication. The
lead vehicle determines the speed
and direction. In the process, the
electronic coupling of the vehicles
in the platoon ensures road safety. A
cru cial goal of platooning is to save
fuel for the entire platoon by driv ing
in the slipstream of the lead vehicle.
Deutsche Bahn Group 2018 Integrated Report
80

Digitalized operation of the Hamburg S-Bahn (metro)In 2021, a highly automated S-Bahn (metro) service will be launched in Hamburg for the first time. In this connec-tion, a cooperation agreement on the Hamburg digital S-Bahn (metro) has been signed by First Mayor of Hamburg Dr. Peter Tschentscher, Siemens Management Board mem-ber Dr. Roland Busch and DB Infrastructure Management Board member Ronald Pofalla. Hamburg is therefore a pioneer of digitalized operation in a German rail network. The agreement includes plans to prepare the 23-km section on S-Bahn (metro) line 21 between the Berliner Tor and Bergedorf/Aumühle stations for highly automated driving while in parallel equipping four vehicles with the necessary technology. The three partners have agreed to share the costs of about € 60 million. In October 2021, when Hamburg hosts the ITS (Intelligent Transport System) World Con-gress, digitally controlled vehicles will be in operation.
First digital interlocking begins operationEurope’s first digital interlocking commenced operation in January in Annaberg-Buchholz on the Ore Mountain Rail- way (Erzgebirgsbahn). This pre-series project heralds a revolution in command and control technology that forms part of the Digital Rail for Germany µ71 project. The digital interlocking marks the start of the further development and nationwide implementation of a new and innovative generation of interlockings. The technology can be used to operate both main lines with tight schedules and major hub stations and for simpler applications in rural areas. Plans for further reference projects were driven forward during the year under review. Construction work also began on the second digital interlocking in Warnemünde, which is set to become operational in September 2019.
App-based train-path booking system in development From 2019, TOCs will be able to book train paths at the click of a mouse, just like in an online shop. The Click&Ride app is what makes it possible. Simply enter your desired time, line and train, check the offers, make your choice and book. Thanks to automatic scheduling, it only takes a maximum of three minutes from request to offer, instead of several hours as before. This means lower costs for all involved and better utilization of rail network capacity. In 2019, a limited version of Click&Ride is set to be introduced for rail freight transport for the first time.
In the process, Click&Ride will become the first produc-tive element of the neXt Digital Capacity Increase (neXt Digitale Kapazitätssteigerung) program, supported by the Federal Government with total funding of € 75 million.
Wayside status checkWayside monitoring means rolling stock can be put through its paces almost while it is passing by. An example of how it works could include microphones on the track recording the sounds of passing trains and comparing them with a previous “acoustic fingerprint” recording. If the result devi-ates from the normal value, we will take active mainte-nance measures. And that’s long before any damage even appears on the train or rail. The advantages are fewer delays for passengers and optimized predictive maintenance.
Wayside monitoring is already in use at multiple loca-tions such as in Hesse and North Rhine-Westphalia. The system can be used by any TOC. In the year under re view, further pilot projects were launched, such as a video gate at Nuremberg and a monitoring system for current collectors.
Digitalization in station managementGlowing fiber-optic cables point the wayFinding your way around stations is becoming easier with glowing fiber-optic cables in the flooring; we have been testing this together with the start-up SIUT at Stuttgart-Bad Cannstatt station since February 2018. During a pilot run we tested the first dynamic guidance system using glowing fiber-optic cables. Thanks to the illuminated symbols in the station platform concrete, S-Bahn (metro) customers will also be able to see where the train stops, how long it is, and, for the pilot trains, how full it is and the positions of the doors, even before the train arrives at the station. We plan to improve passenger information and punctuality using this optimized train dispatch service.
Testing cleaning robotsNew developments, such as in the area of robotics, help us to improve our service even more. DB mindbox asked pro-viders to present specific station cleaning solutions during a challenge at Berlin’s central station. The most compelling model was the cleaning robot CR700 from Adlatus Robotics. From May 2018, CR700 has been supporting our cleaning teams at various stations in Germany for a period of two years.
!!!
GR
OU
P M
AN
AG
EM
EN
T R
EP
OR
T
81
GROUP MANAGEMENT REPORT — CUSTOMER AND qUAliT Y
FiN
AN
CiA
l S
TA
TE
ME
NT
SS
US
TA
iNA
Bil
iTY

†
†
Behind schedule On schedule Ahead of schedule
20 40 60 80 100 120 140 160 180
2018
Behind schedule On schedule Ahead of schedule
20 40 60 80 100 120 140 160 180
2018
Social
82 Working to become a top employer 83 Talent acquisition that works84 Personnel development is changing
85 Further improvements in employment conditions85 DB Group is transforming87 Increase in the number of employees
O U R TA R G E T S
2018 Progress. Are we progressing as planned? (Difference between control and 100 % shows delay/lead as a proportion of the actual deviation from target value)
Where do we stand in 2018 on the path to achieving our targets for 2020? (%)
Base 2012 3.6
2017 –
2018 3.7
DB2020+ target 4.0
Employee satisfaction (SI)
Base 2012 26
2017 13
2018 13
DB2020+ target ≤ 10
Employer attractiveness (rank in Germany)
O U R A S P I R AT I O N
As a top employer † we attract and retain qualified employees who are enthusiastic about working for us and our customers.
O U R A R E A S O F A C T I O N
Talent acquisition
We will hire about 20,000 employees per year and increase the operational excellence of our recruiting process over the coming years.
Change management
Professional change management provides a solid foundation for transformation of DB Group.
Development of staff and executives
We are aligning the entire product and process landscape of personnel and management development with the Group strategy and customer benefits.
Working conditions
We are creating modern, forward-looking employment conditions – for DB Group and for our staff.
Working to become a top employer
We are working on the issues that are material to us and our stakeholders µ46. You can find an overview of our mate-
rial sustainability themes µ43 in the chapter “To our stake-holders.”
We are working hard to increase our attractiveness as an employer. A visible and persuasive presence in the labor market is decisive for success in the competition for spe-cialists and executives. All important aspects of recruit-ment are centrally managed within DB Group to guarantee a holistic approach to talent acquisition that forms the basis for a strong competitive position in an increasingly difficult applicant market.
103
GRI
!!!
Deutsche Bahn Group 2018 Integrated Report
82

This approach includes: our employer branding campaign, effective employer branding, up-to-date professional re -cruiting, innovative social media activities and a candidate experience oriented toward the target group. To remain attractive as an employer, we offer our em ployees a wide range of tasks and activities with a high level of re sponsi-bility, attractive employment conditions and a cor porate culture that is perceived as being based on partnership and fit for the future. Our indicator for employer attractiveness is calculated on the basis of the employer rankings pub-lished by trendence.
Committed and motivated employees mean satisfied customers and thus sustainable business success. We there-fore are consistently working to increase the performance capability of DB Group based upon a high level of process orientation and implementation strength. Alongside cus-tomer focus and performance capability, our corporate cul-ture also encourages interdepartmental collaboration and the willingness to accept responsibility. In autumn 2018 we conducted the fourth Group-wide employee survey, which provided a comprehensive picture of employee satisfaction and helped us develop specific measures for change and improvement. Our indicator for employee satisfaction µ87
is calculated on the basis of the employee survey, which is carried out every two years. In the years in which no survey is conducted, the key indicator Follow-up workshop imple-mentation rate is used. The survey itself and the follow-up process are the responsibility of a central project team, which works closely with the business units to develop the measures and takes charge of preparation, follow-up and implementation. The project team has close links to both the Association for Consumer Research (Gesellschaft für Konsumforschung; GfK), which collects the data, and to those responsible for operational implementation in the business units.
The only way to meet the ambitious targets in our three key fields of activity – culture of quality, digital expertise and performance capability – is by far-reaching change, the transformation of our thinking and cooperation between all those involved. We will only achieve this essential transfor-mation by working together to systematically align our actions with the “seven imperatives”: customer focus, pro-cess orientation, responsibility, performance culture, coop-eration, implementation discipline and priorities. These provide orientation for employees and executives in the face of im -pending changes.
Levers have been identified to increase the structural and organizational performance capability within DB Group. The trans formation is focused around customer-oriented process excellence, with the underlying standards, methods and sequences being consistently defined by the new DB
excellence system µ75. In addition, the prerequisites for pro-cess excellence are put in place by highly developed perfor-mance management, professional change management and competence building for executives and employees alike.
Talent acquisition that works
Employer attractiveness remains high
Employer attractiveness(rank in Germany) 2018 2017
Change
2016absolute %
DB Group 13 13 – – 16
High school students 15 15 – – 26
Students/graduates 17 20 + 3 – 24
Skilled workers 12 13 +1 – 12
Academically experienced professionals 16 10 – 6 – 9
In the year under review, we were able to maintain our appeal as an employer at a high level, meaning that DB Group is still well on the way towards becoming a top em -ployer. This is in line with our forecast from the 2017 Integrated Report µ163.
In April 2017, we launched our new employer branding campaign. With our new campaign slogan “Welcome, you are one of us.” we issue an invitation to all potential appli-cants, who, similar to us, work on themselves and their goals and want to improve DB Group.
When recruiting new employees, we are increasingly addressing new target groups and using innovative formats, such as open candidate castings at passenger stations.
In May 2018, we moved our application management system to completely new software. Submitting an appli-cation is now much quicker, easier and more transparent, and candidates can also apply by smartphone and track the progress of their application online at any time.
In autumn 2018 we scrapped the covering letter, starting with trainees. The application letter is one of the greatest hurdles for applicants and provides little meaningful infor-mation: a résumé and personal interview are much more helpful when determining applicants’ skills and motivation. This step is based on the findings of the successful DB application marathon in November 2017, where the informal application process was particularly well received.
!!!
GR
OU
P M
AN
AG
EM
EN
T R
EP
OR
T
83
GROUP MANAGEMENT REPORT — SOcIAl
FIN
AN
cIA
l S
TA
TE
ME
NT
SS
US
TA
INA
BIl
ITY

In the year under review, DB Group once again received multiple awards for its talent acquisition strategy. For example, its innovative Sourcing Automation was selected for the HR Excellence Award and declared “Innovation of the Year” by the Federal Association for Employer Branding (Bundesverband für Employer Branding, Personalmarketing und Recruiting; QUEB). Sourcing Automation analyzes data from all tenders in real time to optimize marketing mea-sures, thus al low ing the budget to be used more efficiently and effectively.
New hires at record levelsIn the year under review, recruitment in Germany at DB Group reached its highest level ever (20,815 employees without young professionals). There are several reasons behind our employment campaign: firstly, DB Group is growing, with roles involving new IT skills expanding par-ticularly quickly. Secondly, about half of the workforce in Germany is set to retire over the next ten years, meaning that their jobs will have to be filled.
External new hires (excluding young professionals) as of Dec 31, 2018 (NP)
In total, DB Group hired almost 25,000 new employees in Germany in the year under review, including more than 4,000 young professionals (trainees and dual degree students). Demand is particularly high for occupational groups such as train drivers, traffic controllers, electronics technicians, engineers, command and control technology technicians, service personnel, track construction engi-neers and IT experts.
Demographic preparedness as of Dec 31 (%) 2018 2017 2016
Percentage of staffing needs covered in Germany 96.1 97.1 97.3
Germany (companies with about 79% of domestic employees).
The percentage of staffing needs covered has fallen slightly.
Personnel development is changing
Securing new talent
Young professionals as of Dec 31 (NP) 2018 2017 2016
Vocational trainees 1) 9,923 9,540 9,530
Dual degree students 1) 949 900 941
Graduate trainees 2) 157 109 114
Interns 2) 534 537 503
“Chance plus” participants 250 250 250
DB Group 11,813 11,336 11,338
1) Germany; includes all class years of vocational training (usually three class years for both vocational trainees and dual degree students).
2) Germany (companies with about 98% of domestic employees).
DB Group is one of Germany’s largest training providers and over 94% of trainees receive a job offer at the end of their vocational training. In the year under review, we once again supported the BDA Employer Award for Education (Arbeit-geberpreis für Bildung). This annual award, the focus of which changes every year, acknowledges educational insti-tutions that help to improve the German education system by their successful educational work and serve as role models for other institutions. In the year under review, the scheme recognized projects in which cooperation between traditional educational institutions and partners – from parent initiatives to other educational institutions and from committed private individuals to companies – led to inno-vation and educational success.
About 3,800 trainees and 360 dual-program students joined DB Group in the year under review. Most of the young people were employed in the following roles: track/rail ve hicle maintenance (about 1,300), traffic controller (about 560), train driver (about 490) and electronic technician for industrial systems (about 480). Since the year under review we have also been training IT specialists. In addition to trainees in their first year of training in classic railway occu-pations (such as traffic controllers and train drivers), those in industrial and technical occupations (such as electronics and mechatronics technicians) have also been given a tablet at the start of training since the year under review, with about 2,500 devices having been issued in total.
We also offer a Group-wide program for socio-educa-tional support during training. This is designed to increase motivation and performance and to provide individual sup-port for low-performing trainees if required. It also aims to prevent people from breaking off their training. About 700 trainees are currently able to access this support.
!!!
401-1
GRI
Other 10,789
Bus drivers 1,601
Construction projects/supervisors 1,387
Traction unit drivers 1,107
Cleaning staff 799
Traffic controllers 726
Maintenance technicians 2,030
IT specialists 713
Shunting service/train preparation 426
Service in train/station 1,237
401-1404-2
GRI
Deutsche Bahn Group 2018 Integrated Report
84

Employee retention and developmentStrategic succession planning for central executive and expert functions is an important part of personnel devel-opment. Faster filling (or refilling) of vacancies based upon advance planning will im -prove performance and in -crease the quality and di ver- sity of appointments. It will also help employees and man agement orient them -selves in their pro fes sional development. In August 2018, the pilot for the new succession planning was launched. This covered about 100 roles in two busi- ness units. Based on expe-rience, a further roll out is planned for 2019.
Following its introduction for top and senior manage-ment, the new career system for executives was extended to middle management in the year under review. The career system offers clear orientation to executives as they expand their experience and encourages regular movement be- t ween management roles.
Further improvements in employment conditionsOn January 1, 2018, the second phase of the collective wage increase from the 2016/2017 collective bargaining agree-ment process came into effect. Employees had previously been able to decide for themselves how they wanted to take this second stage under a new type of elective model: as a pay increase of 2.62%, as a reduction in working hours of one hour per week or as six days’ additional vacation. A total of 58% of employees chose additional vacation, 40% chose the pay increase and 2% chose the reduction in working hours.
Forward-looking collective bargaining The collective wage agreements from the 2016/2017 collec-tive bargaining process with the EVG and the Train Drivers’ Union (Gewerkschaft Deutscher Lokomotivführer; GDL) expired on September 30, 2018. Negotiations on the 2018 collective bargaining process began in October 2018, cov-ering about 160,000 DB employees in Germany.
On December 14, 2018 DB Group reached a collective bargaining agreement with the EVG: this comprised two-stage wage increases of 3.5% on July 1, 2019 and 2.6% on July 1, 2020. In addition, a one-off payment of € 1,000 will be
made for the periode October 2018 until June 2019. On Jan-uary 1, 2021 employees will once again be given the option of more leisure time or vacation instead of the second stage of the increase. The package as a whole also includes significant improvements for young professionals and new innovative options. For example, in the future DB em -ployees will be able to choose to convert overtime hours into company pension contributions. The collective wage agreements apply with retroactive effect from October 1, 2018 to February 28, 2021 and there-fore have a term of 29 months.
On January 4, 2019 a collective wage agreement was also
reached with the GDl µ174.
DB Group is transforming
On April 1, 2018, DB Group was one of the first large groups in Germany to create a new change management division, which reports directly to the member of the Management Board responsible for HR, in order to provide a solid foun-dation for the DB Group transformation within the organi-zation. DB Group is undergoing a fundamental transforma-tion process: the new division will support the fundamental change of our business processes to increase performance capability (OPEX) and drive both the digitalization of DB Group and transformation within the Group by hiring about 20,000 new employees per year over the coming years. The division will define requirements in areas such as staff plan-ning, onboarding, further qualification and working condi-tions, and set guidelines and provide tools for professional change management on-site. If the transformation is to succeed, we will need executives and employees who strive for operational excellence and work enthusiastically to advance the digitalization of DB Group. Empowerment and the development of competence are therefore essential factors for success in terms of the effectiveness of process excellence, performance and change management.
Expansion of performance managementWe are working hard to improve performance management in DB Group sustainably. To further increase effectiveness, we are linking performance management more closely and rigorously to concrete responsibility at the individual level. A solution for this has been developed within the My Per-formance Management project that makes goals more action-oriented, puts the focus squarely upon feedback and ensures that performance is always on the agenda. This creates an alternative to the current dialogue between em -ployees and management and to the management planning
404-2
GRI
102-41102-43
GRI
!!!
404-2
GRI
404-3
GRI
D B L E R N W E LT
The online learning platform DB
Lernwelt allows employees and
managers to continue their training
using computers. The platform
provides over 200 courses devel-
oped by experts that can be ac -
cessed wherever and whenever is
convenient, with the range being
expanded on a regular basis. As part
of the Training the future (Wir bilden
Zukunft) project, DB Lernwelt
helps users develop their expertise
in the areas of digitalization, opera-
tional excellence and performance.
GR
OU
P M
AN
AG
EM
EN
T R
EP
OR
T
85
GROUP MANAGEMENT REPORT — SOcIAl
FIN
AN
cIA
l S
TA
TE
ME
NT
SS
US
TA
INA
BIl
ITY

process. This approach has been piloted in five different business entities, where it has been well received. The pilot of the new performance management system with about 2,500 employees was successful and the system will therefore be gradually rolled out in the integrated rail system over the coming years.
Shaping digitalizationIn March 2018, we concluded a digital agreement with the Group Works Council: the new framework Group Works Council Agreement (Rah men-Konzernbetriebs- vereinbarung; R-KBV) set down guidelines for rapid changes in today’s work environment due to digita-lization. The R-KBV “Shap- ing progress and our future together” aims to give our employees guidance and security.
Digital devices for all DB employeesTo enhance digital skills, all DB employees in Germany are to be issued with smart- phones or tablets no. 102. This program will be rolled out by the end of 2019. This will mean that em ployees who previously could not be contacted electronically when at work will have elec- tronic access to work orders and will be able to document processes electronically.
The Railway of the Future tourThe Railway of the Future tour 2018 used interactive sta-tions and discussions with experts to highlight areas DB Group is working on to meet the challenges posed by digi-talization, operational excellence and performance capa-bility. Be tween April 26 and July 26, 2018, about 17,500 employees (and their families) visited the exhibition in a total of 16 towns and cities.
New corporate wearAt the end of March 2018 we presented the first prototypes of the new corporate wear for customer-facing employees, which was developed with designer Guido Maria Kretschmer. From August 2018, about 250 employees participated in wearability tests. The new collection comprises about 80 individual items. For the color, we chose the new shade of burgundy, whilst the DB logo and cap remain in the fa miliar red. Significant improvements in functionality, ap pearance and comfort affect employee satisfaction and identification with DB Group.
Agility and self-organizationSince the middle of the decade, a dynamic, bottom-up pro-cess has been underway in DB Group, with staff adopting agile methods or organizing themselves more autonomous ly. We expect more than 5% of employees in Germany to be working in agile structures or teams by the end of 2020, half of these due to large transformation projects and the other half due to teams of up to 100 employees trying out agility, self-organization and distributed management. The shift to agility and self-organization does not follow a generic model. It should always start from a strategic challenge or a problem that has been identified, for which suitable an -swers are sought from the agile method set. In the year under review, a virtual and cross-functional team stepped up its work to promote agile and self-organized structures and remove obstacles to their establishment.
Promoting diversityWe believe that diversity is about more than just gender, generation, ethnic origin, religion, sexual orientation and physical or mental abilities. It’s also a question of different personalities, life plans, skills and professional experience. In particular, we are committed to increasing the proportion of women in the workforce and encouraging intergenera-tional cooperation.
In April 2018, about 500 female DB executives met at the second DB Female Managers Lounge on the subject “More women at the top – how we can help promote change.” This initiative aims to promote networking and increase the visibility of female executives.
The new Generational Contracts project is aiding the transfer of technical knowledge and professional skills between DB employees, with about 500 generational con-tracts having been concluded by the end of 2018.
As a member of the Diversity Charter, we use the 6th German Diversity Day 2018 to raise awareness of the sub-ject amongst DB employees.
102-41
GRI
404-2
GRI
!!!
V I R T U A L R E A L I T Y
In the year under review, we used our
virtual reality (VR) application EVE
(Engaging Virtual Education) – which
we developed in-house – to enhance
the qualifications of about 1,000 on-
board service staff. VR glasses allow
them to familiarize themselves with
new functions of the ICE4 without
actually being on board. The Munich-
based start-up VISCOPIC has devel-
oped a virtual training course with
re alistic switch holograms in DB
StartupXpress that was used to help
about 400 employees learn to
rectify faults in switches more quickly
and easily in the year under review.
DB Schenker uses the 3D technology
to train logistics personnel. A VR
version is planned.
Deutsche Bahn Group 2018 Integrated Report
86

Share of women as of Dec 31 (%) 2018 2017 2016
DB Group 24.5 23.7 23.6
In Germany 23.2 23.0 23.0
The proportion of women rose slightly.
Employee satisfaction stable
Employee satisfaction 2018 2017 2016
Employee satisfaction (SI) 3.7 – 3.7
Follow-up workshop implementation rate (%) – 97.1 –
The employee satisfaction survey is conducted every two years. If no survey has been conducted, the key figure Follow-up workshop implementation rate is used.
The fourth Group-wide employee survey was conducted between September 26 and October 26, 2018. This is an essential part of DB’s corporate culture, which relies heavily on personal participation, empowerment and employee responsibility. Over 330,000 employees in 76 countries were invited to participate, with more than 200,000 taking up the offer. The participation rate was 60.0% (2016: 60.7%). The employee survey was once again conducted and eval-uated by the independent external service provider GfK and showed that employee satisfaction has remained stable. Positive trends can be seen in emotional attachment, with 62% of employees (2016: 60%) feeling strongly at tached to the company and their job. There were also im prove ments in areas such as enjoyment of work at 69% (2016: 68%), inte-gration at 64% (2016: 50%) and error culture at 60% (2016: 50%). Critical feedback was received on Group-wide coop-eration and strategic issues, and perception of own moti-vation remained unchanged at 49%. Based on the results, there are four areas for action:
◊ Strategy: Employees and managers are slightly more optimistic about the future, but the value lies signifi-cantly below that for satisfaction in the working environ- ment. The desire for a clearer strategic focus is evident.
◊ Railway of the Future: Although half of all employees are aware of the content and goals of Railway of the Future, belief that the project can be successfully imple-mented is receding. There is a need for visible improve-ments across the board.
◊ Company-wide dialog: Many employees expect more guidance from their management. The survey shows that satisfaction increases when dialogue and commu-nication are perceived as open and honest.
◊ Group-wide cooperation: Improving Group-wide coop-eration is a key task. 40% believe this works well with other divisions. A key theme was structure of work se -quences and the excessive number of interfaces in the Group.
The trend for employee satisfaction thus lies slightly below our forecast from the 2017 Integrated Report µ163.
At the end of January 2019, all executives received their individual results reports. Team workshops and follow-up activities begin in March 2019.
Increase in the number of employees
Employees as of Dec 31 (FTE) 2018 2017
Change
2016absolute %
DB Long-Distance 16,548 15,993 + 555 + 3.5 16,326
DB Regional 35,881 35,651 + 230 + 0.6 36,008
DB Arriva 53,056 54,650 – 1,594 – 2.9 54,150
DB Cargo 28,842 28,257 + 585 + 2.1 29,671
DB Schenker 75,817 71,888 + 3,929 + 5.5 68,388
DB Netze Track 46,969 45,375 + 1,594 + 3.5 43,974
DB Netze Stations 5,804 5,463 + 341 + 6.2 5,093
DB Netze Energy 1,734 1,721 + 13 + 0.8 1,736
Other 53,877 51,937 + 1,940 + 3.7 51,022
DB Group 318,528 310,935 + 7,593 + 2.4 306,368
Changes in the scope of consolidation –1,338 – 95 –1.243 – –
DB Group – comparable 317,190 310,840 + 6,350 – –
To guarantee better comparability, the number of employees is converted into full-time employees. Figures for part-time employees are measured in accordance with their share of the regular annual working time.
The number of employees rose slightly, particularly in the contract logistics division at DB Schenker and in the main-tenance and construction projects divisions at DB Netze Track. The number of employees at DB Long-Distance and DB Cargo also increased.
Employees by regions as of Dec 31 (FTE) 2018 2017
Change
2016absolute %
Germany 196,334 189,423 + 6,911 + 3.6 187,395
Europe (excluding Germany) 92,336 93,655 – 1,319 – 1.4 92,694
Asia/Pacific 16,751 15,971 + 780 + 4.9 15,016
North America 9,736 8,921 + 815 + 9.1 8,556
Rest of world 3,371 2,965 + 406 + 13.7 2,707
DB Group 318,528 310,935 + 7,593 + 2.4 306,368
Employee loyalty (years) 2018 2017 2016
Average length of service 18 19 20
Average age 45 46 46
Germany (companies with about 98% of domestic employees).
405-1
GRI
102-8
GRI
401-1
GRI
102-8
GRI
GR
OU
P M
AN
AG
EM
EN
T R
EP
OR
T
87
GROUP MANAGEMENT REPORT — SOcIAl
FIN
AN
cIA
l S
TA
TE
ME
NT
SS
US
TA
INA
BIl
ITY

¥
¥
Behind schedule On schedule Ahead of schedule
20 40 60 80 100 120 140 160 180
2018
Behind schedule On schedule Ahead of schedule
20 40 60 80 100 120 140 160 180
2018
Behind schedule On schedule Ahead of schedule
20 40 60 80 100 120 140 160 180
2018
Behind schedule On schedule Ahead of schedule
20 40 60 80 100 120 140 160 180
2018
Environmental
89 Our aspiration for climate, noise and nature conservation
90 Progress in climate protection
92 Noise reduction measures93 Recycling rate at a high level
O U R A R E A S O F A C T I O N
Expansion of green services
We offer our customers climate- friendly travel and freight transport with 100 % eco-power.
Reduction of greenhouse gas emissions
We are reducing our global greenhouse gas emissions to protect the climate.
Recycling
We keep our recycling rate high to conserve resources.
Use of renewable energies
We are continuously increasing the proportion of eco-power in the DB traction current mix for climate- friendly rail transport.
Noise remediation
We protect local residents from noise using fixed sound barriers on-site to help achieve quiet freight traffic.
Refitting with whisper brakes
We are halving the rolling noise of freight cars by using V brake shoes for a quieter environment.
O U R A S P I R AT I O N
We want to be a pioneer in environmental protection ¥.
O U R TA R G E T S
2018 Progress. Are we progressing as planned? (Difference between control and 100 % shows delay/lead as a proportion of the actual deviation from target value)
Where do we stand in 2018 on the path to achieving our targets for 2020? (%)
Base 2012 –12.0
2017 –29.5
2018 –33.2
DB2020+ target –30
Climate protec-tion – specific greenhouse gas emissions com-pared to 2006 (%)
Base 2012 7,349
2017 39,604
2018 50,409
DB2020+ target 63,000
Noise reduction – quiet freight cars in Germany as of Dec 31
Base 2012 24.0
2017 44.0
2018 57.2
DB2020+ target 45
Climate protec-tion – share of renewable energies in the DB traction current mix (%)
Base 2012 1,200
2017 1,701
2018 1,758
DB2020+ target 2,000
Noise reduction – total noise remediated track as of Dec 31 (km)
Deutsche Bahn Group 2018 Integrated Report
88

Our aspiration for climate, noise and nature conservationWe are working on the issues that are material to us and our stakeholders µ46. You can find an overview of our mate-
rial sustainability themes µ43 in the section entitled “To our stakeholders.”
Environmental and climate protection are among our strategic goals and are a matter of course to us as a sustain-able mobility and transport service provider. By 2050, all our transport services will be climate-neutral, thereby re -ducing our specific emis -sions to zero.
Our new climate target of halving our specific green house gas emissions by 2030 represents an im-portant milestone on the way to this goal. To achieve this, we are increasing the proportion of renewable energies in the DB traction current mix in Germany to 80% by 2030. We are there-fore increasingly operating our transport services using electricity from renewable sources. One significant measure that we have put in place in the year under review is the supply of DB Long- Distance in Germany entirely with renewable energies
no. 1. This means that since January 2018, all passengers in DB Long-Distance electric trains on all routes have been travel ing CO₂-free.
In addition, we are continuously increasing the propor-tion of more energy-efficient means of production, for example as part of the modernization of our vehicle fleet.
We will continue to use attractive offers to expand the market share of rail transport in the passenger and freight sectors and provide incentives to get more traffic onto the rails. The Berlin–Munich high-speed line, which was put into service in December 2017, and our quiet digital freight cars, which allow freight to be tracked in real time, are two examples of this approach.
The shift of transport services to the rails not only affects the emissions of our own logistics, it is essential to helping Germany achieve its national climate targets in the transport sector. To monitor our progress, we have defined
energy efficiency targets in each business unit, which are measured at regular intervals. We do not use any further climate compensation instruments to achieve our climate target.
Our climate-protection indicators are specific green house
gas emissions compared to 2006 µ90 and the proportion of
renewable ener gies in the DB traction current mix µ90 f.
Another important topic for us is noise reduction. We want to relieve residents noticeably of rail transport noise. This is crucial if we are to increase acceptance of the shift from road to rail. Our goal is therefore to halve rail noise by 2020. To achieve this, we are im -plementing a two-pillar strat egy for noise reduc-tion based around infra-structure and freight cars.We are building noise bar-
riers no. 25 along our track infrastructure and fit-ting apartments with pas-sive sound insulation no.
101. We are also re ducing the noise of our freight car fleet by retrofitting freight cars with quiet brake shoes no. 5 and by purchasing new quiet cars. These measures are being carried out by the business units DB Netze Track and DB Cargo.
We measure our progress based on the indicators of track kilometers noise remediated in total µ92 and quiet freight
cars in Germany µ92.We can make a significant contribution to nature con-
servation by the efficient use of resources µ93. We have therefore set ourselves the target of maintaining a recy-cling rate of over 95%. Thanks to comprehensive recycling we are achieving a particularly high rate for construction wastes. We also aim to increase the recycling rate for our other wastes, in particular municipal waste, in the coming years. In addition, we are redesigning our own production equipment to extend its life cycle, using recycled materials and continuously optimizing our material cycles.
103
GRI
T H I S I S G R E E N .
The slogan ŒThis is green de -
scribes how DB Group sees itself in
terms of environmental protection:
not only do we want to play our own
part, we also want to help our cus-
tomers protect the environment by
providing green solutions and prod-
ucts in all areas. This is why we are pur -
suing ambitious targets in the fields
of climate, noise and nature conser-
vation. In 2018, we increased the
number of green measures that form
part of our daily activities to about
150. DB Group is thus living up to its
responsibility for a successful trans-
port transition in Germany.
O U R C O N T R I B U T I O N T O
T H E C L I M AT E P R O T E C T I O N
P L A N 2 0 5 0
With the Climate Protection Plan
2050, the Federal Government is aim -
ing to reduce greenhouse gas emis-
sions in the transport sector by up to
42 % by 2030 compared to 1990, as
a first step. We have aligned our new
climate target to this aspiration and
aim to reduce absolute greenhouse
gas emissions by about 11 million t
CO₂e by 2030. This will increase the
climate protection gains of shifting
transport to environmentally friend ly
rail. In contrast to passenger cars
and aircraft, a DB long-distance train
running on 100 % eco-power emits
virtually no greenhouse gases. And,
in the freight sector, DB rail freight
transport produces only one-quarter
of the greenhouse gas emissions of
trucks.
GR
OU
P M
AN
AG
EM
EN
T R
EP
OR
T
89
GROUP MANAGEMENT REPORT — ENviRONMENTAl
FiN
AN
CiA
l S
TA
TE
ME
NT
SS
US
TA
iNA
Bil
iTY

Progress in climate protection
Climate target: to halve greenhouse gas emissions by 2030 Since the year under review, we have been referring to our new climate target. By the year 2030, we will cut specific emissions of greenhouse gases (i.e. emissions based on volume sold) by more than half worldwide com-pared to 2006. If the right policy decisions are made, up to 11 million t CO₂e can be saved in Germany’s trans- port sector as a whole by the year 2030 by switch ing traffic to the rails. At the same time, DB Schenker, as an international logistics provider, has set itself the goal of achieving climate- neutral growth, aiming to reduce specific greenhouse gas emissions by at least 40% compared to 2006.
To achieve overall cli-mate neutrality by 2050 we are gradually increasing the proportion of renewable ener-gies in the DB traction current mix to 80% by 2030.
The greenhouse gas emissions of our global lo gistics transport services outside Germany will remain constant over the coming decade despite further increases in trans-port volumes. To achieve this, our carriers are increasing the efficiency of their transport services and working on more sustainable transport solutions.
Further reduction in specific greenhouse gas emissions
Specific greenhouse gas emissions in comparison with 2006 (%)
2018 ◊ –33.2
2017 ◊ –29.5
2016 ◊ –27.3
In accordance with our new climate target, in the year under review we are for the first time showing not only the reduction of specific greenhouse gas emissions by carriers but also those of stationary facilities. We have further reduced our specific greenhouse gas emissions compared with 2006 in line with our targets. The trend lies above our
forecast from the 2017 integrated Report µ163. With refer-ence to 1990, the basis of our first climate protection pro-gram, we have achieved a reduction of 69% for our rail transport in Germany.
Specific CO₂e emissions from journeys and transports of DB Group by mode of transport 2018 2017
Change
2016 1)absolute %
Regional rail passenger transport (g/pkm) 53.1 57.3 – 4.2 –7.3 59.6
thereof in Germany 51.3 56.8 – 5.5 – 9.7 58.4
Long-distance rail passenger transport (g/pkm) 1.3 13.0 –11.7 – 90.0 13.2
Bus transport (g/pkm) 77.3 79.6 –2.3 –2.9 80.7
thereof in Germany 88.8 89.2 – 0.4 – 0.4 91.4
Rail freight transport (g/tkm) 20.1 20.6 – 0.5 –2.4 20.8
Road freight transport (g/tkm) 85.8 92.3 – 6.5 –7.0 97.4
Air freight (g/tkm) 721.8 725.4 –3.6 – 0.5 757.1
Ocean freight (g/tkm) 6.7 6.8 – 0.1 –1.5 6.9
Well-to-wheel (WTW); scope 1 – 3; without pre- and onward carriage; rail transport companies are calculated with their own energy mix and/or European country mixes.1) Figures adjusted.
Particularly significant reductions were seen in regional and long-distance rail passenger transport. This was due in particular to the use of 100% eco-power no. 1 in long-dis-tance transport services and the deployment of modern vehicles.
High share of renewable energies
DB traction current mix (%) 2018 / 2017 / 2016
Renewable energies 1) of which green offerings ◊ 57.2 ◊ 44.0 ◊ 42.0
Nuclear energy ◊ 9.6 ◊ 13.0 ◊ 17.3
Black coal ◊ 18.7 ◊ 23.3 ◊ 26.6
Lignite ◊ 5.7 ◊ 7.5 ◊ 6.0
Natural gas ◊ 8.3 ◊ 11.6 ◊ 7.6
Other ◊ 0.5 ◊ 0.6 ◊ 0.5
Data for 2018 relate exclusively to DB Group companies and are based on findings and estimates available as of February 2019. 2016 including traction current purchased by non-Group train operating companies. 1) Including additionally procured electricity for all green offerings of DB Group with
100% eco-power (e.g. S-Bahn (metro) Hamburg or DBeco plus) and taking into account a forecast based upon the Renewable Energy Sources Act subsidy.
305-5
GRI
305-5
GRI
305-4
GRI
305-4
GRI
A C C O U N T I N G F O R
A L L G R E E N H O U S E G A S E S
Our climate target, ecological foot-
print and specific greenhouse gas
emissions are calculated in accordance
with the Greenhouse Gas Protocol.
In addition to CO₂, we also take into
account all other climate-impacting
gases, such as methane and nitrous
oxide (laughing gas). These gases
are quoted in CO₂ equivalents (CO₂e),
which means their climate impact
is converted into CO₂. Depending on
the energy source (e.g. electricity),
emission values may be about 10 %
higher than those of pure CO₂ emis-
sions. We use energy consumption
and the associated emission factors,
plus performance data, to determine
whether we have achieved our cli-
mate protection targets.
Deutsche Bahn Group 2018 Integrated Report
90

Since January 1, 2018, all passengers on our long-distance trains throughout Germany have been traveling by 100%
eco-power no. 1. Since the beginning of the year under review, S-Bahn (metro) Berlin has also been operating CO₂-free, thereby contributing to the high proportion of eco-power in the DB traction current mix. S-Bahn (metro) Ham-burg has been operating completely CO₂-free since 2010.
In rail freight transport, DBeco plus offers our cus-tomers CO₂-free transport services based on 100% eco-
power no. 1.
The trend lies significantly above our forecast in the 2017
integrated Report µ163.
Energy efficiency increased
Specific primary energy consumption by DB Group journeys and transports 2018 2017
Change
2016absolute %
Regional rail passenger transport (MJ/pkm) 0.85 0.90 – 0.05 – 5.6 0.97
thereof in Germany 0.84 0.91 – 0.07 –7.7 0.98
Long-distance rail passenger transport (MJ/pkm) 0.25 0.36 – 0.11 –30.6 0.39
Bus transport (MJ/pkm) 1.14 1.18 – 0.04 –3.4 1.19
thereof in Germany 1.26 1.26 – – 1.30
Rail freight transport (MJ/tkm) 0.33 0.34 – 0.01 –2.9 0.35
Road freight transport (MJ/tkm) 1.21 1.31 – 0.10 –7.6 1.38
Air freight (MJ/tkm) 9.77 9.82 – 0.05 – 0.5 10.25
Ocean freight (MJ/tkm) 0.09 0.09 – – 0.09
Well-to-wheel (WTW); scope 1 – 3; without pre- and onward carriage.
We have increased energy efficiency across the board, with specific primary energy consumption continuing to fall across all transport services. By reporting primary energy as a reference level, we are also taking into account the processes required for providing the energy, such as extraction, processing and the transport of fuels or the generation of electricity.
Brake energy recovery increases energy efficiency
Brake energy recovery 1) (GWh) 2018 2017 2016
Regional rail passenger transport 834 794 800
Share of total electricity procurement (%) 21 20 19
Long-distance rail passenger transport 331 303 304
Share of total electricity procurement (%) 12 11 11
Rail freight transport 184 148 153
Share of total electricity procurement 2), 3) (%) 9 7 7
Total 1,349 1,245 1,257
1) Germany, tank-to-wheel (TTW).2) Since 2018 including RBH Logistics.3) Previous years’ figure adjusted.
Modern rolling stock can convert a proportion of its kinetic energy into electrical energy during braking, allowing this to be fed back into the traction current grid no. 19. In the year under review, the recovery rate increased to 15% (previous year: 14%). The fleet vehicles that are able to “re cycle” electricity is currently growing, thanks in part to the delivery of further ICE 4 in the year under review.
Stationary energy requirements reduced in stations, facilities and buildingsThe about 5,400 stations and our maintenance facilities and buildings in Germany, as well as over 2,000 sites worldwide operated by DB Schenker, account for about 7% of DB Group’s total energy requirements. To identify potential savings and measure energy consumption over the long term, energy audits were carried out in about 700 subsid-iaries in previous years in order to implement the EU Energy Efficiency Directive. DB Regio AG, S-Bahn Berlin GmbH, S-Bahn Hamburg GmbH, DB Fernverkehr AG, DB Station& Service AG and DB Energie GmbH have been operating an energy management system no. 78 in accordance with ISO 50001 since 2016. This was partly responsible for the further fall in stationary power consumption compared to the previous year.
At DB Netze Stations, we managed to lower absolute primary energy consumption by 20.5% in comparison to 2010 by the end of 2018. The goal of reducing absolute primary energy consumption by 20% by 2020 was thus achieved two years earlier than planned. This was thanks to measures such as the conversion of showcases, orientation systems and platform lighting to lED technology no. 50, the energy-focused renovation of railway station buildings by means of façade/roof insulation or modern windows, and the improvement of old heating systems by replacing burn- ers, boilers and circulation pumps. Preference was also given to the use of photovoltaic, solar no. 30 or geothermal
no. 91 systems for new buildings and conversions. Examples are the green stations no. 6 in Horrem and Lutherstadt Wittenberg. In addition, the electricity requirements of the 15 largest railway stations will be covered by renewable energies from 2019.
Expansion of solar installations on DB buildingsWe have provided space for photovoltaic installations on DB premises since 1997. We, or external investors, have installed solar systems no. 30 amounting to a total area of about 290,000 m² on the roofs of workshops and warehouses worldwide and at railway stations. They feed about 20 mega- watt hours into the electricity grids annually.
302-3302-4302-5
GRIGRIGRI
302-1
GRI
302-4
GRI
GR
OU
P M
AN
AG
EM
EN
T R
EP
OR
T
91
GROUP MANAGEMENT REPORT — ENviRONMENTAl
FiN
AN
CiA
l S
TA
TE
ME
NT
SS
US
TA
iNA
Bil
iTY

Noise reduction measures
We aim to halve rail transport noise by 2020 compared with the year 2000 by building fixed sound barriers no. 101 along the line and using whisper brakes no. 5 on freight cars.
Noise remediation and prevention continues
Noise remediation and prevention in Germany as of Dec 31 2018 2017 2016
NOI SE R EMEDIATION (E XI STING NET WOR K)
Sound barriers completed 1) (km) 44.6 19.9 35.7
Homes with passive measures 2,248 1,634 1,495
Track kilometers noise remediated in total 1) (km) 1,758 1,701 1,598
NOI SE PR EVENTION (NE W CON STRU C TION AND E XPAN SION LINE S)
Sound barriers completed 1) (km) 82.9 32.2 24.4
1) Previous years’ figures adjusted.
Since 1999, we have been reducing noise pollution for res-idents living near railway lines by the “Voluntary noise remediation program for existing rail lines of the Federal Government” and by statutory noise remediation measures. By the end of 2020, we aim to perform noise remediation on a total of 2,000 kilometers of track using fixed noise
abatement measures no. 25. In the year under review, about € 98 million from the Federal budget was used for active and passive noise abatement measures under the noise remediation program. Other noise protection projects are also being financed using funds from the program.
In the year under review, we tightened up the definition of the key indicator track kilometers noise remediated in total, removed parts of the noise remediation and added some sections of the route for which acoustic reports during implementation established a need for additional noise remediation measures. The previous year’s figures have been adjusted accordingly. We have revised the key indicator on the progress of the construction of sound barriers. We have changed the name of the key indicator from “sound barriers erected” to “sound barriers completed” to distinguish it from the old indicator. It was therefore not possible to fully achieve the forecast in the 2017 integrated Report µ163 for the total noise remediated track.
The abolition of the rail bonus and a further reduction of the threshold values of the Federal Government’s volun-tary noise remediation program to 57 dB at night in residen-tial areas have laid the groundwork to provide residents with even better protection against rail noise. As a result, the Federal Government’s voluntary noise remediation pro-
gram no. 101 has been fundamentally revised. The number
of routes covered by the revised noise remediation pro-gram has increased significantly as a result of the reduced thresholds. The sections of track that have already been remediated based have been taken into consideration as well due to the reduced threshold. The new overall concept was published by the BMVI on January 31, 2019.
More quiet freight cars on the rails
Freight cars in operation equipped with V brake shoes of DB Cargo in Germany as of Dec 31
2018 2017 2016
New freight cars 8,470 8,323 8,302
Freight cars refitted with whisper brakes 41,939 31,281 24,094
Quiet freight cars 50,409 39,604 32,396
The number of new and existing freight cars with the noise reducing composite technology has increased further. In the year under review, about 11,000 cars in the active freight fleet were equipped with whisper brakes no. 5. About 80% of DB Cargo Germany’s active fleet are thus running on quiet brake shoes. This is in line with our fore-
cast in the 2017 integrated Report µ163.
Progress on the innovative freight car projectAs part of a tender, in 2016 the BMVI awarded a contract for a research project entitled ŒConstruction and testing of
innovative freight cars on the migration to noise reducing and energy-efficient technologies in freight cars to the working group made up of DB Cargo AG and VTG AG. As part of this project, the working group designed a demon-strator train made up of a total of 12 innovative freight cars
no. 54 and eight reference vehicles. Three further existing freight cars were also fitted with automatic couplings. The innovative freight cars will be optimized and further developed in terms of noise and weight reduction on the basis of existing car types. In addition, innovative compo-nents such as rubber-sprung bogies, low-noise wheel sets, wheel noise absorbers, noise aprons, electropneu-matic brakes and other innovations are being tested and evaluated according to criteria such as noise reduction, energy efficiency and economy. Regular measurements are carried out during field tests. The project is scheduled to end on April 30, 2019.
Deutsche Bahn Group 2018 Integrated Report
92

innovative noise remediation To expand our portfolio of noise remediation measures, we, together with BMVI, have launched the new and applica-tion-oriented noise control trials initiative (Initiative Lärm-schutzerprobung neu und anwendungsorientiert; I-LENA) as part of the Future Capital Expenditure Program (Zukunfts-
investitionsprogramm; ZiP) µ147. Under this program, about 30 innovative products for noise protection no. 43 will be tested on the infrastructure under real-world conditions over the next two years. These include new types of sound barriers and innovative technologies to reduce rolling noise at the source through improved rail grinding and rail damp- ing. i-lENA no. 54 also focuses on sound insulation tech-nologies for particular “hotspots” where there is loud squeak- ing in curves, construction noise or annoying rumbling when crossing railway bridges. In the year under review, this began with six measures on two test lines. Technologies to reduce cornering squeals, rail dampers and shield ings as well as a miniature noise barrier, are currently being tested.
Noise protection for particularly affected Middle Rhine valley areaIn the year under review, there were two meetings of the Advisory Board for a Quieter Middle Rhine Valley, in which there were in-depth discussions between DB Group and those affected. An on-site visit was also made to further improve noise protection for residents in the Middle Rhine Valley. Some 70 noise protection measures, such as special noise dampers or shielding systems on the rails, noise pro-tection walls and palings, will further reduce rail transport noise in the vicinity of the Upper Middle Rhine Valley World Heritage site between Koblenz/Lahnstein and Bingen/Rüdesheim. A total of about € 139 million will be invested in additional noise reduction projects on both sides of the Rhine in the coming years.
Recycling rate at a high level
The construction and maintenance of the rail infrastructure involves the use of a variety of resources. These include building materials such as concrete, steel, gravel and sand. Waste materials are also produced that must be disposed of. We are transforming our approach to waste manage-ment from an optimized disposal management system into a modern resource management system. Our goal is to maintain our recycling rate at a high level of at least 95%, despite an increase in the intensity of construction activity. While we are already achieving a high rate for construction waste, this will be increased further, particularly in the area
of municipal waste. In addition, we will make increasing use of recycled materials and extend the life of our production equipment, such as vehicles no. 87. This will help to in -crease the use of secondary raw materials and also con-serve natural resources, since the production of recycled materials is better for the environment than extracting pri-mary raw materials.
Volume of waste according to type of disposal 2018 2017 2016
Total waste (thousand t) 12,807 12,642 12,921
Recycling rate (%) 98.0 98.0 98.6 2)
Share of thermal recovery (%) 0.9 0.9 1.4
Share of disposal (%) 1.2 1.1 1.4
Share of hazardous waste 1) (%) 3.7 3.3 5.1
1) Pursuant to the List of Waste Ordinance, for example waste oil. 2) Figure adjusted.
By the use of specific measures such as selective disman-tling and a contractual commitment to sorting and recy-cling facilities, we will maintain the share of recyclable waste at a high level and further reduce the proportion of waste that is destined for disposal or incineration. For example, we are currently working on the implementation of a strategy for disposing of mixed municipal waste with the aim of maximizing recycling of the materials it contains.
Volume of waste according to type (thousand t) 2018 2017 2016
Total waste 12,807 12,642 12,921
thereof construction waste 12,367 12,121 12,400
thereof scrap metal 318 378 375
thereof electronic scrap 1.5 6.1 4.3
thereof municipal waste 58.1 60.2 70.1
thereof paper 19.1 23.1 25.3
thereof waste oil 2.0 4.0 6.6
thereof other 1) 41.5 49.6 40.1
1) For example paint, varnish, sludge and other maintenance-related waste.
The introduction of a uniform waste management system served to further standardize data collection and reporting on waste data. In the year under review, about 165,000 tons more waste was generated. Two business areas have a sig-nificant influence on changes in the volume of our most important type of waste, construction waste. Both in the Stuttgart — Ulm project (+0.7 million t) and at DB Netz AG –0.4 million t), construction waste changed slightly com-pared to the previous year.
Although the recycling rate for construction waste fell slightly by 0.2 percentage points, it remained high at 98.4%. All other waste volumes declined significantly in the year under review.
306-2
GRI
GR
OU
P M
AN
AG
EM
EN
T R
EP
OR
T
93
GROUP MANAGEMENT REPORT — ENviRONMENTAl
FiN
AN
CiA
l S
TA
TE
ME
NT
SS
US
TA
iNA
Bil
iTY

¿
¿
Behind schedule On schedule Ahead of schedule
20 40 60 80 100 120 140 160 180
2018
Behind schedule On schedule Ahead of schedule
20 40 60 80 100 120 140 160 180
2018
Business development
95 Differentiated environment for global and European transport markets
96 Income situation not satisfactory101 Stable financial position
103 Value management figures under pressure106 Cash and cash equivalents slightly increased 107 Asset situation stable
O U R A R E A S O F A C T I O N
International growth
Among other successes, DB Schenker remains on track for growth with its ambition of being the sector number one.
Cost management
Strict cost management in all business units and in corporate management.
Restructuring
At DB Cargo in Great Britain and France and elsewhere.
Service and quality
For example, improvements to the integrated rail system through the Agenda for a Better Railway.
Efficiency improvements
For example, improvements resulting from the OPEX program in terms of availability and maintenance expenses.
Capacity expansion
Extensive capital expenditures in track infrastructure and our vehicle fleet.
O U R A S P I R AT I O N
As a profitable quality leader ¿, we offer our customers first-class mobility and logistics solutions – that means excellent quality at affordable costs.
O U R TA R G E T S
2018 Progress. Are we progressing as planned? (Difference between control and 100 % shows delay/lead as a proportion of the actual deviation from target value)
Where do we stand in 2018 on the path to achieving our targets for 2020? (%)
Base 2012 8.3
2017 6.1
2018 5.8
DB2020+ target ≥ 7.0
Reasonable rate of return – ROCE (%)
Base 2012 22.2
2017 18.7
2018 17.6
DB2020+ target ≥ 25
Financial stability – redemption coverage (%)
Deutsche Bahn Group 2018 Integrated Report
94
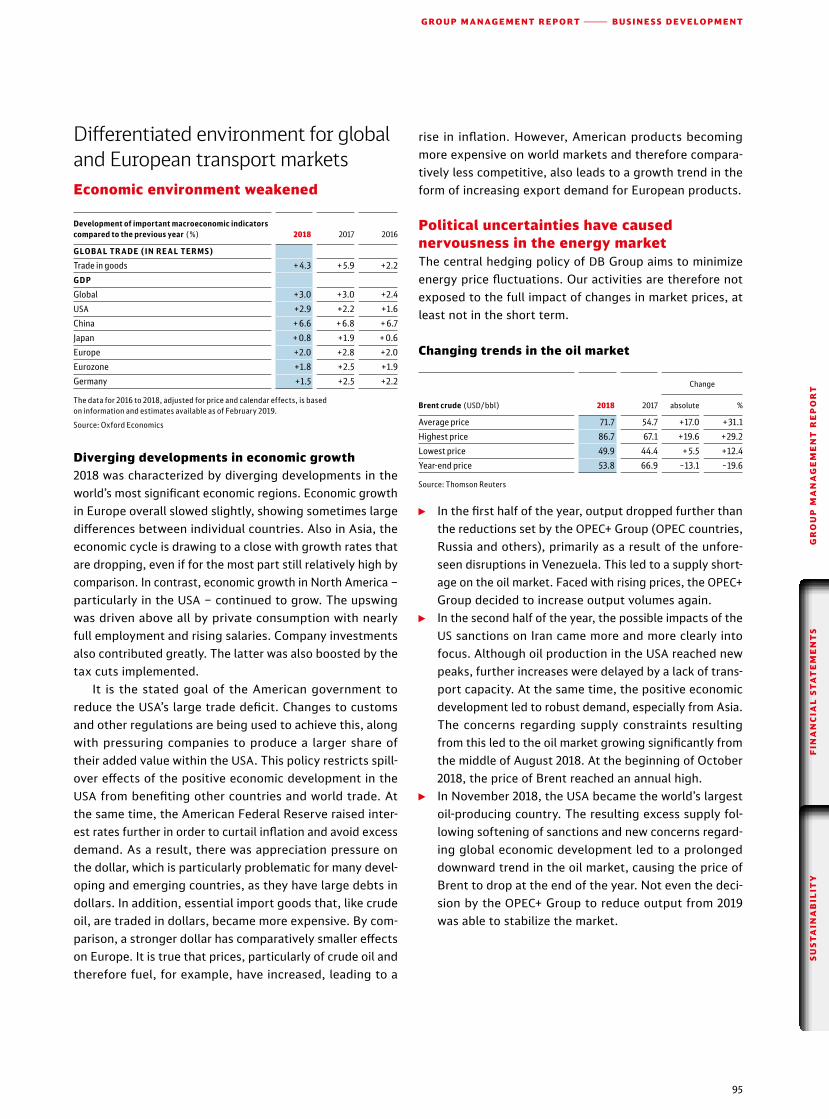
Differentiated environment for global and European transport marketsEconomic environment weakened
Development of important macroeconomic indicators compared to the previous year (%) 2018 2017 2016
GLOBAL TR ADE (IN R E AL TER M S)
Trade in goods + 4.3 + 5.9 +2.2
GDP
Global + 3.0 + 3.0 +2.4
USA +2.9 +2.2 +1.6
China + 6.6 + 6.8 + 6.7
Japan + 0.8 +1.9 + 0.6
Europe +2.0 +2.8 +2.0
Eurozone +1.8 +2.5 +1.9
Germany +1.5 +2.5 +2.2
The data for 2016 to 2018, adjusted for price and calendar effects, is based on information and estimates available as of February 2019.
Source: Oxford Economics
Diverging developments in economic growth2018 was characterized by diverging developments in the world’s most significant economic regions. Economic growth in Europe overall slowed slightly, showing sometimes large differences between individual countries. Also in Asia, the economic cycle is drawing to a close with growth rates that are dropping, even if for the most part still relatively high by comparison. In contrast, economic growth in North America – particularly in the USA – continued to grow. The upswing was driven above all by private consumption with nearly full employment and rising salaries. Company investments also contributed greatly. The latter was also boosted by the tax cuts implemented.
It is the stated goal of the American government to reduce the USA’s large trade deficit. Changes to customs and other regulations are being used to achieve this, along with pressuring companies to produce a larger share of their added value within the USA. This policy restricts spillover effects of the positive economic development in the USA from benefiting other countries and world trade. At the same time, the American Federal Reserve raised in ter est rates further in order to curtail inflation and avoid excess demand. As a result, there was appreciation pressure on the dollar, which is particularly problematic for many developing and emerging countries, as they have large debts in dollars. In addition, essential import goods that, like crude oil, are traded in dollars, became more expensive. By comparison, a stronger dollar has comparatively smaller effects on Europe. It is true that prices, particularly of crude oil and therefore fuel, for example, have increased, leading to a
rise in inflation. However, American products becoming more expensive on world markets and therefore comparatively less competitive, also leads to a growth trend in the form of increasing export demand for European products.
Political uncertainties have caused nervousness in the energy marketThe central hedging policy of DB Group aims to minimize energy price fluctuations. Our activities are therefore not exposed to the full impact of changes in market prices, at least not in the short term.
Changing trends in the oil market
Brent crude (USD/bbl) 2018 2017
Change
absolute %
Average price 71.7 54.7 +17.0 + 31.1
Highest price 86.7 67.1 +19.6 +29.2
Lowest price 49.9 44.4 + 5.5 +12.4
Year-end price 53.8 66.9 –13.1 –19.6
Source: Thomson Reuters
◊ In the first half of the year, output dropped further than the reductions set by the OPEC+ Group (OPEC countries, Russia and others), primarily as a result of the unforeseen disruptions in Venezuela. This led to a supply short age on the oil market. Faced with rising prices, the OPEC+ Group decided to increase output volumes again.
◊ In the second half of the year, the possible impacts of the US sanctions on Iran came more and more clearly into focus. Although oil production in the USA reached new peaks, further increases were delayed by a lack of transport capacity. At the same time, the positive economic development led to robust demand, especially from Asia. The concerns regarding supply constraints resulting from this led to the oil market growing significantly from the middle of August 2018. At the beginning of October 2018, the price of Brent reached an annual high.
◊ In November 2018, the USA became the world’s largest oilproducing country. The resulting excess supply following softening of sanctions and new concerns regard ing global economic development led to a prolonged downward trend in the oil market, causing the price of Brent to drop at the end of the year. Not even the decision by the OPEC+ Group to reduce output from 2019 was able to stabilize the market.
GR
OU
P M
AN
AG
EM
EN
T R
EP
OR
T
95
GROUP MANAGEMENT REPORT — BUsiNEss DEvElOPMENT
FiN
AN
CiA
l s
TA
TE
ME
NT
ss
Us
TA
iNA
Bil
iTY

Income situation not satisfactory
◊ Revenue increase as a result of performance gains, amongst other reasons.
◊ Rising factor costs for energy and personnel. ◊ Extensive measures to improve quality
and further digitalization. ◊ Negative effects from operational restrictions
at the high level of the previous year. ◊ Operating income development slightly declined.
No major restrictions in comparability with the previous yearTrends in expenses and income in the year under review were not significantly influenced by changes in the scope of
consolidation µ189.
Revenues further increased
Revenues (€ million) 2018 2017
Change
absolute %
Revenues 44,065 42,693 + 1,372 + 3.2
Special items – 41 11 – 52 –
Revenues adjusted 44,024 42,704 + 1,320 + 3.1
Changes in the scope of consolidation – 45 – 1 – 44 –
Exchange rate changes 507 – + 507 –
Revenues comparable 44,486 42,703 + 1,783 + 4.2
Revenues developed positively. The growth occurred broadly across the business units and was largely driven by performance gains.
On a comparable basis (adjusted for special items as well as scope of consolidation and exchange rate changes), revenues even increased slightly more:
◊ The special items in the year under review resulted from the elimination of revenue discounts connected to on going procedures in infrastructure (previous year: from revenue discounts for previous years).
◊ The effects of changes in the scope of consolidation mainly relate to DB Arriva (€ +32 million) and DB Cargo (€ +12 million).
◊ The effects of exchange rate changes were mainly attributable to DB Schenker (€ –455 million) and DB Arriva (€ –46 million).
Revenues adjusted (€ billion)
2018 ◊ 44.0
2017 ◊ 42.7
2016 ◊ 40.6
2015 ◊ 40.5
2014 ◊ 39.7
2011
GRI
1027
GRI
√
◊ Speculative investors may also have driven the price development. Bets on price increases were withdrawn, causing the price to fall even further.
Electricity prices are developing in parallel with the coal and CO₂ market
Electricity market 2018 2017
Change
absolute %
BA SE LOAD P OWER (FOLLOWING YE AR) (€/MWH)
Average price 44.1 32.4 +11.7 + 36.1
Highest price 56.9 38.4 +18.5 + 48.2
Lowest price 32.6 28.0 + 4.6 +16.4
Year-end price 51.4 37.2 +14.2 + 38.2
EMI S SION S CERTIFIC ATE S (€/T CO₂)
Average price 16.0 5.8 +10.2 –
Highest price 25.8 8.3 +17.5 –
Lowest price 7.6 4.3 + 3.3 +76.7
Year-end price 25.0 8.2 +16.8 –
Source: Thomson Reuters
◊ The German electricity spot market is becoming increasingly weatherdependent. The fluctuation in production from renewable energies caused significant price fluctuations due to limited predictability. High temperatures and water shortages led to a further price increase in summer. High primary energy prices also acted to drive prices.
◊ There was a dip in price of the coal market until the end of the first quarter as a result of temporary import re strictions in China. Supply difficulties and persistently high demand in Asia drove prices up again quickly. Amongst other reasons, high natural gas prices from September 2018 led to price increases on the northwestern European coal market to over USD 100/t.
◊ The entry into force of the market stability reserve from 2019, which withdrew nearly a quarter of surplus certificates from the CO₂ market, caused a supply shortage. As soon as August 2018, the auction volume was re duced. In addition, there was speculation on the market as a result of discussions of a minimum price. Overall, the average price was significantly above the level of the previous year.
Deutsche Bahn Group 2018 Integrated Report
96

Mainly positive development of the business units
External revenues by business units (€ million) 2018 2017
Change
absolute %
DB Long-Distance 4,528 4,193 + 335 + 8.0
DB Regional 8,862 8,629 + 233 + 2.7
DB Arriva 5,433 5,338 + 95 + 1.8
DB Cargo 4,177 4,209 – 32 – 0.8
DB Schenker 16,973 16,345 + 628 + 3.8
DB Netze Track 1,559 1,522 + 37 + 2.4
DB Netze Stations 569 540 + 29 + 5.4
DB Netze Energy 1,350 1,301 + 49 + 3.8
Other 573 627 – 54 – 8.6
DB Group adjusted 44,024 42,704 + 1,320 + 3.1
Revenue development of the business units µ112 ff. was, with the exception of DB Cargo and the Other division, positive. DB Schenker, DB LongDistance and DB Regional showed the largest share of growth.
Revenue structure unchangedExternal revenue structure by divisions (%) 2018 / 2017
External revenue structure (%) 2018 2017
DB Long-Distance 10.3 9.8
DB Regional 20.1 20.2
DB Arriva 12.3 12.5
DB Cargo 9.5 9.9
DB Schenker 38.6 38.3
DB Netze Track 3.5 3.6
DB Netze Stations 1.3 1.3
DB Netze Energy 3.1 3.0
Other 1.3 1.4
DB Group 100 100
There were no significant changes to the revenue structure at business unit level.
External revenues by regions (%) 2018 / 2017
External revenues by regions (€ million) 2018 2017
Change
absolute %
Germany 24,929 24,093 + 836 + 3.5
Europe (excluding Germany) 13,593 13,318 + 275 + 2.1
Asia/Pacific 3,035 2,935 + 100 + 3.4
North America 1,905 1,801 + 104 + 5.8
Rest of world 562 557 + 5 + 0.9
DB Group adjusted 44,024 42,704 + 1,320 + 3.1
Overall, regional revenue development was positive: ◊ In Germany, revenue rose noticeably. This was partic
ularly as a result of growth at DB LongDistance, DB Region al and in infrastructure. However, a small de crease in revenues at DB Cargo had a dampening effect, primarily as a result of strains on transport quality and resource shortages.
◊ Revenue development in Europe (excluding Germany) was also positive. Positive effects of volume growth at DB Arriva and DB Schenker were weakened by restrictions caused by strikes in France and Great Britain, reduc tions in coal transport at DB Cargo and negative ex change rate effects from developments in the British pound.
◊ Revenues increased in the Asia/Pacific and North America regions as a result of business development at DB Schen ker. In contrast, exchange rate effects had a significant dampening effect.
income development under pressureTransition to the adjusted statement of income
◊ Special issues are eliminated in the adjusted statement of income. The transition to the adjusted statement is a twostep process. Firstly, standard reclassifications are carried out, then the figures are adjusted for individual special items.
◊ The reclassifications essentially relate to two issues. ◊ The first issue is the reclassification of net interest
income components not related to net financial debt and pension provisions: predominantly the
√
Passenger transport 43 / 43
Infrastructure 8 / 8
Freight transport and logistics 48 / 48
Other/consolidation 1 / 1
Rest of world 1 / 1North America 4 / 4
Europe (excluding Germany) 31 / 31
Asia/Pacific 7 / 7
Germany 57 / 57
√
GR
OU
P M
AN
AG
EM
EN
T R
EP
OR
T
97
GROUP MANAGEMENT REPORT — BUsiNEss DEvElOPMENT
FiN
AN
CiA
l s
TA
TE
ME
NT
ss
Us
TA
iNA
Bil
iTY

compounding and discounting effects of noncur rent provisions (excluding pension obligations) and noncurrent liabilities (excluding financial debt). The nonoperational character of these components can also be seen in the fact that their influence on net interest income very much depends on the in terest rates as of the balance sheet date.
◊ The second significant reclassification relates to the amortization of intangible assets capitalized in the course of purchase price allocation (PPA) of acquisi
tions conducted during the assessment of longterm customer contracts. Existing transport contracts are an essential component of the purchase price valuation, in passenger transport in particular. In order to safeguard the operating assessment and to prevent these contracts from being treated differently from other contracts, these depreciation components are eliminated from the operating profit. The sum reclassified in the year under review relates almost entirely to the acquisition of Arriva.
Transition to the adjusted statement of income (€ million) 2018
Reclassifications Adjustment of special items
2018 adjusted
IFRS com- pounding/
dis- counting
Net invest-
ment income
PPA amorti-
zation
Provision for
impending losses
Restruc- turing
Civil proceed-
ings infra- structure
utilization fees
Provision relating to
super-structure Other
Revenues 44,065 – – – – – – 41 – – 0 44,024
Inventory changes and other internally produced and capitalized assets 3,091 – – – – – – – – 3,091
Other operating income 2,998 – – – – – 45 –10 –24 – 57 2,862
Cost of materials – 22,258 – – – – 3 – – 1 – 22,254
Personnel expenses – 17,301 – – – – 141 – – 11 – 17,149
Other operating expenses – 6,088 – – – 204 20 1 – 28 – 5,835
EBITDA/EBITDA adjusted 4,507 – – – 204 119 – 50 –24 –17 4,739
Depreciation – 2,688 – – 59 – 1 – – 0 – 2,628
Operating profit (EBIT) | EBIT adjusted 1,819 – – 59 204 120 – 50 –24 –17 2,111
Net interest income | Net operating interest – 645 27 – – – – 0 – 0 – 618
Operating income after interest 1,174 27 – 59 204 120 – 50 –24 –17 1,493
Result from investments accounted for using the equity method | Net investment income 12 – – 0 – – – – – – 12
Other financial result – 14 –27 0 – – – – – – – 41
PPA amortization customer contracts – – – – 59 – – – – – – 59
Extraordinary result – – – – –204 –120 50 24 17 – 233
Profit before taxes on income 1,172 – – – – – – – – 1,172
Excerpt from adjusted statement of income (€ million)2018
adjusted2017
adjusted
Change
absolute
thereof due to changes in
the scope of consolidation
thereof due
to exchange rate effects %
Revenues 44,024 42,704 + 1,320 + 44 – 507 + 3.1
Inventory changes and other internally produced and capitalized assets 3,091 2,900 + 191 + 0 – 0 + 6.6
Other operating income 2,862 2,802 + 60 +2 –7 + 2.1
Cost of materials – 22,254 – 21,441 – 813 –15 + 317 + 3.8
Personnel expenses – 17,149 – 16,363 – 786 –16 +104 + 4.8
Other operating expenses – 5,835 – 5,672 – 163 –10 +71 + 2.9
EBITDA adjusted 4,739 4,930 – 191 + 5 –22 – 3.9
Depreciation – 2,628 – 2,778 + 150 –3 + 6 – 5.4
EBIT adjusted 2,111 2,152 – 41 +2 –16 – 1.9
Net operating interest – 618 – 682 + 64 +1 –1 – 9.4
Operating income after interest 1,493 1,470 + 23 + 3 –17 + 1.6
Net investment income 12 14 – 2 + 0 – 0 – 14.3
Other financial result – 41 – 49 + 8 + 0 + 3 – 16.3
PPA amortization customer contracts – 59 – 73 + 14 – + 0 – 19.2
Extraordinary result – 233 – 394 + 161 – +2 – 40.9
Profit before taxes on income 1,172 968 + 204 + 3 –12 + 21.1
Deutsche Bahn Group 2018 Integrated Report
98

◊ Adjustments for special items involve issues which are extraordinary based on the reasons for them and/or the amounts involved and which would have a significant negative effect on operating performance over time. Book profits and losses from transactions with subsidiaries/financial assets are adjusted regardless of their amounts. Individual items are adjusted if they are extraordinary in character, can be accounted for and assessed precisely and are significant in volume.
Operating profit figures declinedThe following presentation describes the changes in the key items on the statement of income, adjusted for special items. The effects of the changes in the scope of consolidation and exchange rate effects are presented in the above table and are not explained further in the following section.
Exchange rate effects in the year under review reduced both income and expenses overall. Effects resulting from changes to the scope of consolidation were not significant.
The economic development was modest overall. Adjust ed EBIT developed slightly more weakly compared to the previous year. The burdens from increases in factor costs (particularly in Germany), additional expenses for quality improvement measures and for digitalization and restric tions to production stability (particularly at DB Cargo) could not be balanced out by the positive effects on the revenue side.
◊ Revenue development µ96 f. was positive. ◊ Other operating income rose primarily because of the
effects of train-path price support in rail freight transport
µ63 (opposite effect in revenues) and higher income from the release of provisions. The nonrecurrence of the one off effects of the previous year, such as the reim-
bursement of the nuclear fuel tax (2017 integrated Report
µ145) and compensation received for damages had a counteracting effect.
◊ Cost of materials increased. This was due to higher purchased transport services at DB Schenker as a result of volume gains and increased freight rates. In addition, higher energy costs and maintenance expenses hindered development.
◊ Personnel expenses also increased significantly. In addition to tariff effects, especially in Germany, the higher number of employees also had an impact.
◊ Other operational expenses increased. This was im pacted by factors including higher rental expenses and expense burdens for additional quality and digitalization measures.
◊ The decrease in depreciation resulted particularly from the reassessment of the economic useful life of fixed as sets at DB Netze Track and DB Regional vehicles. Higher depreciation on vehicles as a result of capital expenditures had a partially compensating effect.
The operating income after interest increased as a result of a significantly improved net operating interest. Effects from lower interest rates on refinancing primarily had an effect here.
Net investment income decreased. This was primarily impacted by the elimination of income from Etihad Rail µ72,
which since the year under review has been proportionately consolidated as a joint operation. Improvements to income including from Barraquiero and Arriva London Overground at DB Arriva had a compensating effect.
The development of the other financial result was mainly caused by effects from hedging transactions.
The extraordinary charges µ100 were significantly lower than in the previous year. This led to a noticeable increase in profit before taxes on income.
significant drop in net profit for the year
Excerpt from statement of income (€ million) 2018 2017
Change
absolute %
Profit before taxes on income 1,172 968 + 204 + 21.1
Taxes on income – 630 – 203 – 427 –
Actual taxes on income – 192 – 180 – 12 + 6.7
Deferred tax expenses – 438 – 23 – 415 –
Net profit for the year 542 765 – 223 – 29.2
DB AG shareholders 528 745 – 217 – 29.1
Other shareholders (non-controlling interests) 14 20 – 6 – 30.0
Earnings per share (€)
Undiluted 1.23 1.73 – 0.50 – 28.9
Diluted 1.23 1.73 – 0.50 – 28.9
The marked improvement in the profit before taxes on income was more than compensated by the development of the income tax position. This was impacted by the sharply declined development of DB AG’s deferred tax position, mainly because of lower expected results. It was also affected by the risks of higher foreign taxes on income and increases in anticipated taxable losses that are not e xpected to be available for offsetting. The net profit for the year (profit after taxes on income) therefore fell sharply.
Earnings per share developed accordingly.
GR
OU
P M
AN
AG
EM
EN
T R
EP
OR
T
99
GROUP MANAGEMENT REPORT — BUsiNEss DEvElOPMENT
FiN
AN
CiA
l s
TA
TE
ME
NT
ss
Us
TA
iNA
Bil
iTY

Generally weak development of the business units
EBIT adjusted by business units (€ million) 2018 2017
Change
absolute %
DB Long-Distance 417 381 + 36 + 9.4
DB Regional 492 508 – 16 – 3.1
DB Arriva 300 301 – 1 – 0.3
DB Cargo – 190 – 90 – 100 + 111
DB Schenker 503 477 + 26 + 5.5
DB Netze Track 840 687 + 153 + 22.3
DB Netze Stations 221 233 – 12 – 5.2
DB Netze Energy 21 72 – 51 – 70.8
Other/consolidation – 493 – 417 – 76 + 18.2
DB Group 2,111 2,152 – 41 – 1.9
The development of adjusted profit figures varied between
the business units µ112 ff. but overall was unsatisfactory. The business units in the integrated rail system µ50 declined overall, driven by increases in factor costs and expense burdens from additional quality measures. In addition, there were operational difficulties at DB Cargo. The Other division also saw a noticeable decline particularly as a result of higher personnel expenses. On the other hand, the profit development of DB Netze Track and DB LongDistance was positive. DB Arriva, in spite of hindrances from operational restrictions amongst others, remained on the level of the previous year. The operating profit from DB Schenker was significantly better than in the previous year.
Extraordinary charges significantly declined
Extraordinary result (€ million) 2018
thereof affect-
ing EBIT 2017
thereof affecting
EBIT
DB Long-Distance 5 5 – –
DB Regional –0 – 0 21 21
DB Arriva – 204 –204 5 5
DB Cargo – 13 –13 – 5 – 5
DB Schenker – 7 –7 – 105 –105
DB Netze Track 67 67 – 10 –7
DB Netze Stations 7 7 – 10 –10
DB Netze Energy – – – 15 –15
Other/consolidation – 86 – 86 – 275 –275
DB Group – 233 –233 – 394 –391
The extraordinary result improved significantly and was comprised in the year under review from the following special items inter alia:
◊ Expenses from the establishment of a provision for impending losses (DB Arriva).
◊ Effects arising from restructuring measures (DB Long Distance, DB Arriva, DB Cargo and Other division).
◊ Effects of civil proceedings in connection with infrastruc ture fees (DB Netze Track and DB Netze Stations).
◊ Effects of alterations to provisions relating to the superstructure (DB Netze Track).
◊ Income from exiting company participations (DB Arriva, DB Cargo, DB Schenker and Other division).
The extraordinary result in the previous year was composed inter alia of the following special items:
◊ Expenses relating to restructuring measures at DB Re gion al, DB Cargo, DB Schenker and the Other division.
◊ Effects of impairments relating to the superstructure (decommissioning overhead line systems on disused routes) at DB Netze Track.
◊ Expenses relating to the increase in the provision for legacy remediation (Other division) and income from the recovery in value and reductions in provisions for real estate owing to an altered portfolio strategy (DB Netze Track).
Development largely in line with forecast of income situation
Outlook for 2018 financial year 2017
2018 (March
2018 forecast)
2018 (July 2018
forecast) 2018
Revenues (€ billion) 42.7 ~44 ~43.7 44.0
Revenues comparable (€ billion) 42.7 – ~44.2 44.5
EBIT adjusted (€ billion) 2.15 ≥ 2.2 ~2.1 2.1
ROCE (%) 6.1 ~6.0 ~5.6 5.8
Redemption coverage (%) 18.7 ≥ 18.5 ~18.0 17.6
Overall, the development of the income situation in the year under review was in line with our adjusted expectations from July 2018. As a result of the declined development in the first halfyear of 2018, we had withdrawn our expectations for the operating profit. Accordingly, the expectations regarding ROCE and redemption coverage were also adjusted.
√
Deutsche Bahn Group 2018 Integrated Report
100

Revenues (€ million) 2017
2018 (March
2018 forecast)
2018 (July 2018
forecast) 2018
DB Long-Distance 4,347 q q 4,682
DB Regional 8,734 q q 8,968
DB Arriva 5,345 q q 5,441
DB Cargo 4,528 q q 4,460
DB Schenker 16,430 q q 17,050
DB Netze Track 5,364 q q 5,511
DB Netze Stations 1,265 q q 1,314
DB Netze Energy 2,794 e w 2,850
q Above previous year’s figure e At previous yearʼs level w Below previous yearʼs figure
At the business unit level, revenue development in the year under review was largely in line with our forecast of July 2018.
◊ At DB Cargo performance was weaker than expected. Here the negative effects from operational problems and resource shortages made themselves known.
◊ DB Netze Energy exceeded revenue expectations as a result of price and performance factors. Business development with nonGroup customers was better than planned.
EBIT adjusted (€ million) 2017
2018 (March
2018 forecast)
2018 (July 2018
forecast) 2018
DB Long-Distance 381 q q 417
DB Regional 508 q e 492
DB Arriva 301 e e 300
DB Cargo – 90 q e – 190
DB Schenker 477 q q 503
DB Netze Track 687 q q 840
DB Netze Stations 233 w w 221
DB Netze Energy 72 w w 21
q Above previous year’s figure e At previous yearʼs level w Below previous yearʼs figure
The actual EBIT development for the individual business units during the year under review was largely in line with our forecasts of July 2018.
◊ At DB Regional performance was rather weaker than expected. Charges particularly arising from additional qualityimprovement measures could not be fully compensated.
◊ DB Cargo performed significantly more weakly than expected owing inter alia to the negative effects of operational problems and resource shortages.
Stable financial position
◊ Seven bond transactions in total (total volume about € 2.9 billion).
◊ Ratings stable.
slight rise in the interest level
Yield on ten-year German bunds (%) 2018 2017
Change (percentage
points)
Average yield + 0.46 + 0.38 + 0.08
Highest yield + 0.76 + 0.64 + 0.12
Lowest yield + 0.23 + 0.15 + 0.08
Year-end yield + 0.25 + 0.24 + 0.01
Source: Thomson Reuters
In the year under review, the yield from the tenyear German Federal bonds (bunds) increased slightly. Decisions by central banks and political developments, such as the challenges of forming a government in Italy or ongoing differences in international trading policy, had a substantial impact on the bond market. The yield gap between American and German government bonds significantly expanded over the course of the year. At 2.7 percentage points, the interest rate gap reached a 30year high. The context of this development is the differing directions of the European Central Bank (ECB) and the US Federal Reserve (Fed), the latter of which raised its base interest rate several times over the course of the year up to 2.5%. The ECB’s ongoing bondpurchase program, which had been running since March 2015, ended in December 2018 as scheduled.
Financial management stable
As of Dec 31 (€ billion)Volume
2018thereof utilized
Volume 2017
thereof utilized
European debt issuance program 25.0 20.1 25.0 19.3
Australian debt issuance program (AUD 5 billion) 3.1 0.7 3.4 0.5
Multi-currency commercial paper program 2.0 – 2.0 –
Guaranteed unutilized credit facilities 2.0 – 2.0 –
In addition to aiming for a sustained rise in enterprise value, DB Group’s financial management focuses on maintaining a capital structure that will ensure excellent credit ratings. The key indicators used for this purpose, redemption coverage and net debt/EBITDA are detailed in the value man-
agement µ103 f. section.
GR
OU
P M
AN
AG
EM
EN
T R
EP
OR
T
101
GROUP MANAGEMENT REPORT — BUsiNEss DEvElOPMENT
FiN
AN
CiA
l s
TA
TE
ME
NT
ss
Us
TA
iNA
Bil
iTY

DB AG contains DB Group’s Treasury center. This ensures that all Group companies are able to borrow and invest funds at optimal terms and conditions. Before obtaining funds from external sources, we first conduct intraGroup financing transactions. When borrowing external funds, DB AG takes out shortterm loans in its own name, whereas longterm capital is generally obtained through the Groupʼs financing company, DB Finance.
The funds are passed on to the Group companies as short term credit lines, which can be utilized as part of cash pooling on internal current accounts and/or through fixed shortterm credit or in the form of longterm loans. Advantages from this concept arise from the consolidation of our knowhow, realized synergy effects and minimized refinancing costs.
◊ A European debt issuance program (EDIP) for longterm debt financing is available. Under the EDIP, five bonds were issued in the year under review (total volume: about € 2.7 billion). Conversely, bonds with a total volume of € 1.9 billion were repaid. The utilization rate of the EDIP in this context increased slightly to 80% as of December 31, 2018 (as of December 31, 2017: 77%).
◊ We also have an Australian debt issuance program (Kangaroo Program). Under this program, one bond was issued and one bond from the previous year was increased (total volume: AUD 356 million (about € 0.2 billion)). The utilization rate of the Kangaroo Program increased as a result to 22% as of December 31, 2018 (as of December 31, 2017: 15%).
◊ In terms of shortterm external financing, a multicurrency commercial paper program remains available.
◊ As of December 31, 2018 we also had guaranteed unutilized credit facilities with a remaining term of between 1.0 and 2.0 years and another guaranteed unutilized credit facility of more than € 0.1 billion (as of December 31, 2017: € 0.1 billion).
◊ In addition, we were able to rely on credit lines of € 2.5 billion for the operating business (as of December 31, 2017: € 2.2 billion). These credit lines, which are made available to our subsidiaries around the world, include provisions for financing working capital as well as sureties for payment.
No major finance lease transactions were concluded in the year under review. The finance lease volumes rose primarily as a result of taking on existing finance lease contracts for buses (€ 51 million) following the acquisition of
vT-Arriva µ129, an early contract extension (€ 41 million) and a re classification of two rental properties as part of ex tending a contract (€ 38 million), to € 562 million (as of De cember 31, 2017: € 501 million). In contrast, financing volumes de creased as scheduled through repayment.
In order to finance regional rail passenger transport vehicles, we entered into a sale and leaseback agreement for 20 new multiple units from Alstom for the Ulm diesel network. The lease contract begins on December 13, 2020 and has a calculated duration up to December 10, 2044. DB Regional is the lessee for the first transport contract period of at least 12 years with a nominal leasing volume of
€ 59 million. The public transport authorities are the Bayerische Eisenbahngesellschaft mbH (BEG) and the Baden Württemberg regional government. The financing is secured through a reuse guarantee by the BEG and an assignment of receivables from the public transport authorities in the absence of fulfillment, with defense or objection waived.
seven bond transactions carried out
ISIN IssuerCur-
rency
Volume (mil- lion)
Volume (€ mil-
lion)Coupon
(%)Matu-
rityTerm
(years)
XS1752475720DB
Finance EUR 1,000 1,000 1.000Dec
2027 9.9
XS1772374770DB
Finance EUR 750 750 1.625Aug
2033 15.5
AU3CB0248250 1)DB
Finance AUD 150 95 4.050Oct
2032 14.6
AU3CB0253623DB
Finance AUD 206 133 3.494Jun
2028 10.0
CH0423233557DB
Finance CHF 400 346 0.500Jul
2028 10.0
XS1885608817DB
Finance EUR 500 500 1.375Mar
2031 12.5
XS1910864492DB
Finance EUR 125 125 1.850Nov
2043 25.0
1) Increase of an existing bond.
Through the DB Group financing company, DB Finance, we issued six new bonds and increased an existing bond in the year under review. The equivalent value of the transactions was about € 2.9 billion. The funds were raised to refinance liabilities falling due and for ongoing general Group financing. All proceeds of bonds not issued in euros were converted into euros. In addition to European investors, almost a fifth of demand was from Asian investors.
!!!
Deutsche Bahn Group 2018 Integrated Report
102
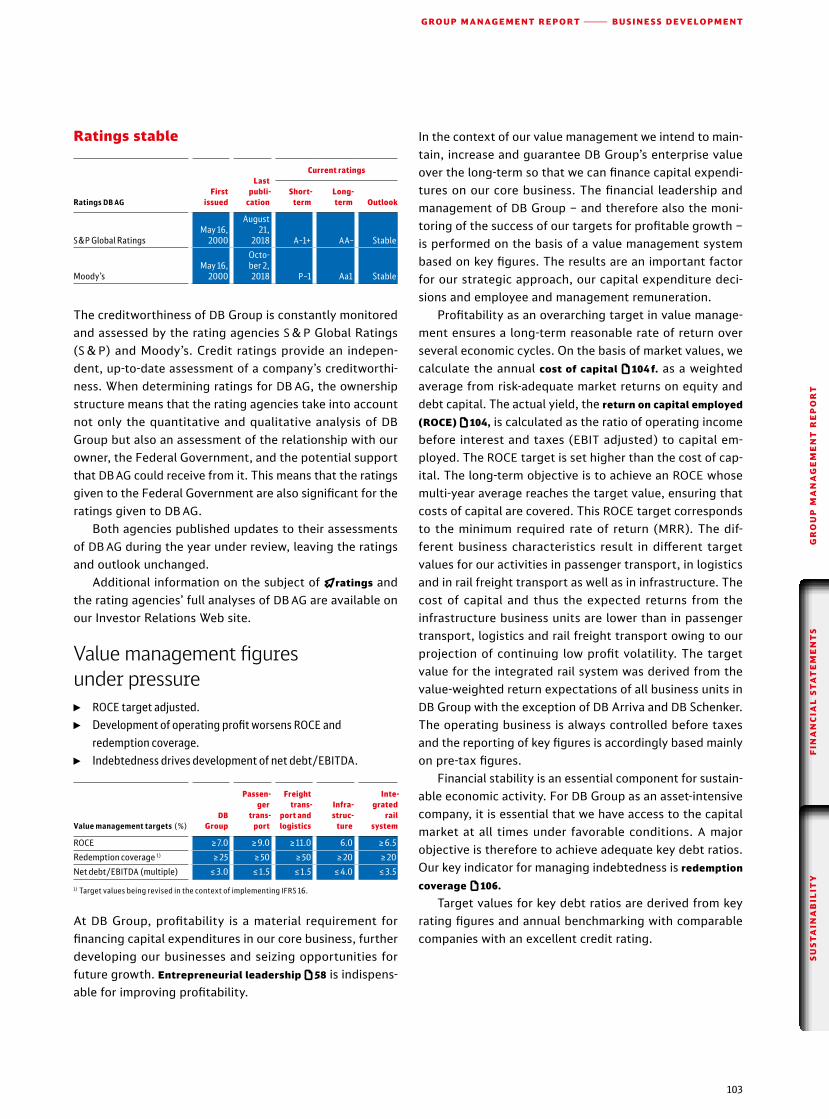
Value management figures under pressure
◊ ROCE target adjusted. ◊ Development of operating profit worsens ROCE and
redemption coverage. ◊ Indebtedness drives development of net debt/EBITDA.
Value management targets (%)DB
Group
Passen- ger
trans- port
Freight trans-
port and logistics
Infra- struc-
ture
Inte- grated
rail system
ROCE ≥ 7.0 ≥ 9.0 ≥ 11.0 6.0 ≥ 6.5
Redemption coverage 1) ≥ 25 ≥ 50 ≥ 50 ≥ 20 ≥ 20
Net debt/EBITDA (multiple) ≤ 3.0 ≤ 1.5 ≤ 1.5 ≤ 4.0 ≤ 3.5
1) Target values being revised in the context of implementing IFRS 16.
At DB Group, profitability is a material requirement for financing capital expenditures in our core business, further developing our businesses and seizing opportunities for future growth. Entrepreneurial leadership µ58 is indispensable for improving profitability.
In the context of our value management we intend to maintain, increase and guarantee DB Groupʼs enterprise value over the longterm so that we can finance capital expenditures on our core business. The financial leadership and management of DB Group – and therefore also the monitoring of the success of our targets for profitable growth – is performed on the basis of a value management system based on key figures. The results are an important factor for our strategic approach, our capital expenditure decisions and employee and management remuneration.
Profitability as an overarching target in value management ensures a longterm reasonable rate of return over several economic cycles. On the basis of market values, we calculate the annual cost of capital µ104 f. as a weighted average from riskadequate market returns on equity and debt capital. The actual yield, the return on capital employed
(ROCE) µ104, is calculated as the ratio of operating income before interest and taxes (EBIT adjusted) to capital em ployed. The ROCE target is set higher than the cost of capital. The longterm objective is to achieve an ROCE whose multiyear average reaches the target value, ensuring that costs of capital are covered. This ROCE target corresponds to the minimum required rate of return (MRR). The different business characteristics result in different target values for our activities in passenger transport, in logistics and in rail freight transport as well as in infrastructure. The cost of capital and thus the expected returns from the infrastructure business units are lower than in passenger transport, logistics and rail freight transport owing to our projection of continuing low profit volatility. The target value for the integrated rail system was derived from the valueweighted return expectations of all business units in DB Group with the exception of DB Arriva and DB Schenker. The operating business is always controlled before taxes and the reporting of key figures is accordingly based mainly on pretax figures.
Financial stability is an essential component for sustainable economic activity. For DB Group as an assetintensive company, it is essential that we have access to the capital market at all times under favorable conditions. A major objective is therefore to achieve adequate key debt ratios. Our key indicator for managing indebtedness is redemption
coverage µ106. Target values for key debt ratios are derived from key
rating figures and annual benchmarking with comparable companies with an excellent credit rating.
!!!
Ratings stable
Ratings DB AG
First issued
Last publi-
cation
Current ratings
Short- term
Long- term Outlook
S&P Global RatingsMay 16,
2000
August21,
2018 A–1+ AA– Stable
Moody’sMay 16,
2000
Octo- ber 2, 2018 P–1 Aa1 Stable
The creditworthiness of DB Group is constantly monitored and assessed by the rating agencies S&P Global Ratings (S&P) and Moody’s. Credit ratings provide an independent, uptodate assessment of a companyʼs creditworthiness. When determining ratings for DB AG, the ownership structure means that the rating agencies take into account not only the quantitative and qualitative analysis of DB Group but also an assessment of the relationship with our owner, the Federal Government, and the potential support that DB AG could receive from it. This means that the ratings given to the Federal Government are also significant for the ratings given to DB AG.
Both agencies published updates to their assessments of DB AG during the year under review, leaving the ratings and outlook unchanged.
Additional information on the subject of Œratings and the rating agencies’ full analyses of DB AG are available on our Investor Relations Web site.
GR
OU
P M
AN
AG
EM
EN
T R
EP
OR
T
103
GROUP MANAGEMENT REPORT — BUsiNEss DEvElOPMENT
FiN
AN
CiA
l s
TA
TE
ME
NT
ss
Us
TA
iNA
Bil
iTY

Gearing is by now only of secondary importance for the value management of DB Group and will therefore no longer be reported.
ROCE weaker
ROCE 2018 2017
Change
absolute %
EBIT adjusted (€ million) 2,111 2,152 – 41 – 1.9
Capital employed as of Dec 31 (€ million) 36,657 35,093 + 1,564 + 4.5
ROCE (%) 5.8 6.1 – –
ROCE worsened by 0.3 percentage points as a result of the slight decrease of adjusted EBIT coupled with a simultaneous growth of capital employed.
ROCE (%)
Target: ≥ 7.0
2018 ◊ 5.8
2017 ◊ 6.1
2016 ◊ 5.9
2015 ◊ 5.3
2014 ◊ 6.3
2013 ◊ 6.8
2012 ◊ 8.3
Rise in capital employed
Capital employed as of Dec 31 (€ million) 2018 2017
Change
absolute %
BA SED ON A S SET S
Property, plant and equipment 40,757 39,608 + 1,149 + 2.9
Intangible assets/goodwill 3,730 3,599 + 131 + 3.6
Inventories 1,369 1,151 + 218 + 18.9
Trade receivables 4,962 4,571 + 391 + 8.6
Receivables and other assets 2,250 1,922 + 328 + 17.1
Receivables from financing – 174 – 131 – 43 + 32.8
Income tax receivables 62 52 + 10 + 19.2
Assets held for sale 26 0 + 26 –
Trade liabilities – 5,491 – 5,157 – 334 + 6.5
Miscellaneous and other liabilities – 3,918 – 3,632 – 286 + 7.9
Income tax liabilities – 195 – 150 – 45 + 30.0
Other provisions – 5,068 – 5,117 + 49 – 1.0
Deferred items – 1,648 – 1,623 – 25 + 1.5
Assets held for sale – 5 – – 5 –
Capital employed 36,657 35,093 + 1,564 + 4.5
Capital employed equates to the assets deemed necessary for business and subject to the cost of capital, as derived from the balance sheet. The increase in capital employed resulted inter alia from an increase in the account balance of property, plant and equipment, for reasons including vehicle procurement and decrease of other provisions.
Cost of capital downThe cost of capital is updated annually to take account of changes in market parameters.
Cost of capital before taxes as of Dec 31 (%) 2018 2017
DB Group 6.8 7.0
Passenger transport 6.9 7.3
Freight transport and logistics 8.5 8.6
Infrastructure 5.8 6.0
Integrated rail system 6.0 6.6
Cost of capital after taxes as of Dec 31 (%) 2018 2017
DB Group 4.7 4.8
Passenger transport 4.8 5.1
Freight transport and logistics 5.9 6.0
Infrastructure 4.0 4.2
Integrated rail system 4.2 4.6
We calculate DB Groupʼs cost of capital as a weighted av erage interest rate of equity, net financial debt and pension obligations.
When determining the companyindependent capital market parameters, market risk premium and riskfree interest rate, shortterm fluctuations in debt and equity market returns are smoothed out in line with the longterm focus of our value management concept. The parameters are determined on the basis of the yields on longterm German bunds as well as the longterm average returns of the German DAX 30 equity index. The parameters used are also validated on the basis of uptodate recommendations of recognized valuation experts. The companydependent capital market parameters, beta and credit spread, measure the risk of our debt and equity financing in comparison with alternative forms of investment. Beta reflects the risk of equity capital relative to the risks of the equity markets. The determination is based on comparable international companies at business unit level. The credit spread corresponds to DB Groupʼs current issue costs relative to bonds with an imputed term of ten years. The credit spread for transport and logistics is determined in line with market conditions, using current capital market data.
√
Deutsche Bahn Group 2018 Integrated Report
104

Tax factors are calculated using a taxation rate of 30.5%. The tax factor for net financial debt reflects the trade tax applied to fixed debt interest to be credited. The taxes remaining after this are fully allocated to cost of equity. The weighting of forms of financing is based on market values. Net financial debt and pension obligations are valued at their carrying amounts. Equity weighting is based on recognized business valuation methods.
The weighting of forms of financing for passenger transport, rail freight transport, logistics, infrastructure and the integrated rail system corresponds to that of DB Group as the tax shield resulting from the taxdeductible status of debt interest arises, as a rule, from the fact that DB Group is a consolidated tax group.
ROCE still lower than the cost of capital
Yield spread (%) 2019 2018 2017 2016 2015
ROCE – 5.8 6.1 5.9 5.3
Pre-tax WACC 1) 6.8 7.0 7.3 7.7 8.4
Spread (percentage points) – –1.2 –1.2 –1.8 –3.1
1) Each value taken at the beginning of the year.
In the year under review, the negative difference between ROCE and costs of capital remained on the level of the previous year. The shortfall is mainly due to the lack of profitability of the RIC and of DB Cargo.
Capital market parameters
Market risk premium 6.0
Cost of capital Tax factor Cost of capital (WACC)
Unlevered
0.62 0.61 0.84 0.49 0.52
Levered
1.25 1.24 1.69 0.98 1.05
Equity
9.0 8.9 11.7 7.4 7.8
1.44 1.44 1.44 1.44 1.44
Beta Equity
13.0 12.9 16.8 10.6 11.2
Risk-free interest 1.5
Weighting 1) 41.4 Pre- tax WACC
6.8 6.9 8.5 5.8 6.0
Credit spread
0.80 1.10 1.10 0.80 0.80
Debt capital
2.3 2.6 2.6 2.3 2.3
1.03 1.04 1.04 1.03 1.03
Tax shield 100 – 30.5
Weighting 1) 48.9
After- tax WACC
4.7 4.8 5.9 4.0 4.2
1.00 1.00 1.00 1.00 1.00
Weighting 1) 9.8
D E T E R M I N I N G C O S T O F C A P I TA L
DB Group Passenger transport Freight transport and logistics Infrastructure Integrated rail system1) Impact of capital structure is reflected only in the tax shield; because DB Group is a consolidated tax group the capital structure of DB Group is used.
Individual figures are rounded and therefore may not add up.
As of December 31, 2018 (%).
Net financial debt
2.4 2.7 2.7 2.4 2.4
Pension obliga- tions
2.3 2.6 2.6 2.3 2.3
GR
OU
P M
AN
AG
EM
EN
T R
EP
OR
T
105
GROUP MANAGEMENT REPORT — BUsiNEss DEvElOPMENT
FiN
AN
CiA
l s
TA
TE
ME
NT
ss
Us
TA
iNA
Bil
iTY

Key debt ratios worsenedRedemption coverage lower
Redemption coverage (€ million) 2018 2017
Change
absolute %
EBITDA adjusted 4,739 4,930 – 191 – 3.9
Net operating interest – 618 – 682 + 64 – 9.4
Depreciable portion of lease rates 1,114 1,079 + 35 + 3.2
Actual taxes on income – 192 – 180 – 12 + 6.7
Operating cash flow after taxes 5,043 5,147 – 104 – 2.0
Net financial debt as of Dec 31 19,549 18,623 + 926 + 5.0
Present value of operating leases as of Dec 31 4,245 4,934 – 689 – 14.0
Adjusted net financial debt as of Dec 31 23,794 23,557 + 237 + 1.0
Pension obligations as of Dec 31 4,823 3,940 + 883 +22.4
Adjusted net debt as of Dec 31 28,617 27,497 +1,120 + 4.1
Redemption coverage (%) 17.6 18.7 – –
Redemption coverage as of December 31, 2018 has de creased. Adjusted net debt has increased as a result of an increase in net financial debts and the pension obligations. At the same time, the adjusted operating cash flow after taxes decreased due to the profit development.
Redemption coverage (%)
Target: ≥ 25
2018 ◊ 17.6
2017 ◊ 18.7
2016 ◊ 18.1
2015 ◊ 19.0
2014 ◊ 20.3
2013 ◊ 20.8
2012 ◊ 22.2
Deterioration in net debt/EBiTDA
Net debt/EBITDA (€ million) 2018 2017
Change
absolute %
Net financial debt as of Dec 31 19,549 18,623 + 926 + 5.0
Present value of operating leases as of Dec 31 4,245 4,934 – 689 – 14.0
Adjusted net financial debt as of Dec 31 23,794 23,557 + 237 + 1.0
Pension obligations as of Dec 31 4,823 3,940 + 883 +22.4
Adjusted net debt as of Dec 31 28,617 27,497 +1,120 + 4.1
EBITDA 4,739 4,930 – 191 – 3.9
Lease rate 1,257 1,236 +21 +1.7
EBITDA (IFRS 16) 1) 5,996 6,166 –170 –2.8
Net debt/EBITDA (multiple) 4.8 4.5 – –
1) Adjusted for proportional leasing expense of the present value of the operating leases.
From the year under review, the key indicator net debt/EBITDA began taking into account the effects of iFRs 16
µ189, which is obligatory from the 2019 financial year. In addition, the key indicator impacts more strongly on the grading of the rating agencies, as it now includes pension obligations. The key indicator net debt/EBITDA worsened in the year under review as a result of the increase of net financial debts and the pension obligations coupled with a simultaneous decrease in adjusted EBITDA.
Net debt/EBITDA (multiple)
Target: ≤ 3.0
2018 ◊ 4.8
2017 ◊ 4.5
2016 ◊ 4.6
2015 ◊ 4.3
2014 ◊ 4.0
2013 ◊ 3.9
2012 ◊ 3.7
Cash and cash equivalents slightly increased
Summary statement of cash flows (€ million) 2018 2017
Change
absolute %
Cash flow from operating activities 3,371 2,329 + 1,042 + 44.7
Cash flow from investing activities – 3,668 – 3,569 – 99 + 2.8
Cash flow from financing activities 449 239 + 210 + 87.9
Net change in cash and cash equivalents 147 – 1,053 + 1,200 –
Cash and cash equivalents as of Dec 31 3,544 3,397 + 147 + 4.3
◊ A key reason for the significant increase in cash flow from operating activities was the positive working capital effects (primarily higher inventories, particularly in maintenance, as required for performance) and the non recurrence of the oneoff effect of the payment connected with the Disposal Fund Act (2017 integrated Report
µ145) in the previous year. This was also supported by the effects of the positive development of profit before taxes, depreciation and interest (€ +99 million).
◊ Cash outflow from capital expenditure activities continued to increase at a high level. This was essentially the result of higher payments for net capital expenditures (€ +233 million), in connection with ICE 4 and IC 2 trains, inter alia. The cash outflow for repayment of investment grants decreased on the other hand (€ –24 million).
√
√
√
Deutsche Bahn Group 2018 Integrated Report
106

An increased cash inflow from sale of real estate and the nonrecurrence of the cash outflow for the purchase of the Autotrans Group (2017 integrated Report µ115) in the previous year had a compensating effect.
◊ Cash flow from financing activities increased markedly. The development was primarily driven by the higher net cash inflow from issuing and redemption of bonds µ102 (€ +808 million). The issuing activity was as such much higher than in the previous year. At the same time, the net cash inflow from the taking on and redemption of borrowings (€ +240 million) in creased, particularly as a result of declined redemption payments. In addition, there was a positive effect from the reduction of the dividend payment to a lower cash outflow (€ –150 million). These effects were widely compensated by the nonrecurrence of cash inflow from the capital increase carried out in the previous year (€ –1,000 million).
◊ As of December 31, 2018, DB Group held a slightly higher account balance of cash and cash equivalents in comparison to the end of the previous year.
!!!
Asset situation stable
◊ Rise in net financial debt partly due to capital expenditures.
◊ Capital expenditures in infrastructure particularly drive the increase in capital expenditures.
◊ Equity ratio decreased.
Net financial debt increased
Net financial debt as of Dec 31 (€ million) 2018 2017
Change
absolute %
Interest-free loans 851 1,014 – 163 – 16.1
Finance lease liabilities 562 501 + 61 + 12.2
Other financial debt 21,831 20,561 + 1,270 + 6.2
thereof bonds 20,712 19,616 + 1,096 + 5.6
Financial debt 23,244 22,076 + 1,168 + 5.3
Cash and cash equivalents and receivables from financing – 3,718 – 3,528 – 190 + 5.4
Effects from currency hedges 23 75 – 52 – 69.3
Net financial debt 19,549 18,623 + 926 + 5.0
Net financial debt rose significantly as of December 31, 2018. This resulted mainly from higher capital requirements for capital expenditures and working capital.
◊ Financial debt increased noticeably: ◊ Interestfree loans were reduced by redemptions.
◊ Finance lease liabilities µ217 increased as a result of acquisitions and as a consequence of changes in two rental properties. The impact was dampened by consistent redemption, amongst others factors.
◊ The key factor was that the euro value of the outstand ing bonds µ215 increased significantly because of the new issues. Exchange rate effects did not play a significant role in development as a result of hedging transactions.
◊ The effects of currency hedges, which are based on the hedged exchange rate at the time of issue, increased debt (as of December 31, 2017: increased debt) but were, however, not significant. Since our foreign currencydenominated bonds are, with very few exceptions, hedged against currency fluctuations by corresponding derivatives, exchange rate effects are offset by the correspond ing opposite position of the hedge.
◊ Cash and cash equivalents increased slightly and to an extent balanced out the increase in financial debt.
Net financial debt as of Dec 31 (€ billion)
2018 ◊ 19.5
2017 ◊ 18.6
2016 ◊ 17.6
2015 ◊ 17.5
2014 ◊ 16.2
2013 ◊ 16.4
2012 ◊ 16.4
Maturity structure of financial debt as of Dec 31 (%) 2018 / 2017
Composition of financial debt as of Dec 31 (%) 2018 / 2017
More than 5 years 51 / 49
Up to 1 year 11 / 11
1 to 2 years 10 / 10
2 to 3 years 10 / 10
3 to 4 years 9 / 10
4 to 5 years 9 / 10
Bonds 89 / 89
Interest-free loans 4 / 5
Finance lease liabilities 2 / 2
Bank borrowings/other 4 / 3EUROFIMA loan 1 / 1
GR
OU
P M
AN
AG
EM
EN
T R
EP
OR
T
107
GROUP MANAGEMENT REPORT — BUsiNEss DEvElOPMENT
FiN
AN
CiA
l s
TA
TE
ME
NT
ss
Us
TA
iNA
Bil
iTY

The maturity structure and composition of financial debt were largely unchanged as of December 31, 2018.
Capital expenditures increased significantly
Capital expenditures (€ million) 2018 2017
Change
absolute %
Gross capital expenditures 11,205 10,464 + 741 + 7.1
Investment grants 7,209 6,724 + 485 + 7.2
Net capital expenditures 3,996 3,740 + 256 + 6.8
The increase in gross capital expenditures was mainly due to expenditures on track infrastructure and vehicles. In ad di tion, extensions to rental agreements, which are valued as fi nance leases, had the effect of increasing capital expenditures.
Investment grants also increased significantly. They are unchanged at about 64% of gross capital expenditures (previous year: 64%).
The increase in net capital expenditures was largely driven by DB Cargo (primarily procurement of locomotives and freight cars and capitalization of selfgenerated software) and the Other division (primarily extensions to rental agreements). At DB LongDistance, capital expenditures increased slightly at a high level because of further additions of ICE 4 and IC 2 trains. By contrast, net capital expenditures at DB Regional and DB Netze Track in particular decreased.
Gross capital expenditures by divisions (%) 2018 / 2017
Our capital expenditure activities focused especially on measures to improve performance and efficiency in the area of track infrastructure and the rejuvenation of our vehicle fleet. The structure of gross capital expenditures shifted primarily because of larger capital expenditures in locomotives at DB Cargo, slightly in favor of the area of Freight Transport and Logistics.
Capital expenditure priorities unchanged in Germany
Gross capital expenditures by regions (€ million) 2018 2017
Change
absolute %
Germany 10,682 9,906 + 776 + 7.8
Europe (excluding Germany) 506 546 – 40 – 7.3
Asia/Pacific 79 61 + 18 + 29.5
North America 16 9 + 7 + 77.8
Rest of world 5 5 – –
Consolidation – 83 – 63 – 20 + 31.7
DB Group 11,205 10,464 + 741 + 7.1
Net capital expenditures by regions (€ million) 2018 2017
Change
absolute %
Germany 3,487 3,184 + 303 + 9.5
Europe (excluding Germany) 492 544 – 52 – 9.6
Asia/Pacific 79 61 + 18 + 29.5
North America 16 9 + 7 + 77.8
Rest of world 5 5 – –
Consolidation – 83 – 63 – 20 + 31.7
DB Group 3,996 3,740 + 256 + 6.8
In the regional breakdown of gross capital expenditures, the focus remained on Germany. Here the increase can be ex plained particularly by procurement of freight cars at DB Cargo (€ +259 million) and infrastructure measures at DB Netze Track and DB Netze Stations.
In Europe (excluding Germany) capital expenditures de creased. Here, lower capital expenditures at DB Arriva in Great Britain and Denmark in particular had an impact. In contrast, capital expenditures by DB Arriva in the Netherlands increased, amongst others. In the Asia/Pacific region, DB Schenker increased its capital expenditures in logistical facilities in the United Arab Emirates.
Gross capital expenditures by regions in % 2018 / 2017
investment grants primarily for infrastructureOf the investment grants received by DB Group in the year under review (€ 7,209 million), almost all of them (€ 7,178 million) related to infrastructure. The most important financing sources for infrastructure capital expenditures are grants, mostly from the Federal Government, the Federal states and local authorities.
2031
GRI
Infrastructure 71 / 72
Passenger transport 17 / 20
Other/ consolidation 4 / 3
Freight transport and logistics 8 / 5
√
√
Germany 95 / 95
Other 5 / 5
Deutsche Bahn Group 2018 Integrated Report
108

Most of these are based on the LuFV µ234 f. and the Federal Rail Infrastructure Extension Act (Bundesschienenwegeausbaugesetz; BSWAG). Further investment grants were provided as a result of the Municipal Transport Financing Act (Gemeindeverkehrsfinanzierungsgesetz; GVFG), the
noise remediation program of the Federal Government µ92 and as part of the ZIP µ147. The European Union allocates grants (TransEuropean Networks; TEN and Connecting Europe Facility; CEF) for infrastructure capital expenditures on TEN.
In addition to investment grants, DB Group also receives (significantly lower) grants recognized as income, mainly also in respect of infrastructure.
On the balance sheet, investment grants are directly deducted from the cost of purchase and cost of production
µ202 of the assets to which they relate. The recognition of all grants is such that the responsible Federal agencies can conduct comprehensive checks to ensure that they are spent in accordance with their purpose and the law.
A transparent description of the various Œforms of grants is available online.
!!!
Individual figures are rounded and therefore may not add up.1) Includes projects of the requirement plan.2) New and expansion projects may also include replacement capital expenditures within the framework of existing network measures.
I N F R A S T R U C T U R E G R A N T S A N D C A P I TA L E X P E N D I T U R E S (€ B I L L I O N )
Grants recognized as income 0.3 / 0.2
82 % / 81 % 12 % / 13% 6% / 4% < 1 % / 2 %
Federal Government 5.9 / 5.4
◊ LuFV 3.9
◊ BSWAG 1.5
◊ ZIP 0.3
◊ Noise reduction 0.1
◊ GVFG 0.1
◊ GVFG 0.3
◊ Stuttgart 21/ Wendlingen — Ulm 0.1
◊ Other 0.5
Federal states/ local authorities 0.9 / 0.9
◊ CEF 0.4
◊ TEN < 0.1
EU 0.4 / 0.3
◊ Other < 0.1
Other 0.1 / 0.1
Other 0.2 / 0.2
◊ Level crossings 0.1
◊ Other 0.2DB funds 0.8 / 0.8
◊ DB Netze Track 0.6
◊ DB Netze Stations 0.2
◊ DB Netze Energy < 0.1
Investment grants 7.2 / 6.7
◊ DB Netze Track 6.3
◊ DB Netze Stations 0.7
◊ DB Netze Energy 0.1
Grants 7.5 / 6.9
Existing network 2) 5.7 / 5.2
◊ Superstructure 1.5
◊ Bridges 0.9
◊ Stations 0.8
◊ Tunnels 0.6
◊ Command and control technology 0.6
◊ Other 1.3
Expansion/new construction lines 1) 2.1 / 2.1
◊ Wendlingen —Ulm 0.6
◊ German unification transport projects no. 8.1 0.2
◊ Stuttgart 21 0.1
◊ Munich — Lindau 0.1
◊ Other projects < € 0.1 billion 1.1
0.2 0.1 0.5 4.2 0.81.6 0.1 0.1 < 0.1
Infrastructure capital expenditures 8.0 / 7.5
0.3 < 0.1
◊ Vehicles, facility infrastructure, etc. 0.2
2018 / 2017
GR
OU
P M
AN
AG
EM
EN
T R
EP
OR
T
109
GROUP MANAGEMENT REPORT — BUsINEss dEVELOPMENT
FIN
AN
CIA
L s
TA
TE
ME
NT
ss
Us
TA
INA
BIL
ITY

Equity ratio decreased
Balance sheet as of Dec 31 (€ million) 2018 2017
Change
absolute %
Total assets 58,527 56,436 + 2,091 + 3.7
A S SET S
Non-current assets 46,646 45,625 + 1,021 + 2.2
Current assets 11,881 10,811 + 1,070 + 9.9
EQ UIT Y AND LIABILITIE S
Equity 13,592 14,238 – 646 – 4.5
Non-current liabilities 29,104 27,510 + 1,594 + 5.8
Current liabilities 15,831 14,688 + 1,143 + 7.8
Balance sheet structure as of Dec 31 (%) 2018 / 2017
There were no material changes to IFRS regulations for DB Group’s consolidation and accounting principles that would result in any changes to the consolidated financial statements. The exercise of balance sheet voting rights is ex plained in the Notes to the consolidated financial statements.
The balance sheet total rose slightly. ◊ Noncurrent assets increased. Here, property, plant
and equipment was particularly important (€ +1,149 million). The main factor here was vehicle acquisitions at DB LongDistance and DB Cargo, supported by the increase in intangible assets (€ +131 million) as a result of capitalization of selfgenerated software and higher other noncurrent claims and assets (€ +78 million), including for service concessions, inter alia. In contrast, active deferred taxes particularly decreased (€ –384 million), primarily as a result of lower expected taxable income of DB AG.
◊ Current assets increased significantly. The key factors were the increase in trade receivables (€ +391 million) and the increase in other current receivables and assets (€ +250 million), mostly due to balancesheetdaterelated factors. In addition, inventories (€ +218 million) increased, primarily for maintenance, as did cash and cash equivalents (€ +147 million).
Structurally, on the asset side there was a slight shift in favor of current assets.
Equity ratio as of Dec 31 (%)
2018 ◊ 23.2
2017 ◊ 25.2
2016 ◊ 22.5
2015 ◊ 24.0
2014 ◊ 26.0
2013 ◊ 28.2
2012 ◊ 28.5
On the equity and liabilities side, equity decreased significantly. The key factors included the reduction, related to in terest amongst other factors, in the changes recognized in the reserves in connection with the revaluation of pensions (€ –778 million) and the dividend payment to the Federal Government (€ –450 million). There was an opposite effect primarily from the net profit for the year generated (€ +542 million).
The decrease in equity coupled with an increased balance sheet total led to a reduction in the equity ratio.
◊ Noncurrent debt capital increased significantly, owing principally to:
◊ higher noncurrent financial debt µ107 (€ +910 million),
◊ an increase in pension obligations (€ +883 million), mainly as a result of a declined interest rate for re val uation, and
◊ the decrease of other noncurrent provisions (€ –128 million) as a result of liabilities that will now become due in the shortterm had an opposite effect.
◊ Current liabilities also increased. This was primarily the result of the following:
◊ higher trade liabilities (€ +334 million) because of balancesheetdaterelated and other factors at DB Schenker,
◊ increased other current liabilities (€ +261 million), primarily as a result of higher obligations from collectively agreed wages,
◊ higher current financial debt (€ +258 million) primarily as a result of an increase in bank borrowings and bonds falling due in the short term, and
◊ increased current deferred items (€ +183 million).Within the structure of the equity and liabilities side, the ratio of noncurrent and current liabilities to the balance sheet total slightly increased accordingly.
Off-balance-sheet financial instruments and unrecognized assetsIn addition to the assets shown in the consolidated balance sheet, DB Group also uses offbalancesheet financial instruments and assets that cannot be recognized in the balance sheet.
1027
GRI
Non-current assets
79.7 / 80.8
Current assets 20.3 / 19.2
Equity 23.2 / 25.2
Current liabilities 27.1 / 26.0
Non-current liabilities 49.7 / 48.8
Assets Equity and liabilities
Deutsche Bahn Group 2018 Integrated Report
110

Most of the offbalancesheet financial instruments are leased or rented items (operating leases) for which a present value is determined (as of December 31, 2018: € 4,245 million; as of December 31, 2017: € 4,934 million). The decrease was operationally driven by the expiry of existing contracts, primarily at DB Arriva. There was also a significant impact from the implementation in anticipation of changes in accordance with iFRs 16 µ189. In accordance with this, contracts whose usage period begins in the future will no longer be included in the calculation of operating leases present value, in order to ensure that purchasing and leasing transactions are presented equally in the balance sheet.
In addition, we used factoring to sell smaller volumes of receivables (as of December 31, 2018: € 686 million; as of December 31, 2017: € 500 million).
With regard to the company pension scheme for em ployees, the obligations under each retirement scheme are, to some extent, covered and netted by plan assets which are capable of being netted. As of December 31, 2018, total obligations amounted to € 10,635 million (as of December 31, 2017: € 10,538 million) and the fair value of plan assets was € 4,766 million (as of December 31, 2017: € 5,298 million). The balancing process leads to a reduction in the balance sheet total. The net obligation recognized on the balance sheet was € 4,823 million (as of December 31, 2017: € 3,940 million). No substantial endowments were made in the year under review that would have had a significant impact on the financial position. Further information µ188 f.
Purchasing volume increasedThe purchasing volume corresponds to the contractualobligations to suppliers that DB Group has entered into. On subsequent realization these become capital expenditures or expenses (mainly cost of materials and other operating expenses). The total purchasing volume was € 34.7 billion (previous year: € 30.3 billion).
◊ Freight and freightforwarding services were € 10.8 billion, nearly in line with that of the previous year (previous year: € 10.4 billion).
◊ Industrial products increased significantly to € 9.2 billion (previous year: € 6.7 billion). Here, the further procurement of ICE 4 trains, locomotives and freight cars had a significant impact, along with an increased requirement for replacement parts.
◊ Construction and engineering services also rose signi ficantly to € 6.4 billion (previous year: € 5.6 billion). In ad dition to price effects, the development was driven above all through the first service being awarded for the major project’s second main line in Munich
(2. Stamm strecke München) along with the conclusionof German unification transport pro jects no. 8 (VDE 8).
◊ Thirdparty services increased to € 5.4 billion (previous year: € 4.8 billion). As a result of the digitalization initiatives, the requirements for IT services, amongst others, increased.
◊ Cable and pipebound power and fuel rose slightly to
€ 3.1 billion (previous year: € 2.8 billion).
Purchasing volume structure (%) 2018 / 2017
The share of local purchasing volume in Germany was about € 16.3 billion.
(€ million) 2018 2017 2016
Purchasing volume 1) 18,358 15,920 17,820
Share of local purchasing volume (%) 92 90 93
1) Not including DB Schenker, DB Arriva and foreign companies of DB Cargo.
slight deviations from the projected financial position and asset situation
Outlook for 2018 financial year (€ billion) 2017
2018 (March
2018 forecast)
2018 (July 2018
forecast) 2018
Gross capital expenditures 10.5 >12 ~12 11.2
Net capital expenditures 3.7 > 4.5 ~4.5 4.0
Maturities 2.1 2.2 2.2 2.2
Bond issues 2.0 ≤ 3.0 3 2.9
Cash and cash equivalents as of Dec 31 3.4 ~3 ~3 3.5
Net financial debt as of Dec 31 18.6 ≤ 20 ≤ 20 19.5
Capital expenditures were slightly lower than forecasted. In particular, vehicle capital expenditures at DB Regional and DB LongDistance were not as high as expected, re sult ing in rather lower net capital expenditures than forecast.
With respect to DB Groupʼs financial position, actual developments in the year under review corresponded with our forecast for maturities and bond issues.
The account balance of cash and cash equivalents at yearend 2018 developed slightly better than expected as a result of lower than expected capital expenditures.
Net financial debt developed slightly better than expected.
!!!
1029
GRI
Cable- and pipe-bound power and fuel
9 / 9Third-party services 16 / 16
Industrial products 26 / 22
Construction and engineering services 18 / 19
Freight and freight- forwarding services
31 / 34
GROUP MANAGEMENT REPORT — BUsiNEss DEvElOPMENT
111

Passenger transport
Development in the German and European passenger
transport market µ59 was differentiated in 2018.
German market with stable development ◊ Based on our own estimations, volume sold in mo
torized private transport remained slightly below the previous year’s level:
◊ Positive effects from a stable labor market and greater levels of disposable income were not sufficient to offset the negative development caused by the sharp rise in fuel prices.
◊ Market share fell slightly. ◊ Volume sold in rail passenger transport rose signifi
cantly once more: ◊ Regional and longdistance rail passenger trans
port benefited from favorable income and em ployment situations as well as the sharp rise in fuel prices. The demand was also driven by restrictions in air transport.
◊ DB Group recorded a strong increase in volume sold, especially for DB LongDistance, as a result of the new highspeed line Berlin — Munich and measures to promote services. DB Regional maintained the same level of volume sold as the previous year.
◊ NonGroup railways only increased their volume sold slightly. In longdistance transport, demand rose moderately after FlixTrain took over the sale of Locomore services and Czech train operator Leo Express took over operations.
◊ The market share of rail passenger transport rose slightly.
◊ The volume sold in public road passenger transport stagnated:
◊ The number of passengers using longdistance bus transport rose moderately once again de spite a slight increase in fares. FlixBus remains the market leader with a market share of 90%.
◊ Local bus transport only benefited slightly from in creasing population and employment figures and only expanded its service offering moderately.
◊ DB Group public road passenger transport contracted slightly due to a decline in demand for rural bus transport and loss of tenders in North ern Germany.
◊ The market share of public road passenger transport remained stable.
◊ Volume sold in air transport fell slightly: ◊ Following the insolvency of Air Berlin during
the previous year, it was not possible for the Lufthansa Group or easyJet to take over all of the available slots at German airports.
◊ The market share remained unchanged.
Rail passenger transport and long-distance buses with significant growth in Europe
◊ European rail passenger transport grew considerably by about 2.0% in 2018. In addition to the major European railway countries, many smaller railways also increased their volume sold:
◊ In the Czech Republic, this was a result of continued supply and service improvements by the Czech stateowned railway CD and private providers RegioJet and Leo Express (+7.6%).
◊ In France, this was a result of recovering demand for the French stateowned railway SNCF thanks to the launch of new highspeed lines (+4.7%).
◊ In Italy, this was a result of increased punctuality and customer satisfaction in regional and longdistance transport services provided by the Italian stateowned railway FS (+2.6%).
◊ In Spain, this was a result of the largescale lowcost service EVA on highspeed lines and im provements to the quality of the Spanish stateowned railway RENFE (+2.4%).
◊ Estonia, Finland and Lithuania recorded strong growth with some areas reaching double digits.
Development of business units
112 Passenger transport 133 Freight transport and logistics
147 Infrastructure165 Subsidiaries/other
112
Deutsche Bahn Group 2018 Integrated Report

Revenues adjusted (€ million)
Total revenues Change External revenues Change
2018 2017 absolute % 2018 2017 absolute %
DB Long-Distance 4,682 4,347 + 335 + 7.7 4,528 4,193 + 335 + 8.0
DB Regional 8,968 8,734 + 234 + 2.7 8,862 8,629 + 233 + 2.7
DB Arriva 5,441 5,345 + 96 + 1.8 5,433 5,338 + 95 + 1.8
DB Cargo 4,460 4,528 – 68 – 1.5 4,177 4,209 – 32 – 0.8
DB Schenker 17,050 16,430 + 620 + 3.8 16,973 16,345 + 628 + 3.8
DB Netze Track 5,511 5,364 + 147 + 2.7 1,559 1,522 + 37 + 2.4
DB Netze Stations 1,314 1,265 + 49 + 3.9 569 540 + 29 + 5.4
DB Netze Energy 2,850 2,794 + 56 + 2.0 1,350 1,301 + 49 + 3.8
Other 4,990 4,854 + 136 + 2.8 573 627 – 54 – 8.6
Consolidation – 11,242 – 10,957 – 285 + 2.6 – – – –
DB Group 44,024 42,704 + 1,320 + 3.1 44,024 42,704 + 1,320 + 3.1
Operating profit figures (€ million)
EBITDA adjusted Change EBIT adjusted Change
2018 2017 absolute % 2018 2017 absolute %
DB Long-Distance 675 611 + 64 + 10.5 417 381 + 36 + 9.4
DB Regional 1,126 1,156 – 30 – 2.6 492 508 – 16 – 3.1
DB Arriva 575 569 + 6 + 1.1 300 301 – 1 – 0.3
DB Cargo 54 130 – 76 – 58.5 – 190 – 90 – 100 + 111
DB Schenker 703 676 + 27 + 4.0 503 477 + 26 + 5.5
DB Netze Track 1,446 1,484 – 38 – 2.6 840 687 + 153 + 22.3
DB Netze Stations 362 372 – 10 – 2.7 221 233 – 12 – 5.2
DB Netze Energy 87 141 – 54 – 38.3 21 72 – 51 – 70.8
Other/consolidation – 289 – 209 – 80 + 38.3 – 493 – 417 – 76 + 18.2
DB Group 4,739 4,930 – 191 – 3.9 2,111 2,152 – 41 – 1.9
Margin (%) 10.8 11.5 – – 4.8 5.0 – –
Capital expenditures (€ million)
Gross capital expenditures Change Net capital expenditures Change
2018 2017 absolute % 2018 2017 absolute %
DB Long-Distance 1,081 1,060 + 21 + 2.0 1,081 1,060 + 21 + 2.0
DB Regional 539 674 – 135 – 20.0 526 628 – 102 – 16.2
DB Arriva 326 374 – 48 – 12.8 312 372 – 60 – 16.1
DB Cargo 587 328 + 259 + 79.0 586 324 + 262 + 80.9
DB Schenker 273 246 + 27 + 11.0 273 246 + 27 + 11.0
DB Netze Track 6,901 6,601 + 300 + 4.5 564 660 – 96 – 14.5
DB Netze Stations 883 709 + 174 + 24.5 164 103 + 61 + 59.2
DB Netze Energy 187 177 + 10 + 5.6 65 53 + 12 + 22.6
Other/consolidation 428 295 + 133 + 45.1 425 294 + 131 + 44.6
DB Group 11,205 10,464 + 741 + 7.1 3,996 3,740 + 256 + 6.8
thereof investment grants 7,209 6,724 + 485 + 7.2 – – – –
√
√
√
O V E R V I E W O F B U S I N E S S U N I T S
113
Deutsche Bahn Group 2018 Integrated Report

◊ European longdistance bus transport grew moderately in 2018:
◊ The market leader FlixBus continued to drive development and increased its passenger numbers by about 50% on average in 28 countries. The most dynamic development was achieved in Luxembourg, Norway, Sweden, Poland and Portugal. Demand also grew considerably in Belgium, the Czech Republic, Croatia, Hungary and Spain.
◊ In response to the dominant position held by FlixBus, European longdistance bus operators (British National Express, French OUIBUS, Italian Marino Bus and Spanish ALSA) formed an alliance.
Order book in passenger transport declinedRevenues that are directly connected with transport contracts or concessions are either independent of (secured revenues, primarily concession fees) or dependent on (unsecured revenues, primarily revenues from fares) the number of passengers.
Order book in passenger transport as of Dec 31 (€ billion) 2018 2017
Change
absolute %
DB Regional 1) 70.9 72.2 –1.3 –1.8
secured 1) 52.7 50.2 +2.5 + 5.0
unsecured 1) 18.2 22.0 –3.8 –17.3
DB Arriva 20.1 22.7 –2.6 –11.5
secured 9.5 10.2 – 0.7 – 6.9
unsecured 10.6 12.5 –1.9 –15.2
Total 1) 91.0 94.9 –3.9 – 4.1
secured 1) 62.2 60.4 +1.8 + 3.0
unsecured 1) 28.8 34.5 – 5.7 –16.5
1) Previous year’s figure adjusted.
The order book declined during the year under review. Additions of about € 9.7 billion from the transport contracts awarded were offset by disposals (primarily due to services performed) of about € 12.3 billion and changes in assumptions of about € –1.3 billion (primarily due to exchange rate effects).
The secured revenues at DB Regional increased due to changes in the recognition of revenues from fares in gross contracts and the shift from unsecured to secured revenues as a result.
Order book in passenger transport by years as of Dec 31, 2018 (€ billion) secured / unsecured
2019 ◊ 7.9 / 4.8
2020 ◊ 7.2 / 3.9
2021 ◊ 6.7 / 3.5
2022 ◊ 6.2 / 3.1
2023 ◊ 5.5 / 2.9
2024 ◊ 4.7 / 2.6
2025 ◊ 4.1 / 1.8
2026 ◊ 3.6 / 1.4
2027 ◊ 3.0 / 1.3
2028 ◊ 2.7 / 0.9
until 2038 ◊ 10.5 / 2.5
Number of BahnCard holders down slightly compared to previous year
Number of BahnCards as of Dec 31 (thousand) 2018 2017
Change
2016absolute %
Total 5,254 5,368 –114 –2.1 4,974
The number of BahnCard holders has fallen slightly. This was driven by a decline in the number of BahnCard 25 holders following the previous year’s significant growth, which was the result of a promotional campaign for the 25th anniversary of BahnCard no. 2. The number of BahnCard 50 and BahnCard 100 holders continued to increase.
DB Long-Distance business unitBusiness modelDB LongDistance offers customers comfortable and environmentally friendly travel within Germany and into neighboring countries. Regular scheduled daily services with the ICE/IC/EC fleet form the backbone of longdistance transport. Offerings are being supplemented by island services to Sylt and Wangerooge. Longdistance bus services (IC Bus) provide an extension to the rail transport offering for domestic and international travel.
The important key performance figures are volume sold, volume produced and the load factor. The five top key figures used for monitoring are passenger growth, operating income (EBIT), employee satisfaction, punctuality and customer satisfaction.
The cost side largely correlates with the volume produced, which is derived from the schedule. Personnel and facility resource management is determined on the basis of the annual train schedule to optimize the unit cost per train kilometer traveled. The key drivers are personnel, maintenance and infrastructure expenses, the latter being very fixedcost intensive. Only a small portion of expenses vary with train capacity utilization.
114
Deutsche Bahn Group 2018 Integrated Report

The most important sources of income for commercially operating longdistance transport are revenues from the sale of tickets and BahnCards. Our employees, a modern vehicle fleet and a highquality infrastructure are key re sources. This is why intraGroup infrastructure companies and service providers as well as the vehicle industry are important partners. Furthermore, the cooperation with railways in countries bordering Germany is very important for crossborder connections.
Markets and strategyIn the year under review, we consistently pursued activities as part of the Railway of the Future program. We further sharpened our focus in 2018 by deriving a top project portfolio based on three guiding principles: “Connecting people, overcoming distances,” “Best possible journey – together with passion and excellence” and “Arriving by the time of boarding.” Our goal is to support our vision for more green mobility in Germany, to make our business more resilient to intermodal competition and to clearly focus on passenger satisfaction.
Customer campaign 2.0 is the basis for our activities. Once the network has been expanded in line with the targets, nearly all cities with a population of over 100,000 will be linked to longdistance transport. We are also creating more fast and direct daily connections between major German cities by strengthening the ICE network. So we want to expand the service offering by about 25% by 2030 and increase the number of passengers to 200 million per year.
In the year under review, DB LongDistance ordered more and longer ICE 4 trains, which increased the planned capital expenditures by € 700 million. Additional cars will be attached to the 50 trains that have already been ordered to make them 13 cars long and thereby increase the capacity to over 900 seats per train. An additional 18 trains will be ordered to expand the ICE 4 fleet to a total of 137 trains (with 7, 12 and 13 cars) by 2025 to form the backbone of the longdistance transport service offering. These measures enable us to create the conditions for greater reliability and a higher degree of traveling comfort.
!!! !!!!!!
Employees
About 16,500
Passengers
149 million (rail and bus)
Volume sold
43 billion pkm (rail) and 0.2 billion pkm (bus)
EBIT Æ
€ 417 million
Employee † satisfaction
SI of 3.5
Customer ¿ satisfaction
SI of 77
Punctuality ¿
74.9 %
Resources/inputs
D B L O N G - D I S TA N C E B U S I N E S S M O D E L
Customer segments
◊ Private customers
◊ Business customers
Networks and infrastructure
11 provisioning depots for IC/ICE
Value proposition
◊ DB Long-Distance offers easy, relaxed, reliable and environmentally friendly travel.
Customer access and retention
◊ Travel centers, agencies, ticket machines, online, call center, onboard sales
◊ BahnCard, BahnComfort and BahnBonus programs, apps
Key activities
Providing train and bus services
Looking after customers
Providing and maintaining vehicles
Services/outputs
Final energy consumption ¥
–29.3% compared to 2006 (specific)
Outcomes
Vehicles
274 ICE, 243 locomotives, 1,481 passenger cars
Additional production factors
143 million train-path kilometers, 2.7 million station stops, 2.4 billion kWh traction current, 11.5 million liters of diesel fuel
Planning networks and services
GR
OU
P M
AN
AG
EM
EN
T R
EP
OR
T
115
GROUP MANAGEMENT REPORT — DEvELOPMENT Of BUSiNESS UNiTS
fiN
AN
CiA
L S
TA
TE
ME
NT
SS
US
TA
iNA
BiL
iTY

◊ Economic ¿ dimension: DB LongDistance is pursuing the target of offering its customers highquality products and thereby achieving profitable growth. By 2020, we want our services to be recognized as the most reliable – both in terms of travel times and service. This is why we are implementing the Agenda for a Better Rail-
way µ66 ff. f Our aim is to significantly and sustainably en hance quality. For example, quality dialogues were systematically introduced at our facilities, logistics processes were optimized using lean management techniques and capacity was increased by using the tracks more efficiently. These and other measures will help improve maintenance as well as operational quality and travel comfort as a result. If major disruptions occur, efficient incident management should ensure that information is provided prompt ly for our passengers and that the appropriate measures are initiated. We are also working on en hancing our digital solutions. Digital innovations make it even easier to use our services and prepare us for growing intramodal and intermodal competition. Free WiFi on ICE trains com bined with the expanded ICE Portal further en hances the positive onboard travel experience and helps us to offer longdistance passengers the most relaxing mode of transport. Another example is our com fort checkin, which enables passengers to check into their own seat instead of having their tickets checked by a ticket inspector. We want to significantly enhance the personal experience of our guests on board and set new standards in line with our “Host of the future” guiding principle, as the above demonstrates.
◊ Social † dimension: Together, our DB LongDistance employees bear responsibility for an economically strong company that focuses on making sure that customers enjoy their travel experience. In order to keep our promises to our customers, we expect our em ployees to have a strong focus on customers and quality. One prerequisite for this is a solid cooperative spirit that can bring employees together and allow them to participate. This is why we are constantly working on im prov ing our employee satisfaction, for example by including our employees in the planning of specific working conditions, which also increases our employer attractiveness. Increasing employee satisfaction is also being examined in depth as part of its own dedicated top project called modern work environments.
◊ Environmental ¥ dimension: DB LongDistance has set a target of being considered by its customers as the most environmentally friendly provider by 2020. A central element of this target is transport with 100% eco-
power no. 1. In the year under review, we increased the proportion of journeys using ecopower from about 75% to 100%. Although our electric rail transport services are practically CO₂free as a result, we are still working on the energy efficiency of our services. New vehicles will support our efforts to achieve this target. ICE 4 consumes about 22% less energy per seat than a comparable ICE 1.
Development of our fleetVehicle availability under stress Vehicle availability in the year under review was under significant stress, which was the result of both the huge increase in units being out of operation after incidents and the unusually long heat wave in summer 2018 that caused a significant rise in failures and partial malfunctions. The expansion of the ETCS operations with ICE 1 and ICE 3 trains on the Berlin — Munich highspeed line also experienced temporary technical shortcomings in the first few months following its launch in December 2017.
Compensating positive effects resulted from: ◊ capacity measures in facilities resulting from the OPEX
program µ75, ◊ additional technical stabilization of the fleet, such as
the new wheel sets for ICE 3 and ICE T, and ◊ continuous renewal of the fleet with the intake of more
ICE 4 and IC 2 trains.The refitting of the ICE T fleet with new wheel sets will be completed in 2019 and was a prerequisite for the scheduled recommissioning of operations with the tilting body system (tilting technology) to Vienna in December 2017.
The operation of the IC 2 is largely stable and achieves the highest level of passenger satisfaction out of all long distance transport fleets.
Vehicle projects continued ◊ The ICE 4 has been in regular operation since December
2017. The daily demand for ICE 4 trains rose from six to nine in June 2018 following the small timetable change. In addition to another increase in demand to 19 trains, operations also begun on the Cologne — Rhein/Main and Berlin — Munich lines from December 2018. Therefore the trains were prepared by the end of November and the train protection system ETCS was activated.
Deutsche Bahn Group 2018 Integrated Report
116

◊ The ICE 4 trains have been undergoing maintenance in Cologne as well as Hamburg and Munich since October 2018, and a contract for this was signed with Siemens for an initial ninemonth period. Testing of a new wheel profile was successfully completed, thereby eliminat ing the vibrations that were previously detected and making it possible to achieve the mileage guaranteed in the contract.
◊ The redesign no. 87 of ICE 3 continued. After 15 years of operation, 63 trains will be made fit for the future by 2021. Fifty trains will be equipped with ETCS and can then be used on new highspeed lines. The vehicles can be used for at least another 15 years after modernization.
◊ The refitting of ICE 1 units with ETCS was completed according to schedule and the reliability of trains fitted with ETCS was successfully improved on the highspeed line Berlin — Munich in particular.
◊ For the Nuremberg — Karlsruhe (route 61) and Stuttgart — Singen (route 87) lines, 13 out of 17 IC 2 trains from the second batch ordered were acquired. Three of these trains have been on trial runs with passengers on route 61 since December 2018.
Digitalization and innovationComfort check-in replaces ticket controlsFollowing a test phase, the comfort checkin service was launched in June 2018 across Germany in all ICE trains. This makes ticket checks obsolete as the customer checks in
independently. The function is exclusively integrated into the DB Navigator app and can be used by all customers with a mobile or online ticket no. 9. Once the passengers have taken their seats, they simply check in by clicking on the app.
Environmental measuresIn February 2018, the first carbonneutral iCE maintenance
facility no. 48 was opened in Nippes, Cologne/Germany and officially commenced operation in June 2018. The facility is run completely carbonneutral with heat from geothermal sources no. 91 and electricity generated from solar energy no. 30, which saves 1,000 t CO₂ every year.
Other events ◊ The new concept for onboard catering launched on De
cember 1, 2018 with the mission statement “Pure pleasure all along the line.” Over 650 onboard restaurants and bistros will be provided with new menus, tableware and promotional materials as part of this new concept.
◊ With the City Ticket no. 133, we have made traveling even easier: since August 1, 2018 the journey to or from the passenger station using the underground, SBahn (metro), tram or bus has been included in the price of all flex and saver tickets (Flex und SparpreisTickets)available in 120 German towns and cities with a travel distance of over 100 km.
DB Long-Distance 2018 2017
Change
2016absolute %
Punctuality (rail) (%) 74.9 78.5 – – 78.9
Rate of people making connections (long distance transport/long-distance transport) (%) 83.9 85.8 – – 85.9
Customer satisfaction (SI) 77 77 – – 77
Passengers (rail) (million) 147.9 142.2 + 5.7 + 4.0 139.0
Passengers (long-distance bus) (million) 0.7 0.7 – – 0.8
Volume sold (rail) (million pkm) 42,827 40,548 + 2,279 + 5.6 39,516
Volume sold (long-distance bus) (million pkm) 194.6 176.6 + 18.0 + 10.2 224.1
Volume produced (million train-path km) 143.4 140.5 + 2.9 + 2.1 144.1
Load factor (%) 56.1 55.5 – – 52.9
Total revenues (€ million) 4,682 4,347 + 335 + 7.7 4,159
External revenues (€ million) 4,528 4,193 + 335 + 8.0 4,012
EBITDA adjusted (€ million) 675 611 + 64 + 10.5 419
EBIT adjusted (€ million) 417 381 + 36 + 9.4 173
Gross capital expenditures (€ million) 1,081 1,060 + 21 + 2.0 416
Employees as of Dec 31 (FTE) 16,548 15,993 + 555 + 3.5 16,326
Employee satisfaction (SI) 3.5 – – – 3.5
Employee satisfaction – follow-up workshop implementation rate (%) – 99.5 – – –
Share of women in Germany as of Dec 31 (%) 27.1 27.1 – – 27.1
Specific final energy consumption compared to 2006 (based on pkm) (%) –29.3 –26.7 – – –22.9
√
GR
OU
P M
AN
AG
EM
EN
T R
EP
OR
T
117
GROUP MANAGEMENT REPORT — DEvELOPMENT Of BUSiNESS UNiTS
fiN
AN
CiA
L S
TA
TE
ME
NT
SS
US
TA
iNA
BiL
iTY

Development in the year under review ◊ Positive effects from the market and competitive environment. ◊ Further expansion of free WiFi, including in second class. ◊ Very good acceptance of the new Berlin — Munich
high-speed line. ◊ Further intake of new ICE 4 and IC 2 vehicles. ◊ Negative development of punctuality, while customer
satisfaction was stable.
The punctuality µ76 of longdistance transport fell considerably in the year under review due to the highly utilized infrastructure and more vehicle and infrastructure disruptions accompanied by a persistently high level of external disruptions. As a result of the decrease in punctuality, the rate of people successfully making longdistance transport connections also declined.
Customer satisfaction was at the same level as in the previous year. The positive developments resulting from the implementation of measures in six bundles (WiFi and cell phone reception, cleanliness of seats and restrooms, temperature, onboard railway staff, price perception and IC 1 modernization) were largely offset by the negative punc tuality developments. To assess customer satisfaction, about 15,000 customers are asked each year in six waves about their satisfaction with their latest journey.
Performance development in rail transport was mainly positive.
◊ The number of passengers and volume sold increased. This development was driven primarily by the service offering expansion owing to the new Berlin — Munich high speed line and the Gäu railway. Marketdriven stim uli, measures to further enhance the product offering, the expansion of free WiFi, including in second class, and pricing measures were also positive. However, the weatherrelated restrictions, heavy construction activity within the network and route closures put a damper on development.
◊ The commissioning of new routes also resulted in an increase in volume produced.
◊ As the number of passengers increased, the load factor rose.
Supply adjustments to individual lines resulted in a positive performance development in bus services.
The economic development was encouraging. Adjusted EBIT and EBITDA improved as a result of the significant increase in revenues. Higher expenses and the omission of the effect from the nuclear fuel tax reimbursement in the previous year had a dampening effect.
◊ Revenues were significantly positive due to price and performance effects. Supportive effects also resulted from an improved competitive environment.
◊ The decline of other operating income (– 23.4%) is mainly a result of the omission of the reimbursement of the nuclear fuel tax in the previous year and unusually high income from the sale of vehicles.
Expenses recorded significant additional burdens: ◊ The increase in the cost of materials (+ 5.6%) was mainly
driven by higher infrastructure expenses and quality im prove ment measures.
◊ The higher personnel expenses (+ 3.4%) resulted mainly from collective bargaining agreement wage increases and an increase in the number of employees.
◊ Other operating expenses (+ 8.9%) also increased, which was mainly a result of increased expenses for travel support, passenger rights, qualityrelated measures and IT.
◊ The increase in depreciations (+ 12.2%) is mainly due to the new ICE 4 and IC 2 trains. High capital expenditures in facility infrastructure during the previous year also increased depreciation.
Capital expenditure activities continued to increase slightly, reaching a new level, and was characterized by vehicle acquisitions (ICE 4 and IC 2). This was offset by less capital expenditures in facility infrastructure due to projects completed in the previous year.
The number of employees as of December 31, 2018 in creased as a result of the expansion of services.
Employee satisfaction was stable. The share of women also remained stable during the year under review.
The specific final energy consumption declined in the year under review. This improvement was driven by the new ICE 4 trains, which are much more energy efficient in operation than expected, and the good capacity utilization of our trains. At the same time, we also continued to in crease the energy efficiency of journeys made by older series. Constant improvement to the energyefficient driv ing style of our locomotive drivers was a decisive factor. Unfortunately these effects could not make their full impact due to the poor punctuality development as trains that run on time are especially energyefficient. The newly introduced driving assistance system has also started to show results.
!!! !!!
Deutsche Bahn Group 2018 Integrated Report
118

DB Regional business unitBusiness modelDB Regional’s core service is to bring millions of passengers in regional transport to their desired destination every day in a punctual, safe, comfortable and environmentally friendly
no. 3 manner and in doing so, meet the requirements of the respective transport contract.
Our offerings cover both regional rail passenger transport with regional express, regional railway and SBahn (metro) lines as well as regional and urban bus transport services. We therefore offer passengers comprehensive mobility services in major cities and metropolitan areas, but also and especially in rural areas. Our regional organizational structure guarantees local transport services oriented towards the requirements of our local customers.
As a rule, DB Regional provides its regional rail passenger transport services within the framework of the Regionalization Act (Regionalisierungsgesetz) as a public service task and on behalf of the competent public transport authorities. The public transport authorities are either the Federal states or a stateowned company, or municipal specialpurpose associations. The public transport authorities conclude longterm transport contracts and line permits with transport companies, mainly within the framework of competitively awarded tenders. These contracts determine the volume produced and contain detailed specifications on quality and fare pricing. With integrated transport concepts, highquality mobility services and targeted capital expenditures on the vehicle fleet and digitalization, we aim to defend our leading market position and strengthen our role as a quality and innovation leader in the field of regional rail passenger transport.
Volume sold and volume produced are important key performance figures. Transport contracts typically refer to the volume produced. Concession fees, in addition to revenues from ticket sales, are the most important source of income. However, contracts where fare proceeds remain directly with the contracting organization, while the transport company is fully compensated by the public transport authority for the entire range of services (gross contracts), are also of increasing importance.
Predefined terms in transport contracts and route concessions, combined with the extensive production system, result in a cost structure with high fixed costs. The major drivers are personnel, maintenance, energy and infrastructure expenses. Only a small portion of expenses vary with train capacity utilization.
In the rail sector, integrated bids covering vehicle procurement, financing, fleet management, operation and maintenance were generally required by the public transport authorities in the past. Nowadays, fragmented tender models are becoming more common. In such models, partial services or even only the basic operation of vehicles are put out to tender. Other partial services remain the responsibility of the public transport authorities in these models (financing, for example) or the responsibility of the vehicle suppliers (maintenance, for example). On the basis of our performance capability at all stages of the valueadded chain, DB Regional is in a position to tailor partial services as required and to operate successfully on the market as a subcontractor for competitors.
In the bus sector, integrated bids are still required from the contracting authority, and there is no indication of a change over the next few years.
Markets and strategyThe German regional rail passenger transport market will continue to grow slightly over the next few years and thus remains one of the most interesting markets in Europe. Increasing regionalization funds will create stability for the next few years. DB Regional intends to benefit from this positive market environment as the largest provider. In recent years, however, numerous competitors have established themselves on the market, which has led to a continuous decline in DB Regional’s market share.
In the national bus market, competition in the regional bus market continues to increase, both as a result of tenders and of licensing auctions with purely commercial bids. In urban transport, bus services are often awarded to local municipal companies in inhouse awards.
Innovative forms of mobility are increasingly being de vel oped in the local transport market and result in changes to the market. In the future, car sharing, ride sharing and on- demand concepts µ79 will become more established in the German transport market. DB Regional will flexibly respond to the changing mobility requirements of our customers and increasingly act as a provider of holistic mobility concepts in local transport.
◊ Economic ¿ dimension: We want to continuously im prove quality, thus increasing customer satisfaction, and defend our market position without sacrificing profitability and increase our innovative strength. To this end, we have launched Regional Railway of the Future (Zukunft Bahn Regio). For us, quality leadership in the regional rail passenger transport sector means arriving
!!!
GR
OU
P M
AN
AG
EM
EN
T R
EP
OR
T
119
GROUP MANAGEMENT REPORT — DEvELOPMENT Of BUSiNESS UNiTS
fiN
AN
CiA
L S
TA
TE
ME
NT
SS
US
TA
iNA
BiL
iTY

Resources/inputs
D B R E G I O N A L B U S I N E S S M O D E L
Customer segment
◊ Private customers
◊ Business customers
◊ Contracting organizations
Employees
About 35,900
Networks and infrastructure
54 workshops (rail) and 74 workshops (bus), 185 depots
Value proposition
◊ DB Regional offers customer-oriented, punctual, reliable and environmentally friendly transport solutions.
Customer access/loyalty
◊ Local sales points, travel centers, agencies, ticket machines, online, call center, onboard sales
◊ Subscriptions, apps
Key activities
Providing train and bus services
Looking after customers
Providing and maintaining vehicles
Services/outputs
Passengers
2.5 billion (rail and bus)
Volume sold
42 billion pkm (rail) and 7 billion pkm (bus)
EBIT adjusted Æ
€ 492 million
Hit rate Æ
70 %
Customer ¿ satisfaction
SI of 66 (rail) and SI of 74 (bus)
Employee † satisfaction
SI of 3.5
Punctuality ¿
94% (rail) and 91 % (bus)
Outcomes
Vehicles
871 locomotives, 4,077 multiple units, 11,211 rail cars, 3,043 passenger cars, 11,712 buses (including external)
Additional production factors
114 million station stops, 3.2 billion kWh traction current, 360 million liters of diesel fuel (bus including external and rail), 0.8 million kg natural gas (bus)
Creating competitive offers
Volume produced
0.5 billion train kilometers and 0.5 billion bus kilometers
Final energy ¥ consumption
–29.4% (rail) and + 6.0 % (bus) compared to 2006 (specific)
on time and without any issues. With this in mind, we continuously optimize our processes and quality awareness. We are completely redesigning our customer interface with digital products such as the DB route agent. Working together with the public transport authorities, we are introducing Wifi in local transport
µ79. At the same time, competitive costs will continue to be an important criterion for success in future in a market that depends heavily on offer prices. We are systematically increasing our economies of scale along the entire valueadded chain and optimizing our cross
divisional functions. We are generating growth in the maintenance market segment. In this area, we use our presence and experience to offer comprehensive maintenance services to third parties. We also want to attack networks of competitors in order to recover lost traffic. For this purpose, we have further professionalized our tender management, bundled relevant competencies in a Competence Center organization and worked intensively on our cost structures. Bus services still have to prove themselves in an environment that is becoming increasingly competitive. Cross departmental improvement management ensures optimized processes and systems and brings together the implementation coor
Deutsche Bahn Group 2018 Integrated Report
120

dination at the headquarters. By centralizing fleet management, information and communications technology, we are realizing cost advantages while at the same time improving performance. We are also continuing to work on the streamlining and standardization of our crossdivisional functions. We are reorganizing our regional organizational structure in the bus sector and expanding our branches to generate competitive and cost advantages. The responsibility for revenues in the future will be at the regional level while the responsibility for costs will reside with the branches. In the future, the control center and maintenance will be established as separate areas under the regional production managers.
◊ Social † dimension: Satisfied and motivated employees are essential for success in the market. One important key to this is to actively involve employees in the continuous improvement of DB Regional and to support them in the ongoing change processes. These efforts include conducting employee surveys µ87 and organizing followup workshops to derive actions together. We have launched a preboarding and onboarding program to make the first steps of the job easier for new em ployees. We have discussed and trained the operational managers in the most pertinent topics regarding employee management in practical workshops. We have initiated deescalation training for our customer service employees in local transport and have started equipping them with defensive sprays.
◊ Environmental ¥ dimension: We will further develop our strengths as an environmentally friendly mode of transport, especially compared to car traffic. With this in mind, driver assistance systems for energy-saving driving
no. 8 are currently being rolled out. Diesel buses with the highest emission standard Euro VI are used within the scope of our continuous fleet renewal. By continuously replacing our fleet, we are working toward im proving energy efficiency. We will also try other drive concepts as alternatives to conventional diesel together with interested public transport authorities. Hybrid, battery or hydrogen drives will play a role here. The aim is to reduce noise and emissions and conserve energy derived from fossil fuels, even on electrified branch lines.
Development of awarded transport contracts
Transport contracts awarded (rail) 2018 Term
Volume (million train km)
p. a. 1) total 1)
S-Bahn (metro) Berlin transitional contract Subnet north-south and Stadtbahn 12/2017 – 06/2027 25.9 205.0
2022 Taunus line 12/2021 – 12/2036 1.5 22.5
Munich S-Bahn (metro) (transitional agreement) 2) 12/2019 – 12/2020 20.7 20.7
Ulm diesel network 12/2020 – 12/2032 3) 1.6 19.2
Extensions RE 2 and RE 42 (Haard axis) 12/2019 – 12/2029 1.8 18.3
Elster-Geiseltal network (two batches)
12/2019 – 12/2024/2032 0.8 7.0
Nuremberg S-Bahn (metro) (transitional agreement) 4) 12/2017 – 12/2018 6.9 6.9
ÜFEX 5) 12/2018 – 12/2022 3) 1.7 6.6
RB line 83 Wittlich — Trier — Luxembourg — Dommeldange 12/2019 – 12/2024 0.5 2.4
Spessart-Pendel 12/2018 – 12/2021 1.1 3.3
Other (7 contracts) 1 – 8 years 2.5 5.0
Total 1) 65.0 317.0
1) Differences due to rounding are possible.2) Public transport authorities have exercised the option to extend.3) Option for extension possible.4) Retroactively published in the Official Journal of the European Union.5) Newly awarded transport contract.
In the German regional rail passenger transport market, 29 tender procedures were concluded in the year under review (previous year: 24) and about 93 million train kilometers (train km) (previous year: 75 million train km) were award ed. Of the train kilometers newly awarded, about 85% had previously been operated by companies within DB Group.
DB Regional won 17 tenders (including published contract amendments) (previous year: 14 tenders), or 70% (previous year: 74%) of the train kilometers awarded.
Transport contracts awarded (bus) 2018 Term
Volume (million bus km)
p. a. 1) total 1)
Osnabrück Süd 02/2019 – 01/2029 3.9 38.7
VRN – Mosbach 01/2019 – 12/2028 2.6 25.9
VRN – Buchen 01/2019 – 12/2028 2.1 21.4
Detmold urban transport 2) 02/2019 – 02/2029 1.6 16.4
VGF – Freudenstadt ewA 2018 12/2018 – 12/2026 1.9 15.1
VVS – Ludwigsburg 06 — Marbach 08/2019 – 12/2027 1.8 14.9
KVV – Lußhardt 12/2018 – 12/2026 1.7 13.3
Holzminden district 08/2018 – 07/2020 2.3 4.7
Other (42 contracts) 1 – 10 years 19.7 156.0
Total 1) 37.6 305.2
1) Differences due to rounding are possible.2) Newly awarded transport contract.
GR
OU
P M
AN
AG
EM
EN
T R
EP
OR
T
121
GROUP MANAGEMENT REPORT — DEvELOPMENT Of BUSiNESS UNiTS
fiN
AN
CiA
L S
TA
TE
ME
NT
SS
US
TA
iNA
BiL
iTY

In the German bus segment, services were awarded in the year under review with a volume of 110 million commercial vehicle kilometers (bus kilometers) (previous year: 89 million bus kilometers) in 158 tenders (previous year: 171 procedures). Of the commercial vehicle kilometers newly awarded, 38% (previous year: 37%) were previously operated by DB Regional Bus.
In the year under review, we participated in 111 tenders (previous year: 106 tenders) with a volume of 81 million bus kilometers (previous year: 72 million bus kilometers). We won 46% of the tender procedures in which we participated (previous year: 27%).
Development of our fleetVehicle measures implementedMeasures to improve our vehicle fleet included: interior redesign, installation of passenger information and video recording systems and new paint.
◊ The modernization of 91 425 series electric multiple units was completed for the RhineNeckar SBahn (metro) tender and the RB 44 between Mainz and Mannheim.
◊ Since 2016, 41 out of a total of 111 vehicles of the 474 series have been refurbished for SBahn (metro) Hamburg.
◊ A total of 36 vehicles of the 420 series and 238 vehicles of the 423 series are to be refurbished for the SBahn (metro) Munich transition contract. Nine 420 series electric multiple units and 21 423 series electric multiple units were modernized in the year under review.
◊ Twentynine out of the 48 422 series electric multiple units that were due to be modernized were rebuilt to provide the vehicles for the RhineRuhr SBahn (metro).
◊ Ten 642 series diesel multiple units and five 644 series diesel multiple units were rebuilt for the Ulm diesel network transitional contract. A further nine 650 series diesel multiple units will be modernized in 2019/2020.
New vehicle purchases ◊ Twelve 622 series diesel multiple units (LINT 54) and
eight 623 series diesel multiple units (LINT 41) are being procured from Alstom for the Ulm diesel network contract that was awarded in 2016. These will be resold to the leasing company following acceptance and will be leased there for the duration of the transport contract in December 2020 when the transport contract begins.
◊ A further ten 490 series vehicles were reordered for the Hamburg SBahn (metro) network from an existing option.
Delays in vehicle deliveriesVehicle availability improved during the year under review. However, there were still delays and restrictions relating to the delivery of new trains:
◊ Bombardier’s delayed delivery of the 2010 doubledeck cars in December 2015 continued in the year under review with the addition of a further 78 vehicles (central and powered driving trailers). Consequently, all vehicles from the original orders were delivered and accepted before the end of July 2018. An additional train set is sched uled to be reordered in the first quarter of 2019.
◊ In December 2016, DB Regional had to rent a total of 15 locomotives and three diesel rail cars from Paribus for deployment as part of the transport contract for the SchleswigHolstein West network. Of the 90 passenger cars to be rented as well, the last vehicles could only be made available at the end of July 2018 due to vehicle deficits. Due to outstanding points in the maintenance documen tation, the vehicles have still not been made available. Existing vehicles from DB Regional and DB LongDistance continue to be deployed until the points are clarified. The rental contract is expected be drawn up with Paribus early in 2019.
◊ Eight preproduction vehicles out of the 72 490 series vehicles for the Hamburg SBahn (metro) were delivered and provisionally accepted for testing under the contract. Since the vehicles do not meet all of the agreed requirements, DB Regional will gradually get more ve hicles as part of a transfer of use from Bombardier in the first instance. Ten vehicles were deployed in De cember 2018 for the Hamburg SBahn (metro) transport contract that had commenced operations. Vehicles from the 490 series are scheduled to be accepted under the contract from mid2019.
◊ The delivery of the Link diesel multiple units from PESA (632/633 series) began in the second half of 2018, which means an end to the delivery delays is in sight after the Sauerland network and the Dreieich railway have waited over two years and the Allgäu diesel network over one year. Until then, the comprehensive replacement concepts using existing vehicles for the Sauerland and Dreieich networks will remain in place. All twenty 632 series vehicles for the Sauerland network were delivered in the second half of 2018.
◊ The delivery of the vehicles ordered from Škoda for the Nuremberg — Ingolstadt — Munich Express is also delayed beyond the first quarter of 2019.
Deutsche Bahn Group 2018 Integrated Report
122

Digitalization and innovation ◊ A test vehicle for piloting the WiFi scheme on the Munich
SBahn (metro) has been running since midApril 2018. A 423 series vehicle was fitted with the appropriate technology for the pilot project. Passengers can connect their mobile device to the Internet for free with WiFi@DB.
◊ The DB Medibus first started being used as a mobile doctor’s office in July 2018 by the Regional Association of SHIAccredited Physicians (Hesse Kassenärztliche Vereinigung), covering two districts to help close the supply gap in healthcare provision and support doctors.
◊ Passengers can book tickets for 29 different transport as sociations using DB Navigator. With this offer, we reach over 65 million people – about 90% of the potential passengers on all transport networks in Germany.
Environmental measures ◊ Telematics systems were fitted in 850 diesel multiple
units and locomotives which measure fuel consumption and give the driver recommendations on how to drive more efficiently. This energy-efficient driving style no. 8 is expected to save about 12 million liters of diesel and 30,000 metric tons of CO₂ per year.
Legal issuesAgreement with PESA and Bombardier regarding claims arising from the delay in deliveryIn December 2018, DB Regional agreed an outofcourt settlement with PESA regarding the delayed delivery of diesel railcars pertaining to the transport contracts for the Allgäu I, Dreieich and Sauerland diesel networks, thereby avoiding any costly legal disputes. An outofcourt settlement was also agreed with Bombardier regarding the de layed delivery of electric railcars for the Hamburg SBahn (metro) transport contract.
Other events ◊ Boarding guides are being used in SBahn (metro) sys
tems to ensure that stopping times are on schedule. They support and speed up boarding and alighting by directly addressing passengers or through platform announcements. This was successfully trialed in the previous year at the central stations in Munich and Frankfurt am Main. The boarding guides are being gradually put into regular operation at selected stations. This concept was also piloted for the first time with regional transport at the Frankfurt am Main central station. We are currently looking at expanding this service.
DB Regional 2018 2017
Change
2016absolute %
Punctuality (rail) (%) 94.0 94.4 – – 94.8
Punctuality (bus) (%) 91.0 90.5 – – 90.6
Customer satisfaction (rail) (SI) 66 68 – – 69
Customer satisfaction (bus) (SI) 74 74 – – 75
Passengers (million) 2,521 2,562 – 41 – 1.6 2,512
thereof rail 1,940 1,930 +10 + 0.5 1,879
Volume sold (million pkm) 48,615 48,911 – 296 – 0.6 48,399
thereof rail 41,878 41,876 +2 – 40,809
Volume produced (rail) (million train-path km) 460.1 459.3 + 0.8 + 0.2 459.3
Volume produced (bus) (million bus km) 518.6 532.0 –13.4 –2.5 586.5
Total revenues (€ million) 8,968 8,734 + 234 + 2.7 8,653
External revenues (€ million) 8,862 8,629 + 233 + 2.7 8,529
Rail concession fees (€ million) 5,472 3,879 + 1,593 + 41.1 3,849
EBITDA adjusted (€ million) 1,126 1,156 – 30 – 2.6 1,272
EBIT adjusted (€ million) 492 508 – 16 – 3.1 636
Gross capital expenditures (€ million) 539 674 – 135 – 20.0 693
Employees as of Dec 31 (FTE) 35,881 35,651 + 230 + 0.6 36,008
Employee satisfaction (SI) 3.5 – – – 3.5
Employee satisfaction – follow-up workshop implementation rate (%) – 100 – – –
Share of women in Germany as of Dec 31 (%) 16.2 16.0 – – 16.1
Specific final energy consumption (rail) compared to 2006 (based on pkm) (%) –29.4 –28.5 – – –26.3
Specific final energy consumption (bus) compared to 2006 (based on bus km) (%) + 6.0 + 4.8 – – + 5.8
√
GR
OU
P M
AN
AG
EM
EN
T R
EP
OR
T
123
GROUP MANAGEMENT REPORT — DEvELOPMENT Of BUSiNESS UNiTS
fiN
AN
CiA
L S
TA
TE
ME
NT
SS
US
TA
iNA
BiL
iTY

Development in the year under review ◊ Performance gains in the rail line of business. ◊ Delays in vehicle deliveries still require
replacement concepts. ◊ Performance losses in the bus line of business.
Punctuality in rail transport has mainly declined because of heavy utilization of the infrastructure as well as vehicle and infrastructure disruption.
Punctuality in bus services increased during the year under review with reasons including the increase in vehicle quality assurance activities and the introduction of central control centers across Germany for vehicle and personnel deployment.
Customer satisfaction on rail services declined, particularly on the Hamburg and RheinMain SBahn (metro) lines. Bus services maintained their satisfaction rating. To assess customer satisfaction, about 19,000 customers (rail) and 1,500 customers (bus) are asked each year about their satisfaction in two waves.
Performance development during the year under review was varied:
◊ Performance development in rail transport remained at the same level as the previous year. The positive development at the Berlin SBahn (metro) was offset by performance losses, among other factors.
◊ The bus sector was marked by a decline in performance development due to lost line bundles in particular.
The economic development of DB Regional is particularly affected by the development of the higherrevenue and higherperformance rail line of business (share of revenues: 89%). The adjusted EBIT was exclusively generated in the rail line of business. Development in the year under review was unsatisfactory overall. Despite a slight increase in revenues, the operating profit figures fell. Weak development in the bus line of business and the omission of the nuclear fuel tax reimbursement had negative effects on the operating profit.
◊ Revenues rose owing to an increase in the rail line of business due to pricing and performance factors. The performancebased decline in the development of the bus line of business countered this impact.
◊ Other operating income (– 7.5%) decreased due to the omission of the nuclear fuel tax reimbursement in the previous year.
Expenses recorded an increase: ◊ The cost of materials (+ 2.3%) was driven in particular
by increased energy, infrastructure and rail replacement transport expenses. This was offset by lower maintenance expenses.
◊ Personnel expenses (+ 4.2%) rose as a result of collective bargaining agreements, among other things.
◊ Other operating expenses (+ 7.4%) rose as a result of increased vehicle leases and higher related services.
◊ The rail line of business drove a decline in depreciation (– 2.2%), among other factors, due to vehicles reaching the end of their useful life for accounting purposes.
Capital expenditures in both the bus and rail lines of business fell.
77% of employees are employed in the rail line of business, with 23% in the bus line of business. The number of employees increased slightly in both lines of business.
Employee satisfaction remained stable. The share of women remained at the same level as the previous year.
The specific traction energy consumption in rail transport continued to fall in the year under review, which was a result of increased efforts to save energy during journeys. There were still no consumptionreducing effects in diesel vehicles in the bus sector in the year under review due to delays in installing telematics systems – which promptly and accurately record fuel consumption – for technical reasons. The specific final energy consumption in the bus sector increased compared to 2006 due to changes in transport structures and different requirements for the bus fleets.
Rail line of business ◊ Performance development at the same level
as the previous year. ◊ Personnel expenses increased as a result of collective
bargaining agreements. ◊ Delays in vehicle deliveries still require
replacement concepts.
Rail line of business 2018 2017
Change
absolute %
Passengers (million) 1,984 1,977 + 7 + 0.4
thereof rail 1,940 1,930 +10 + 0.5
Volume sold (million pkm) 42,542 42,588 – 46 – 0.1
thereof rail 41,878 41,876 +2 –
Volume produced (million train-path km) 460.1 459.3 + 0.8 + 0.2
Total revenues (€ million) 8,000 7,785 + 215 + 2.8
External revenues (€ million) 7,753 7,508 + 245 + 3.3
Rail concession fees (€ million) 5,471 3,879 + 1,592 + 41.0
EBITDA adjusted (€ million) 1,092 1,099 – 7 – 0.6
EBIT adjusted (€ million) 513 501 + 12 + 2.4
Gross capital expenditures (€ million) 473 596 – 123 – 20.6
Employees as of Dec 31 (FTE) 27,494 27,304 + 190 + 0.7
!!! !!!
Deutsche Bahn Group 2018 Integrated Report
124

Performance development in the rail line of business was dampened by tender losses and the development of a railway company’s bus services. Development at the Berlin SBahn (metro) had a positive effect, among other factors.
The economic development was modest overall. In creas ed infrastructure utilization and personnel expenses as well as the omission of the nuclear fuel tax reimbursement offset the increase in revenues, meaning that the op erating profit figures declined slightly or remained stable.
◊ Revenue development was positive due to pricing and per formance factors. The concession fees rose due to con cession fee dynamics, among other things. As a result of changes to the offsetting of fare revenues in gross contracts, there were significant shifts between concession fees and revenues from fares, which had a neutral impact.
◊ Other operating income (– 7.1%) decreased primarily because of the omission of the nuclear fuel tax reimbursement and lower reimbursements from vehicle retrofitting for the Berlin SBahn (metro). Increased in come from reversals and utilization of provisions for pending losses had an offsetting effect in addition to other factors.
◊ Cost of materials (+ 1.9%) were particularly driven by increased energy expenses and higher expenses for infrastructure utilization owing to price and volume factors. This was offset by lower maintenance expenses.
◊ Personnel expenses (+ 5.0%) increased significantly as a result of collective bargaining agreements and the higher number of employees.
◊ Other operating expenses (+ 6.2%) rose as a result of higher levels of purchased services and higher rental expenses, especially for vehicles.
◊ Depreciations (– 3.0%) decreased due to vehicles reach ing the end of their useful life for accounting purposes and other financing models being used for new vehicles as supported by public transport authorities.
Capital expenditure activities also fell significantly due to other financing models for new vehicles as part of awarded tenders.
The number of employees increased slightly due to the individual option to choose working hours µ85, which was agreed with the unions.
Bus line of business ◊ Shortcomings in operating performance capability. ◊ Delayed implementation of optimization measures. ◊ Intensification of the competitive environment.
Bus line of business 2018 2017
Change
absolute %
Passengers (million) 537.1 584.2 – 47.1 – 8.1
Volume sold (million pkm) 6,073 6,323 – 250 – 4.0
Volume produced (million bus km) 492.4 503.7 – 11.3 – 2.2
Total revenues (€ million) 1,228 1,224 + 4 + 0.3
External revenues (€ million) 1,109 1,122 – 13 – 1.2
EBITDA adjusted (€ million) 34 57 – 23 – 40.4
EBIT adjusted (€ million) – 21 7 – 28 –
Gross capital expenditures (€ million) 66 77 – 11 – 14.3
Employees as of Dec 31 (FTE) 8,387 8,347 + 40 + 0.5
The performance development in the bus sector was significantly negative due to tenderrelated performance losses.
The economic development was very weak. The slight in crease in revenues was more than offset by expense in creases, meaning that the operating profit figures fell significantly.
◊ The revenue development was burdened by the performance development. This was offset by intraGroup rail replacement transport, thereby slightly increasing revenue.
◊ Other operating income (+ 2.9%) increased due to increased utilization of provisions for pending losses, among other factors. This was offset by lower income from sales of busses.
◊ Cost of materials (+ 1.4%) was particularly driven by increased diesel prices and higher costs for contractor services. Maintenance expenses, which were lower due to performance, had a positive effect.
◊ Personnel expenses (+ 2.6%) increased as a result of collective bargaining agreements.
◊ Other operating expenses (+ 6.2%) increased due to additions to the provision for pending losses and a higher level of purchased services.
◊ The increase in depreciation (+ 10.0%) was a result of capital expenditures in the previous year.
Capital expenditure activities decreased due to performance losses, among other reasons.
The number of employees rose slightly as of December 31, 2018.
GR
OU
P M
AN
AG
EM
EN
T R
EP
OR
T
125
GROUP MANAGEMENT REPORT — DEvELOPMENT Of BUSiNESS UNiTS
fiN
AN
CiA
L S
TA
TE
ME
NT
SS
US
TA
iNA
BiL
iTY

DB Arriva business unitBusiness modelWith buses, trains, trams, water buses, car and bikesharing systems, DB Arriva offers a wide range of transport solutions. The activities of DB Arriva are divided into three lines of business: UK Bus, UK Trains as well as Mainland Europe.
Volume sold and volume produced are important key performance figures. In addition to revenues from fares, subsidies are an important source of income. Revenues from fares are the only source of income for transport services operated on a purely commercial basis.
Predefined terms in transport contracts, concessions and route concessions, combined with the complex production system, result in a cost structure with high fixed costs. The major drivers are personnel, maintenance, energy and infrastructure expenses. Only a small portion of expenses vary with bus or train capacity utilization.
Throughout Europe, we work with local, regional and national authorities to bring new and improved services to our customers. Our regional presence allows us to quickly respond to changes, especially new regulatory requirements and changing customer expectations. We work closely with our customers to develop efficient, tailormade, sustainable solutions.
!!!
Resources/inputs
D B A R R I VA B U S I N E S S M O D E L
Customer segments
◊ Private customers
◊ Contracting organizations
Employees
About 53,100
Networks and infrastructure
About 48,000 bus stops (Great Britain), 594 operated stations (Great Britain)
Value proposition
◊ DB Arriva offers customer-oriented, efficient and affordable transport solutions.
Customer access and retention
◊ Local sales points, travel centers, agencies, ticket machines, online, call center, on-board sales
◊ Subscriptions, apps
Key activities
Providing train and bus services
Looking after customers
Providing and maintaining vehicles
Services/outputs
Passengers
2 billion (bus and rail)
Transport performance
13.0 billion pkm (rail)
EBIT adjusted Æ
€ 300 million
Employee satisfaction †
SI of 3.6
Customer ¿ satisfaction
SI of 79
Greenhouse gas emissions ¥
–12.3% (rail) and –18.2 % (bus) compared to 2006 (specific)
Punctuality ¿
89.8 % (rail)
Outcomes
Vehicles
1,074 multiple units, 19 locomo-tives, 84 passenger cars, 17,049 buses (including external), 223 patient transport services
Additional production factors
563 million liters of fuel, 352 million kWh of electricity
Operation and optimization of local networks
Volume produced
1.1 billion bus kilometers and 0.2 billion train kilometers
Deutsche Bahn Group 2018 Integrated Report
126

Client bodies particularly appreciate the experience we have in operating various transport solutions and our commitment to providing highquality, reliable, efficient and costeffective services.
Markets and strategy DB Arriva is our European growth platform in passenger trans port, with operations in 14 countries:
Activities of DB Arriva by country Services offered
Croatia bus
Czech Republic bus/rail
Denmark bus/rail/water bus/car sharing
Great Britainbus/rail/non-emergency
patient transport
Hungary bus
Italy bus/rail/tram/water bus
Poland bus/rail
Portugal bus/rail/tram
Serbia bus
Slovakia bus/bike sharing
Slovenia bus
Spain bus
Sweden bus/rail/tram
The Netherlands bus/rail/water bus/bike sharing
The vision of DB Arriva is to become Europe’s mobility part ner of choice. This is underpinned by four strategy pillars; a strong foundation, delivering growth through tenders and M&A, the best employees and being the preferred choice for customers.
◊ Economic ¿ dimension: Sustained profitable growth is only possible if we provide highquality services that our customers can afford and that they enjoy using. To achieve this, we are continuously investing in new vehicles, developing new mobility solutions to complement traditional passenger transport modes, and improving our passenger information systems. Profitable growth is the basis for guaranteeing a stable and sustainably successful business. We achieve this primarily by taking part in tenders for transport contracts and through acquisitions.
◊ In the UK Bus business we aim to optimize existing business and expand the services offered to customers. For example, we expanded our ondemand minibus service – ArrivaClick µ128. With a focus on making travel by bus more convenient for passengers, UK Bus made an investment to introduce con-
tactless payment µ128 on its buses.
◊ In the case of UK Trains, the Night Overground service operated by Arriva Rail London (ARL), on behalf of Transport for London (TfL), has been successfully helping to keep London moving 24/7. This project also saw ARL shortlisted for the Outstanding Teamwork Award at the National Rail Awards 2018.
◊ In Mainland Europe, we are also growing through retained and new transport contracts µ128.
◊ Social † dimension: Engaged employees are an essential component of our success. Our attractiveness as an employer enables us to recruit and retain talented em ployees. As part of this commitment, we launched our new People Solution, which consists of Workday and Avature – two leading people management systems that will deliver greater simplicity, efficiency and visibility of our people processes across the DB Arriva businesses. The new People Solution went live in Great Britain during the year under review, and will be rolled out across Europe during 2019.
◊ Environmental ¥ dimension: The journey of DB Arriva to Destination Green is an integral part of our corporate culture. Central to this is reducing fuel consumption, improving air quality and reducing carbon emissions. As part of our Destination Green strategy, DB Arriva signed a contract with SSE Business Energy µ128 to switch supply of electricity of nearly all of its UK sites to 100% renew-
able energy µ90 f. sources.
General frameworkFurther liberalization of the transport market in Europe
◊ As part of the rail reform µ64 in France, all relevant legislation is in the process of being changed and some French regions have started to look at tendering public transport contracts. It is through the Regions that the ad vantages of market liberalization will be unlocked and DB Arriva signed a partnership agreement with the as so ciation of French regions (Régions de France), to sup port steps towards rail market opening. DB Arriva has prequalified to take part in tendering in the ProvenceAlpes Côte d’Azur region, and several other regions are now becoming very active in preparations for liberalisation.
!!!
GR
OU
P M
AN
AG
EM
EN
T R
EP
OR
T
127
GROUP MANAGEMENT REPORT — DEvELOPMENT Of BUSiNESS UNiTS
fiN
AN
CiA
L S
TA
TE
ME
NT
SS
US
TA
iNA
BiL
iTY

◊ The Spanish railway market is currently going through a gradual liberalization under European directives. DB Arriva is taking very early steps to explore the feasibility of an international train service between Galicia in Spain and Porto in Portugal – two regions where DB Arriva already runs bus networks.
◊ The Ministry of Transport is making preparations to tender regional transport services in Slovenia, scheduled to be held in 2021. DB Arriva, as the largest operator in public transport in Slovenia is well positioned to respond to the upcoming tender.
Development of awarded transport contracts
Transport contracts awarded (bus) 2018 Term
Volume (million bus km)
p. a. 1) Total 1)
Great Britain London (13 routes) 5 years each 10.4 52.2
Sweden
Helsingborg City Traffic (Skånetrafiken) 2) 06/2019 – 06/2027 6.4 51.2
Sweden E32 Ekerö 06/2019 – 06/2029 4.6 46.5
The Netherlands Zuid Holland Noord 2) 12/2020 – 12/2022 20.5 41.0
Denmark Movia A8 (8 parts) 2) 1.5 – 2 years 18.4 35.0
Denmark Movia A17 (4 parts) 6 – 10 years 3.8 32.1
Italy SIA extension 2) 02/2018 – 06/2019 17.3 26.0
Italy SAF 2) 01/2019 – 12/2019 19.7 19.7
DenmarkMovia A3 (part 1 and 2) 2) 2 years each 8.1 16.8
Poland City of Warsaw I 12/2018 – 12/2026 2.0 16.0
Italy SAB 2) 01/2019 – 12/2019 14.0 14.0
Czech Republic
Teplice City (Ustecky Region – Northern Bohemia) 07/2018 – 12/2023 2.1 11.7
DenmarkMidtrafik (15; 20; 21; 28) 2) 1 – 4 years 3.7 11.0
Serbia Kragujevac 07/2018 – 07/2021 2.8 8.3
Other 3) 0.5 – 10 years 8.0 11.8
Total 1) 141.9 393.1
1) Differences due to rounding are possible.2) Extension of the existing contract.3) Including extensions of existing contracts.
Transport contracts awarded(rail) 2018 Term
Volume (million train km)
p. a. 1) Total 1)
Denmark Jutland 12/2020 – 12/2028 11.6 92.8
Czech Republic Prag line S41 12/2018 – 12/2021 0.4 1.1
Total 1) 12.0 93.9
1) Differences due to rounding are possible.
Digitalization and innovation ◊ Following the successful pilot project for the demand
responsive transport solution ArrivaClick in the English county of Kent, the new service is coming into regular operation in Liverpool. There should be 25 vehicles operating in the city in summer 2019. The innovative appbased minibus service combines the costefficiency of bus travel with the comfort of personalized transit.
◊ DB Arriva partnered with Ticketer in Great Britain to introduce contactless payments on its buses. The roll out of the Ticketer units, which also accept QR codes, mTickets, Apple Pay and Android Pay, to about 3,500 buses began in No vember 2018 and will be complete by summer 2019.
Environmental measuresAdditional environmentally friendly buses DB Arriva operates environmental friendly bus services in Great Britain, the Netherlands, Portugal, Slovenia and the Czech Republic using 101 electric buses no. 63.
◊ By the end of the year under review, a total of 79 electric buses were operated by DB Arriva in the Netherlands. By the end of 2019 this figure is expected to increase to 157.
◊ All train and bus services in the Dutch province of Limburg will be electrified by DB Arriva by 2026 as part of the contract with the region. 24 new electric buses were brought into operation, bringing the total number of electric buses to over 40.
◊ All public transport services in Maastricht will be completely electric by the end of 2019.
◊ DB Arriva won a tenyear contract to operate a fleet of water buses in Copenhagen. Services start in January 2020 and the new buses will be electricpowered.
Use of green electricity In the year under review, DB Arriva signed a threeyear contract with SSE Business Energy that will see almost all its UK bus and rail stations, maintenance facilities and office buildings powered by 100% renewable electricity. This makes DB Arriva the first major transport operator in Great Britain to switch its electricity supply to 100% eco-power
no. 1. DB Arriva will save about 27,000 tons of CO2 annually by using electricity from renewable sources. The contract with SSE Business includes a smart energy management service, which means employees can monitor onsite energy consumption using an online energy checking tool, and can therefore put effective energysaving measures in place.
Deutsche Bahn Group 2018 Integrated Report
128

investments ◊ DB Arriva has acquired the remaining shares of the
existing joint venture VTARRIVA Személyszállító és Szolgáltató Korlátolt Felelősségű Társaság (VTArriva) and now owns 100% of the shares. The acquisition en ables Arriva to access the growth potential of the Hungarian market. VTArriva has been included in the 2018 financial statements since December 2018.
Other events ◊ Parts of the UK rail network experienced significant
challenges following the introduction in May 2018 of the most extensive timetable changes for a generation. Major delays to electrification projects by Network Rail, the infrastructure provider, meant that Arriva Rail North (ARN) had to rewrite its entire new timetable and do so in 16 weeks rather than the normal 40 weeks. This caused delays to driver training, leading to major disruption on parts of the network at the start of the new timetable. ARN put in place an interim timetable on some routes to stabilize services and a full service was restored later in 2018. An independent inquiry from the Office of Rail and Road (ORR) concluded that regulators, government, Network Rail and operators all made mistakes which contributed to the issues. The inquiry found the root cause for the problems affecting ARN was significant delays to electrification projects, which were due to be completed in 2016 but are now expected to finish in 2019.
◊ In Hungary DB Arriva launched a direct airport shuttle bus service in 2017. Due to the success of the service and growing passenger demand, DB Arriva increased service capacity by 55% in the year under review.
◊ The UK Government announced an independent review of the UK rail industry, covering industry structures and the current franchising system. Alongside this, the Government announced the CrossCountry tender will not proceed. Services will continue to be operated by CrossCountry with options to be considered by the UK Government in due course.
Development in the year under review ◊ Challenging market and competitive environment
across all lines of business. ◊ Significant operational challenges in UK Trains (Arriva Rail
North) due to delays with the rail infrastructure program. ◊ Strikes in UK Trains (Arriva Rail North) and in the
Netherlands, in addition to weather-related restrictions, had dampening effects.
◊ Acquisitions made positive contributions.
Punctuality in rail passenger transport (Great Britain, Denmark, Sweden, the Netherlands and Poland) fell significantly. The decline is mainly a result of the extremely severe weather in March 2018 (“Beast from the East”) in Great Britain and Northern Europe paired with infrastructure disruptions and timetable change problems in Great Britain in May 2018.
Customer satisfaction in Great Britain reduced during the year primarily due to continuing disruption from May timetable changes and industrial action in UK Trains.
The development of performance figures was differentiated: the number of passengers increased slightly. Volume produced remained broadly at the previous year’s level and Volume sold in rail transport declined.
◊ There were significantly negative impacts on rail transport due to several factors, including the cessation of Arriva Trains Wales by UK Trains, strikes and severe weather conditions.
◊ The main drivers in bus transport were acquisitions in the Mainland Europe line of business.
The economic development was stable overall. This was the result of a consistently difficult competitive environment, as well as lost revenues caused by strikes and severe weather conditions. The adjusted EBITDA improved slightly overall. However, increased depreciation owing to high capital ex penditures in the previous year resulted in an adjusted EBIT slightly below the previous year’s level.
◊ The UK Bus line of business generated 19% of DB Arriva’s revenues, the UK Trains line of business generated 42%, and the Mainland Europe line of business generated 39%. The increase in revenues is mainly attributable to passenger revenue growth at UK Trains and the firsttime fullyear inclusion of Autotrans (since August 2017). In contrast, exchange rate effects (development of the British pound), strikes at UK Trains and the cessation of the Arriva Trains Wales franchise (midOctober 2018) had a dampening impact.
◊ Other operating income (– 15.6%) declined because of switches to revenues without affecting profits.
GR
OU
P M
AN
AG
EM
EN
T R
EP
OR
T
129
GROUP MANAGEMENT REPORT — DEvELOPMENT Of BUSiNESS UNiTS
fiN
AN
CiA
L S
TA
TE
ME
NT
SS
US
TA
iNA
BiL
iTY

The development of expense items was influenced by acquisitions and additional headwinds as well as offsetting exchange rate effects:
◊ The slight increase in the cost of materials (+1.5%) was both driven by acquisitions and the increased expenses for replacement transports, infrastructure utilization, and maintenance at UK Trains. Exchange rate effects and the reimbursement of fuel duty in the Netherlands had an offsetting impact.
◊ Personnel expenses (+1.9%) rose due to acquisitions, an increased number of employees (on average) at UK Trains, and salary increases. This was partly compensated by an onetime effect regarding pensions as well as positive exchange rate effects.
◊ Other operating expenses (– 1.7%) fell slightly due to exchange rate effects.
◊ Depreciation (+2.6%) was largely influenced by higher capital expenditures in the previous year.
The capital expenditure activity was at a lower level because of higher capital expenditures in the previous year for new transport contracts in London and quality improvement measures in the regions outside London at UK Bus. In contrast, capital expenditures rose in the Netherlands, Sweden and Italy.
DB Arriva employs 29% of its employees in the UK Bus line of business, 20% in the UK Trains line of business, and 49% in the Mainland Europe line of business. The number of employees fell because of the cessation of the Arriva Trains Wales franchise. The acquisition of VTArriva and recruitment at Arriva Rail North had an offsetting effect, among other factors.
Employee satisfaction is measured every two years. In the year under review, DB Arriva was focused on creating actions plans to as a result of the 2016 survey.
In bus transport, we were able to again reduce specific greenhouse gas emissions compared to 2006. In rail transport specific emissions worsened slightly due to changes in the fleet structure.
UK Bus line of business ◊ Challenging market and competitive environment
with persistent cost pressure. ◊ Demand in the regional bus market generally down. ◊ Extensive countermeasures initiated.
UK Bus line of business 2018 2017
Change
absolute %
Passengers 1) (million) 723.4 739.9 –16.5 –2.2
Volume produced (million bus km) 352.8 353.6 – 0.8 – 0.2
Total revenues (€ million) 1,062 1,064 – 2 – 0.2
External revenues (€ million) 1,060 1,063 – 3 – 0.3
EBITDA adjusted (€ million) 152 142 + 10 + 7.0
EBIT adjusted (€ million) 72 66 + 6 + 9.1
Gross capital expenditures (€ million) 44 149 – 105 – 70.5
Employees as of Dec 31 (FTE) 15,609 15,935 – 326 – 2.0
1) Previous year’s figure adjusted.
!!!!!!
DB Arriva 2018 2017
Change
2016absolute %
Punctuality (rail) (Great Britain, Denmark, Sweden, the Netherlands and Poland) (%) 89.8 92.3 – – 91.0
Customer satisfaction bus and rail in Great Britain (SI) 79 80 – – 81
Passengers bus and rail 1) (million) 1,998 1,976 +22 +1.1 1,761
Volume sold (rail) (million pkm) 12,999 13,334 –335 –2.5 11,230
Volume produced (bus) (million bus km) 1,074 1,075 – 1 – 0.1 1,028
Volume produced (rail) (million train-path km) 177.6 177.6 – – 170.6
Total revenues (€ million) 5,441 5,345 + 96 + 1.8 5,093
External revenues (€ million) 5,433 5,338 + 95 + 1.8 5,085
EBITDA adjusted (€ million) 575 569 + 6 + 1.1 525
EBIT adjusted (€ million) 300 301 – 1 – 0.3 280
Gross capital expenditures (€ million) 326 374 – 48 – 12.8 359
Employees as of Dec 31 (FTE) 53,056 54,650 – 1,594 – 2.9 54,150
Employee satisfaction (SI) 3.6 – – – 3.7
Employee satisfaction – follow-up workshop implementation rate (%) – 89.9 – – –
Specific greenhouse gas emissions (rail) compared to 2006 (based on rail car units) 1) (%) –12.3 –12.8 – – –13.0
Specific greenhouse gas emissions (bus) compared to 2006 (based on bus km) (%) –18.2 –17.2 – – –16.3
1) Previous year’s figure adjusted.
√
Deutsche Bahn Group 2018 Integrated Report
130

The number of passengers fell considerably because of industrywide market development (including modal shifts, driving time extensions due to construction sites and traffic jams, and changes in mobility behaviour). In the development of operating performance, supply adjustments are reflected.
In a difficult market environment, the economic development weakened further, dampened by negative ex change rate effects. The adjusted EBITDA and EBIT largely im proved as a result of oneoff effects.
◊ The revenue development was at the previous year’s level due to exchange rate effects. When adjusted for exchange rate effects, a slight increase was recorded, which was a result of several factors including improved performance in London.
◊ Other operating income (+19.7%) rose in particular because of income from property sales.
The development of expense items was supported by positive onetime effects:
◊ The decline in cost of materials (–2.0%) was driven by exchange rate effects and lower energy expenses.
◊ Personnel expenses (–1.3%) decreased slightly due to exchange rate effects and a oneoff effect related to a pension liability management exercise. Salary increases, in contrast, had a negative effect.
◊ Other operating expenses (+6.7%) increased due to higher insurance costs.
◊ Depreciation (+5.3%) was higher due to substantial capital expenditures in the previous year.
Capital expenditures declined considerably. This was mainly because of contractual capital expenditures in the previous year associated with transport contracts awarded in London and measures to improve services in the regions outside of London.
The number of employees fell in London, in particular as a result of the closure of the Watford garage in Septem ber 2018.
UK Trains line of business ◊ Strikes had a dampening effect on business development. ◊ Significant operational challenges at Arriva Rail North. ◊ Arriva Trains Wales transport contract ended in October. ◊ More positive developments in remaining transport contracts.
UK Trains line of business 2018 2017
Change
absolute %
Passengers (million) 370.9 387.6 –16.7 – 4.3
Volume sold (million pkm) 10,729 11,091 –362 –3.3
Volume produced (million train-path km) 124.2 126.2 – 2.0 – 1.6
Total revenues (€ million) 2,312 2,223 + 89 + 4.0
External revenues (€ million) 2,261 2,184 + 77 + 3.5
EBITDA adjusted (€ million) 112 124 – 12 – 9.7
EBIT adjusted (€ million) 78 89 – 11 – 12.4
Gross capital expenditures (€ million) 61 65 – 4 – 6.2
Employees as of Dec 31 (FTE) 10,775 12,656 – 1,881 – 14.9
The performance development was affected by strikes, weatherrelated restrictions, and the cessation of transport contracts for Arriva Trains Wales (October 2018) and the Tyne and Wear Metro (March 2017). The delayed implementation of the North of England rail infrastructure program
and timetable changes µ129 also had negative effects.The economic development was notably impacted, es
pecially by developments at Arriva Rail North. The en suing expenses, including the cost of materials, could not be offset. As a result, the development of operating profit was weaker.
◊ Revenue development was positive because of higher support payments and revenues from fares. In contrast, the cessation of the Arriva Trains Wales and Tyne and Wear Metro services as well as negative exchange rate effects had a weakening impact.
◊ Other operating income (+ 24.7%) rose in particular because of financial contributions for projects costs (however, this was offset by other operating expenses being higher).
The development of expense items was mainly driven by Arriva Rail North:
◊ The notable increase in the cost of materials (+9.4%) was primarily a result of higher expenses for rail replacement transport, infrastructure utilization and maintenance. Ex change rate effects reduced expenses in this area.
◊ Personnel expenses (+2.0%) rose because of an in creased number of employees on average. Exchange rate effects, in contrast, reduced expenses.
◊ Other operating expenses (+4.1%) rose because of proj ect costs (however, this was compensated by other operating income being higher) and increased franchise payments.
◊ Depreciation was at the previous year’s level.
GR
OU
P M
AN
AG
EM
EN
T R
EP
OR
T
131
GROUP MANAGEMENT REPORT — DEvELOPMENT Of BUSiNESS UNiTS
fiN
AN
CiA
L S
TA
TE
ME
NT
SS
US
TA
iNA
BiL
iTY

Gross capital expenditures decreased slightly due to timing of contractual capital expenditure requirements.
The number of employees fell because of the cessation of the Arriva Trains Wales franchise. This was partially offset by recruitment at Arriva Rail North.
Mainland Europe line of business ◊ Challenging market and competitive environment and
strikes in the Netherlands had a dampening effect. ◊ Weather-related restrictions in the first quarter of 2018. ◊ Positive effects from acquisitions.
Mainland Europe line of business 2018 2017
Change
absolute %
Passengers (bus) (million) 781.0 747.9 + 33.1 + 4.4
Passengers (rail) (million) 122.7 100.7 +22.0 +21.8
Volume sold (rail) 1) (million pkm) 2,270 2,243 +27 +1.2
Volume produced (bus) (million bus km) 721.2 721.9 – 0.7 – 0.1
Volume produced (rail)(million train-path km) 53.5 51.5 + 2.0 + 3.9
Total revenues (€ million) 2,210 2,158 + 52 + 2.4
External revenues (€ million) 2,112 2,083 + 29 + 1.4
EBITDA adjusted (€ million) 351 323 + 28 + 8.7
EBIT adjusted (€ million) 193 165 + 28 + 17.0
Gross capital expenditures (€ million) 204 148 + 56 + 37.8
Employees as of Dec 31 (FTE) 26,256 25,723 + 533 + 2.1
1) Previous year’s figure adjusted.
The performance development in the Mainland Europe line of business was positive:
◊ The number of passengers, volume sold and volume produced increased in rail services (mainly due to the elimination of restrictions by construction work carried out in Sweden in the previous year). Strikes in the Netherlands, in contrast, had a dampening effect.
◊ The number of bus passengers generally rose because of the acquisition of Autotrans (August 2017) and VT Arriva (December 2018). The volume produced was at the previous year’s level.
The economic development was positive: this was due to a one off effect in addition to the acquisitions. In contrast, weatherrelated restrictions in Sweden and strikes in the Netherlands had a dampening effect.
◊ Revenue development was especially positive due to acquisitions. Exchange rate effects, in contrast, had a dampening impact.
◊ Other operating income (+ 1.2%) was close to the previous year’s level.
The development of expense items was mainly driven by the acquisitions and a positive onetime effect:
◊ The increase in the cost of materials (+ 5.6%) related to the acquisitions and shift from other operating expenses not affecting profits. Exchange rate effects and the refund of fuel duty in the Netherlands, particularly from previous years, had an offsetting positive effect.
◊ Personnel expenses (+0.9%) increased slightly, partly because of the acquisitions and skills shortages on the Central and Eastern European labor market. Exchange rate effects had an offsetting effect.
◊ The decrease in other operating expenses (–3.7%) was a result of shifts to cost of materials not affecting profits.
◊ Depreciation (+0.6%) was at the previous year’s level.Capital expenditures increased considerably due to preparations for the commissioning of the new Northern Line contract in December 2020, in the Netherlands. Capital expenditures also increased in Italy and Sweden.
The number of employees rose mainly because of the acquisition of VTArriva. The cessation of a transport contract in the Netherlands (December 2018) had an offsetting effect.
External revenue structure by countries (%) 2018 / 2017
The Netherlands ◊ 29.9 ◊ 30.2
Denmark ◊ 15.4 ◊ 15.4
Sweden ◊ 14.9 ◊ 16.4
Italy ◊ 10.5 ◊ 10.4
Czech Republic ◊ 8.1 ◊ 8.1
Spain ◊ 5.0 ◊ 4.7
Slovakia ◊ 4.5 ◊ 4.6
Portugal ◊ 2.8 ◊ 2.8
Other ◊ 8.9 ◊ 7.4
The external revenue structure did not change significantly. The decline in Sweden was a result of the weather related restrictions at the start of 2018.
Deutsche Bahn Group 2018 Integrated Report
132

Freight transport and logistics
Positive general framework German freight transport market continues to growIn 2018, the German freight transport market µ60 grew for the sixth consecutive year.
Rail continues to grow In 2018 the Federal Statistical Office of Germany carried out a comprehensive, retroactive revision of the reporting scope for the rail freight transport statistics from 2016 onwards and in doing so performed a qualitative revision. The deviations that occurred up until that date, for example compared to the results of the market observation by the BNetzA and in the developments in train-path kilometers as re ported by DB Netz AG, were largely clarified and now provide a much improved picture of actual development on the German rail freight transport market.
The volume sold of freight railways in Germany increased more strongly than in the previous year under a highly com-petitive environment while taking into account the ex -pansion of the reporting scope. The market share for rail showed a slight positive development, supported by the heavy losses of inland waterway transport.
◊ Alongside positive economic stimulation overall, it was also supported by a baseline effect following several weeks of closure of the Rhine Valley section at Rastatt in the previous year and shifts due to restrictions in inland waterway transport.
◊ Dampening effects resulted from factors such as the con- tinued decline in coal transport as a result of the energy transition, as well as portfolio adjustments by the energy producers, problems in the automotive industry due to new measurement procedures to determine exhaust gas emissions, weak steel production, strikes in France, restrictions due to storms and resource issues.
◊ The development of individual types of goods could not be quantified through the changes to the reporting scope as made by the Federal Statistical Office of Ger-many. A strong growth contribution is expected for com bined transport. This was supported by non-Group rail ways, which, as in recent years, recorded an above- average per formance increase overall.
◊ The DB Group share in the rail freight transport market declined further, bringing the share more or less on the same level with that of non-Group railways.
Road gains further market shareThe development of road freight transport became even more dynamic. Its market position was further extended.
◊ According to toll statistics issued by the Federal Agency for Freight Transport (Bundesamt für Güter verkehr; BAG), vehicles registered abroad, particularly trucks from Po -land, Lithuania, Romania, Slovenia and Bulgaria, showed above-average growth once again. The share of vehicles registered abroad in growing cross- border trans port is currently estimated at over 90%. It also gained in creas- ing importance in cabotage transports with double-digit growth rates.
◊ The truck market in 2018 was marked by increasing con-straints on available resources. Alongside increasing staff costs, significant increases in diesel costs and the expansion of truck tolls to cover the entire long-distance highway system led to marked cost increases.
◊ The performance development was supported by sus-tained positive stimulation from the construction sector, dynamic domestic and international demand for con-sumer and industrial goods, and by shifts from other modes of transport due to weather- and quality-related restrictions.
Inland waterwaysInland waterway transport showed very negative develop-ment. The market share fell and reached a historical low.
◊ Following on from the heavy losses in the first quarter of 2017 due to low water levels, 2018 recorded a strong start to the year for waterway transport. In spite of this, the repeated restrictions resulting from several months of low water levels throughout the waterway network sig-nificantly halted development. In the last third of 2018 performance fell by over 40% at times.
◊ Cross-border traffic, which has a share of about 80% of overall performance, was affected with particular sever- ity. The Rhine, by far the most important waterway for inland waterway transport, reached its lowest ever recorded water levels in October 2018, at about 30 cm at the Kaub gauge (Middle Rhine). Above-average drops were recorded in the coal and coke/mineral oil prod-ucts division.
GR
OU
P M
AN
AG
EM
EN
T R
EP
OR
T
133
GROUP MANAGEMENT REPORT — DEvElOPMENT Of bUsiNEss UNiTs
fiN
AN
CiA
l s
TA
TE
ME
NT
ss
Us
TA
iNA
bil
iTY

European rail freight transport market above previous year’s levelVolume sold in European rail freight transport (EU 28, Switzerland and Norway) showed a slightly weaker increase in 2018 compared to the previous year. The performance increase was supported by strong global demand for cap-ital goods and the revival of production in Europe and of European trade. Positive momentum was generated mainly from transport through the North Sea ports of Antwerp, Rotterdam and Hamburg. Combined transport made a strong growth contribution once again. There was also strain due to the sustained decline in development within coal and due to the major strikes in France.
Among the top railways in Europe, PKP Cargo was able to increase its volume sold most significantly compared to the previous year. In the European DB Cargo network, volume sold remained lower than in the previous year. The reason for this is the weak development in Western and Central Europe.
European land transport shows growth ◊ The European land transport market reported strong
growth in 2018, with DB Schenker continuing to assert its position as market leader.
◊ Increasing volumes at increasing sale prices led to rev-enue growth despite changes in the shipping structure for lower shipment weights.
◊ The risks due to various cost drivers persist: changes in the shipping structure (weight decreases, more flexible transport requirements) led to cost increases, more rises in carrier costs and a further lack of drivers.
Air freight remains a growth market ◊ The international air freight market again showed solid
growth in 2018. Although this development was con-siderably weaker than in the previous year, there was still clear growth. The first quarter of 2018 was still positively influenced by the extremely strong growth in 2017, after which point general development flattened out somewhat before finally becoming negative in the fourth quarter of 2018.
◊ The economic environment and the continued e-com-merce trend also had a favorable impact.
◊ The markets in North Asia and Western Europe showed particularly good trends, with the main driver being automobile and chemical goods transport, while other industries also recorded positive growth. The strongest growth in terms of tonnage was on the trade route between Asia and Europe. This was also reflected in global rate development, which severely collapsed in the first quarter after the peak season in 2017, and sub-sequently demonstrated consistent recovery from the second to fourth quarters.
◊ DB Schenker recorded volume growth in air freight com-pared to the previous year.
Ocean freight grows compared to previous year ◊ The global growth of container ocean freight in 2018
was at the level of the previous year. Volume growth was recorded on all major routes. Intra-Asia recorded the highest volume growth at about 5.7%. The Asia — Europe trade route grew by about 3.5%.
◊ Despite increasing fuel prices in the first quarter of 2018, freight rates remained relatively constant through out the year. Transpacific trade is an exception to this, with freight rates strongly rising in the second half of the year. This is largely due to the threat of a tariff war be -tween the USA and China.
◊ DB Schenker increased its volume of ocean freight com-pared to the previous year.
Persisting momentum in contract logistics ◊ The global market for contract logistics continued to
show above-average growth in 2018. The figures for Asia/Pacific, the Americas and Europe were above ex -pectations. Thanks to a high volume of new business contracts in these regions, this trend will continue despite slight economic slowdown.
◊ The vertical markets of electronics and industrial/aero-space are considerable drivers of this development, while consumer/retail stagnated in 2018.
Db Cargo business unitbusiness modelWith about 4,200 customer sidings in Europe, DB Cargo provides its customers with access to one of the biggest rail networks in the world and is thus the number one in European rail freight transport. The dense, international network stretches along the huge European freight trans-port corridor. It provides rail transport throughout Europe in the segments block trains, single wagon and combined
Deutsche Bahn Group 2018 Integrated Report
134

transport. Individual industry solutions within the indus-trial, intermodal and logistics sectors complete the range of services offered. Mainly self-owned traction units and freight cars are used to provide services. The key industries served are the iron, coal and steel (montan), chemicals, auto- motive and construction materials, industrial goods and consumer goods, as well as intermodal transport. The cus-tomer structure is characterized by major customers. The premiere key performance indicator is volume sold mea-sured in ton kilometers. The relevant capacity utilization figure is measured in tons per train. The cost structure is mainly influenced by volume produced in train kilometers. Major cost drivers are personnel, infrastructure and main-tenance expenses.
The most important source of revenue is the transport of goods by rail. Key resources are customer relationships, a good level of logistical customer understanding, motivated and well-trained employees, along with the efficient use of rolling stock and a capacity-related high-quality infrastruc-ture. The intra-Group infrastructure companies and service providers are important suppliers in this respect.
Markets and strategyDB Cargo operates a close-knit international network and is active in 17 European countries. This unparalleled net-work is the foundation for building on DB Cargo’s leading position in the European rail freight transport market and repositioning on the market as an international integrated railway logistics provider by 2030.
!!!
Resources/inputs
D B C A R G O B U S I N E S S M O D E L
Customer segments
◊ Business customers with a focus on automotive, construction materials, chemicals, industrial goods, intermodal, consumer goods and iron, coal and steel
Employees
About 28,800
Networks and infrastructure
Active in 17 European countries, about 4,200 customer sidings, 10 marshaling yards and 22 maintenance facilities
Value proposition
◊ DB Cargo offers customer-oriented, reliable and efficient transport solutions across Europe.
Customer access and retention
◊ Segment sales with key account management
◊ Regional sales
◊ Telephone sales
◊ Customer service center
Key activities
Conducting transport by train
Designing European transport solutions
Preparing and maintaining vehicles
services/outputs
Freight carried
256 million t
Volume sold
88 billion tkm
EBIT adjusted Æ
€ –190 million
Employee † satisfaction
SI of 3.5
Customer satisfaction ¿
SI of 60
Final energy consumption ¥
–20.4% compared to 2006 (specific)
Punctuality ¿
72.8 %
Outcomes
Vehicles
2,686 locomotives, 82,895 cars
Additional production factors
2.2 billion kWh traction current, 151 million liters diesel fuel
Planning and operating networks
Providing supplemental logistical services
GR
OU
P M
AN
AG
EM
EN
T R
EP
OR
T
135
GROUP MANAGEMENT REPORT — DEvElOPMENT Of bUsiNEss UNiTs
fiN
AN
CiA
l s
TA
TE
ME
NT
ss
Us
TA
iNA
bil
iTY

Rail freight transport in Germany and Europe will see con-siderable growth by 2030. On the one hand, the entire European freight transport market will see further gains thanks to stable global economic development and the rise in intra-European trade and, on the other hand, climate change will necessitate a shift from road to rail. There are further growth expectations as a result of an expanded cus- tomer base, particularly due to the stronger participation of rail freight transport in growing transport demand from the consumer and capital goods industry and combined transport. The digital and technological upgrades to oper-ations play a crucial role in further performance growth in rail freight transport. Important levers include (partially) automated driving and shunting, digital operation and fleet control, as well as predictive maintenance based on intelli-gent rolling stock. The removal of operational barriers in the cross-border traffic growth area is a significant oppor-tunity for rail freight transport.
Policy in Germany has created significant initiatives for modal shifts from the road to the rail. The master plan for rail
freight transport µ63 and the Climate Protection Plan 2050 have improved the framework conditions for rail freight transport. Central thematic areas here include the increased performance capacity of the infrastructure, the digitaliza-tion and automation of rail freight transport and the promo-tion of multimodal traffic concepts. In addition, train-path price support was agreed to provide rail at a more attrac-tive price compared to road in the short term.
DB Cargo’s volume sold and revenues have been in decline for several years. This development is reflected in the operating profit. The improvement measures have not achieved the desired success thus far due to insufficient and inflexible production capacity. As a result, the restruc-turing of DB Cargo is in the focus of the new Agenda for a
better Railway µ66 ff.
◊ Economic ¿ dimension: We are applying a consistent growth strategy so that we can continue in our mission as the leading European rail freight transport com pany and achieve a trend reversal in quality, revenues and profitability in 2019. Given the high fixed costs, the busi-ness can only be competitive and fit for the future if the resources we deploy are sufficiently productive. Rev-enue growth is based on increasing our own production capacity and making it more flexible, thereby im proving transport quality on the rail. We are working to achieve the target by implementing three sets of measures in the near future:
◊ “Smoothly through the network”: We quickly and sustainably remove operational barriers in the pro-duction process. We also address resource bottle-necks by hiring more operating personnel and investing in rolling stock. We efficiently allocate resources through improved processes and IT, in -creasing reliability and staff and asset productivity through a performance pact with employees. We are driving the digital and technological renewal of operating and maintenance processes.
◊ “Growing confidently with our customers”: We are increasing revenues by consistently harnessing our advantages and the advantages of rail as a system in long-distance transport. This means taking a pio-neering role in the growth segment of cross-border European transport and using our many years of ex -perience and expertise in the rolling stock life cycle management segment to build on our work with roll- ing stock. In addition, we enable stronger revenue growth by further developing the established trans-port segments of single wagon, block train and com-bined transport, taking into account changed cus-tomer needs, and strengthening DB Cargo’s market awareness as a solution-oriented rail logistics ser-vice provider and innovative road-to-rail transport provider.
◊ “Efficiency and excellence as maxims”: We stringently orient processes, management and leadership based on customer needs and we design our business pro-cesses to be as lean as possible so that we can im prove our efficiency. We achieve process excellence by establishing process owners, applying lean principles and digitalizing core processes. We are work ing to improve corporate management by im plement ing performance management formats across the board and creating a greater focus on achieving goals for the company as a whole by looking toward the oper-ational and production system units and corridors. Leadership excellence supports incentives for a stronger customer focus, for proactively taking re -spon sibility and demonstrating important leadership qualities in the process. Overall, this will help us to achieve greater productivity, which will benefit our customers.
!!!
Deutsche Bahn Group 2018 Integrated Report
136

◊ social † dimension: Our goal is to be a top employer in Europe. To this end, we will use the employee survey, for example, as a feedback instrument for assessing the measures we have initiated. We see the core of our European HR work as being in digitalization, demog-raphy and diversity. We want to impart skills to, and develop, our executives and employees through tar-geted measures. To give a permanent lift to our em -ployee satisfaction, we are refining our feedback tools and communication and dialog platforms. In this way, we ensure that we are working together on the further development of DB Cargo and we prepare for trends in the logistics market.
◊ Environmental ¥ dimension: We will reinforce rail freight transport as being an environmentally and climate- friendly means of transport and use this as a base from which to reduce greenhouse gases through transport shifts. We are developing sustainable transport solu-tions and modernizing our fleet for this purpose. We will equip our entire active German fleet of freight cars with
quiet brake shoes µ92. By 2020, we will have reduced our specific final energy consumption by 21% compared with 2006. We are pushing the use of hybrid technology, while the research project Construction and testing of
innovative freight cars µ92 will test further develop-ments in freight cars and innovative components for sustainable and environmentally friendly rail freight transport. We underscore our position as an eco-pio-neer by providing eco-friendly offerings such as DbEco
plus no. 1 (CO₂-free rail transport) and DbEco neutral
no. 32 (CO₂-neutral transport). Furthermore, we are identifying potential energy savings through our pro-grams Green Maintenance and Energy Management.
Digitalization and innovation ◊ The freight car fleet in Germany is to be fitted with the
latest telematics and sensors by 2020. About 10,000 refitted freight cars are already on the way. To this end, we are investing an amount in the double-digit millions.
◊ The innovative freight car µ92 project has begun opera-tional testing. The project is being implemented by DB Cargo in cooperation with VTG AG on behalf of the BMVI.
◊ Additional features have been added to myRailportal to make it easier to access rail freight transport. Order placement, empty car orders, shipment tracking and billing are automated and fully supported on the portal.
Environmental measures ◊ By optimizing the engine characteristic maps no. 130 in
engine control, DB Cargo is reducing fuel consumption and greenhouse gas emissions. The engine control system was optimized on just under 400 shunting loco-motives. This saves 800,000 liters of fuel and 2.1 mil-lion kg of CO₂. This corresponds to about a 3% reduction in fuel needs. The saving was demonstrated during test runs.
◊ We are holding an Energy-saving Olympics no. 8 for DB Cargo section train drivers. Over the course of 36 monthly events and six super-scale events, over 2,400 train drivers have already been honored for their outstanding performance.
◊ In 2019, DB Cargo equipped an additional 150 traction units with the LEADER driver assistance system. Since the end of 2018, about 500 vehicles have been operating with the system.
Development in the year under review ◊ Restrictions, especially in Germany, due to continuing
strain on transport quality (resource problems). ◊ Strikes in France had adverse effects on development. ◊ Positive business development in Eastern Europe.
Rail freight transport punctuality was at the previous year’s level. Improved punctuality, including in Great Britain and the Netherlands, compensated for a fall in punctuality in Germany caused by a heavily utilized infrastructure. At the same time, external interference once again had a negative effect on punctuality development in the year under review.
Customer satisfaction deteriorated significantly due to problems in reliability and punctuality. Since 2017 we have been surveying about 1,000 customers annually on cus-tomer satisfaction.
Performance development also noticeably declined. This was largely driven by Western Europe and Central Europe. The freight carried, volume sold and volume pro-duced declined. By contrast, capacity utilization per train recorded slightly positive development.
GR
OU
P M
AN
AG
EM
EN
T R
EP
OR
T
137
GROUP MANAGEMENT REPORT — DEvElOPMENT Of bUsiNEss UNiTs
fiN
AN
CiA
l s
TA
TE
ME
NT
ss
Us
TA
iNA
bil
iTY

The economic development remained tense. The decline in income, combined with slightly increased expenses, led to considerable declines in operating profit figures.
◊ 83% of revenues were generated in Central Europe, 12% in Western Europe and 5% in Eastern Europe. Revenues fell slightly, which was largely due to resource bottle-necks and strikes in France. Exchange rate effects also had a noticeable negative impact. There were positive accounting-related effects on revenues as a result of switch ing from the freight settlement procedure with foreign railways to a service procurement model.
◊ Other operating income (+ 15.1%) increased in partic-ular due to train-path price support µ63 (opposite effect in revenues) and locomotive sales in Romania. The omis-sion of the effect of the reimbursement of the nuclear fuel tax in the previous year had a dampening effect.
Expenses recorded a slight increase driven by personnel expenses:
◊ The cost of materials (– 0.2%) was below the previous year’s level, which was due to exchange rate and other effects. Lower train-path and energy expenses also had a moderating effect on the rise in purchased transport services.
◊ Personnel expenses (+ 2.2 %) increased as a result of collective bargaining agreements.
◊ Other operating expenses (+ 4.4%) increased, including due to higher expenses for vehicle rental and purchased IT services.
◊ Depreciation (+ 10.9%) increased, particularly due to capital expenditures and also as a result of IT project impairments.
Capital expenditure activities increased. Capital expendi-tures in Central Europe and Eastern Europe increased in particular as a result of higher capital expenditures in loco-motives and freight cars. In contrast, capital expenditures fell in Western Europe.
A total of 66% of employees are employed in Central Europe, 15% in Western Europe and 14% in Eastern Europe. The number of employees in Central Europe and Western Europe increased. This was counteracted by a reduction in employees in Poland as a result of a decline in the sidings business and sand mining business.
Employee satisfaction improved as a result of positive developments in patterns of working hours and further development.
The share of women in Germany increased compared to the previous year.
The reduction of specific final energy consumption com-pared to 2006 has become more pronounced.
!!!
DB Cargo 2018 2017
Change
2016absolute %
Punctuality (%) 72.8 72.7 – – 75.6
Customer satisfaction (SI) 60 67 – – –
Freight carried (million t) 255.5 271.0 – 15.5 – 5.7 277.4
Volume sold (million tkm) 88,237 92,651 – 4,414 – 4.8 94,698
Volume produced (million train-path km) 165.8 175.6 – 9.8 – 5.6 179.1
Capacity utilization (t per train) 532.3 527.5 + 4.8 + 0.9 528.8
Total revenues (€ million) 4,460 4,528 – 68 – 1.5 4,560
External revenues (€ million) 4,177 4,209 – 32 – 0.8 4,230
EBITDA adjusted (€ million) 54 130 – 76 – 58.5 108
EBIT adjusted (€ million) – 190 – 90 – 100 + 111 – 81
EBIT margin (adjusted) (%) – 4.3 – 2.0 – – –1.8
Gross capital expenditures (€ million) 587 328 + 259 + 79.0 304
Employees as of Dec 31 (FTE) 28,842 28,257 + 585 + 2.1 29,671
Employee satisfaction (SI) 3.5 – – – 3.4
Employee satisfaction – follow-up workshop implementation rate (%) – 96.5 – – –
Share of women in Germany as of Dec 31 (%) 11.3 10.6 – – 11.2
Specific final energy consumption compared to 2006 (based on tkm) (%) –20.4 –17.1 – – –17.1
Quiet freight cars in Germany as of Dec 31 50,409 39,604 +10,805 +27.3 32,396
√
Deutsche Bahn Group 2018 Integrated Report
138

Central Europe region ◊ Strained transport quality due to resource bottlenecks. ◊ Shortcomings in production quality leads to performance losses. ◊ The initial effects of the rail freight transport campaign.
Central Europe region 2018 2017
Change
absolute %
Freight carried (million t) 235.9 246.2 – 10.3 – 4.2
Volume sold (million tkm) 71,343 74,780 – 3,437 – 4.6
Volume produced (million train-path km) 134.0 140.9 – 6.9 – 4.9
Total revenues (€ million) 4,852 4,836 + 16 + 0.3
External revenues (€ million) 3,451 3,431 + 20 + 0.6
EBITDA adjusted (€ million) 75 160 – 85 – 53.1
EBIT adjusted (€ million) – 98 6 – 104 –
Gross capital expenditures (€ million) 521 270 + 251 + 93.0
Employees as of Dec 31 (FTE) 18,991 18,494 + 497 + 2.7
Performance development in Central Europe declined due to the effects of the strike in France and as a result of re source problems (staff and freight cars). By contrast, capacity uti-lization improved slightly.
The economic development was negative: the income in creases were not sufficient to offset increased expenses and as a result operating profit figures fell significantly.
◊ Despite the decline in performance, there was slight rev-enue growth. This was as a result of the positive effects of switching from freight distribution to service pro-curement, among other factors.
◊ Other operating income (+ 23.1%) increased in partic-ular due to train-path price support µ63 (opposite effect in revenues).
◊ The cost of materials (+ 3.2%) increased, mainly as a result of increases in purchased transport services. Lower expenses for energy as well as reduced expenses for train-path utilization due to price and quantity had a moderating effect.
◊ Personnel expenses (+ 2.8%) increased, despite a lower average number of employees, as a result of wage increases.
◊ The rise in other operating expenses (+ 7.2%) primarily resulted from higher levels of purchased IT services and damage compensation expenses.
◊ Depreciation (+ 11.7%) rose as a result of the impair-ment of IT projects and due to increased capital expen-ditures for locomotives and freight cars.
Gross capital expenditures increased significantly, in par-ticular due to higher expenditures in locomotives and freight cars.
The number of employees increased particularly as a result of new hiring to meet the need for staffing in opera-tional functional groups and due to employees being taken on as part of new business, including in Belgium and Italy.
Western Europe region ◊ Strikes in France put a strain on development. ◊ Portfolio adjustments in Great Britain. ◊ Restructuring measures in Great Britain
and France move ahead.
Western Europe region 2018 2017
Change
absolute %
Freight carried (million t) 48.5 55.4 – 6.9 – 12.5
Volume sold (million tkm) 11,910 13,255 – 1,345 – 10.1
Volume produced (million train-path km) 23.6 26.8 – 3.2 – 11.9
Total revenues (€ million) 640 668 – 28 – 4.2
External revenues (€ million) 516 544 – 28 – 5.1
EBITDA adjusted (€ million) 48 41 + 7 + 17.1
EBIT adjusted (€ million) – 9 – 12 + 3 – 25.0
Gross capital expenditures (€ million) 47 48 – 1 – 2.1
Employees as of Dec 31 (FTE) 4,365 4,207 + 158 + 3.8
In Western Europe freight carried, volume sold and volume produced fell considerably. Negative development in Great Britain, including as a result of portfolio adjustments in the segments intermodal, biomass, coal and chemicals and within construction and defense, put additional strain on performance development.
The economic development was stronger than in the previous year: the fall in expenses was more than compen-sated for by reduced income, which meant that operating profit figures improved.
◊ Revenues declined for performance and exchange rate reasons, in particular due to negative developments in Great Britain.
◊ Other operating income (– 11.8%) declined, especially in Great Britain due to the loss of income from an in-vestment transaction in the previous year and lost income from locomotive and freight car sales. Compen-sations for damage from SNCF to Euro Cargo Rail (ECR) as a result of strikes in France had a moderating effect.
◊ Cost of materials (– 8.0%) declined due to exchange rate effects and the reduced performance volume.
◊ Personnel expenses (– 5.9%) fell as a result of restruc-turing measures. This was offset by new hiring of oper-ational personnel in Great Britain at year-end.
◊ Depreciation increased as a result of IT project impair-ments.
◊ Other operating expenses (– 6.5%) fell as a result of low rental expenses and the release of provisions in Great Britain. Exchange rate effects also had a negative impact.
Gross capital expenditures fell. This primarily resulted from the overhaul of locomotives in Great Britain and France.
The number of employees in operational roles and within machine-building and infrastructure increased, among other areas. The decline in locomotive drivers had a counteractive effect.
!!!
GR
OU
P M
AN
AG
EM
EN
T R
EP
OR
T
139
GROUP MANAGEMENT REPORT — DEvElOPMENT Of bUsiNEss UNiTs
fiN
AN
CiA
l s
TA
TE
ME
NT
ss
Us
TA
iNA
bil
iTY

Db schenker business unitbusiness modelDB Schenker serves established markets and emerging national economies as an integrated transport and logistics services provider with a global network. In land transport, the dense network connects the most important economic regions in Europe. Services include time and cost-optimized services for general cargo, partial and full load transport along with door-to-door solutions across Europe. As one of the global leaders in air and ocean freight, DB Schenker offers the entire range of services in this segment. In con-tract logistics, the services offered cover all stages of the value-added chain from supplier to producer/trade, end customers and spare parts service. The core area of exper-tise is the planning and handling of complex global supply chains, including sustainable logistics concepts.
DB Schenker has a global customer base in a wide range of industries and a focus on industrial customers. The ver-tical market approach is aimed at developing industry-spe-cific solutions. Major customers are provided with tailored solutions as global accounts.
In air and ocean freight, we act solely as a freight for-ward er without our own aircraft and ships. In some segments of land transport, we use our own vehicles and containers. Transshipment terminals and warehouses are gen erally our own property or are leased over the longer term.
Motivated and well-trained employees are key resources for a service provider. Close customer relationships and industrial expertise are extremely important. Efficient IT is also essential for good product and service quality.
In addition to airlines and shipping companies in air and ocean freight, our major partners include land transport subcontractors for the supply of transport services.
Performance measurement depends on the line of busi-ness: for land transport, the key indicator is the number of shipments; for air freight, it is the tonnage billed; while in ocean freight, it is the freight volume, measured in TEU. There is no comparable volume measurement in the con-tract logistics segment. In this case, market comparisons are usually made on the basis of revenues. DB Schenker has a relatively low capital intensity and real net output ratio. About 70% of revenues in the transport business lines come from procured intermediate services. Therefore, optimizing these purchase relationships and balancing var-ious influential success factors such as transport relations, vol ume, weight and mode of transport represents an im -port ant factor for success and a value driver. The same ap plies to managing fluctuations in freight rates and the specific surcharges to these freight rates. In particular, the effective and efficient use of personnel resources is a key
Eastern Europe region ◊ Performance development was largely positive. ◊ Adjustment to the transport portfolio in Poland. ◊ Increased personnel costs in Poland.
Eastern Europe region 2018 2017
Change
absolute %
Freight carried (million t) 16.7 17.3 – 0.6 – 3.5
Volume sold (million tkm) 4,984 4,616 + 368 + 8.0
Volume produced (million train-path km) 8.1 8.0 + 0.1 + 1.3
Total revenues (€ million) 309 314 – 5 – 1.6
External revenues (€ million) 210 216 – 6 – 2.8
EBITDA adjusted (€ million) 25 21 + 4 + 19.0
EBIT adjusted (€ million) 11 8 + 3 + 37.5
Gross capital expenditures (€ million) 19 10 + 9 + 90.0
Employees as of Dec 31 (FTE) 3,914 4,076 – 162 – 4.0
Performance development in Eastern Europe based on vol-ume sold and volume produced showed positive develop-ment. By contrast, the freight carried fell including as a result of the lower traffic volumes in the logistics and inter-modal divisions in Poland.
The economic development was weakened: the adjusted EBITDA and EBIT profit figures improved, particularly as a result of income from the sale of locomotives.
◊ Revenues declined, largely due to exchange rate effects. This development was strengthened by a performance- related decline in the sand mining business in Poland and the loss of transport services in China. Price effects had a moderating influence.
◊ Other operating income (+ 14.3%) increased, including as a result of locomotive sales in Romania and damage compensation payments in Poland.
◊ Cost of materials (– 8.7%) fell as a result of exchange rate effects, lower transport service purchases and lower maintenance expenses in Poland.
◊ Personnel expenses (+ 5.7%) rose due to wage increases, which were driven among other factors by a strained labor market and national minimum wage policy in Eastern Europe.
◊ Other operating expenses (+ 22.2%) increased. This was due to the costs of disposal incurred during locomotive sales in Romania, among other factors.
◊ Depreciation was at the previous year’s level.Capital expenditures increased sharply. This was largely due to capital expenditures on maintenance facilities and loco-motive projects.
The number of employees declined, particularly due to optimization measures in Poland. This was offset by an in -crease in the number of employees in Southeastern Europe.
!!!
Deutsche Bahn Group 2018 Integrated Report
140

driver below gross profit. This is of particular importance in the contract logistics line of business. Here, know-how and experience relevant to the industry are an essential suc-cess factor in the optimal design of intra-company logistics processes. Effective IT support is also especially important.
The most important sources of revenues are transport and logistics services, including added value services such as the assembly of modules or assemblies in the automo-bile industry or putting together special sales packaging for the retail sector.
Markets and strategyDB Schenker holds a leading market position in all market segments – European land transport, global air and ocean freight, as well as contract logistics. Our vision is to be the
leading integrated supplier of transport and logistical ser-vices with a global reach. We want to strengthen and ex -pand our leading market position. With its PRIMUS strategy, DB Schenker intends to significantly increase profitability and focus its portfolio even more on international growth markets.
A comprehensive transformation program was launched to drive change in the three core areas of growth, efficiency and culture.
The individual business lines of land transport, air and ocean freight and contract logistics are developing measures and putting them into practice. In addition, over arching issues are being managed centrally. Examples include com-prehensive programs to increase efficiency, which in volve implementing new management practices among other plans.
D B S C H E N K E R B U S I N E S S M O D E L
Resources/inputs
Customer segments
◊ Business customers with a focus on automotive, chemicals, consumer, electronics, healthcare, industrials, retail and semiconductors/solar
Employees
About 75,800
Networks and infrastructure
More than 2,100 locations in over 130 countries, including 430 locations in land transport and 800 global locations in air/ocean freight, 8.3 million m² in warehouse space in contract logistics worldwide
Value proposition
◊ DB Schenker offers customer-oriented, reliable and eco-friendly integrated solutions in transport and warehousing worldwide.
Customer access and retention
◊ Branch offices with territorial distribution
◊ Key account management
◊ E-services
Key activities
Planning and operating global networks
Implementing/organizing transport and warehousing services
Purchasing cargo space
services/outputs
Land transport shipments
106 millions
Air freight volume (export)
1.3 million t
EBIT adjusted Æ
€ 503 million
Greenhouse gas emissions ¥
– 61.2 % (ocean freight), – 9.3% (air freight) and –25.8 % (land transport) compared to 2006 (specific)
Customer ¿ satisfaction
SI of 71
Employee † satisfaction
SI of 3.8
Outcomes
Vehicles
About 31,000 vehicles regularly used (including externally without a spot market)
Providing supplemental logistical services
Ocean freight volume (export)
2.2 million TEU
GR
OU
P M
AN
AG
EM
EN
T R
EP
OR
T
141
GROUP MANAGEMENT REPORT — DEvElOPMENT Of bUsiNEss UNiTs
fiN
AN
CiA
l s
TA
TE
ME
NT
ss
Us
TA
iNA
bil
iTY

Digitalization is increasingly gaining in importance as a driver of disruption in the logistics industry. DB Schenker therefore has a dedicated digitalization unit. This unit’s mission is to promote data-driven business models, online platforms and technical innovations worldwide.
◊ Economic ¿ dimension: The central challenge is to be able to respond more quickly to market demand. For this, we rely on processes distinguished by standardiza-tion as well as industrialization. By consistently adapt- ing supply chains we meet customer expectations while deepening the customer relationship. The focus is also on the further expansion of integrated and innovative solutions for the entire logistics chain. Our objective is to grow profitably and increase the EBIT margin on a sus- tainable basis. We strive toward growing more strongly than the market in all segments and maintaining our leading market positions. In pursuing this goal, we are further enlarging and developing our global network. Particular focus is on the expansion and harmonization of our global IT landscape. We are also developing new digital products and services that improve both cooper-ation with our subcontractors and our ability to deliver on our promise of performance to customers.
◊ social † dimension: We aim to be the top employer in logistics. Satisfied employees are a prerequisite for sat-isfied customers. In order to achieve our targets, we are strengthening our corporate culture and expanding our individual and international career development pro-grams. Moreover, we offer a modern, family-friendly and diverse working environment.
◊ Environmental ¥ dimension: We actively build upon our extensive know-how in green logistics. We use our Eco Operations to record, assess and increase the energy and material efficiency of our internal processes. With Eco Procurement, we focus on the purchase of CO₂-friendly services from our carriers and sub-providers. The tools we use in this effort include our preferred carrier portfolio, our carbon reduction agreements and our environmental partnerships with top carriers. Eco Transparency includes instruments that can be used to calculate the carbon footprint even more precisely. Through Eco Consulting no. 12, we offer our customers consultation services through which they can improve their carbon footprint.
Development of the network ◊ Near Dubai airport, DB Schenker is building its second
logistics hub µ143 in the region. This is DB Schenker’s largest capital expenditure in the Middle East and Africa region to date. It will become DB Schenker’s first loca-tion in the world to be powered 100% by solar energy.
Progress in implementation of PRiMUsA large number of initiatives were implemented in the year under review that move DB Schenker forward on the way to becoming the sector’s leader, its PRIMUS.
◊ Growth: The business development programs for all products were among the factors that contributed to an overall increase in revenues during the year under review of over € 1 billion. This included targeted regional spe-cialization in key customers in the software industry, for instance.
◊ Efficiency: By further expanding the Global Business Service Center in Bucharest and Manila, DB Schenker consistently increased its efficiency in the year under review. Furthermore, there was major progress toward a more transparent and faster corporate management approach, including as a result of new standards in con-trolling global cost development.
◊ Culture: Following its launch in the previous year with 133 top executives, almost 6,000 employees were in -volved as catalysts in the program “The future is here” during the year under review. They are pushing for cul-tural transformation, which should help bring DB Schenker to the top position in the industry.
Digitalization and innovation ◊ DB Schenker and Cisco are working together to shape
the digitalization transformation. A joint innovation lab was opened in Houston, Texas/USA for testing and mar-keting new technologies for logistics.
◊ Customers can use the eSchenker online portal to con-figure and order 3-D printing. For example, stainless steel medical devices, plastic robot grippers or custom-ized packaging materials are currently being printed.
◊ DB Schenker’s new online platform, connect 4 land, enables customers in Europe, including in Germany, Spain and France, to make immediate requests online for general cargo transports throughout Europe and to book these directly. The new platform is especially
!!!
Deutsche Bahn Group 2018 Integrated Report
142

suited to smaller and medium customers. Similar devel-opments are being prepared for air and ocean freight. In the process, DB Schenker is further implementing its digitalization strategy in a consistent way.
Environmental measures ◊ DB Schenker has joined the EV100 initiative and in doing
so committed to switching all of its own vehicles with up to 3.5 t permitted total weight to electric power by 2030 and 50% of those with between 3.5 and 7.5 t.
◊ DB Schenker has acquired five Fuso eCanter fully elec-
tric trucks no. 122 from Daimler subsidiary CharterWay and is testing these in real production conditions in a number of German cities and one major European city. The 7.5-t battery-powered electric trucks have a range of about 120 km and support low-CO₂, zero-emissions delivery and pickup of general cargo shipments in the cities. The Fuso eCanter can achieve loads of up to 4.5 t depending on its configuration and use.
◊ DB Schenker, along with its preferred carrier, Hapag Lloyd, was able to proceed in the move from heavy oil to low-sulfur marine diesel in unregulated ports in coop-eration with top customers. An initial premium cus-tomer is paying a surcharge on all containers loaded in ports without sulfur emissions limits in order to finance low-sulfur fuel.
◊ As part of its lED lighting no. 50 measure, DB Schenker has switched to fully LED lighting at six locations in France, Austria and Spain. The anticipated energy saving is about 1,100 MWh per year.
◊ In Poland, 7.82 m extra-large swap bodies consistently replaced standard semi-trailer equipment on modern tractor units, thereby saving over 3 million transport kilometers, while at the same time achieving loads almost 4 t greater. By the end of 2018 this has already saved over 6,000 t of CO₂ equivalent.
◊ During its solar system no. 30 measure, DB Schenker built a 35,000 m² temperature-regulated warehouse in the United Arab Emirates with a 2.3 MWp photovoltaic power plant. The photovoltaic plant consists of 7,000 highly efficient 72-cell solar modules and other cut-ting-edge proprietary components, which are expected to generate about 85,000 MWh of power over their ser-vice lives. DB Schenker plans to use this plant to provide almost 100% of its own energy requirements for the building.
investments ◊ In late November 2018, DB Schenker took over a 51%
share of LogCap-IR Grundverwertungsgesellschaft mbH (LogCap GmbH) Vienna/Austria from Erste Bank Group AG. In 2005, the company was founded as a joint venture between Schenker&Co. AG, Vienna (49%) and Erste Bank Group AG (51%) to finance property invest-ments for Schenker&Co. AG in Central Europe. All three of the properties most recently owned by LogCap GmbH or its subsidiary LogCap s.r.o., Slovakia, are part of Schenker’s core network in Central Europe. The acquisi-tion has ensured that these properties will be available to DB Schenker in the long term.
Other events ◊ DB Schenker launched its “Premium 13” service in
Europe in the first half-year of 2018, which delivers goods by 1:00 p.m., while its “Premium 10” service guar-antees customers delivery by 10:00 a.m. on the fol-lowing day.
◊ For the third time in a row, DB Schenker received the award for best logistics services provider in the Rail category at the Asian Freight, Logistics and Supply Chain Awards (AFLAS). Continuous improvement of rail freight transport between Europe and Asia in terms of costs, delivery time and service options means we occupy a leading position in trans-Eurasian rail connections.
◊ DB Schenker operated the first block train carrying fresh agricultural produce from China to Russia. In the trial a train loaded with refrigerated containers took 17 days to travel from Chengdu to Moscow.
Changes in presentation of lines of business ◊ The land transport line of business now also includes
some of the land transport activities outside Europe, mainly in Asia/Pacific, North America and Mexico. This has caused major restrictions in comparability to the previous year.
◊ Activities in air and ocean freight are now each pre-sented in their own separate lines of business, excluding the activities of Fairs&Exhibitions and Global Projects.
GR
OU
P M
AN
AG
EM
EN
T R
EP
OR
T
143
GROUP MANAGEMENT REPORT — DEvElOPMENT Of bUsiNEss UNiTs
fiN
AN
CiA
l s
TA
TE
ME
NT
ss
Us
TA
iNA
bil
iTY

Development in the year under review ◊ Market and competitive environment with positive stimuli. ◊ Positive development in land transport, ocean and air freight. ◊ Comprehensive initiatives for reducing costs, improving
efficiency and digitalization.
Customer satisfaction deteriorated in the year under review. There are various causes for this. They include capacity problems, as well as the introduction of a new IT system, which did not always proceed smoothly. Since 2017 we have been surveying about 15,000 customers annually in 28 countries on customer satisfaction.
Volume development was positive in air and ocean freight. Land transport also recorded positive development overall.
The economic development was encouraging. The oper-ating profit figures showed positive development due to a rise in income. Gross profit (+ 5.3%) also grew, most mark-edly in air freight. The gross profit margin improved.
Revenues were generated 42% in land transport, 22% in air freight, 17% in ocean freight and 15% in contract logistics.
The adjusted EBIT was generated 25% in land transport, 35% in air freight, 16% in ocean freight and 18% in contract logistics.
◊ The main drivers of the positive revenue development were land transport and air freight. Contract logistics and ocean freight also developed positively when adjusted for exchange rate effects.
◊ Other operating income (– 11.3%) fell in the year under review.
On the expense side, quantity and freight rate develop-ments made themselves felt:
◊ Cost of materials (+ 2.9%) rose, particularly with in the air freight division as a result of freight rate developments.
◊ Personnel expenses (+ 4.7%) rose in the wake of a greater number of employees. The rise was even clearer when adjusted for exchange rate effects.
◊ Other operating expenses (+ 4.5%) rose in part due to the leasing of new space and higher levels of purchased IT services.
◊ Depreciation rose slightly at a low level.Capital expenditure activities increased. The growth resulted primarily from the regions of Europe and America, with Europe continuing as the focus of capital expenditures.
At the end of the year under review, 28% of employees were employed in land transport, 9% in air freight, 7% in ocean freight and 32% in contract logistics. The number of employees increased. The principal drivers were growth in volume and the hiring of temporary workers.
!!!
DB Schenker 2018 2017
Change
2016absolute %
Customer satisfaction (SI) 71 74 – – –
Shipments in land transport (thousand) 106,468 100,452 + 6,016 + 6.0 99,638
Air freight volume (export) (thousand t) 1,304 1,300 + 4 + 0.3 1,179
Ocean freight volume (export) (thousand TEU) 2,203 2,169 + 34 + 1.6 2,006
Total revenues (€ million) 17,050 16,430 + 620 + 3.8 15,128
External revenues (€ million) 16,973 16,345 + 628 + 3.8 15,059
Gross profit margin (%) 34.8 34.3 – – 36.0
EBITDA adjusted (€ million) 703 676 + 27 + 4.0 599
EBIT adjusted (€ million) 503 477 + 26 + 5.5 410
EBIT margin (adjusted) (%) 3.0 2.9 – – 2.7
Gross capital expenditures (€ million) 273 246 + 27 + 11.0 209
Employees as of Dec 31 (FTE) 75,817 71,888 + 3,929 + 5.5 68,388
Employee satisfaction (SI) 3.8 – – – 3.8
Employee satisfaction – follow-up workshop implementation rate (%) – 96.0 – – –
Share of women in Germany as of Dec 31 (%) 29.5 30.8 – – 31.9
Specific greenhouse gas emissions (land transport) compared to 2006 (based on tkm) (%) –25.8 –20.2 – – –16.3
Specific greenhouse gas emissions (air freight) compared to 2006 (based on tkm) (%) – 9.3 – 8.8 – – – 4.8
Specific greenhouse gas emissions (ocean freight) compared to 2006 (based on tkm) (%) – 61.2 – 60.7 – – – 60.3
√
Deutsche Bahn Group 2018 Integrated Report
144

Employee satisfaction is measured every two years, and remains at the same level as the 2016 employee survey.
The share of women in Germany fell slightly in the year under review.
The majority of DB Schenker’s greenhouse gas emis-sions are the Scope 3 emissions of our subcontractors. We have therefore developed a comprehensive monitoring system to monitor our carriers’ target development toward reducing greenhouse gas emissions overall. In the year under review, the reduction trend in ocean freight was maintained in view of additional market consolidations. In air freight, the reduction stabilized as a result of the carrier’s successive fleet replacement. In land transport, significant reductions were recorded based on increasing consolida-tion in the new hub structure, the use of extra-large swap bodies in Poland and as a result of a significant increase in the proportion of biofuels in Sweden. The market-based mixed cargo effects also contribute to this, having caused a reduction in emissions.
Land transport line of business ◊ Within the system and direct transport areas,
greater focus on international transport services. ◊ Price effects had a positive impact. ◊ Europe-wide cost reduction initiatives further
implemented.
Land transport line of business 2018 2017
Change
absolute %
Shipments in land transport (thousand) 106,468 100,452 + 6,016 + 6.0
Total revenues (€ million) 7,092 6,608 + 484 + 7.3
External revenues (€ million) 7,023 6,531 + 492 + 7.5
EBITDA adjusted (€ million) 196 163 + 33 + 20.2
EBIT adjusted (€ million) 125 94 + 31 + 33.0
Employees as of Dec 31 (FTE) 21,580 20,323 + 1,257 + 6.2
Activities previously allocated to contract logistics and other areas will be reported under the land transport line of business from the year under review onwards. This re-sulted in restrictions compared to the previous year.
Volume development in land transport was positive overall. A decline in general cargo transports was more than compensated for by the increased volume of the parcel business and direct transport. Adjusted for the effects of the reassignments, volume in direct transports fell due to cross-country declines in Europe.
The economic development was positive. The operating profit figures showed considerably improved development. However, this was largely as a result of the reassignments.
◊ Revenue development was up as a result of price and volume effects and the reassignments. This was partly offset by negative exchange rate effects.
◊ Cost of materials (+ 7.4%) rose. This was particularly as a result of higher expenses, caused by reclassifications of land transport activities and service expansions. Ex -change rate effects reduced expenses.
◊ Personnel expenses (+ 5.4%) increased due to the re -clas sification of land transport activities and service expansions. In addition, personnel numbers increased as a result of taking on temporary workers.
The number of employees increased as a result of business development and taking on temporary workers.
Air freight line of business ◊ Significant effects due to freight rate development
despite the expansion of capacity on the market. ◊ Focus on broadening the customer base and improving
the cargo mix. ◊ A range of measures for standardization and improving
productivity are being implemented.
Air freight line of business 2018 2017
Change
absolute %
Air freight volume (export) (thousand t) 1,304 1,300 + 4 + 0.3
Total revenues (€ million) 3,804 3,530 + 274 + 7.8
External revenues (€ million) 3,804 3,530 + 274 + 7.8
EBITDA adjusted (€ million) 186 166 + 20 + 12.0
EBIT adjusted (€ million) 178 158 + 20 + 12.7
Employees as of Dec 31 (FTE) 7,032 6,571 + 461 + 7.0
There was slightly positive performance development. Drivers of this development include transatlantic trans-ports and transports between Latin America and Europe. Performance was dampened by the market cooling off during the course of the year under review.
The economic development was positive; operating profit figures improved based on increased revenue and one-off effects. By contrast, exchange rate effects had a dampening influence.
◊ Revenue development was positive. The main drivers were freight rate and volume trends.
◊ Cost of materials also rose (+ 7.1 %) in line with the vol-ume and freight rate trends.
◊ Personnel expenses (+ 5.4%) increased as a result of a higher number of employees.
The number of employees increased in part due to taking on temporary workers.
GR
OU
P M
AN
AG
EM
EN
T R
EP
OR
T
145
GROUP MANAGEMENT REPORT — DEvElOPMENT Of bUsiNEss UNiTs
fiN
AN
CiA
l s
TA
TE
ME
NT
ss
Us
TA
iNA
bil
iTY

Ocean freight line of business ◊ Significant effects due to freight rate development. ◊ Focus on efforts to optimize capacity utilization, costs
and purchase prices.
Ocean freight line of business 2018 2017
Change
absolute %
Ocean freight volume (export) (thousand TEU) 2,203 2,169 + 34 + 1.6
Total revenues (€ million) 2,930 2,943 – 13 – 0.4
External revenues (€ million) 2,930 2,943 – 13 – 0.4
EBITDA adjusted (€ million) 84 82 + 2 + 2.4
EBIT adjusted (€ million) 81 80 + 1 + 1.3
Employees as of Dec 31 (FTE) 4,974 4,882 + 92 + 1.9
Performance development for ocean freight was also slightly positive. Business related to the Middle East and Africa (MEA) as well as trade between the Asia-Pacific and Europe regions had a positive impact.
The economic development was dampened because the in crease in revenues was entirely offset by increased ex pens- es. Operating profit figures benefited from one-off effects. Exchange rate effects, on the other hand, had a noticeably negative impact.
◊ Revenues declined slightly due to exchange rate effects. Growth adjusted for exchange rate effects was recorded, driven by freight rates and volume development.
◊ Cost of materials declined as a result of exchange rate effects. A rise in line with the volume increase was re-corded when adjusted for exchange rates.
◊ Personnel expenses (+ 2.3%) also recorded an increase in line with the expansion of services dampened by ex -change rate effects.
The number of employees increased in part due to taking on temporary workers.
Contract logistics line of business ◊ Good business development in the existing
and new customer base. ◊ Measures taken to increase productivity. ◊ Operational challenges in Australia, Germany
and the Netherlands.
Contract logistics line of business 2018 2017
Change
absolute %
Warehouse space (million m²) 8.3 8.0 + 0.3 + 3.8
Total revenues (€ million) 2,622 2,634 – 12 – 0.5
External revenues (€ million) 2,621 2,633 – 12 – 0.5
EBITDA adjusted (€ million) 141 167 – 26 – 15.6
EBIT adjusted (€ million) 92 120 – 28 – 23.3
Employees as of Dec 31 (FTE) 24,439 22,081 + 2,358 + 10.7
Some activities previously allocated to contract logistics will be reported under the land transport line of business from the year under review onwards. This reduces revenues and expenses, resulting in restrictions in comparability.
The economic development in the contract logistics line of business was negative: operating profit figures recorded poorer development due to higher expenses combined with business expansions and as a result of the reclassification of land transport activities.
◊ Revenue declined slightly due to exchange rate effects. Business expansion resulted in an increase due to ex -change rate effects. The reassignments had a damp-ening effect.
◊ Cost of materials (– 17.8%) fell as a result of the reassign-ments. Exchange rate effects also reduced expenses.
◊ Personnel expenses (+10.7%) increased, partly as a result of a higher number of employees. By contrast, exchange rate effects reduced expenses.
The increase in the number of employees was due to the business expansion as well as the taking on of temporary workers.
Deutsche Bahn Group 2018 Integrated Report
146

Infrastructure
Introduction of the requirement plan implementation agreementWith effect from January 1, 2018, the Requirement Plan Implementation Agreement (Bedarfsplanumsetzungsvereinbarung; BUV), as concluded with the BMVI, was introduced in order to accelerate the realization of major projects. Under the agreed model for the implementation of new track infrastructure construction and expansion proj ects by the Federal Government, new plans and the results of early public participation are now presented annually to the German Parliament. In the year under review, reports on the Hanau — Fulda and the Fehmarn Belt Fixed Link projects were handed over to the BMVI.
Instead of the fixed amount for planning costs, the Federal Government subsidizes total project costs, with DB Group covering the economically viable share of the pro j ect portfolio. Planning support from the EBA will increase and non compliance with commissioning dates will be penalized.
Modernization of the existing network is on schedule In the fourth year of the LuFV II µ234 f., we continued to work hard towards modernizing the existing network. The 2018 annual program was also designed to contribute to the overarching objective of sustainably improving the quality and availability of the ex ist ing track infrastructure. Throughout, we continue to keep current and future customers of the infrastructure in mind. In the LuFV II, we made a commitment regarding quality, which we are making every possible effort to meet.
We believe that in the year under review, the targets set out in the agreement were achieved. This will be documented in the 2018 infrastructure state and development report, which we will submit to the Federal Government by April 30, 2019.
In order to be able to continue down this path of modernization consistently from 2020, we are currently in negotiations with the Federal Government regarding the followup agreement to the LuFV II, the period of which comes to an end on December 31, 2019.
Cost and schedule development for Stuttgart 21 and the Wendlingen — Ulm new construction lineOn January 26, 2018, the Supervisory Board of DB AG deliberated the schedule and cost situation for the Stuttgart 21 project. The cost forecast was increased to a total value of about € 7.7 billion. To take into account unanticipated events, further funds of about € 0.5 billion have been earmarked, meaning that the overall financing framework has increased to € 8.2 billion. In addition to increases in construction prices, the increase in costs results in particular from significantly more extensive procedures for tunneling in the anhydrite rock, more extensive approval processes as a result of species protection and the postponement of commissioning to 2025, among other things.
The cost and schedule planning for the Wendlingen — Ulm new construction line was also deliberated. The cost forecast was increased to € 3.7 billion and the completion date postponed to 2022. The cost increase is mainly due to greater geological risks as well as additional capital expenditures in the modernization of Ulm Central Station. The delay results from more elaborate plan revision procedures for species protection in the Albvorland.
Future Capital Expenditure Program in the third yearAs part of the ZIP, the BMVI also made additional Federal funds available for seaport hinterland transport, noise remediation, accessibility and digitalization for the years 2016–2018. In the first two years combined, a total of about
€ 293 million was spent on infrastructure, whereas in the year under review, the total was € 283 million. For the years 2019 and 2020, followup fi nancing of about € 93 million has been agreed for some subprograms.
Digital planning and construction becomes a reality Building information modeling (BIM) is a collaborative method of working where all data on infrastructure facilities is fed into an optimized planning, construction and management process that covers the entire life cycle and is made available digitally. From the end of 2020, DB Group’s RICs intend to use the BIM method to realize new projects that are standardizable or complex. Setting up the necessary bases for efficient digital processes and technologies in planning, construction and operation of rail infrastructure facilities should be completed by then. The BMVI is funding BIM trials in 13 major infrastructure projects. In addition, the method is being piloted in seven projects in the existing network. DB Netze Stations has been using the
GR
OU
P M
AN
AG
EM
EN
T R
EP
OR
T
147
GROUP MANAGEMENT REPORT — DEVELOPMENT OF bUSINESS UNITS
FIN
AN
CIA
L S
TA
TE
ME
NT
SS
US
TA
INA
bIL
ITY

BIM method to plan and construct all of its new station projects since January 2017. DB Engineering & Consulting (DB E & C) is currently using the BIM method in about 90 DB Group projects and plans to expand its portfolio by about 100 further BIM projects in 2019. In doing so, DB E & C is using stateoftheart digital technologies in capturing inventory data, planning and construction monitoring, and is using a modulebased training approach to ensure that employees are BIMqualified.
Accident in AichachOn May 7, 2018, a passenger train operated by Bayerische Regiobahn collided with a freight train near Aichach station. Two people died in the accident. Several passengers were injured.
Development of infrastructureIn the year under review, more than € 10 billion was ex pend ed on the expansion, modernization and maintenance of the rail network, stations and power systems. Across Germany, 12 new construction initiatives were launched in major projects, with construction starting on 23 projects. Eighteen new construction and expansion lines were put into operation. Bundling in over 100 corridors and a professional construction management are indispensable for the large num ber of construction sites – up to 800 a day at peak times. By pooling the construction sites, we can minimize the impacts on normal operation. In addition, constructionrelated delays (delays that could be directly attributed to a con struction site) were successfully reduced by 10%, de spite a further increase in construction volume due to the construction of the management center that began in the previous year. Construc tion works in the year under review are summarized in the Construction Project Map µ151. Additional information can be found in our ŒConstruction Infor-
mation Portal (bauInfoPortal).
Commissioned ◊ After more than three years of construction, the new
elec tronic interlocking for the more than 6 km long tunnel main line of the RheinMain SBahn (metro) under the center of Frankfurt came into operation on August 6, 2018. This replaced the 40yearold interlocking for the City Tunnel. In total, more than € 100 million was invested in new technology on one of the mostused lines in Germany.
◊ After about four years of construction, trains began operating in the new Pforzheimer Tunnel on September 10, 2018. This brought one of the largest measures of the modernization and capital expenditure program in
the existing BadenWürttemberg network into use on time. About € 100 million in total was invested in the construction of the 909 m twotrack tunnel.
◊ Commissioning of the line between Knappenrode and the German/Polish border took place in December 2018. Following the commissioning and after the timetable change, it began to be used for regional rail passenger transport and freight trains transitioning to the Polish overhead wire network.
◊ The new train formation yard in Halle (Saale) came into operation on June 29, 2018 as planned, after four and a half years of construction. On the site of the former Halle freight train station, one of the most uptodate fa cilities in Europe has emerged. The Federal Government and DB Group invested a total of about € 180 million.
◊ With the commissioning of the Neufahrn electronic interlocking, the last major milestone in the overall commissioning of the Neufahrn Curve was reached at the end of July 2018, after about four years of construction. The commissioning took place as part of the timetable change in December 2018.
Under constructionProgress on the Stuttgart — Ulm projectConstruction work on the Stuttgart 21 subproject continued to progress in the year under review:
◊ In the construction of the future Stuttgart central station, the first chalice pillar, a socalled “Restkelch” (supporting chalice) and a total of six chalice feet have been concreted, while work has begun on the station’s floor panel.
◊ In the Filder Tunnel, the fourth and final tunnel drive of the tunnel boring machine has been started. Tunnel boring at the northern end is complete, and all relevant anhydrite lenses in Cannstatt and Feuerbach tunnels have been successfully dealt with without any noteworthy issues.
◊ Concreting of the northern end, the connection be tween the Feuerbach and Bad Cannstatt tunnels and the future central station, has begun.
◊ The Neckar Bridge reached the eastern bank in May 2018. ◊ In June 2018, the fourth and final tunnel tube success
fully crossed underneath the Neckar. ◊ About 43 km, representing more than twothirds of the
tunnels required for Stuttgart 21, have been drilled and excavated.
Deutsche Bahn Group 2018 Integrated Report
148

◊ Following the submission of an appeal to the Higher Administrative Court (Verwaltungsgerichtshof), the decision to reinstate the immediate enforceability of plan approval section 1.3a in the airport sector was suspended in December 2018; the Court has not yet issued the grounds for its ruling.
In the Wendlingen — Ulm new construction line subproject, the tunnel boring machine also broke through the second tube of the 8,806 meter long Boßler tunnel above the Fils Valley in June 2018. In terms of the last major tunnel, the Albvorland tunnel, the two tunnel boring machines have each completed about 5.5 km of their more than 8 km long tunnel respectively. Restoration of the landscape along the line on the Alb plateau is underway. There, the skeleton of the new construction line is almost fully complete. In De cember 2018, the first track sections were handed over to railway technology/superstructure. On the Fistal bridge, the concreting of the bridge superstructure is ongoing; many pillars are already finished.
Expansion of the Cologne hubThe highlyfrequented Cologne hub is to be expanded through a total of 15 infrastructure measures. The construction projects to expand the S13 from Troisdorf to Bonn Oberkassel are proceeding as scheduled insofar as possible, including the first bridge construction works. The S11 proj ect core package, including the planned expansion projects between Cologne central station and Bergisch Gladbach, is currently in the preplanning phase; the planning agreement for the provision of the planning services for per formance phases 3/4 (draft and approval planning) is currently in negotiation with the grant authorities. The southern Gummersbach Street expansion project is ap proaching the end of draft and approval planning. In expansion line project 4 Cologne—Aachen, works in plan approval section 1 Eschweiler station are in the execution phase and in plan approval section 2 AachenRothe Erde, building services are currently being tendered.
Construction of new S-Bahn (metro) line from Hamburg to Bad OldesloeThe expansion of the S4 SBahn (metro) line will help to strength en local transport between Hamburg and SchleswigHolstein and to improve the quality of longdistance and freight transport. The building permit procedures for all three plan approval sections are ongoing. The first public hearing for plan approval section 1 took place in April 2018; the documents for sections 2 and 3 are scheduled to go on display in 2019. The relevant decisions are ex pected in writing in 2019 and 2020. We are working towards a total completion before the commissioning of the Fehmarn
Belt Fixed Link (2028). The financing for the entire project is currently being agreed amongst the states of Hamburg and SchleswigHolstein, DB Netz AG and the BMVI.
Frankfurt hub expansionThe Frankfurt am Main hub is one of the most heavily frequented in our network. To ensure rail transport is made fit for the future, we are undertaking measures to rebuild the area around the Frankfurt Stadion station, building two tracks on the Homburg Damm, connecting Gateway Gardens to the SBahn (metro) network, expanding the S6 SBahn (metro) line in the direction of Friedberg and build ing an SBahn (metro) line on the northern side of the Main river. Work on the crossing at the Homburger Damm has commenced. Along the S6, work is ongoing to expand the line between Frankfurt West and Bad Vilbel to four tracks.
Tunnel boring measures in the Gateway Gardens project have advanced a great deal; excavation underneath Federal motorway 5 has started. Underground construction work on the open lines is proceeding as scheduled. Work to expand the interior of the tunnel by all the relevant experts will begin in April 2019 as scheduled.
Progress in the Emmerich — Oberhausen expansion lineConstruction work on expansion line project 46/2 Em merich — Oberhausen is progressing on schedule. With the final public hearing having taken place in November 2018 for plan approval section 3.5 Emmerich—Elten, all the plan approval sections have been discussed in public hearings. The plan approval decision on plan approval section 1.1 Oberhausen was communicated in 2015. The subsequent appeal by the town of Oberhausen for additional noise protection on plan approval section 1.1 Oberhausen was rejected by the Federal Administrative Court on December 13, 2018. The second plan approval decision on plan ap proval section 3.1 Rees—Haldern was delivered to DB Netz AG on December 21, 2018, but will only be published in 2019. Building permits for further plan approval sections are ex pected to be issued before the end of 2019.
Developments in the Breisgau S-Bahn (metro)The overall commissioning of the expansion of the western Höllental Railway between Freiburg and Titisee took place in December 2018. Actions undertaken as part of the proj ect included making stations fully accessible, refurbishing or rebuilding level crossings and passenger underpasses, renovating tracks and overhead wires section by section and building new interlockings.
GR
OU
P M
AN
AG
EM
EN
T R
EP
OR
T
149
GROUP MANAGEMENT REPORT — DEVELOPMENT OF bUSINESS UNITS
FIN
AN
CIA
L S
TA
TE
ME
NT
SS
US
TA
INA
bIL
ITY

On the eastern Höllental Railway between Neustadt and Donaueschingen, works have been continuing as scheduled since July 1, 2018. Since midSeptember 2018, clearing works have been ongoing along the line, as have cleanup works in the tunnels.
The plan approval decision for the Breisacher railway between Freiburg and Breisach was issued in October 2018. The first actions in this section of the Breisgau SBahn (metro) will begin in February 2019.
Ground-breaking on the Southern railwayFollowing groundbreaking on March 23, 2018, construction works on the Ulm — Laupheim — Aulendorf section are underway.
In the Ulm — Laupheim section, works on underground cable laying, the reconstruction of 60 km of overhead wire and replacement of about 400 m of support walls and two road bridges have been proceeding at a good pace. These works are expected to be completed in 2019; in addition, about 60 km of superstructure works and the reconstruction of three level crossings are planned for 2019. Here, the measures for the project and the superstructure program are being bundled and implemented together.
In the Friedrichshafen — Lindau section, the tenders have been awarded and implementation planning has begun. Construction will begin in spring 2019.
Commissioning is planned for December 2021.
Progress in expansion line 48 Munich—LindauThe building permit procedures were completed for 19 of the 20 sections in the year under review. Between now and 2020, the main construction phase will be carried out with widespread sectionbysection line suspensions. The main works on the expansion line, which were planned for the year under review but set back after delays to the building permit being granted, were agreed following expansion of the rail replacement service on several stretches of track and therefore additional suspensions, primarily in the year under review.
Beginning of the main construction work at Dortmund central station Main construction work to modernize the Dortmund central station began in June 2018. In addition to the expansion and modernization of the passenger underpasses, all of the station’s platforms will be resurfaced and have new equipment and new roofs installed. After the work is completed, expected in 2024, the station will be fully accessible and
will provide accessible integration with all other modes of transport. The total capital expenditures for the project are about € 130 million, borne by the Federal Government, the state of North RhineWestphalia and DB Group.
Building permit for the Lehrte MegaHub grantedIn February 2018, the EBA granted its approval for the second amendment to the building permit for the Lehrte MegaHub project. The foundations for the future crane track started to be laid in midSeptember 2018.
Following the successful awarding of the tender for the sorting facility on September 11, 2018, the performance planning is now taking place. All relevant tenders for the realization of the MegaHub have thus been awarded. Operational testing should take place in 2019.
Progress on the second S-Bahn (metro) main line in MunichSince April 2018, legally valid building permits have been available for all three plan approval sections for the second main line in Munich.
At present, preparations for construction are ongoing in the Overground West section, Marienhof and at the central station. The tenders for the three main construction proj ects in this area were awarded at the end of 2018. In the MunichLaim construction section, two construction site underpasses were created in preparation for the construction in 2018. These will be used from 2019 to allow access for the trucks and construction vehicles needed to start the main construction works on the track island to lay the fourth track at Laim station. At Marienhof and at the central station, the main construction works will also begin in 2019.
PlannedStart of planning for the 740 m networkCreating a continuous rail network for 740 m freight trains is a key element for enhancing costefficiency in rail freight transport and making more efficient use of the rail infrastructure.
BMVI has therefore defined a 740 m network action plan, which has been classified under the compound item “Further network measures aimed at relieving bottlenecks” in the potential requirements of the Federal Transport Infra structure Plan (Bundesverkehrswegeplan; BVWP) 2030. BMVI has determined the profitability of the 740 m network and has assured Federal funding for the start of planning. The requirement plan measure is currently fo cus ing on about 80 individual actions, such as relocating signals and installing switches to create new possibilities for overtaking.
!!!!!!
Deutsche Bahn Group 2018 Integrated Report
150

1
3
3
5
6
7
8
11
12
14
15 16
16
17
18
20
21
23
1
3
7
9
10
11
121314
15
16
21
22
23
24
25
26 27
28
32
34
35
1022
36
37
40
5
47
48
4
49
52
6
725
89
9
13
14
15
1918
19
18
20
21
22
23
2342
23
23
23
23
23
23
2323
23
24
25
17
20
8 43129 39 44 4623 45
19
33 42 2 24131 2 3 26 28 2
17
2 41
12 38
2 10 11 43
16 6
Hanover
Dortmund
Bonn
Saarbrücken
Karlsruhe
Mainz
Mannheim
Basel
Schwerin
Kiel
Lübeck
Hamburg
Bremen
Berlin
Dresden
Potsdam
Leipzig
Erfurt
Halle
Magdeburg
Freiburg
Münster
Stuttgart
KasselDüsseldorf
Ulm
Frankfurt am Main
Würzburg
Nuremberg
Ingolstadt
Munich
Cologne2 4 29 30
ŒConstruction Information Portal (bauInfoPortal)
Planned1. Hamburg — Lübeck — Puttgarden expansion/
new construction line (Fehmarn Belt Fixed Link)2. Expansion of major hubs (Frankfurt am Main,
Hamburg, Munich, Cologne, Mannheim)3. Optimized Alpha-E: Hamburg – Hanover expansion/new
construction line, Langwedel — Uelzen, Rotenburg — Verden — Minden/Wunstorf, Bremerhaven — Bremen — Langwedel expansion lines
4. Karlsruhe — Basel expansion/new construction line (sections 7 and 8)
5. Frankfurt — Mannheim new construction line6. Hagen — Siegen — Hanau expansion line7. Hanau – Würzburg/Fulda expansion/
new construction line8. Uelzen — Stendal — Magdeburg — Halle
expansion line (East corridor north)9. Hof — Marktredwitz — Regensburg — Obertraubling
expansion line (East corridor south)10. Munich — Rosenheim — Kiefersfelden — German/Austrian
border (— Kufstein) expansion/new construction line11. Munich — Mühldorf — Freilassing expansion line12. Nuremberg— Marktredwitz — Hof/German/
Czech border (— Prague) expansion line (Franconia - Saxony - Mainline)
13. Hanover — Berlin (Lehrte Mainline) expansion line14. Weimar — Gera — Gößnitz expansion line15. Dresden — Prague new construction line16. Ulm — Augsburg expansion/new construction line17. Angermünde — Stettin expansion line18. Rhine-Ruhr-Express (Düsseldorf, Dortmund, Essen, Bochum, Leverkusen area)19. German unification transport projects no. 8.1
Nuremberg—Erfurt expansion/new construction line (freight train track, Bamberg)
20. Leipzig — Dresden expansion line (German unification transport projects no. 9, 3rd construction phase)
21. Berlin — Dresden expansion line (remaining stages)22. Saarbrücken — Ludwigshafen expansion line 23
(Paris-Eastern France-South-Eastern Germany South, Appenweier bend)
23. 740 m network (freight transport)24. Southeast converter work (new construction)25. Kuppenheim converter work (new construction)26. S-Bahn (metro) S4 Hamburg— Bad Oldesloe27. Munich central station and Starnberger branch station 28. Hamburg central station 29. Nordmainische S-Bahn (metro) (Frankfurt — Hanau)
Under construction1. Oldenburg – Wilhelmshaven expansion line2. Maschen bypass (Hamburg hub)3. German/Dutch border — Emmerich — Oberhausen
expansion line 46/24. Frankfurt hub: S6, Gateway Gardens, Homburger Damm5. Stuttgart — Ulm — Augsburg expansion/new
construction line (Wendlingen — Ulm)6. Electrification of southern railway (Ulm — Lindau)7. Karlsruhe — Basel expansion/new construction line8. Berlin Nordkreuz (2nd construction phase)9. Leipzig — Dresden expansion line (German unification
transport projects no. 9, 3rd construction phase)10. Hoyerswerda — Horka — German/Polish border
expansion line (expansion and electrification)11. Karlsruhe — Stuttgart — Nuremberg — Leipzig/Dresden
expansion line (Saxony mainline: Lehndorf, Neukieritzsch area)
12. Halle hub with marshaling yard13. Leipzig hub14. Dortmund central station (conversion)15. Berlin — Frankfurt/Oder — German/Polish border
expansion line 16. Saarbrücken — Ludwigshafen (Paris-Eastern France-
South-Eastern Germany north) expansion line 2317. Magdeburg hub18. German unification transport projects no. 8.1
Nuremberg—Ebensfeld (plan approval section 18 Baiersdorf — Eggolsheim)
19. Cologne — Aachen (Eschweiler station conversion) expansion line
20. Uelzen — Stendal (Rademin — Salzwedel) expansion line
21. Munich — Lindau — German/Austrian border expansion line 48
22. Lehrte MegaHub23. Stuttgart 21
24. New traction current line 596 (Bengel to Koblenz)25. New construction to replace traction current
line 443 (Flörsheim to Bingen)26. Schwerin local converter work (new construction)27. Bützow local converter work (new construction)28. Reinforcing traction current lines 488 (Aalen — Osterburken)29. Berlin S-Bahn (metro) S2130. Frankfurt central station (modernization)31. Berlin Ostkreuz station (conversion)32. Würzburg central station (conversion)33. Elbbrücken S-Bahn (metro) station
(new construction)34. Augsburg central station (accessibility expansion)35. Cottbus station (conversion)36. Bonn station (modernization)37. Pinneberg station (modernization)38. Nuremberg station—German unification
transport projects no. 8.1 expansion line Nuremberg — Ebensfeld
39. Berlin Ostkreuz station40. Rostock — Berlin expansion line41. Cologne hub42. Merklingen station (new construction) 43. 2. S-Bahn (metro) main line in Munich44. Berlin-Rummelsburg (track layout alteration)45. Berlin Südkreuz — Blankenfelde (Dresdner Railway) 46. Berlin S-Bahn (metro) S2 South (rebuilding works)47. Saxony-Franconia Mainline (Markkleeberg — Gaschwitz — Großdeuben section)48. Straubing station (accessibility conversion)49. Breisgau S-Bahn (metro) 2020
Commissioned1. Saarbrücken — Ludwigshafen expansion line
(Paris-Eastern France-South-Eastern Germany North, partially commissioned)
2. Hamburg hub (partially commissioned)
3. Nuremberg — Erfurt (4-track expansion – Baiersdorf — Forchheim) expansion/new construction line (partially commissioned)
4. Berlin Ostkreuz station (installing line and direction operations, installing regional platforms)5. Stelle — Lüneburg (ETCS, 3rd track) expansion line6. Karlsruhe — Stuttgart — Nuremberg — Leipzig/
Dresden expansion line (partially commissioned) 7. Berlin — Frankfurt/Oder — German/Polish border
expansion line (partially commissioned)8. Halle train formation yard9. Uelzen — Stendal expansion line
(partially commissioned)10. Hoyerswerda — Horka expansion line
(partially commissioned)11. Traction current line replacement work 304 (Großkorbetha to Weimar)12. Traction current line replacement work 305 (Chemnitz to Dresden/Stetzsch)13. Hamburg central station (renovation of rail bridges)14. Leutkirch station (modernization)15. Merzig station (station reconstruction)16. Türkismühle station (station reconstruction)17. Gensingen Horrweiler stop (new construction)18. Stockdorf station (accessibility expansion)19. Bochum-Dahlhausen station (modernization)20. Gütersloh station (modernization)21. Pforzheimer tunnel22. Knappenrode — Horka and German/Polish border (two-track electrified line)23. Erding ring closure, Neufahrn northern curve (including Neufahrn electronic interlocking)24. Jungfernstieg, Stadthausbrücke and Altona stations, Hamburg (modernization)25. Hanau— Nantenbach expansion line
S E L E C T I O N O F C O N S T R U C T I O N P R O J E C T S I N 2 0 1 8
Selection of new construction, expansion and station projects as of: Dec 31, 2018
GR
OU
P M
AN
AG
EM
EN
T R
EP
OR
T
151
GROUP MANAGEMENT REPORT — DEVELOPMENT OF bUSINESS UNITS
FIN
AN
CIA
L S
TA
TE
ME
NT
SS
US
TA
INA
bIL
ITY

Planning and implementation of the Karlsruhe — Basel project continuedIn the Karlsruhe—Basel expansion/new construction line, planning is continuing, following the decisions handed down by the German Parliament and the State Parliament of BadenWürttemberg on the financing of noise remediation measures beyond the legally required level. The key requirements of the region, as discussed in the meetings of the project advisory board, are being integrated into the planning.
Hanau — Fulda planning is progressingPlanning for the new section of line between Gelnhausen and Fulda in the Hanau — Würzburg/Fulda expansion/new construction line project has progressed.
In order to select the train path, 13 versions comprising more than 1,000 line segments were mapped out as part of the investigation; these were compared in terms of environmental impact, regional planning and transport/economy and continuously presented in a dialog forum. The decision was preceded by intense discussions with the region that lasted several years. Our early and comprehensive involvement of the general public has been described as exemplary.
The socalled version IV was the version submitted to the regional planning process.
The benefits of version IV include shortening the travel time between Frankfurt and Fulda by 11 minutes and improving the local public transport offer.
Approval process for the Fehmarn Belt Fixed Link projectThe Fehmarn Belt Fixed Link project is in the design and approval planning stage. The approval documentation for plan approval section 6 on Fehmarn was submitted to the EBA in April 2018. The next seven sections will be submitted by spring 2019. While the approval proceedings are ongoing, a report is being drafted for BMVI in preparation for the German Parliament’s discussion of the demands of the region for additional noise remediation. Construction of a new link across the Fehmarn Sound is also being realized in connection with the Fehmarn Belt Fixed Link. The decision in favor of a preferred version will probably be made in the third quarter of 2019.
Implementation infrastructures for the Rhine-Ruhr-Express The financing agreement with the Federal Government for the Düsseldorf electronic interlocking was signed in De cember 2018. The Federal Government and DB Group are together investing about € 330 million in the new command and control technology. The public hearing regarding plan
approval section 2.1 Düsseldorf was held on Septem ber 25, 2018. Planning of performance phase 2 in Düsseldorf Reisholz has commenced with the inclusion of Düsseldorf Benrath as a stop in the Federal Transport Infrastructure Plan. Construction work on plan approval section 4.0 Mülheim has begun. The plan approval decision for plan ap proval section 1.2 (Leverkusen) was issued on October 8, 2018.
Relocation of the Hamburg-Altona long-distance train station This project involves the replacement of the existing HamburgAltona terminus by a new construction at the Diebsteich site for longdistance and regional transport, including the construction of a new concourse building. The current SBahn (metro) station in Altona will remain. The new station will have six longdistance and two SBahn (metro) tracks.
In December 2017, the plan approval decision was given by the EBA. In January 2018, the immediate full execution was granted by the EBA. On August 15, 2018, the Higher Administrative Court (Oberverwaltungsgericht; OVG) Hamburg reinstated the suspensive effect of the com plaint by the Transport Club of Germany Regional Union North e.V. (Verkehrsclub Deutschland Landesverband Nord e. V.) against the plan approval decision by the EBA for the HamburgAltona project. The decision of the OVG Hamburg is incontestable. As such, at the end of the main process, construction can neither be resumed, nor can the pending construction projects begin.
The OVG Hamburg decided that the motorail facilities available at the present station have not been sufficiently recognized in the plan approval decision. Currently, different scenarios to enable further realization of the project are being discussed with the project partners.
Db Netze Track business unitbusiness modelDB Netze Track is Europe’s number one rail infrastructure provider. More than one billion trainpath kilometers are traveled each year on the tracks in Germany. The most important sources of income are revenues from trainpath prod ucts, which constitute over 90% of total revenues. Train path prices are established on a transparent basis by a trainpath pricing system regulated by the BNetzA.
DB Netze Track is also responsible for managing infrastructure operations as well as for securing longterm infrastructure quality and availability and nondiscriminatory access to trainpaths and service facilities. This includes preparing timetables in close cooperation with customers, operations management, construction management and maintenance.
!!!
Deutsche Bahn Group 2018 Integrated Report
152

The cost structure is dependent on fixed costs. The rail network is one of the most important cost drivers. The use of resources for the operation and maintenance of infrastructure facilities is very much influenced by specific facility characteristics, requirements relating to operational opening hours and the degree of rationalization in operating business activities. As the dimensions of the infrastructure only change in the long term due to new construction or expansion projects or targeted dismantling, the optimal capacity utilization of the existing infrastructure is of major importance for economic success.
A high level of quality and availability for customers also calls for a forwardlooking integrated capital expenditure and predictive maintenance strategy. Capacity utilization is measured by volume produced. In terms of relative network capacity utilization, this figure can be compared to
track kilometers. To achieve further growth, it is important that new construction and expansion projects concentrate on removing bottlenecks and on the creation of additional capacities for growth in transport in the main corridors and metropolitan areas. The budgetary resources of public authorities, in particular the Federal Government, are of considerable relevance for the financing of replacement capital expenditures in the existing infrastructure, as well as for the financing of new construction and expansion projects. In this respect, integration of an entrepreneurial infrastructure into the Group structure is essential for enabling DB Group to continue making a contribution to the cofinancing of these infrastructure measures.
Markets and strategyThe contributions made by the Federal Government to the infrastructure financing are particularly important to securing the competitiveness of rail as a mode of transport. A key tool here is the LuFV µ234 f.
!!!
Resources/inputs
D B N E T Z E T R A C K B U S I N E S S M O D E L
Customer segments
◊ About 440 business customers (thereof more than 420 external customers)
Employees
About 47,000
Networks and infrastructure
Rail network about 33,000 km in length, operation-critical facilities (tracks, switches, bridges, tunnels)
Value proposition
◊ DB Netze Track provides non-dis-criminatory access to a safe, reliable rail network that is in line with requirements.
Customer access and retention
◊ Key account management
◊ Regional sales
◊ E-services
Key activities
Providing a safe, reliable infrastructure that is in line with requirements
Planning and operating networks
Services/outputs
Train kilometers on track infrastructure
1.1 billion train-path km
EBIT Æ
€ 840 million
Employee † satisfaction
SI of 3.7
Customer ¿ satisfaction
SI of 64
Track kilometers noise ¥ remediated in total
1,758 km
Punctuality ¿
92.9 %
Outcomes
Vehicles
726 maintenance vehicles
Operating trains
GR
OU
P M
AN
AG
EM
EN
T R
EP
OR
T
153
GROUP MANAGEMENT REPORT — DEVELOPMENT OF bUSINESS UNITS
FIN
AN
CIA
L S
TA
TE
ME
NT
SS
US
TA
INA
bIL
ITY

◊ Economic ¿ dimension: By developing infrastructure in line with customer and market requirements, we enable the entire rail transport sector to take advantage of opportunities for growth. Our vision places the focus on customers: “Together with our customers, we make rail the first choice.” This is how we make our contribution to the competitiveness of rail. We will achieve our vision through three key strategic fundamental points:
◊ an increase in quality, ◊ better control of capacity and ◊ a simplification of the customer interface.
Capacity management is a particularly important factor for our network in terms of increasing customer satisfaction. Demand for passenger and, above all, freight transport has significantly increased over recent years, with infrastructure utilization also intensifying significantly. In addition to expansion and new constructions we are concentrating on other factors, such as more efficient use of service suspensions for the purposes of building activities, avoiding overburdening of the available capacities and reducing disruptions that cause unplanned extra burdens on capacity. In the mid to long term, we will particularly use digitalization of the infrastructure to achieve our goals. In addition to the Digital Rail for Germany µ71 program, which aims to generate up to 20% more capacity in the infrastructure through the envisaged long term rollout of ETCS, conversion to digital interlockings and a digital rail operation, we are digitalizing processes, where sensible and necessary, in all of our added value stages. A fundamental part of implement ing our vision is also the introduction of lean management in the organization. In the year under review, the first re quire ments for this have already been met. An example of its successful implementation is the standardization and digitalization of work preparation and performance in maintenance (OPEX Standardization Production System
Maintenance µ75 project). The groundwork has been laid for a comprehensive rollout beginning January 2019, which, from around the middle of the year, will complement the initiatives already ongoing.
◊ Social † dimension: One of the characteristics of the employee structure of DB Netze Track is its high average age. For this reason, we are currently working on a timely and successful recruitment campaign and the proactive qualification of new and existing employees. The focus here is particularly on digitalization and the interweaving of the digital and analog worlds that results from it – particularly in operating areas. It is very important to us to value the knowledge and skills of our employees in both of these worlds.
◊ Environmental ¥ dimension: In order to reduce specific station energy consumption and greenhouse gas emissions, DB Netze Track is focusing on effective efficiency measures, concentrating particularly on energyintensive consumers (switch heaters no. 94, track field lighting and interlockings).
General framework BNetzA approves train-path prices for 2019The competent ruling chamber approved the trainpath prices for the schedule year 2018/2019 on January 17, 2018, including the proposed 1.8% increase of trainpath prices in regional rail passenger transport. This follows from the statutory linking of the trainpath price development to the growth rate of the regionalization funds. As set forth in the resolution to the 2018 trainpath pricing system (TPS), the proposed trainpath prices in longdistance rail passenger transport were increased as part of the approval and lowered in the rail freight transport by about € 28 million, respectively. DB Netz AG has appealed against this decision. The earliest an initial decision can be expected is the end of 2019.
BNetzA sets maximum limits on total costs for the working timetable period of 2019/2020 As part of regulating the incentivization of trainpath prices, the BNetzA set the maximum limits for total costs of DB Netz AG and DB RegioNetz Infrastruktur GmbH for the working timetable period of 2019/2020 in a decision of August 13, 2018. The BNetzA granted recognition of the LuFV II on its first submission as a socalled qualified regulatory agreement. The minimum maintenance expenses specified there was included as a place holder, as the actual relevant LuFV III is not yet available.
Incentive system not approved by the BNetzA
On August 31, 2018, the BNetzA did not approve the incentive system that DB Netz AG submitted as part of the rail network terms of usage (SchienennetzBenutzungsbedingungen; SNB). The further development of the incentive system between the TOCs and DB Netz AG was originally intended to be introduced as part of the timetable change in December 2018. In comparison to the previous regulations, significantly higher payments would be levied for de lays caused by construction sites, among other issues. However, an agreement regarding all the significant points of the incentive system in passenger transport was successfully reached as part of a market dialog on November 19, 2018. The changes to the SNB regarding the incentive system for rail passenger transport are still expected to come into effect in spring 2019 following the completion of the ap proval process by the BNetzA. In freight transport, no
Deutsche Bahn Group 2018 Integrated Report
154

agreement has yet been reached. DB Netz AG has planned four cus tomer events for 2019, in order to reach a collective agree ment regarding the incentive system in rail freight transport to be introduced in December 2019.
Action plan for customer-friendly construction In early June 2018, rail transport companies and associations submitted their “Round Table for Building Site Management” findings report to BMVI. The aim was to develop an action plan for more transport, improved quality and reliability in order to minimize the adverse effects on passengers and cargo customers wherever possible during the urgently needed modernization of the rail network. Specifically, the Construction Work Management Round Table recommended a total package comprising four key components: agreements between the Federal Government and DB Netz AG on customeroriented construction, an incentive system between DB Netz AG and TOCs, improved risk distribution between public transport authorities and TOCs, and the optimization of construction processes and communication.
Digitalization and innovationRollout of drive-related switch diagnosticsIn order to optimize the availability of switches, a digital remote diagnostic system is used to detect potential faults before they occur. The DIANA diagnostics platform can be used for preventive maintenance to remedy faults. This should make it possible to reduce driverelated switch defects by up to 50%. About 23,500 switches have been connected to DIANA since the end of 2018.
Environmental measuresNoise-based train-path pricing system supports refitting of freight carsThe noisebased trainpath pricing system (lärmabhängiges Trassenpreissystem; LaTPS) currently provides for a surcharge of 5.5% on the regular trainpath price for loud freight trains. Freight trains consisting of at least 90% cars with quiet brake shoes are exempt from the surcharge. In the working timetable period 2016/2017, about € 17 million was generated, which was used entirely to finance bonus payments to TOCs that use freight cars fitted with quiet composite brake shoes no. 5. In the year under review, we received and approved a total of 36,646 applications for program year 2017 in the LaTPS (2016: 25,643 applications) to promote the noise remediation of existing freight cars. A total of about € 8 million was paid as a bonus to the TOCs on the basis of the applications submitted (2016: € 4.4 million). The LaTPS will be in place until the end of 2020. The program is incomeneutral for its entire duration.
Legal topicsArbitration processes for the Rastatt Tunnel ongoingFollowing the damage in the east tunnel of the Rastatt tunnel, preparations to reconstruct the tunnel have been underway since March 2018. At the same time, the mediation proceedings agreed between DB Group and ARGE Tunnel Rastatt are ongoing to clarify the cause of the damage during tunnel boring and thus who is responsible. A team of technical and legal experts is charged with investigating the causes and drafting a settlement proposal. However, the process is taking longer as further investigations are needed to clarify the causes of the damage. As a result, an extensive boring program was carried out, among other measures. The arbitration processes is still ongoing.
DB Netz AG concluded an agreement with ARGE Tunnel Rastatt on August 16, 2018 regarding further expansion of the undamaged west tunnel. In this agreement, both parties waived their right to terminate the agreement until the end of 2019 and it was determined that two possible paths to continue the work should be technically planned.
Other events ◊ With disruptions continuing on the Marsh railway
(Marschbahn), we are working on a modernization concept. The main focus is a capital expenditure initiative in the superstructure to bring forward capital expenditures. To achieve this, we are raising the volume of capital ex penditures over the next four years by € 53 million to nearly € 160 million.
◊ DB Netz AG has joined the Orient/East — Med European Rail Freight Corridor (RFC). The resulting crossborder transport axis stretches about 9,000 km from the North and Baltic Seas to the Aegean and Black Sea. The aim is to eliminate border hurdles and offer dependable and harmonized transport services, thus further strengthening rail freight transport beyond Europe’s borders.
◊ In order to properly maintain transport services, even during large international disruptions, DB Netz AG has worked with the RhineAlpine rail freight transport corridor to produce a handbook for international disruption management, and afterwards agreed on it with support from the European Commission with the sector. It was unanimously ap proved by the European infrastructure operators in May 2018. The handbook focuses on rapid processes to im prove coordination and communication between infra structure operators during international dis ruptions and the development and publication of inter national disruption scenarios across all European corridors, indicating all the relevant diversion routes and their technical parameters. This enables TOCs to prepare for diversions and to act quickly in the event of a disruption.
GR
OU
P M
AN
AG
EM
EN
T R
EP
OR
T
155
GROUP MANAGEMENT REPORT — DEVELOPMENT OF bUSINESS UNITS
FIN
AN
CIA
L S
TA
TE
ME
NT
SS
US
TA
INA
bIL
ITY

Development in the year under review ◊ Increased revenue from price and volume effects. ◊ Higher expenses, mainly for personnel and maintenance,
hindered operating profit development. ◊ Gross capital expenditures increased on a high level.
The heavily utilized infrastructure and the high level of external interference led to a decrease in punctuality in the year under review.
Customer satisfaction also worsened. To assess this, about 240 customers are asked each year about their satisfaction with all of the services offered to them. Customers were particularly critical on infrastructure availability and construction works.
Train kilometers on track infrastructure in creased primarily in the wake of higher demand from nonGroup customers (especially in freight and regional transport) and from DB LongDistance. Lower demand from intraGroup freight transport customers had the opposite effect.
However, economic development was modest overall. In particular, higher personnel and maintenance ex penses exceeded the positive income development, meaning that
the adjusted EBITDA was slightly below that of the previous year. Adjusted EBIT showed positive development due to lower depreciation.
◊ Total revenues developed positively as a consequence of increases in demand and price effects.
◊ Other operating income (+ 9.4%) increased, partly due to increased income from the disposal of property, plant and equipment (sale of real estate), and larger refund of expenses for projects and scrap.
Expenses recorded significant additional liabilities: ◊ Cost of materials (+ 5.2%) rose significantly as a result
of increased expenses for quality measures, remediation of damage caused by weather and higher ex penses for preventative measures against weather risks.
◊ Personnel expenses (+ 6.5%) increased as a result of collective bargaining agreements and the higher number of employees.
◊ The increase in other operational expenses (+ 4.5%) resulted, inter alia, from an increase in services, IT and rent as a result of volume effects. In addition, higher project expenses and price effects had an impact.
◊ Depreciation (– 24.0%) decreased significantly, primarily due to the reassessment of economic useful lives.
!!!
DB Netze Track 2018 2017
Change
2016absolute %
Punctuality DB Group (rail) in Germany (%) 93.4 93.9 – – 94.3
Punctuality (rail) in Germany 1) (%) 92.9 93.6 – – 93.9
Customer satisfaction (SI) 64 67 – – 69
Length of line operated as of Dec 31 (km) 33,299 33,348 – 49 – 0.1 33,241
Train kilometers on track infrastructure (million train-path km) 1,084 1,072 + 12 + 1.1 1,066
thereof non-Group railways 349.2 331.3 + 17.9 + 5.4 321.9
Share of non-Group railways (%) 32.2 30.9 – – 30.2
Total revenues (€ million) 5,511 5,364 + 147 + 2.7 5,228
External revenues (€ million) 1,559 1,522 + 37 + 2.4 1,408
Share of total revenues (%) 28.3 28.4 – – 26.9
EBITDA adjusted (€ million) 1,446 1,484 – 38 – 2.6 1,484
EBIT adjusted (€ million) 840 687 + 153 + 22.3 561
Operating income after interest (€ million) 634 442 + 192 + 43.4 311
ROCE (%) 4.6 3.8 – – 3.1
Capital employed as of Dec 31 (€ million) 18,172 17,866 + 306 + 1.7 17,821
Net financial debt as of Dec 31 (€ million) 9,499 9,386 + 113 + 1.2 10,396
Redemption coverage (%) 13.9 14.0 – – 12.7
Gross capital expenditures (€ million) 6,901 6,601 + 300 + 4.5 6,226
Net capital expenditures (€ million) 564 660 – 96 – 14.5 688
Employees as of Dec 31 (FTE) 46,969 45,375 + 1,594 + 3.5 43,974
Employee satisfaction (SI) 3.7 – – – 3.7
Employee satisfaction – follow-up workshop implementation rate (%) – 99.1 – – –
Share of women in Germany as of Dec 31 (%) 19.2 18.8 – – 18.6
Track kilometers noise remediated in total as of Dec 31 (km) 1,758 1,701 + 57 + 3.4 1,598
1) Non-Group and DB intra-Group TOCs.
√
Deutsche Bahn Group 2018 Integrated Report
156

Customer segments
◊ Retail customers
◊ Business customers, particularly TOCs, tenants and mobility service providers
◊ Contracting organizations
Value proposition
◊ DB Netze Stations provides attractive stations and concourse buildings with a range of mobility services and retail spaces.
Customer access and retention
◊ Key account management
◊ Regional sales
◊ Customer services at the station
EBIT adjusted Æ
€ 221 million
Employee † satisfaction
SI of 3.7
Primary energy ¥ consumption
–20.5 % compared to 2010 (absolute)
Facilities quality ¿
Grade: 2.88
Outcomes
Rented space
over 0.9 million m²
Operating income after interest also improved, further supported by lower interest expenses, which led to an improvement in net operating interest.
ROCE improved in the wake of positive EBIT development, despite being burdened by a slight increase in capital employed.
Net financial debt slightly exceeded the value at the end of the previous year, inter alia as a result of negative working capital effects. As a result, redemption coverage decreased slightly.
The volume of capital expenditures in the existing network increased significantly. As a consequence of the increase in investment grants µ108 f., net capital expenditures dropped.
The number of employees increased significantly because of strategies to cover demand and ensure succession planning, particularly in the areas of maintenance, construction projects and operations.
Employee satisfaction is measured every two years. The satisfaction index remained stable.
The share of women rose slightly during the year under review.
Within the framework of the noise remediation program
µ92 f. we also carried out noise remediation measures on additional lines in the year under review.
Db Netze Stations business unitbusiness modelDB Netze Stations is the largest station operator in Europe. In addition to the core business, the development and operation of stations, the business unit offers a variety of mobility oriented services in stations. With over 0.9 million m² of leasing area, we are among Germany’s largest commercial landlords.
Each day, more than 410,000 trains from 100 TOCs with more than 20 million passengers and visitors in total use our stations. We set particular priorities in the areas of service, safety and cleanliness so that we can offer customers a high degree of quality. Our station managers also work hard onsite to ensure seamless operations.
!!! !!!!!!
D B N E T Z E S TAT I O N S B U S I N E S S M O D E L
Resources/inputs
Employees
About 5,800
Networks and infrastructure
About 5,400 stations, about 700 stops with marketing, about 9,500 platforms, about 6,100 passenger information facilities, about 6,700 dynamic information displays, about 2,300 elevators, about 1,000 escalators, about 300 parking garages and parking spaces
Key activities
Operating stations Leasing out commercial space
Services/outputs
Station stops
151 millionCustomer ¿ satisfaction
Traffic station (passengers/visitors) SI of 68, traffic station (TOCs and public transport authorities) SI of 61, tenants SI of 76
Providing reliable infrastructureG
RO
UP
MA
NA
GE
ME
NT
RE
PO
RT
157
GROUP MANAGEMENT REPORT — DEVELOPMENT OF bUSINESS UNITS
FIN
AN
CIA
L S
TA
TE
ME
NT
SS
US
TA
INA
bIL
ITY

Our station portfolio has a particularly wide geographical coverage. The infrastructure required is characterized by high fixed costs. Maintaining facilities and building infrastructure in line with requirements is crucial to our commercial success.
Revenues are generated from station stops (regulated, about 70% share) in the stations and from leasing out commercial space (not regulated). Our most important regulatory partners are the BNetzA and the EBA.
Markets and strategyWe are facing a period of significant change. The mobility market is growing and changing. Digital solutions are massively accelerating this development. New forms of mobility are emerging and car traffic is increasingly being challenged. Social structures are undergoing changes: the age gap is continuing to expand; cities are growing and stretching their infrastructures to their limits; rural areas are shrinking but must nevertheless maintain their access to mobility. In order to cocreate the future, we have further developed our strategy in key areas. By taking this new direction, we are actively contributing to the three dimensions of DB2020+:
◊ Economic ¿ dimension: The core of our strategy is the development of our stations to increase passenger growth and visitor numbers. For this purpose, we intend to im prove the customer experience at our stations and also impact the area around the stations. In addition to expanding mobility hubs, we are creating pleasant amenities and increasing the number of offers and services at our stations. In the first step, we will develop specific designs for 16 future stations and trial them in 2019/ 2020. Free WiFi access at large stations and comfortable waiting areas already allow passengers to make the most of their waiting times. We are creating additional highperformance WiFi access points and are developing new digital services for our customers. Through new marketing concepts such as Station Food and the expansion of our branch mix, we are creating attractive consumption and retail offers. By continuously optimizing our cleaning and maintenance concepts and increasing the budget for it, we are improving the baseline quality of our stations and adjusting the capacity of stations with bottlenecks caused by high volumes. We are also continuing to work towards the quality initiatives set out as part of the Railway of the Future. In a special program during the year under review, we also redesigned 30 heavily frequented SBahn (metro) stations and improved the amenities for our customers.
◊ Social † dimension: We work continuously on further developing our corporate culture and the satisfaction of our employees. Our guidelines in this effort are the five elements of customer focus, cooperation, leadership, re sponsibility and performance. At the same time, a per formance culture, in addition to involving lofty goals and being able to accept criticism, includes an appreciation for the contribution that every employee makes. A common target culture is created in dialog formats and through management training. We focus on tools that promote continuing vocational training, to offer attractive development opportunities for high performers and those with high potential.
◊ Environmental ¥ dimension: From 2019, our top 15 stations will operate using ecopower. By 2030, we intend to reduce absolute primary energy use by 30% compared to 2010 and 15% compared to 2017. As an operator of a complex portfolio of facilities we are committed to using environmentally friendly facilities and building technologies. When modernizing old buildings or constructing new ones, we therefore investigate the use of innovative lighting technologies no. 50, geothermal energy production, combined heat and power generation and photovoltaic systems no. 30 at all sites.
General frameworkBNetzA approves station prices 2019 On July 10, 2018, the competent ruling chamber of the BNetzA approved the station prices of DB Station&Service AG as applied for. During the audit of the cost basis, there was a slight reduction, but this did not have any impact on the station price.
Development of infrastructureStation campaign: Record capital expenditures in stationsIt is planned that between 2019 and 2023, € 8.5 billion will be spent for the modernization and maintenance of sta tions. In order to modernize station infrastructure, particularly in order to improve accessibility, the Federal Government and Federal states are making significant funds available. The extensive projects include the transformation and redesign of the Dortmund, Frankfurt am Main, Munich and Stuttgart stations. Large capital expenditures are also being made in many smaller and midsized stations, for ex ample in new escalators, elevators, information boards for passengers, benches, signage systems, floors and ramps for accessibility. In the meantime, 78% of the 5,400 passenger stations are stepfree – meaning that we have already reached 84% of passengers. For those who are blind or visually im paired, more than 5,100 of the 9,200 platforms are already fitted
!!!
Deutsche Bahn Group 2018 Integrated Report
158

with tactile, i.e. touchbased, signage systems on the floor of the platforms. Beyond that, all newly installed elevators provide tactile controls and a speech module.
Construction works in 2018 are summarized in the Con-
struction Project Map µ151.
Regeneration of S-Bahn (metro) tunnel stationsBetween now and 2020, we are spending a sum of several hundred million for the renovation of 27 underground metro stations in Frankfurt am Main, Hamburg, Munich and Stuttgart, which see a daily footfall of more than two million pas sengers. In total, about € 48 million will be spent to refresh the tunnel stations in the Hamburg SBahn (metro) network.
Improvement of amenities at stations We have launched and completed numerous projects to improve the quality of our stations. In the year under review, a total of € 23 million was spent for measures to improve cus tomer satisfaction. Of that, € 13 million went into individual actions. We spent about € 10 million for 30 highly frequented SBahn (metro) stations and in measures to upgrade their design.
Platform development program progressingIn August 2018, progress was made on the modernization program for the stations in the state of SchleswigHolstein. Two framework agreements set out the actions and their financing for the next seven years. In total, 41 stations will be fully or partially modernized, including the construction of seven new train stations. The total cost of all the modernization measures set out in the agreement, including planning services, is about € 60 million. Half of the costs will be funded by the state of SchleswigHolstein and half by Federal funds and DB funds. The program is also running in other Federal states with varying scopes.
Digitalization and innovation Passenger information of the future“Passenger information of the future” is the largest software development project for DB Netze stations to date. IRIS+, the new IT system, will allow information from the passenger information platform, the socalled “single point of truth” for passenger information, to be processed centrally. The impact of “Passenger information of the future” will be noticeable at stations through optimized layouts of existing displays. By the end of the year under review, 35 stations in Saxony had already been successfully fitted with this new system. In the long term – although already notice able at some stations – the displays will be shown in various
formats using a new generation of digital monitors. These will also make it possible to improve how new content, such as train delay updates and specific information during major disruptions, is displayed.
At stations, “Passenger information of the future” will be audibly noticeable thanks to the texttospeech technology, which will enable more fluent, flexible announcements. DB employees and customer associations were involved in selecting the “new voice of the station.”
Piloting of frequency monitoring and crowd flow analysisIn the coming years, the number of passengers will continue to rise. In order to better understand what impact these increases will have on station operations, new frequency monitoring and crowd flow analysis technology is currently being tested. The first pilot was tested at Stuttgart central station in the year under review. By digitally counting passengers, we intend to recognize peak periods more precisely in future and to counteract operational bottlenecks more effectively, for example by adjusting passenger direction strategies.
Upgrading of facilities technologyDB Netze Stations operates many technical facilities at the stations, which require data connections to central systems. A large number of these facilities have so far been using modem and ISDN connections to the Group’s internal telephone network and to the public telephone network. As part of the TOPKO program, the facilities concerned will be upgraded with improved IP technology. In the year under review, the upgrades included the complete replacement of the emergency call systems of about 2,400 elevators at stations. Further conversions included fire alarm systems, building automation and emergency call phones. There was a constant particular focus on maintaining the functionality of facilities by minimizing the downtime re quired for conversion. Migrations to the new technology are expected to be completed in 2019. The “IP at stations” proj ect (newly connecting about 1,000 stations to broadband IP access points) laid the groundwork for future digitalization projects.
New DB Accessible app The DB Accessible (DB Barrierfrei) app provides digital journey support first and foremost to those with mobility and sensory impairments, but also to all other passengers. It provides uptodate information about train services at all German stations. The progress of longdistance trains can also be followed in real time and users receive important information about changes to their journey as push notifi
!!!
GR
OU
P M
AN
AG
EM
EN
T R
EP
OR
T
159
GROUP MANAGEMENT REPORT — DEVELOPMENT OF bUSINESS UNITS
FIN
AN
CIA
L S
TA
TE
ME
NT
SS
US
TA
INA
bIL
ITY

DB Netze Stations 2018 2017
Change
2016absolute %
Stations 5,368 5,365 + 3 + 0.1 5,367
Facilities quality (grade) 2.88 1) 2.89 1) – – 2.92
Customer satisfaction, traffic station (passengers/visitors) (SI) 68 69 – – 69
Customer satisfaction, traffic station (TOCs and transport authorities) (SI) 61 62 – – 62
Customer satisfaction, tenants (SI) 76 78 – – 78
Station stops (million) 150.9 150.0 + 0.9 + 0.6 149.4
thereof non-Group railways 36.8 35.9 + 0.9 + 2.5 35.3
Total revenues (€ million) 1,314 1,265 + 49 + 3.9 1,233
thereof station revenues (€ million) 880 851 + 29 + 3.4 831
thereof rental (€ million) 391 384 +7 +1.8 377
External revenues (€ million) 569 540 + 29 + 5.4 519
EBITDA adjusted (€ million) 362 372 – 10 – 2.7 359
EBIT adjusted (€ million) 221 233 – 12 – 5.2 221
ROCE (%) 8.0 8.4 – – 7.9
Capital employed as of Dec 31 (€ million) 2,758 2,766 – 8 – 0.3 2,777
Net financial debt as of Dec 31 (€ million) 1,260 1,268 – 8 – 0.6 1,257
Redemption coverage (%) 22.7 23.0 – – 22.0
Gross capital expenditures (€ million) 883 709 + 174 + 24.5 584
Net capital expenditures (€ million) 164 103 + 61 + 59.2 117
Employees as of Dec 31 (FTE) 5,804 5,463 + 341 + 6.2 5,093
Employee satisfaction (SI) 3.7 – – – 3.7
Employee satisfaction – follow-up workshop implementation rate (%) – 97.8 – – –
Share of women in Germany as of Dec 31 (%) 45.2 46.2 – – 47.3
Absolute primary energy consumption (stations) compared to 2010 (%) –20.5 –17.1 – – –16.8
1) Preliminary figure.
√
cations on their smartphones. In addition, the app provides uptodate information about whether elevators and escalators are functioning. The app is designed to be fully accessible and can therefore also be used by those with vision or hearing impairments. Information is provided audibly and visually.
Other events ◊ The gastronomy joint venture Station Food opened its
second food court in the Berlin central station at the beginning of October 2018.
◊ The successful pilot of platform coordinators (taking on operational activities for TOCs/railway infrastructure companies) in the Hanover and Frankfurt am Main central stations ended on December 31, 2018 and will be con tinued as a regular product. The offer was also ex panded to two other stations (Dortmund and Mannheim central stations).
◊ During major disruptions, our operative service em ployees at 14 hub stations will in future be supported by oncall service employees from across the business units. Through this, we intend to ensure that we are providing the best possible service to our passengers, even in exceptional circumstances.
Development in the year under review ◊ Increased demand from additional traffic and increased
schedule frequencies. ◊ Burdens on profits by cost increases (particularly in
personnel and quality improvement measures). ◊ Leasing business stable.
Facilities quality is assessed locally and is determined on the basis of a detailed calculation and weighting algorithm in accordance with the provisions of the LuFV II µ234 f. Facilities quality remained stable at a good level.
Customer satisfaction worsened slightly. Lower scores, particularly on the issues of information about construction work, equipment and status of stations and visual and audio information should be noted. To assess customer satisfaction, about 27,000 passengers are asked each year, in two waves, about their satisfaction with the stations, and about 60 tenants and 90 public transport authorities are surveyed annually.
Performance development was marked by a slight in crease in the number of station stops. This was mainly due to increased schedule frequencies and additional traffic in regional transport. In particular, the higher demand was driven by nonGroup railways.
Deutsche Bahn Group 2018 Integrated Report
160

The economic development was negative: significant ex pense increases, particularly for additional qualityimprovement measures and in the area of personnel, could not be completely compensated by growth on the income side, meaning that the operating profit figures decreased.
◊ The rise in revenues is attributable to higher station revenues primarily as a result of prices as well as higher revenues from rental and leasing. Improved performance also supported station revenues. The development of external revenues reflects the growing market share of nonGroup railways.
◊ Other operating income (+ 21.8%) also grew strongly, primarily as a result of higher investment grants and increased income from selling real estate.
On the expenses side there were significant additional charges:
◊ Cost of materials (+ 10.2%) rose just as significantly, particularly as a result of additional quality improvement measures and higher expenses for maintenance. Lower energy expenses partially compensated this.
◊ Personnel expenses (+ 8.0%) rose sharply as a result of collective bargaining agreements and a larger number of employees.
◊ The increase in other operating expenses (+ 9.7) was partially due to increased IT and communication services, also resulting partially from the larger number of employees. Alongside rental expenses, disposals of property, plant and equipment also increased.
◊ Depreciation increased (+ 1.4%) in the wake of the larger volume of capital expenditures.
Declining EBIT development led to a worsening of ROCE, as capital employed continued to develop in an almost stable manner.
Net financial debt decreased slightly, mainly because of working capital effects.
Redemption coverage worsened, primarily as a result of lower operating cash flows caused by the profit development.
The higher capital expenditures were focused primarily on renovating existing stations and qualityimprovement projects.
The number of employees rose principally because of staff increases in the areas of construction and facilities management.
Employee satisfaction is measured every two years. The satisfaction index remained stable.
The share of women decreased slightly.
With the further reduction of the primary energy consumption of the stations in comparison to 2010, for example through the use of energy saving technologies, the positive trend of the past years is continuing.
Db Netze Energy business unitbusiness modelDB Netze Energy provides customeroriented and environmentally friendly products and services in the areas of traction current, diesel and stationary energy. As an integrated energy company, DB Netze Energy’s offer in Germany includes all the standard energy products in the field surrounding traction energy and stationary energy. These include traction current and diesel for rail transport, as well as electricity, gas and heat for stations and other DB Group properties. Furthermore, DB Netze Energy supplies industrial customers throughout Germany with a broad array of electricity and gas products. Private customers in Germany can also be provided with certified eco-power no 4. The range of services is rounded out with energy econom icsrelated consulting and technical services.
The traction current grid is the technical backbone of traction power provision in Germany, for which DB Netze Energy as the network operator ensures a high level of provision reliability. The required electricity is produced in traction current plants and fed into the grid through con-
verters no. 99/transformers. In order to provide for diesel traction units, DB Netze Energy offers a network of filling stations across Germany, which can also be partially used by road vehicles. In addition, DB Netze Energy operates 50 Hz mediumvoltage networks to supply energy to stations and provides a charging infrastructure for electric vehi-
cles no. 36 on the road. The infrastructure operated by DB Netze Energy is to a high degree and in varying forms subject to regulation by the BNetzA.
Markets and strategyDB Netze Energy is responsible for economically and ecologically efficient energy procurement and for reliable energy provision for TOCs. DB Netze Energy also has a highperformance infrastructure for the provision of electricity and diesel to mobile and stationary consumers. “Departure to the DB energy transition” (Aufbruch zur DB EnergieWende), the business unit strategy further developed in the year under review, en abled DB Netze Energy to focus on achieving DB Group’s climate goals. In terms of ecologically sustainable energy provision, existing fossil
!!!!!!
GR
OU
P M
AN
AG
EM
EN
T R
EP
OR
T
161
GROUP MANAGEMENT REPORT — DEVELOPMENT OF bUSINESS UNITS
FIN
AN
CIA
L S
TA
TE
ME
NT
SS
US
TA
INA
bIL
ITY

fuel power plant contracts will be replaced by renewable energies in future. At the same time, the replacement of diesel on the rails and the road will continue and energy efficiency in DB Group properties and real estate will be improved. Digitalization projects represent a further key strategic point in successfully managing the increasingly complex overall system of energy procurement with an ongoing high supply reliability. The third central strategic direction is ensuring economic value creation in an environment that remains challenging.
◊ Economic ¿ dimension: The supply reliability of the traction current grid managed by DB Netze Energy is high and consistently above the target value agreed with the Federal Government in the LuFV µ234 f. This level of quality is also expressed in high customer sat
isfaction. DB Netze Energy deals with the prices of raw material on the energy market, which continue to be volatile, by taking a structured approach to energy procurement though effective management of energy ancillary costs and a reliability strategy determined within DB Group.
◊ Social † dimension: Transparent information and communication are the basis of the cultural development process and a high level of employee satisfaction at DB Netze Energy. Our employees are given the opportunity to sign up to personal further development programs and to introduce their own ideas on innovation. Beyond that, channels have been introduced that allow them to participate in designing strategic themes.
Resources/inputs
D B N E T Z E E N E R G Y B U S I N E S S M O D E L
Customer segments
◊ Business customers
◊ Retail customers
Employees
About 1,700
Networks and infrastructure
About 7,900 km traction current grid, 1,770 transformer stations, 197 gas stations
Value proposition
◊ DB Netze Energy provides customer- oriented, environmentally friendly access to traction current and diesel prod-ucts as well as stationary energies.
Customer access and retention
◊ Key account management
◊ Regional sales
◊ Online customer platforms
Key activities
Providing reliable infrastructure
Procuring energy
Selling energy
Services/outputs
Traction current (16.7 Hz and direct current)
8,245 GWh
Stationary energy (50 Hz and 16.7 Hz)
18,196 GWh
EBIT adjusted Æ
€ 21 million
Customer ¿ satisfaction
SI of 78
Employee † satisfaction
SI of 3.8
Supply reliability ¿
99.99 %
Outcomes
Additional production factors
51 power plants/converters/ transformers
Offering energy economics-related and technical services
Diesel fuel
430 million l
Share of renewable ¥ energies in the DB traction current mix
57.2 %
Deutsche Bahn Group 2018 Integrated Report
162

◊ Environmental ¥ dimension: As the energy provider for TOCs in Germany, DB Netze Energy is implementing the climate target of DB Group in procurement and supply, thus making a fundamental contribution to the energy transition on the rails and in the entire transport sector. DB Netze Energy will pursue our vision of meeting 100% of our traction current requirements with CO₂free re newable energies by 2050. Customers today are already able to take advantage of green products based entirely on renewable energies. In addition, DB Netze Energy is initiating and supporting measures to improve energy efficiency in DB Group. The services for efficiency measures and reduction in greenhouse gases are therefore provided not only to TOCs, but also to customers from industry and commerce. Through the wideranging offer of services surrounding the charging infrastructure for
electric mobility no. 36, DB Netze Energy is also making a contribution to the transition in road transport.
General framework The BNetzA has to redetermine the equity yield rate in the electricity gridOn March 22, 2018, the Düsseldorf Higher Regional Court decided that the BNetzA had a faulty approach in its method to determine the equity yield rate. About 1,100 municipal utilities and network operators, including DB Netze Energy, had lodged a complaint against the permitted equity yield rate which BNetzA had reduced. The court did not provide any guidelines re garding the new rate. BNetzA has ap pealed against the decision to the Federal Supreme Court.
Further development of grid access model for traction currentDB Netze Energy has been providing network access to the traction current grid since 2014. In the year under review, we took significant steps to make processrelated simplifications to the network access model. The corresponding suggestions are now the subject of a market consultation by the BNetzA that began in October 2018, which should lead to a formal determination by the Federal agency. This disposition will make the network access model binding and provide a stable basis for its ITbased implementation. Apart from that, the development of the market share of nonGroup suppliers shows that there is functional competition in the traction current grid: in the year under review, some 70% of the final consumption of nonGroup railways was provided by other suppliers.
Digitalization and innovationCharging infrastructure for electric mobilityDB Netze Energy participated in the charging at the station project under the BMVI’s Federal program on charging infrastructure for electric vehicles in Germany. A publicly accessible quickcharging infrastructure with ecopower has been set up at the Frankfurt am Main, Hanau, Regensburg and Düsseldorf stations. Thanks to participation in the roaming association, customers of other emobility providers can also use the charging infrastructure. With this project, we are supporting the further development of the intermodal interface between road and rail.
Development in the year under review ◊ Declining demand for traction current – industrial
customer business growing. ◊ Significant price increases on the primary energy markets,
which can only be partially passed on to customers. ◊ Increased capital expenditures in new construction and
renovation of traction current lines.
Supply reliability remained at its previous high level. We surveyed about 250 customers regarding customer
satisfaction. Following the change in our data collection cycle, there was no measurement of customer satisfaction in the previous year. Customer satisfaction in the year under review was again high. The reduction in comparison to 2016 can be explained by changes in the area of traction current.
Development declined in volume terms: ◊ Sales of traction current declined slightly. The lower
demand from intraGroup customers, particularly from freight transport, was largely compensated by increased demand from nonGroup customers.
◊ The traction current volume passed through on behalf of nonGroup customers decreased primarily because of the nonrecurrence of oneoff effects of the previous year.
◊ In stationary energy, the sales volume decreased. The key factor here was the reduced opportunities for optimization on the electricity market. On the opposite side, business with industrial customers increased.
◊ The declining demand for diesel fuels is attributable to the development of intraGroup customers in freight and regional passenger transport.
The economic development declined significantly. Sharp in creases in purchase prices on the primary energy markets could only be partially compensated by revenue growth, meaning that the operating profit figures worsened.
GR
OU
P M
AN
AG
EM
EN
T R
EP
OR
T
163
GROUP MANAGEMENT REPORT — DEVELOPMENT OF bUSINESS UNITS
FIN
AN
CIA
L S
TA
TE
ME
NT
SS
US
TA
INA
bIL
ITY

◊ Revenues were higher than in the previous year as a result of price and volume increases in the industrial customer business, along with higher sales prices for mineral oil products. Decreased demand from intraGroup custom ers and declining sales volumes from the transmission of traction energy was therefore more than compensated.
◊ The significant increase in other operational income (+ 58.2%) resulted from positive effects from the release of provisions and increased insurance income.
On the expenses side, higher energy purchase prices was the key factor:
◊ Cost of materials (+ 6.5%) rose significantly. Negative effects from increased primary energy prices for electricity and mineral oil products were only marginally compensated by decreased purchase volumes.
◊ Personnel expenses (+ 3.3%) increased primarily as a result of collective bargaining agreements.
◊ The decrease in other operating expenses (– 13.3%) can first and foremost be explained by changes to presentation not affecting profits. Cost of materials worsened by a counteracting effect.
◊ The decrease in depreciation (– 4.3%) resulted from the adjustment of the balance sheet useful life of individual energy production facilities.
ROCE worsened significantly as a result of a disproportionate decrease in operating profit in comparison to capital employed. The decrease in capital employed is ex plained particularly by temporarily increased liabilities for energy procurement.
The significant decrease in redemption coverage resulted primarily from operating cash flow that was in sharp decline. The slightly lower net financial debt was supportive.
Increased capital expenditures in building new traction current lines and modernizing existing ones resulted in an increase in volume of capital expenditures.
The number of employees increased slightly.Employee satisfaction is measured every two years. The satisfaction index remained stable.
The share of women remained unchanged.The share of renewable energies in the Db traction current
mix µ90 f. increased significantly.
DB Netze Energy 2018 2017
Change
2016absolute %
Supply reliability (%) 99.99 1) 99.99 1) – – 99.99
Customer satisfaction 2) (SI) 78 – – – 80
Customer satisfaction, traction current and diesel 2) (SI) 75 – – – 80
Customer satisfaction, electricity and gas plus (intra-Group customers) 2) (SI) 79 – – – 79
Customer satisfaction, electricity and gas plus (non-Group customers) 2) (SI) 81 – – – 82
Traction current (16.7 Hz and direct current) (GWh) 8,245 8,284 – 39 – 0.5 8,902
Traction current pass-through (16.7 Hz) (GWh) 1,576 1,906 –330 –17.3 1,419
Stationary energy (50 Hz and 16.7 Hz) (GWh) 18,196 19,331 – 1,135 – 5.9 17,589
Diesel fuel (million l) 429.6 436.1 – 6.5 – 1.5 433.7
Total revenues (€ million) 2,850 2,794 + 56 + 2.0 2,779
External revenues (€ million) 1,350 1,301 + 49 + 3.8 1,194
EBITDA adjusted (€ million) 87 141 – 54 – 38.3 197
EBIT adjusted (€ million) 21 72 – 51 – 70.8 126
ROCE (%) 2.0 6.7 – – 14.3
Capital employed as of Dec 31 (€ million) 1,053 1,081 – 28 – 2.6 878
Net financial debt as of Dec 31 (€ million) 623 630 – 7 – 1.1 390
Redemption coverage (%) 9.8 17.7 – – 32.9
Gross capital expenditures (€ million) 187 177 + 10 + 5.6 174
Net capital expenditures (€ million) 65 53 + 12 + 22.6 52
Employees as of Dec 31 (FTE) 1,734 1,721 + 13 + 0.8 1,736
Employee satisfaction (SI) 3.8 – – – 3.8
Employee satisfaction – follow-up workshop implementation rate (%) – 100 – – –
Share of women in Germany as of Dec 31 (%) 13.8 13.5 – – 13.3
Share of renewable energies in the DB traction current mix (%) 57.2 44.0 – – 42.0
1) Preliminary figure (not rounded).2) No survey conducted in 2017.
√
Deutsche Bahn Group 2018 Integrated Report
164

Subsidiaries/other
Db Engineering&ConsultingDB E & C expertise is in demand worldwide:
◊ DB E & C has been involved in planning the traffic systems and structural engineering for the TEN project Karlsruhe — Basel. The contract was expanded in the year under review to include equipment technical services. Through this, DB E & C is delivering a complete planning service including plan and acceptance testing and construction oversight for the plan approval section Haltingen — Weil am Rhein and Basel.
◊ Since June 2018, DB E & C has been tasked with overseeing the construction of platform facilities including passenger underpasses as part of the modernization of Dortmund central station. This includes construction management planning services, welding and environmental supervision, and health and safety coordination.
◊ In January 2018, DB E & C signed a consultancy agreement for “Mumbai Metro Line 4” in Mumbai, India. The 32.5 km line, with 32 stations, is planned to carry some 335,000 passengers every day in 2031. As general consultant, DB E & C is managing a consortium with Louis Berger and Hill International. After Bhopal and Indore, this is now the third major metro project that DB E & C has acquired in India in just a few months.
◊ Together with Yenon, DB E & C won the tender for planning and supervising the construction of the 28 km local “Purple Line” in Tel Aviv, Israel. The experts are also providing services to integrate a further local line (“Red Line,” 24 km) into the overall system for the CRTGCREEG joint venture. Furthermore, DB E & C is advising ISR, Israel’s stateowned railway company, on its electrification program, on defining standards and on procuring rolling stock.
Digitalization and innovationIbN-InfraTool provides efficient project development through digitalizationManaging commissioning requires the bundling of technical, organizational and schedulerelated factors of an infrastructure project and ensures the conditions are met for safe, plancompliant and punctual commissioning.The IBNInfraTool supports commissioning management with structured data and document collection, management and assessment, smart connections, completeness and plausibility tests, and the automated generation of reports and applications.
Development in the year under review ◊ Personnel expenses increased as a result of collective
bargaining agreements and a higher number of employees. ◊ Optimization of the service companies. ◊ Digitalization and Group projects advanced.
Subsidiaries/other 2018 2017
Change
absolute %
Total revenues (€ million) 4,990 4,854 +136 +2.8
External revenues (€ million) 573 627 – 54 – 8.6
EBITDA adjusted (€ million) –200 –136 – 64 + 47.1
EBIT adjusted (€ million) – 453 –392 – 61 +15.6
Gross capital expenditures (€ million) 511 358 +153 + 42.7
Net capital expenditures (€ million) 508 357 +151 + 42.3
Employees as of Dec 31 (FTE) 53,877 51,937 +1,940 + 3.7
The area Subsidiaries/other encompasses the governancefunctions (such as corporate development, finance and treasury, and Human Resources) and the dependent administrative service units (such as Shared Service Center ac count ing and HR services) of the holding company DB AG. This segment also bundles the legally independent ad ministrative service units within DB Group (such as DB Temporary Work and DB JobService) and the independent operating service units (such as DB Vehicle Maintenance and DB Systel) which provide services to several DB Group business units.
The increase in total revenues resulted primarily from higher revenues generated with intraGroup customers, including in connection with an increased IT project business at DB Systel, projects in the area of construction works in infrastructure at DB Bahnbau, and for security and clean ing services. There was a counteracting effect partially from the decrease in construction and project business at DB Bahnbau with nonGroup customers.
The decrease in operating profit came about primarily because of collective bargaining effects in personnel expenses, an increase in IT services expenses and project costs as a result of measures to improve reliability and product quality.
Higher capital expenditures resulted inter alia from contract extensions for two rental properties which are treated as finance leases. Beyond that, capital expenditures for Group projects increased, including in the area of digitalization and as a consequence of the purchase of construction vehicles at DB Bahnbau.
The number of employees increased, partly as a result of additional recruitment for Group projects and service commissions and the increase in inhouse production volumes, especially at DB E & C, DB Systel, DB Services, DB Vehicle Maintenance and DB Security.
GR
OU
P M
AN
AG
EM
EN
T R
EP
OR
T
165
GROUP MANAGEMENT REPORT — DEVELOPMENT OF bUSINESS UNITS
FIN
AN
CIA
L S
TA
TE
ME
NT
SS
US
TA
INA
bIL
ITY

Opportunity and risk report
166 Opportunity and risk management within DB Group168 Major opportunities and risks
Opportunity and risk management within DB GroupOpportunity and risk management in DB Group comprises the systematic identification, assessment and management of opportunities and risks. The primary objective of oppor-tunity and risk management is to ensure the long-term exis-tence of DB Group.
The principles of opportunity and risk management are laid down by Group management and implemented on a Group-wide basis. As part of our early-warning system, op -portunity and risk reports are submitted to the Manage-ment Board and the Supervisory Board of DB AG three times a year. Major risks occurring outside of this reporting cycle must be reported immediately. Planned acquisitions are subject to additional specific monitoring.
Our risk management system (RMS) maps all of the op -portunities and risks in an opportunity and risk portfolio and also individually in detail, factoring in materiality thresh- olds. The opportunities and risks considered within the risk management report are categorized and classified accord- ing to probability of occurrence. Together with possible con- sequences, the analysis also takes into account the starting position and the cost of countermeasures. In organizational terms, Group controlling is the central coordination point for our opportunity and risk management.
Our strategic opportunity and risk management efforts are mainly derived from the targets and strategies of our busi-ness units. Operational management personnel in the busi-ness units are directly responsible primarily for the early and regular identification, analysis and management of stra- tegic opportunities and risks. These activities are an inte-gral element of the Group-wide planning and controlling systems. We focus intensely on detailed analyses of our markets and competitors, market scenarios, relevant cost drivers and critical factors for success, including those within our political and regulatory environment. Concrete oppor-tunities for specific business units are identified and ana-lyzed from these.
DB Group’s business environment is in a state of con-stant change. Only if we understand the change, we can actively shape it. We use DB.Trend.Radar to monitor the ex ternal developments most important to DB Group so that we can take advantage of opportunities and react to risks in good time. The focus is on the issue of how chan ges in society, pol itics, technology and the global economy affect our markets. The individual topics are all highly intercon-nected and of great importance for the future of DB Group. DB.Trend.Radar helps DB Group to focus its business oper-ations on the future and actively make use of opportunities.
In conjunction with Group financing, with its strict focus on the operating business, Group Treasury is responsible for limiting and monitoring the resulting credit, market price and liquidity risks. The centralized handling of the relevant trans actions (money market, securities, foreign exchange
!!!
A S S E S S M E N T O F R I S K P O S I T I O N B Y C AT E G O R I E S
Opportunity and risk portfolio for the 2019 financial year very likely as of Dec 31, 2018 (€ billion) likely
Risks Opportunities
Economic climate, market and competition 0.03
Production and technology 0.08 0.06
Personnel 0.10
Opportunity and risk portfolio for the 2018 financial year very likely as of Dec 31, 2017 (€ billion) likely
Risks Opportunities
Economic climate, market and competition 0.1
Production and technology 0.2 0.1
Procurement and energy market 0.1
Further information µ168 ff.
Deutsche Bahn Group 2018 Integrated Report
166

and derivative transactions) means that potential risks can be managed and limited centrally. Group Treasury is orga-nized in line with the appropriate risk control and manage-ment system minimum requirements for banks (Mindest-anforderungen an das Risikomanagement; MaRisk), which means that it complies with the resulting criteria of the Act on Supervision and Transparency in the Corporate Sector (Gesetze zur Kontrolle und Transparenz im Un ter neh mens-bereich; KonTraG).
Key characteristics of ICS and RMS with regard to the Group accounting processOur RMS is complemented by a Group-wide internal control system (ICS) that also includes the accounting-related pro-cesses. To the extent that is deemed to be appropriate, the components of our ICS take into account the principles pub-lished by the Committee of Sponsoring Organizations of the Treadway Commission (COSO) called the “Internal Con-trol – Integrated Framework” in its revised version from 2013. On that basis, our accounting-related ICS is a continuous process based on basic control mechanisms, such as sys-tem-based and manual reconciliations, the separation and clear definition of functions as well as the monitoring of compliance and further development of Group-wide guide-lines and special work instructions.
The accounting-related control mechanisms we use beyond the instruments outlined above include standard-ized reporting throughout DB Group and the regular updating of the relevant accounting directives and account-ing-related systems.
Subject to a binding schedule, business transactions of the accounting-relevant units are processed in line with IFRS principles and in compliance with Group-wide, uniform procedures. These are then transmitted to the centralized consolidation system.
The auditing activities of the intra-Group auditors, which represent a key element of our control mechanisms, are focused on evaluating the adequacy and effectiveness of our ICS. Audits are also conducted during the stocktaking of property, plant and equipment as well as inventories. In addition to these measures, the Audit and Compliance Com- mittee and the Supervisory Board monitor the ac count ing process and the effectiveness of the ICS.
The management of the companies included in the scope of fully consolidated companies and of the individual business units of DB Group verifies the completeness and ac curacy of the reporting data relevant to the financial state-ments among other aspects, using a quarterly internal re -
porting process. It is also confirmed that the Management responsible have implemented the centrally defined ICS minimum standards for reporting and, where appropriate, have supplemented these with their own documented man-agement and monitoring tools.
Management assessment of the risk situationThe current risk situation is assessed on the basis of our RMS. The system is based on the requirements of the KonTraG and is continually evolving. During the year under review, there were no major methodological changes to that system.
On December 31, 2018, DB Group’s main risks were in the area of production and technology. In comparison to the previous year, the year under review’s total risk position relating to the EBIT forecast for the following year has re -duced slightly (€ –0.2 billion). Amongst other reasons, this is because risks with a higher probability of occurrence have already been almost completely accounted for in the forecast.
For the forecast of EBIT development µ178 f. in the 2019 financial year, risks after taking into consideration counter-measures amounting to € 0.2 billion exist (thereof very likely (vl): € 0.1 billion). These risks are primarily in the areas of personnel, production and technology, as well as economic climate, market and competition.
Opportunities beyond the EBIT forecast exist in the amount of € 0.1 billion (thereof vl: € 0.0 billion). These opportunities exist in production and technology.
We have addressed further quality improvements relating to punctuality and journey comfort in rail transport in Germany in our Agenda for a Better Railway µ66 ff. and the five-point plan µ68 to be implemented in 2019.
Third-party evaluation is also an important indicator for overall risk assessment. In addition to internal risk assess-ment, DB Group’s creditworthiness and its aggregated default risk is also assessed by the two rating agencies µ103 Moody’s and S&P. Their external assessments of DB Group’s overall risk position are reflected in the good ratings.
In terms of organization, we have created all of the con-ditions necessary to enable the early identification of pos-sible risks. Our continuous risk management and the active management of key risk categories contribute to limiting risks. Key strategic opportunities and risks were identified at the business unit level and recorded in the course of the Strategic Management Process (SMP) for operationaliza-tion with measures. The results of our analyses of opportu-nities and risks, countermeasures, hedging and precau-tionary measures, together with the opinion of the Group
GR
OU
P M
AN
AG
EM
EN
T R
EP
OR
T
167
GROUP MANAGEMENT REPORT — OPPORTUNIT y ANd RISK REPORT
FIN
AN
CIA
L S
TA
TE
ME
NT
SS
US
TA
INA
BIL
ITy

Oppor- tunities
Management Board based on the current risk assessment and our mid-term planning (MTP), indicate that there are no risks that, individually or jointly, could have an impact on the net assets or the financial or profit position of DB Group and would pose a threat to the Group as a going concern.
Major opportunities and risks
Economic climate, market and competition ◊ Scope: macroeconomic fundamentals, business environment,
intermodal and intramodal competition, ordered services market for passenger transport, service offerings and penalties
Demand for our mobility services and, in particular, for our transport and logistics services is dependent on overall eco- nomic development, among other things:
◊ Economic growth fuels the trends underlying our strat- egy in our markets.
◊ Macroeconomic shocks such as economic and financial crises and economic fluctuations may adversely affect our business.
◊ Risks arising from depleted public sector budgets in some European countries could have negative effects (particularly in the form of spending cuts), especially on DB Arriva activities. The market volume here is greatly
determined by the financial situation of the contracting organizations. However, this creates the possibility that new markets or market segments will be opened for com- petition. With DB Arriva, we have positioned ourselves in such a way that we are well prepared to take advan-tage of the opportunities posed by open and opening markets.
◊ Developments in the competitive environment are of particular importance for DB Group:
◊ In long-distance transport, we are exposed to heavy intermodal competition, particularly with motorized individual transport as the dominant competitor, but also with long-distance bus services and air transport.
◊ There is intense competition in regional transport throughout Europe for securing long-term transport contracts. There is a risk of performance losses. To be able to remain competitive in this market, we are constantly working to optimize our tender manage-ment and our cost structures. In addition, risks arise from performing transport contracts if the parame-ters of the underlying calculation do not proceed as planned. In order to continuously increase quality and customer satisfaction and improve our efficiency, we have put together appropriate programs at DB Regional and DB Arriva.
◊ There is a great deal of competition in rail freight transport. Risks arise from the fact that competitors can operate with less expensive cost structures while enjoying greater flexibility. Further risks result from
102-11
GRI
Risks
O V E R V I E W O F O P P O R T U N I T I E S A N D R I S K S
Digitalization
Improving digital services for internal process and customer offerings.
Liberalization
Opening up the market in Europe offers opportunities for growth.
On-demand transport
Flexible solutions supplement existing offers.
Work environment
Increased appeal as an employer resulting from the life-cycle-oriented HR policy.
Product quality improvements
Improving the user experience and increasing customer satisfaction in all business operations.
Green products
Positive perception of the company based on unique environmental characteristics.
Digital platforms
Loss of the interface to the customer, greater price transparency.
Competition
Extensive changes in the competitive environment, for example due to new competitors.
Market changes
Shifts and changes in the significance of industries and markets.
A lack of skilled employees
Increased compe-tition for well- educated junior staff.
Innovative technologies
Significant changes, for example due to the reduction of flows of transport.
Climate change
Restrictions due to an increased fre-quency of extreme weather events.
Deutsche Bahn Group 2018 Integrated Report
168

possible future efficiency gains of trucks, for exam- ple, by digitalization. Several measures have been implemented to tackle these challenges.
◊ In the freight forwarding business, there is on the one hand intense competition with other providers, and on the other hand, a concentration in the carrier market that causes changes in the offerings of cargo space with corresponding effects on purchase and sales prices. We are responding to this by further ex - panding our networks and improving our cost struc-tures, services and IT infrastructure.
Overall, a general risk is a loss of competitiveness. A key com- ponent in facing competition is improvements in service quality. In terms of the integrated rail system, we set out the Agenda for a Better Railway µ66 ff., particularly in order to improve the product quality.
Key opportunities for performance enhancements result from the trend towards digitalization:
◊ Processes can be made more efficient and more custom-er-focused.
◊ Customers can be offered improved and new digital services.
◊ Online portals and apps facilitate access for customers. ◊ In the medium-term, changes in the competitive envi-
ronment may result from the following developments: ◊ New competitors: In addition to established compet-
itors, providers that have so far remained outside the industry, such as automobile manufacturers, IT groups and start-ups are increasingly active in our markets.
◊ New platforms/data-driven business models: Digital platform providers increase the intensity of compe-tition and transparency in passenger transport and logistics and also change how customers perceive prices. Start-ups in particular are the driving force behind the platform business and aim to occupy the digital customer interface.
◊ Shifts in added value: Added value in the mobility and logistics sector could shift towards additional services.
◊ Integrated on-demand mobility: Mobility-as-a-Service (MaaS) concepts are becoming part of the standard offer in the long term. The customer can order, book and pay for transport easily and in real time.
◊ Demographic developments are increasing the pres-sure on the public sector to make use of favorable offers. Public transport authorities could also change their ordering behavior and tenders could be supple-mented to include on-demand, minibus and shuttle services. This increases the cost pressure on estab-lished providers.
◊ Supply chain visibility: Transparency in the value- added chain is one of the top trends in logistics. Start- ups and established players see data and analy- sis solutions as a significant business opportunity.
◊ Goods structure effect: The production share of highly specialized goods such as pharmaceuticals and high-tech products is growing strongly. At the same time, types of goods with a generally lower weight and higher value density, such as electronic components, are growing at an above-average rate. Heavy, bulky goods, such as steel, paper and chem-icals are becoming less important.
To adequately tackle the resulting risks and opportunities, we have developed, among other things, our comprehen-sive digitalization strategy with a separate digital eco-man-
agement system µ69 f. We are also responding to opportunities and risks
arising from changing demand patterns and from shifts in traffic patterns throughout the Group with intensive market observation and by continuously upgrading our portfolio and our products.
The demand for our products and services is partly de pen dent on the development of our customers’ sales markets:
◊ Our customers’ economic development dictates their need for storage and transport services. In addition, there may be structural changes in the production struc-tures of our customers. The rising costs of globally dis-tributed production make regional production more efficient. Another reason for regionalization is the use of production innovations, such as automation, modular-ization and 3D printing with the potential to relativize wage cost differences and economies of scale.
◊ Rail freight transport is partly dependent on industries that are stagnating. The decline of coal as an energy source, for example, is having an effect.
◊ The development of demand in track infrastructure is dependent on the competitions of the rail mode of trans- port on the upstream transport markets.
GR
OU
P M
AN
AG
EM
EN
T R
EP
OR
T
169
GROUP MANAGEMENT REPORT — OPPORTUNIT y ANd RISK REPORT
FIN
AN
CIA
L S
TA
TE
ME
NT
SS
US
TA
INA
BIL
ITy

Production and technology ◊ Scope: technical malfunctions, technology risks
(vehicles, infrastructure, IT and telecommunications), customs offenses, thefts, maintenance, fire protection, environmental remediation, noise abatement, technical further development and sale of real estate
If the production quality of passenger transport services suffers, this has an impact on service quality and can lead to the loss of customers. Postponed deliveries of new vehi-cles may result in revenue losses and additional expenses, for example due to substitute transport services or penalty payments.
The availability and the condition of the track infrastruc-ture are significant prerequisites for competitive rail trans-port. In order to maintain the future viability of rail in the long term, it is also necessary to modernize the infrastruc-ture through digitalization and automation.
Intense construction work on the network affects sched-ules and the production quality of carriers to a different extent, depending on the region, some of which cannot be compensated for.
The range and quality of our services depends to a sig-nificant extent on the availability and reliability of the pro-duction resources used, the intermediate services procured and the quality of our partners’ services. We therefore keep up an intense dialog with our suppliers and business part-ners on the subject of quality. This is of particular impor-tance in the vehicle industry.
Sufficient availability of our vehicle fleet is particularly critical. Significant restrictions endanger operating sched-ules. In regional transport, there is the additional risk of penalties imposed by the relevant contracting organiza-tions if trains are canceled or punctuality is inadequate. We try to minimize this risk by taking preventative actions and also by minimizing the consequences should it happen, such as by providing replacement vehicles or by organizing substitute transport.
The technical production resources used in rail transport must comply with applicable standards and any require-ments which are potentially subject to change. As a result, we may receive technical complaints concerning our vehi-cles. This leads to the risk that we may not or only under certain conditions, such as limited speeds, shorter mainte-nance intervals or reduced wheel set loads, be permitted to use indi vidual series or rail car types. In addition, we cannot accept newly purchased vehicles that have flaws or for which the necessary vehicle certification has not been granted.
Technical defects or requirements may make modifications to vehicles necessary, potentially leading to significant restrictions to availability or even temporary suspensions.
In regional transport, a risk can arise from the redundancy of vehicles following the expiry or re-tendering of a trans-port contract. As a countermeasure, alternative possible uses are checked continuously.
Increasing digitalization means that dependence on secure IT that is available around the clock is increasing. This will result in risks, such as the interruption of the avail-ability of IT systems or unauthorized third parties accessing customer data.
We combat these risks through forward-thinking IT security management, which provides the necessary secu-rity for our IT-based business processes. An important tool in this process is risk management of information, IT appli-cations and IT infrastructures/services. The relevant risks are identified, analyzed, evaluated and reduced.
The remaining risks are documented and if necessary re -ported to and monitored by suitable bodies. Our IT security management follows international standards as set out in ISO 27001/27002:2013 and the NIST Cybersecurity Framework.
It is also vital to have an overall understanding of the risks on the technical and personnel levels in order to appropri-ately address security risks. Weaknesses in procedures and in compliance with security rules often create openings for attacks. Creating a lasting awareness of security in different groups of employees therefore contributes to recognizing unusual situations (such as phishing e-mails) early and con-sequently reducing exposure to attacks.
In order to minimize critical technical holes in security, a wide variety of countermeasures (e.g. firewalls, encryption and isolated server areas, prompt installation of software updates) are used. Appropriate redundancy in IT systems (also across several locations) increases overall protection against failure of critical business processes, applications and infrastructures. Redundancy is also built into the net-work infrastructure as a whole where this is required to ensure information security and business continuity.
Penetration tests and Red Team stress tests are con-ducted systematically and regularly for the most important processes and IT applications, with the aim of detecting weak points at an early stage and eliminating them.
Deutsche Bahn Group 2018 Integrated Report
170

Altogether, these measures reduce the risks of attacks, the failure of IT systems arising from them, the disruption of communication or the theft of confidential information, and therefore avoid the resulting damages to DB Group.
Punctuality µ76 f. is a key criterion for our rail freight transport customers when selecting a mode of transport. In addition to this, irregularities can occur during transport, such as customs offenses and theft. We combat these risks with measures such as engaging qualified customs coordi-nators and using an immediate reporting system for tax assessment notices.
Human Resources ◊ Scope: collective bargaining agreements, Group-wide
labor market, pension commitments
To be able to hold our own against the competition, our per- sonnel cost structure plays an important role. Our target is always to conclude competitive collective bargaining agree- ments in terms of the labor market and the transport market.
Due to demographic changes and the associated lack of skilled employees, it is becoming increasingly difficult to fill vacancies with qualified personnel. This in turn leads to risks such as lack of know-how transfer. At the same time, DB Group has a relatively high annual need for new em ployees. This is strengthened by the selection model µ85 agreed as part of the collective bargaining negotiations. We coun-teract the resulting risks in particular by improving our employer attractiveness µ83 f. and by undertaking ex tensive recruitment measures.
Our life-cycle-oriented HR policy gives us the opportu-nity to promote loyalty among employees in the long term. Flexible working time models and jobs designed specifi-cally for the age of the employee, the job security we offer and our intensive work on our corporate culture contribute to this.
Extensive new appointments create diversity in the work- force, which can lead to more creativity and productivity if there is an intensive transfer of knowledge and good diver-sity management. Young employees bring new ideas and concepts into the working routine. Older employees have varied and extensive experience and pass on their knowl-edge to new groups of employees. In addition, new perspec-tives and viewpoints are contributed to the solution-finding process in mixed teams. In the long term, and in an appro-priate corporate culture, this can have an impact on the innovation capacity and performance of DB Group.
Regulation ◊ Scope: government intervention or changes in the
regulatory environment relating to track infrastructure (access, pricing and unbundling requirements)
Regulation to the detriment of rail, for example due to ad -di tional legislative requirements, endangers intermodal competitiveness. Changes to the legal framework at national or European level could pose risks to our business. This general regulatory risk could therefore result in tangible negative effects on revenues and profits.
These regulations govern the individual components of the pricing systems, and general terms and conditions ap -plied by our RIC. There are risks of complaints and interven-tion here. Measures that threaten or even prevent DB Group from attaining reasonable returns in the infrastructure busi-ness units (such as intervention in pricing systems) make it more difficult to control these activities from a business perspective and can therefore threaten financing contribu-tions by DB Group for infrastructure capital expenditures.
Political risks are related particularly to the increase of applicable standards and railway industry regulations (e.g. passenger rights). The structure of DB Group may also be exposed to regulatory risks.
In order to respond to risks resulting from changing legal framework conditions on either a national or an inter-national level, we take an active part in the discussions and debates that take place ahead of this type of change.
Procurement and energy market ◊ Scope: price trends on procurement markets,
full auctioning of CO₂ certificates
Purchase prices for raw materials, energy and transport services vary according to market conditions.
We respond to the risk of increasing energy prices among other things by using appropriate derivative financial instru-
ments µ209 ff. and entering into long-term procurement contracts. However, these safeguards also limit opportuni-ties arising from trends in energy prices. In the event of fal l- ing prices, we do not participate in the market development.
This means that depending on the market and compet-itive situation, it may not be possible or may only be pos-sible to a very limited extent to pass increased costs on to the customer in the short term. This in turn has a negative impact on margins.
!!!
GR
OU
P M
AN
AG
EM
EN
T R
EP
OR
T
171
GROUP MANAGEMENT REPORT — OPPORTUNIT y ANd RISK REPORT
FIN
AN
CIA
L S
TA
TE
ME
NT
SS
US
TA
INA
BIL
ITy

The pooling of demands and optimization of procurement processes create opportunities to leverage further potential in terms of procurement prices.
Noticeable train-path price increases outside of Germany result in significant increases in costs for the utilization of infrastructure. Due to the competition situation, it is not always possible to pass on cost increases.
Capital markets and taxes ◊ Scope: interest rate and currency developments, taxes
A currency risk arises from our international business. This risk, however, is largely limited to the so-called translation risk since there is usually a high regional match between production and sales markets. We use primary and deriva-
tive financial instruments µ209 ff. as one means of countering interest rate and currency risks from our operating busi-ness. Their use is only permitted for hedging purposes in DB Group. There is a risk that these hedging measures will not pay off, or not in the way expected.
To prevent counterparty default risk from financial and energy derivatives, we conclude credit support agreements (CSA) for all longer-term hedges.
Due to the long-term capital employed, we also use long-term, fixed-interest financial instruments. As a result, only new issues are exposed to the risk of rising interest rates. We apply a conservative planning approach to deal with risks arising from capital market performance or a deterioration in credit ratings.
Pensions and similar retirement benefit obligations are partially covered by plan assets from stocks, real estate, fixed-income securities and other investments. Value losses in these assets reduce the cover of pension obligations by plan assets, potentially resulting in DB Group having to pro-vide additional cover.
In addition, there are potential risks from retrospective tax payments resulting from tax audits in progress and from amendments to tax laws.
Law and contracts ◊ Scope: compensation claims, lawsuits,
active and passive claims
As a result of delayed vehicle deliveries and vehicle defects, operating difficulties and breaches of contract or non-com-pliance events arise with respect to contracting organiza-tions in regional transport. Higher expenses and penalty payments combined with lower revenues from fares are the result. Ensuing damage claims are asserted against the manufacturers.
Provisions have been made for legal and contractual risks based on an assessment of their probability of occurrence.
Compliance with current laws, company guidelines and recognized regulatory standards is the task and duty of every DB Group employee. It is the mission of our compliance
de partment µ254 f. to ensure compliance with such criteria.With its very high purchasing volume and over 40,000
suppliers, DB Group is one of the largest purchasers in Ger-many. Large-scale capital expenditures mean that the infra-structure business units in particular are exposed to a sig- nificant risk of becoming the target and victim of corruption, cartel agreements or fraud. As a provider of grants, the Federal Government places high demands on DB Group with its anti-corruption guidelines.
Opportunities arise from the discovery of cartels that op erated in the past and the enforcement of claims for dam-ages against cartel members. DB Group is seeking compen-sation for damage in over ten cases. This relates, amongst other issues, to cartels in trucks, rails, air freight, lifts and escalators, prestressing of steel, giro card and con tainer transports. In more than ten other cases, DB Group is still determining if damage has been caused.
Significant events ◊ Scope: disasters and accidents, sabotage,
extortion, global political events
Our activities are based on a technologically complex, net- worked production system. In general, we try to combat the risk of operational disruptions through regular maintenance and by taking on qualified employees, coupled with contin-uous quality assurance and improvement of our processes. The nature of rail transport as an open system means that operations can be negatively impacted by certain factors (such as natural disasters, accidents, sabotage and theft) over which we have only limited influence. Our efforts in such cases focus on minimizing the potential effects. However, this could also result in cost risks from countermeasures.
Damage to our infrastructure caused by weather condi-tions leads to loss of income, penalty payments and to a higher resource requirement for repairing damage and pre-ventative measures, amongst other consequences. In order to adapt the means of production to extreme weather events (expansion of vegetation management µ77) and to avoid restricted operating quality due to weather-related con-straints, DB Group is working with national and inter-national experts on the adaptation of external technical regulations to altered climatic conditions.
!!! !!!
Deutsche Bahn Group 2018 Integrated Report
172

Additional measures to improve public security, including at passenger stations, such as upgrading video surveillance µ257, may lead to additional cost burdens.
Other issues Project risksOur measures involve not only some large capital expendi-ture volumes, but also a large number of highly complex projects. Changes to the legal framework, delays in imple-mentation (due among other things to more extensive public participation), necessary adjustments during terms often lasting several years, deviations from the ramp-up curve of funds for capital expenditures agreed with the Federal Government, or changes to purchase prices may lead to project and liquidity risks. The networked produc-tion structure means that these can also affect a number of business units. For example, in such cases planned modal shifts from road to rail will not be feasible. We keep up to date with this by closely monitoring projects. This applies in particular to large, centrally managed projects.
In implementing the planned measures from various programs, such as the Agenda for a Better Railway µ66 ff. for the integrated rail system, or Primus µ142 at DB Schenker, there is the risk that it will either not be possible to imple-ment the planned effects at all, or only to a limited extent, and/or with delays. At the same time, however, there is also the opportunity to exceed the planned effects.
Infrastructure financingAs a key element of the German Rail Reform, the Federal Government has the constitutional obligation to finance capital expenditures in rail infrastructure. The key factor here is securing sufficient funding, but also the ability to plan the availability of funding for the existing network as well as new construction and expansion (requirement plan capital expenditures). A limited availability may lead to less funding being available to maintain the existing network or overcome shortages, thereby restricting the competi-tiveness of rail as a mode of transport.
We have an agreement with the Federal Government that sets out the financing of the existing network until 2019. The LuFV II µ234 f. and the associated long-term secur- ing of infrastructure quality and availability improve the attractiveness of rail as a mode of transport in the long term, which also results in higher revenues for infrastruc-ture companies. Negotiations regarding a successor agree-ment (LuFV III) are ongoing.
The profits of infrastructure companies in turn are plowed back into the infrastructure via the financing circle. Risks result from a potential failure to achieve the contract objec-
tives µ147 specified in the LuFV II and from a possible reclaim by the Federal Government based on an audit of the proper application of funds.
The economic sustainability of capital expenditures or contributions to capital expenditure projects funded with DB funds is essential to ensure DB Group’s ability to invest in the long term.
Political risksDB Group is active in Great Britain through DB Arriva, DB Schenker and DB Cargo. The ongoing uncertainty regard- ing the modalities of Great Britain’s exit from the European Union (Brexit) poses a risk to our activities. Here, it is pri-marily a weakening of the British economy and new trade restrictions hindering freight transport that may have a negative impact. DB Group is counteracting this risk by pre paring as best as possible for a so-called “disorderly Brexit” (Brexit without any exit agreement).
EUROFIMA has given loans to state-owned railways in states that now have poor credit ratings. If these state-owned railways fail to meet their financial obligations to EUROFIMA, this could have repercussions for the carrying amount of the investment, and under certain circumstances trigger further financial obligations.
Environmental risksUnique environmental features, such as climate-neutral transport services in passenger and freight transport on the basis of renewable energies, improve our customers’ positive opinions and thus improve our external percep-tions. This results in considerable opportunities. Our activ-ities have a positive effect on the reduction of green house gases and can also have a positive influence on customer satisfaction and our market position. Our mobility offer must become CO₂-free throughout in order to secure the climate advantage.
Strengthening of environmental protection laws also presents opportunities and risks for DB Group. Opportunities arise primarily for the public passenger transport, particu-larly rail transport. However, measures such as bans on diesel may also have negative impacts on our bus service activities.
!!! !!!
GR
OU
P M
AN
AG
EM
EN
T R
EP
OR
T
173
GROUP MANAGEMENT REPORT — OPPORTUNIT y ANd RISK REPORT
FIN
AN
CIA
L S
TA
TE
ME
NT
SS
US
TA
INA
BIL
ITy

Events after the balance sheet date
174 Three bonds issued174 Collective bargaining negotiations
concluded successfully 174 Awarded tender for regional transport
174 Civil proceedings on infrastructure utilization fees
174 Train accident in Denmark174 Long-distance train order
Three bonds issued
Through DB Finance, we issued three new bonds at the beginning of 2019:
ISIN IssuerCur-
rency
Volume (mil-lion)
Volume (€ mil-
lion)Coupon
(%)Matu-
rityTerm
(years)
XS1936139770DB
Finance EUR 1,000 1,000 1.125 Dec 18 10
XS1950499712DB
Finance GBP 300 340 1.875 Feb 13 7
XS1951373585DB
Finance NOK 1,000 103 2.705 Feb 21 15
Collective bargaining negotiations concluded successfullyThe collective bargaining negotiations µ85 were successfully concluded with EVG on December 14, 2018 and with the GDL on January 4, 2019. Through these negotiations, DB Group succeeded in agreeing consistent regulations. The collective bargaining agreements are valid for 29 months – with ret-roactive effect from October 1, 2018 – until February 28, 2021. In addition to an overall pay increase of 6.1% in two parts, continuation and extension of the option to choose between pay increase, shortened working hours or addi-tional vacation, and improvements to the operational retire-ment benefit were amongst the agreements reached.
Awarded tender for regional transport
◊ DB Regional’s bid was accepted for batches 2 and 3 of the tender awarded for extensive regional transport services, including in particular the Federal states of Ber lin and Brandenburg (Elbe-Spree network). One of the conditions of the tender was that no more than two batches could be awarded to a single provider. In the long term, we will be able to slightly expand our perfor-mance volume.
◊ DB Arriva was awarded its largest rail transport contract to date in the Czech Republic and from December 2019 will be operating four regional lines. The three-year con-
tract with a value of € 45 million includes the option to ex tend for up to two years. It will use 27 diesel railcars taken over from DB Regional and modernized.
Civil proceedings on infrastructure utilization feesThe ECJ ruled in its judgment of November 9, 2017, that an assessment of fairness of the infrastructure utilization fees
through a civil court µ61 pursuant to Section 315 BGB is incompatible with European Railway Law. On the basis of the ECJ judgment, several courts have already passed sev-eral judgments in favor of DB Netz AG and DB Station& Service AG. The judgments are not yet le gally binding. A decision has not yet been reached by the Federal Supreme Court (BGH). The BGH, in a decision of January 29, 2019, suspended a pending proceeding until the BNetzA issues a decision on an application made by a plaintive TOC re -garding a retroactive assessment of utilization fees. The proceeding is expected to be resumed as soon as a bind ing decision is available from the BNetzA regarding this matter.
Train accident in Denmark
On January 2, 2019, there was an accident on the Storbælt Bridge in Denmark involving a DB Cargo train. No final findings regarding the causes and triggers of the accident are yet available. DB Cargo is supporting the Federal agen-cies in their inquiry into the accident.
Long-distance train order
Following a Europe-wide tender, the Spanish manufacturer Talgo was awarded the order for new long-distance trains. The framework contract includes up to 100 trains, con-sisting of electric locomotives and passenger cars. We are ordering 23 new vehicles in the first batch (volume of cap-ital expenditures: about € 550 million), the first of which should come into operation in 2023.
Deutsche Bahn Group 2018 Integrated Report
174

Outlook
175 Overall statement of the Management Board regarding the economic development of DB Group
175 Future direction of DB Group176 Economic outlook slightly lower
176 Growth of transport markets expected to continue177 Procurement markets178 Financial markets178 Expected development of DB Group
Overall statement of the Manage- ment Board regarding the economic development of DB Group
Economic development in the year under review fell below expectations. This was particularly the case for the results in the integrated rail system. Measures introduced to achieve the targeted profit in spite of this included a qual-ified expense management. Following the challenging development in the year under review, the Man agement Board anticipates that DB Group’s performance in the 2019 financial year will also be subdued. In our Agenda for a
Better Railway µ66 ff., we lay down the groundwork for a sustainably successful company. For it is only through high product quality and satisfied customers that revenues and profits can be im proved sustainably. We will also increase our capital expenditures to achieve this. This is necessary to ensure that the in tegrated rail system is fit for the future and to create growth and employment. Our activities are subject to various risks, as described in the Opportunity and
risk report µ166 ff. In the 2019 financial year, we particularly see risks in the areas of personnel and production and tech-nology. The Management Board believes that DB Group has taken the measures necessary to protect itself from existing risks and to be able to take advantage of possible opportu-nities.
Future direction of DB Group
Future business policyIn the 2019 financial year, we intend to maintain our market
positions µ58 and continue to grow organically in our busi-ness units. Through our Agen da for a Better Railway we have laid the groundwork for the actions necessary to achieve this in the coming years. Following the weak development in the year under review, improving punctuality µ76 f. con-tinues to be an area of focus for us.
Future strategic focusAs part of our strategy development in 2018, our Agenda for a Better Railway ad dresses the most important and urgent short-term areas of activity in the integrated rail system in Germany and consolidates them into a specific program portfolio. The focus in 2019 will be on the following programs:
◊ Managing and increasing network capacity and punc-tuality through capacity management and Digital Rail for Germany, expansion of vehicle capacity and avail-ability in DB Long-Distance, securing the necessary staff capacity.
◊ Stabilizing and improving the situation at DB Cargo, sta-bilizing and improving the situation at DB Regional (rail and bus), passenger transport mobility portfolio.
◊ Reinforcing the process perspective and joint manage-ment and leadership.
The Agenda for a Better Railway forms the basis of the future strategic direction of DB Group. Based on this, we will develop a new corporate strategy in the first half-year of 2019 with a target horizon of 2030.
Future sales marketsOur opportunities for growth in the German passenger transport market are limited due to the intensity of com-petition and restrictions imposed by antitrust laws. As a result, we are primarily focused on defending our strong market position and improving the competitive position of the railways in intermodal competition. Over the medium term, we foresee a shift to demand-driven road transport in the German passenger transport market as new data-based business models are established. Autonomous driv- ing, for example, will lead to ever fewer people having to own their own car. At the same time, autonomous transport on the road could potentially make certain areas of public transport independent of stops/stations and schedules, and thus enhance flexibility. Our growth potential in the area of passenger transport services lies in countries out-side of Germany and in cross-border long-distance rail pas-senger transport services.
GR
OU
P M
AN
AG
EM
EN
T R
EP
OR
T
175
GROUP MANAGEMENT REPORT — EvENTs AFTER ThE BAlANcE shEET dATE | OUTlOOk
FIN
AN
cIA
l s
TA
TE
ME
NT
ss
Us
TA
INA
BIl
ITY

In the area of rail freight transport, our focus continues to be on the European market. We are well positioned in all of the central European corridors and offer service connec-tions to locations as far afield as China.
We also do not expect significant changes in the area of freight forwarding and logistics in 2019. DB Schenker is already very well represented in all key markets and regions.
Economic outlook slightly lower
◊ Forecasts for development in 2019 are based on the assumption that there will be no material change in the geopolitical situation.
Anticipated development (%) 2018 2019
World trade + 4.3 ~+ 3.0
GDP world + 3.0 ~+2.5
GDP Eurozone +1.8 ~+1.5
GDP Germany +1.5 ~+1.5
The data for 2018, adjusted for price and calendar effects, is based on the information and estimates available as of February 2019. Expectations for 2019 are rounded off to the nearest half percentage point.
Source: Oxford Economics
Primarily, it is expected that the current developments in the global economy will continue in 2019. Although growth in Europe and the Eurozone is continuing to weaken, it does remain positive. Economic growth in Asia is also shrinking, even if to a far higher level. In the USA, the eco-nomic cycle will probably peak in 2019, but growth remains comparatively stable. Following two relatively strong years, global trade has become noticeably weaker. In addition to the reduced momentum in economic development, the main causes of this are above all weakened expectations and increased uncertainty amongst companies. This re -duces the growth in investments, which has a proportion-ately larger negative impact on worldwide trade.
One of the most significant risks to global economic development continues to be the unpredictability of the restrictions to the US economic and trading policy. The strength of the US dollar is expected to continue to nega-tively impact economic growth, particularly in many devel-oping and emerging countries.
Growth of transport markets expected to continuePassenger transport
Anticipated market development (%) 2018 2019
German passenger transport (based on pkm) +1.0 ~+1.0
Expectations for 2019 are rounded off to the nearest half percentage point.
According to our forecast, the German passenger transport market is expected to continue to grow in 2019, while the growth in volume sold should be slightly above the level of the year under review. A significant factor in this respect is the foreseeable positive development of employment fig-ures and disposable income. At the same time, a significant decrease in fuel prices is expected.
◊ In terms of rail passenger transport, we anticipate strong growth, supported by our own measures to improve our offer and quality. Long-distance transport is likely to grow more strongly than local transport.
◊ Stagnation is expected in public road transport. Al -though long-distance bus transport will again grow slightly, local bus transport is likely to decrease, how-ever, because of demographic trends.
◊ Motorized individual transport may be expected to ben-efit from continued positive labor market conditions, income growth and decreasing fuel prices.
◊ Volume sold in domestic air transport is again expected to grow moderately following the slump in the year under review.
Despite the fact that the situation in Great Britain remains fraught with uncertainties as a result of Brexit, the European passenger transport market appears to be developing pos-itively overall. Rising employment figures and disposable income combined with rising fuel prices should hold up demand, particularly in rail passenger transport. Above-av-erage growth is expected particularly in countries with intensive intra- and intermodal competition, significant investments on infrastructure and vehicle fleets, and con-sistent measures to liberalize markets.
!!!
Deutsche Bahn AG 2018 Integrated Report
176

Freight transport and logistics
Anticipated market development (%) 2018 2019
German freight transport (based on tkm) ~+1.5 + 3.0
European rail freight transport (based on tkm) ~+2.0 +2.5
European land transport (based on revenues) + 3.9 + 3.0
Global air freight (based on t) + 3.5 +2.5
Global ocean freight (based on TEU) + 4.6 + 3.5
Global contract logistics (based on revenues) + 4.4 + 4.5
The data for 2018 and 2019 are based on information and estimates available as of February 2019.
Expectations for 2019 are rounded off to the nearest half percentage point.
In 2019, a continuing strong increase in demand for trans-port in the German freight transport market is to be ex -pect ed. In view of the ongoing positive development of domestic demand and foreign trade, economic growth may continue at a slightly reduced rate if we assume that there are no cat astrophic events, for example from Brexit or the tariff conflicts. The overall market will also continue to be characterized by inter- and intramodal competitive pressure and ongoing resource bottlenecks.
In order to develop rail freight transport in Germany, it is also expected that, in addition to the overall positive economic trends, there will be volume growth because of shifts away from road transport caused by the train-path price support element of the master plan for rail freight
transport µ63, along with the significant increase in road tolls. Following the severe strain caused by low waters in the year under review, inland waterway transport will also benefit from the strong positive baseline effect and the expected increase in coal imports through the ARA ports (Amsterdam, Rotterdam and Antwerp) following the end of coal mining in Germany.
◊ The growth of the European rail freight transport market may be supported above all by intra-European trade with the associated momentum for intermodal transport.
◊ Moderate growth is expected in the European land transport market in 2019. This is influenced primarily by the current political situation in Western Europe whilst in Eastern Europe further strong growth is expected.
◊ The expectations for the global air freight market in 2019 remain limited as a result of the flat general market growth in the fourth quarter of 2018. As far as capacity in the air freight market is concerned, shortages are not anticipated given the continuing supply of new aircraft and addition of new routes. Rates are expected to remain at a strong level.
◊ In terms of global ocean freight, volume growth slightly below the level of the previous year is expected in 2019. It is expected that freight rates will continue to increase as shipping costs will continue to rise as a result of new regulations on low-sulfur ocean freight (IMO 2020).
◊ We expect continuously high growth particularly in the Asia/Pacific, Americas and European regions in con-tract logistics.
InfrastructureOverall, we expect train-path demand to improve as a whole in 2019:
◊ In regional rail transport, we expect positive sales devel- opment thanks to increased regionalization funds.
◊ In long-distance rail transport, there may be increased volumes as a result of extended services.
◊ In rail freight transport, we expect to see significant volume growth as a result of the introduction of train-path price support in rail freight transport.
Also in view of the continuing high levels of construction activity, we anticipate a slightly increasing growth in the development of station stops. Here, the proportion of non-Group railways at the station stops should continue to increase.
Retail revenue (excluding motor vehicles and gas sta-tions) is expected to continue its positive trend uninter-rupted in 2019. Leasing income in stations should be slightly above that of the previous year.
Procurement markets
As a baseline scenario, we expect no shortages on the pro-curement side of the oil and electricity markets. Even if the OPEC+ group were to fully implement their agreed reduc-tions, US production is likely to continue upward. The Inter-national Energy Agency anticipates a balanced market. The risks of rising prices are inherent in potential unplanned production failures.
In Germany, there will continue to be struggles over the design of the new electricity market (Electricity Market 2.0). Short-term price volatility is likely to be further ampli-fied by the ongoing expansion of renewable energies due to the limited ability to forecast them. Wholesale prices are
GR
OU
P M
AN
AG
EM
EN
T R
EP
OR
T
177
GROUP MANAGEMENT REPORT — OUTlOOk
FIN
AN
cIA
l s
TA
TE
ME
NT
ss
Us
TA
INA
BIl
ITY

being boosted by the dismantling of conventional capaci-ties. In addition, climate policy plans to accelerate the transition away from coal and a further cost increase of CO₂ emissions are also contributing factors.
We expect price levels in the construction industry to increase further.
Financial markets
The existing geopolitical risks and the increasing slow-down of the global economy are expected to create a chal-lenging environment in 2019 for the global stock and bond market. To what extent these risks have already been priced into the weak market development in 2018 remains to be determined overall. The end of the stimulation effects, such as the US tax reform and a more restrictive monetary policy in the USA, also place a burden on markets. The ECB is likely to pursue its present course of gradually normalizing their currently still expansive monetary policy. The termination of their net bond purchases as part of the asset purchase program (APP) is the first sign of this.
Expected development of DB Group
Our forecasts for the development of DB Group and the business units in the 2019 financial year are based on our expectations of developments in the market, competition and environment, and the implementation success of the planned measures.
The 2019 financial year will be the first year that DB Group reports under the adoption of the new accounting reporting standard IFRs 16 µ189. The changes to the recog-nition of obligations from leasing contracts will also notice-ably influence the income and financial position:
◊ The elimination of leasing expenses as operating ex -penses will lead to a significantly higher operating profit before depreciation (EBITDA) (~€ +0.8 billion).
◊ EBIT will only be slightly positively affected, however, as a result of the additional depreciation on leased assets (~€ +25 million).
◊ Capital expenditures will noticeably increase (~€ +1.0 billion).
◊ ROCE will decrease to a fundamentally lower level (~–0.4 percentage points) as the capital employed will be dis-proportionately increased compared to EBIT.
◊ In addition, financial debt as of December 31, 2019 will significantly increase on a one-time basis as a result of the inclusion of leasing liabilities (~€ +4.4 billion).
Economic development ◊ Further improvements anticipated in the 2019 financial year. ◊ Noticeable effects of the first application of IFRS 16. ◊ Profit development expected to be weaker.
Anticipated development 2018 2019
Volume sold – rail passenger transport (Germany) (billion pkm) 84.5 > 85
Volume sold – rail freight transport (billion tkm) 88.2 > 97
Train kilometers on track infrastructure (billion train-path km) 1.1 >1.1
Shipments in land transport (million) 106.5 ~110
Air freight volume (export) (million t) 1.3 >1.3
Ocean freight volume (export) (million TEU) 2.2 >2.4
Customer satisfaction – passengers (SI) 75.1 ~77
Punctuality DB Group (rail) in Germany (%) 93.4 > 94
Punctuality DB Long-Distance (%) 74.9 76.5
Revenues (€ billion) 44.0 > 45
EBIT adjusted (€ billion) 2.1 ≥ 1.9
ROCE (%) 5.8 ~4.4
Redemption coverage (%) 17.6 ~17
Volume sold should increase further in the 2019 financial year as a result of the improved service quality and the expansion of the services. Train-path demand should also increase as a result. The increase in demand for re gional rail passenger transport due to additional regionalization funds as well as for rail freight transport as a result of stimuli created by the master plan for rail freight transport
µ63 will also have an impact in this respect. The trend of steadily increasing train-path demand from non-Group cus-tomers will continue.
We also expect a further positive development in vol-umes at DB Schenker.
In 2019, our focus is on stabilizing and improving punc-tuality. The Agenda for a Better Railway µ66 ff. should ensure an improvement in punctuality as soon as the first half-year of 2019.
As a result of the positive performance development, DB Schenker, DB Cargo and DB Long-Distance in particular are expected to drive revenue growth.
In terms of profits, we do not expect revenue gains to be mirrored in profit development. Here, additional ex -penses, e.g. tariff increases and our measures to improve quality and digitalization will be particularly noticeable.
As a result of the expected slight decline in the develop-ment of adjusted EBIT along with a simultaneous significant increase in capital employed (and also first application of IFRS 16), ROCE is expected to decrease. For 2020, we once again expect a noticeably positive development in operating profit and ROCE.
Redemption coverage may above all decrease as a result of the first application of IFRS 16.
!!!
Deutsche Bahn AG 2018 Integrated Report
178

Business units are expected to develop unevenly
Anticipated development (€ million)
Revenues adjusted EBIT adjusted
2018 2019 2018 2019
DB Long-Distance 4,682 q 417 q
DB Regional 8,968 w 492 w
DB Arriva 5,441 e 300 e
DB Cargo 4,460 q – 190 q
DB Schenker 17,050 q 503 q
DB Netze Track 5,511 q 840 w
DB Netze Stations 1,314 q 221 w
DB Netze Energy 2,850 q 21 q
q Above the previous year’s figure e At the previous yearʼs level w Below the previous yearʼs figure
DB Long-DistanceAt DB Long-Distance, we anticipate revenues in the 2019 financial year above that of the previous year, driven by the improvement to the offer, targeted marketing, measures to improve quality and the expected economic development. This is also positively reflected in the development of adjusted EBIT.
DB RegionalAt DB Regional, we anticipate lower revenues in the 2019 financial year and a slightly decreased operating profit development as a result of performance losses.
DB ArrivaThe challenging market environment at UK Bus and Main-land Europe and the cessation of the Arriva Trains Wales franchise at UK Trains is likely to offset the positive effects of the first-time full inclusion of VT-Arriva so that revenues and the operating profit ought to develop at a comparable level to that of the previous year.
DB CargoAt DB Cargo we expect an increase in volume sold in the 2019 financial year because of the effects of the master plan
for rail freight transport µ63 amongst other reasons. Reve-nues should therefore increase. The operating profit should also improve.
DB SchenkerAt DB Schenker, we expect further growth in revenues and operating profit in the 2019 financial year resulting among other things from volume effects and further efficiency increases.
DB Netze TrackIn the 2019 financial year, we expect revenue development at DB Netze Track to be positive as a result of both vol ume and price effects. Additional expense burdens arising from the Agenda for a Better Railway µ66 ff. may, however, lead to a declining operating profit.
DB Netze StationsAt DB Netze Stations, revenues should increase in the 2019 financial year as a result of a volume effect at station stops and annual dynamization. Additional expense burdens arising from the Agenda for a Better Railway µ66 ff. will, how-ever, lead to an operating profit development slightly below that of the previous year.
DB Netze EnergyAt DB Netze Energy, revenue development should be pos-itively influenced, above all, by price effects, and also lead to an improvement in the operating profit.
Top employer
Anticipated development 2018 2019
Employee satisfaction (SI) 3.7 –
Employer attractiveness (rank in Germany) 13 13
We expect our appeal as an employer to develop at a stable rate to a high level. Demographic change will cause the intensity of competition on the labor market to increase further as the available workforce steadily shrinks in all target groups. In addition, other corporations are also focusing on employer branding and recruiting activities.
In accordance with our two-year cycle, there will not be an employee survey in 2019. Instead, follow-up workshops at the team-level will be carried out and their implementa-tion rate will be measured. This format allows us to con-tinue to work on, amongst other issues, improving our employee satisfaction.
Eco-pioneer
Anticipated development 2018 2019
Specific greenhouse gas emissions in comparison to 2006 (%) –33.2 –33.7
Share of renewable energies in the DB traction current mix (%) 57.2 ~60
Track kilometers noise remediated in total as of Dec 31 (km) 1,758 ~1,840
Quiet freight cars in Germany as of Dec 31 50,409 ~57,500
GR
OU
P M
AN
AG
EM
EN
T R
EP
OR
TG
RO
UP
MA
NA
GE
ME
NT
RE
PO
RT
179
GROUP MANAGEMENT REPORT — OUTlOOk
FIN
AN
cIA
l s
TA
TE
ME
NT
ss
Us
TA
INA
BIl
ITY
FIN
AN
cIA
l s
TA
TE
ME
NT
ss
Us
TA
INA
BIl
ITY

In terms of reducing our greenhouse gas emissions, we have already reached a good level as a result of the targeted efficiency improvements, particularly in ocean freight and land transport of DB Schenker and in rail transport in Ger-many. We will continue to reduce specific greenhouse gas emissions from our worldwide transports and the stationary facilities in Germany in 2019. The key measures here are the ongoing modernization of our fleets and facilities and the restriction of greenhouse gas intensity in traction current in Germany through continuously increasing the proportion of renewable energies. Our target here is a proportion of 80% by 2030. The refitting of our freight cars no. 5 onto whisper brakes is moving further toward our target value for 2020.
With regard to noise protection no. 25, we expect addi-tional noticeable relief for those residing close to railway tracks in 2019.
Anticipated capital expenditures
Anticipated development (€ billion) 2018 2019
Gross capital expenditures 11.2 >13
Net capital expenditures 4.0 > 5.5
We will continue our quality and capital expenditure initia-tive for the integrated rail system in Germany with large capital expenditures. We thus intend to improve our quality and customer satisfaction, drive forward digitalization (including IT security improvements) and increase our per-formance capability.
In the 2019 financial year, capital expenditures are again expected to be above the level of the year under review. Increased vehicle capital expenditures at DB Long-Distance (ICE 4 and IC 2) and higher capital expenditures for track infrastructure make an impact in this respect. In addition, the first application of IFRs 16 µ189 has a noticeable effect.
Anticipated financial position
Anticipated development (€ billion) 2018 2019
Maturities 2.2 2.2
Bond issues 2.9 ≤ 3
Cash and cash equivalents as of Dec 31 3.5 ~3
Net financial debt as of Dec 31 (excluding the effects of IFRS 16) 19.5 ~20
Net financial debt as of Dec 31 23.7 1) ~24.4
1) As of January 1, 2019 including the effects of IFRS 16.
Efficient liquidity management is once again a top priority for us in the 2019 financial year. We are focusing on contin-ually forecasting the cash flow from operating activities, as this is our main source of cash and cash equivalents. We produce liquidity forecasts every month on the basis of a rolling 12-month liquidity plan. In the 2019 financial year, we must redeem financial liabilities falling due (excluding commercial paper and current bank liabilities) at about the same level as in the previous year. Funding needs for this are met by issuing public and non-public bonds. Roadshows are planned in Europe and Asia in conjunction with the bond issues.
At the time of producing this report, there was no final resolution regarding complete financing of the funding requirements in 2019.
We continue to have adequate financing scope for our capital market activities based on our debt issuance programs
µ101 f. and commercial paper program µ101 f. The guaranteed
credit facilities µ101 f. serve as a fallback in the event of interrupted access to the capital market. Our short- and medium-term liquidity supply is therefore also secure in the 2019 financial year.
The majority of our gross capital expenditures in the 2019 financial year will again be covered by investment grants. The net capital expenditures to be financed by DB Group will likely also not be fully covered by internal sources in the 2019 financial year.
The net financial debt is therefore expected as of December 31, 2019 to be slightly above the level at the end of the year under review.
We will continue our M&A activities in a selective and focused manner in the 2019 financial year.
F O R WA R D - L O O K I N G S TAT E M E N T S
This management report contains statements and forecasts pertaining to the future
development of DB Group, its business units and individual companies. These forecasts
are estimates based on information that is available at the current time. Actual
developments and profits may diverge from the current expectations as a result of the
assumptions upon which our forecasts are based not materializing or the material-
ization of risks such as those presented in the Risk report.
DB Group does not assume any obligation to update the statements made within
this management report.
Deutsche Bahn AG 2018 Integrated Report
180

Consolidated financial statements 182 Consolidated statement of income 183 Consolidated balance sheet 184 Consolidated statement of cash flows 185 Consolidated statement
of changes in equity 186 Notes to the consolidated financial statements 250 Independent Auditor’s report
FIN
AN
CIA
L S
TA
TE
ME
NT
SS
US
TA
INA
BIL
ITY

Consolidated statement of income
Jan 1 through Dec 31 (€ million) Note 2018 2017
Revenues (1) 44,065 42,693Inventory changes and internally produced and capitalized assets (2) 3,091 2,900Overall performance 47,156 45,593Other operating income (3) 2,998 2,954Cost of materials (4) –22,258 –21,457Personnel expenses (5) –17,301 –16,665Depreciation and impairments (6) –2,688 –2,847Other operating expenses (7) – 6,088 – 5,890
Operating profit (EBIT) 1,819 1,688
Result from investments accounted for using the equity method (8) 12 14Net interest income (9) – 645 –704Other financial result (10) –14 –30
Financial result – 647 –720
Profit before taxes on income 1,172 968
Taxes on income (11) – 630 –203
Net profit for the year 542 765
Net profit attributable to Shareholder of Deutsche Bahn AG 528 745 Non-controlling interests 14 20
Earnings per share (€ per share) (12) undiluted 1.23 1.73 diluted 1.23 1.73
Reconciliation of consolidated comprehensive income
Jan 1 through Dec 31 (€ million) 2018 2017
Net profit for the year 542 765
Changes due to the revaluation of defined benefit plans – 818 651Change in items recognized directly in equity which are not reclassified to the income statement – 818 651 Changes resulting from currency translation 23 –175 Changes resulting from market valuation of securities 0 – Changes resulting from market valuation of cash flow hedges 16 51 Share of profit items not recognized in the income statement due to investments accounted for using the equity method –1 –Change in items recognized directly in equity which are reclassified to the income statement 38 –124
Balance of profit items covered directly in equity (before taxes) –780 527
Revaluation of defined benefit plans 40 – 41
Changes in deferred taxes on profit items recognized directly in equity, which are not reclassified to the income statement 40 – 41
Deferred taxes relating to the change in the market valuation of securities – – Deferred taxes relating to the change in the market valuation of cash flow hedges –1 – 4
Changes in deferred taxes on profit items recognized directly in equity, which are reclassified to the income statement –1 – 4
Balance of profit items recognized directly in equity (after taxes) –741 482
Comprehensive income –199 1,247Comprehensive income attributable to Shareholder of Deutsche Bahn AG –211 1,235 Non-controlling interests 12 12
√
√
Deutsche Bahn 2018 Group Integrated Report
182

Consolidated balance sheetAssets
(€ million) Note Dec 31, 2018 Dec 31, 2017
NON - CUR R ENT A S SET S
Property, plant and equipment (13) 40,757 39,608Intangible assets (14) 3,730 3,599Investments accounted for using the equity method (15) 486 500Available-for-sale financial assets (17) 45 40Receivables and other assets (19) 380 302Derivative financial instruments (21) 216 160Deferred tax assets (16) 1,032 1,416
46,646 45,625
CUR R ENT A S SET S
Inventories (18) 1,369 1,151Available-for-sale financial assets (17) 1 1Trade receivables (19) 4,962 4,571Other receivables and other assets (19) 1,870 1,620Income tax receivables (20) 62 52Derivative financial instruments (21) 47 19Cash and cash equivalents (22) 3,544 3,397Held-for-sale assets (23) 26 0
11,881 10,811
Total assets 58,527 56,436
Equity and liabilities
(€ million) Note Dec 31, 2018 Dec 31, 2017
EQ UIT Y
Subscribed capital (24) 2,150 2,150Reserves (25) 4,074 4,813Retained earnings (26) 7,211 7,110
Equity attributable to shareholder of Deutsche Bahn AG 13,435 14,073
Non-controlling interests (27) 157 165
13,592 14,238
NON - CUR R ENT LIABILITIE S
Financial debt (28) 20,626 19,716Other liabilities (29) 258 233Derivative financial instruments (21) 372 341Pension obligations (32) 4,823 3,940Other provisions (33) 2,246 2,374Deferred items (34) 627 785Deferred tax liabilities (16) 152 121
29,104 27,510
CUR R ENT LIABILITIE S
Financial debt (28) 2,618 2,360Trade liabilities (29) 5,491 5,157Other liabilities (29) 3,660 3,399Income tax liabilities (30) 195 150Derivative financial instruments (21) 19 41Other provisions (33) 2,822 2,743Deferred items (34) 1,021 838Held-for-sale liabilities (23) 5 –
15,831 14,688
Total assets 58,527 56,436
√
√
FIN
AN
CIA
L S
TA
TE
ME
NT
S
183
CONSOLIDATED FINANCIAL STATEMENTS — CONSOLIDATED STATEMENT OF INCOME | CONSOLIDATED BALANCE SHEET
SU
ST
AIN
AB
ILIT
Y

Consolidated statement of cash flows
Jan 1 through Dec 31 (€ million) Note 2018 2017
Profit before taxes on income 1,172 968Depreciation on property, plant and equipment and intangible assets 2,688 2,847Write-ups/write-downs on non-current financial assets 8 0Result on disposal of property, plant and equipment and intangible assets –162 –121Result on disposal of financial assets –37 –19Interest and dividend income –25 – 53Interest expense 669 757Foreign currency result –2 19Result of investments accounted for using the equity method –12 –14Other non-cash expenses and income 871 1,291Changes in inventories, receivables and other assets – 950 – 639Changes in liabilities, provisions and deferred items –176 –1,966Cash generated from operating activities 4,044 3,070Interest received 22 39Received/paid (–) dividends and capital distribution – 8 –10Interest paid – 529 – 592Paid (–)/reimbursed (+) taxes on income –158 –178
Cash flow from operating activities 3,371 2,329
Proceeds from the disposal of property, plant and equipment and intangible assets 431 341Payments for capital expenditures in property, plant and equipment and intangible assets –11,242 –10,524Proceeds from investment grants 7,209 6,724Payments for repaid investment grants –39 – 63Proceeds from sale of financial assets 0 5Payments for investments in financial assets –24 –28Proceeds from sale of shares in consolidated companies less net cash and cash equivalents sold 0 2Payments for acquisition of shares in consolidated companies less net cash and cash equivalents acquired –3 –30Proceeds from disposal investments accounted for using the equity method 0 4
Cash flow from investing activities –3,668 –3,569
Proceeds from capital injection – 1,000Distribution of profits to shareholder – 450 – 600Distribution of profits to minority interests –13 –12Payments for finance lease transactions – 42 – 53Proceeds from issue of bonds 2,927 2,038Payments for redemption of bonds –1,900 –1,819Payments for the redemption and repayment of interest-free loans –204 –206Proceeds from borrowings and commercial paper 185 100Payments for the redemption of borrowings and commercial paper – 54 –209
Cash flow from financing activities 449 239
Net changes in cash and cash equivalents 152 –1,001
Cash and cash equivalents as of Jan 1 (22) 3,397 4,450Changes in cash and cash equivalents due to changes in exchange rates – 5 – 52
Cash and cash equivalents as of Dec 31 (22) 3,544 3,397
√
Deutsche Bahn 2018 Group Integrated Report
184
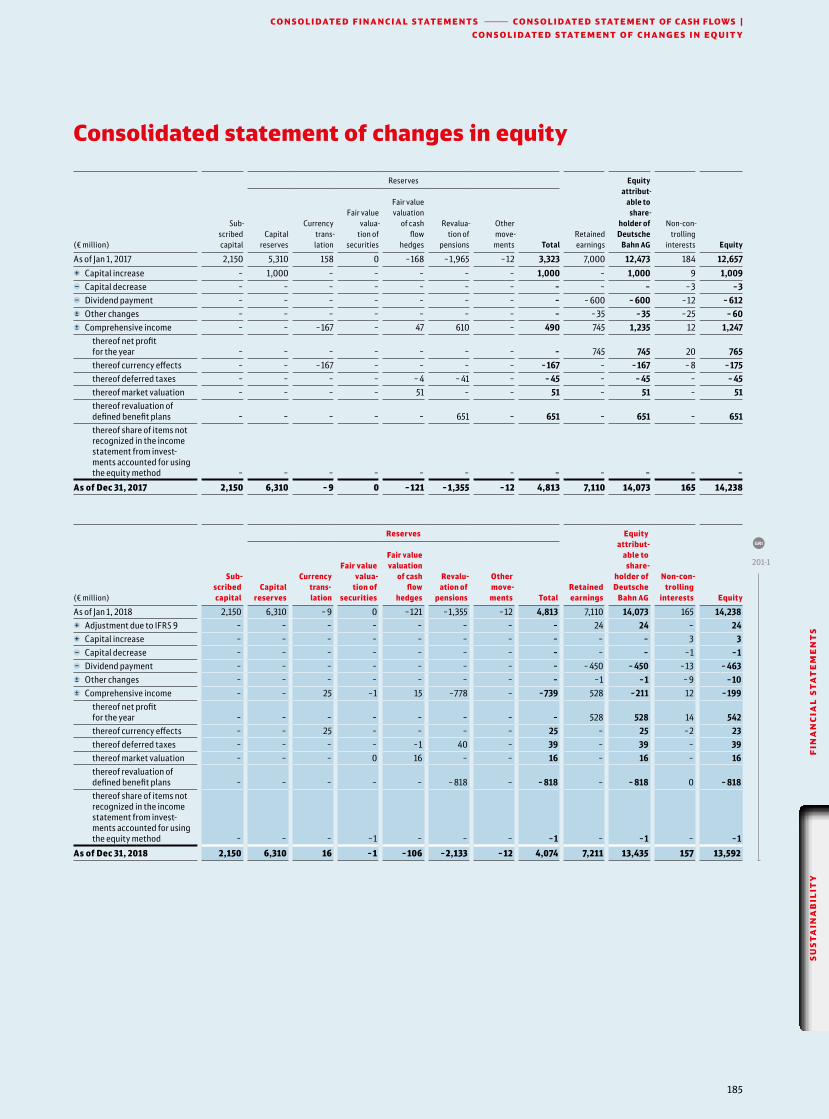
Consolidated statement of changes in equity
(€ million)
Sub- scribedcapital
Reserves
Retainedearnings
Equityattribut-
able to share-
holder ofDeutsche
Bahn AG
Non-con-trolling
interests
EquityCapital
reserves
Currencytrans- lation
Fair valuevalua-
tion ofsecurities
Fair valuevaluation
of cashflow
hedges
Revalua-tion of
pensions
Othermove-
ments Total
As of Jan 1, 2017 2,150 5,310 158 0 –168 –1,965 –12 3,323 7,000 12,473 184 12,657
Capital increase – 1,000 – – – – – 1,000 – 1,000 9 1,009 Capital decrease – – – – – – – – – – –3 –3 Dividend payment – – – – – – – – – 600 – 600 –12 – 612 Other changes – – – – – – – – –35 –35 –25 – 60 Comprehensive income – – –167 – 47 610 – 490 745 1,235 12 1,247
thereof net profit for the year – – – – – – – – 745 745 20 765 thereof currency effects – – –167 – – – – –167 – –167 – 8 –175 thereof deferred taxes – – – – – 4 – 41 – – 45 – – 45 – – 45 thereof market valuation – – – – 51 – – 51 – 51 – 51 thereof revaluation of defined benefit plans – – – – – 651 – 651 – 651 – 651 thereof share of items not
recognized in the income statement from invest-ments accounted for using the equity method – – – – – – – – – – – –
As of Dec 31, 2017 2,150 6,310 – 9 0 –121 –1,355 –12 4,813 7,110 14,073 165 14,238
(€ million)
Sub-scribedcapital
Reserves
Retainedearnings
Equityattribut-
able to share-
holder ofDeutsche
Bahn AG
Non-con-trolling
interests
EquityCapital
reserves
Currencytrans-lation
Fair valuevalua-
tion of securities
Fair valuevaluation
of cashflow
hedges
Revalu- ation of
pensions
Othermove-
ments Total
As of Jan 1, 2018 2,150 6,310 – 9 0 –121 –1,355 –12 4,813 7,110 14,073 165 14,238 Adjustment due to IFRS 9 – – – – – – – – 24 24 – 24 Capital increase – – – – – – – – – – 3 3 Capital decrease – – – – – – – – – – –1 –1 Dividend payment – – – – – – – – – 450 – 450 –13 – 463 Other changes – – – – – – – – –1 –1 – 9 –10 Comprehensive income – – 25 –1 15 –778 – –739 528 –211 12 –199
thereof net profit for the year – – – – – – – – 528 528 14 542 thereof currency effects – – 25 – – – – 25 – 25 –2 23 thereof deferred taxes – – – – –1 40 – 39 – 39 – 39 thereof market valuation – – – 0 16 – – 16 – 16 – 16 thereof revaluation of
defined benefit plans – – – – – – 818 – – 818 – – 818 0 – 818 thereof share of items not
recognized in the income statement from invest-ments accounted for using the equity method – – – –1 – – – –1 – –1 – –1
As of Dec 31, 2018 2,150 6,310 16 –1 –106 –2,133 –12 4,074 7,211 13,435 157 13,592
201-1
GRI
FIN
AN
CIA
L S
TA
TE
ME
NT
S
185
CONSOLIDATED FINANCIAL STATEMENTS — CONSOLIDATED STATEMENT OF CASH FLOWS |
CONSOLIDATED STATEMENT OF CHANGES IN EQUIT Y
SU
ST
AIN
AB
ILIT
Y

Notes to the consolidated financial statementsSegment information according to segments
Jan 1 through Dec 31 or respectively as of Dec 31 (€ million)
DB Long-Distance DB Regional DB Arriva DB Cargo DB Schenker DB Netze
TrackDB Netze Stations
DB NetzeEnergy
Subsidiaries/ Other
Sum of segments
Consolidation
DB Group adjusted
Reconciliation 1)
DB Group
2018 2017 2018 2017 2018 2017 2018 2017 2018 2017 2018 2017 2018 2017 2018 2017 2018 2017 2018 2017 2018 2017 2018 2017 2018 2017 2018 2017
External revenues 4,528 4,193 8,862 8,629 5,433 5,338 4,177 4,209 16,973 16,345 1,559 1,522 569 540 1,350 1,301 573 627 44,024 42,704 – – 44,024 42,704 41 –11 44,065 42,693Internal revenues 154 154 106 105 8 7 283 319 77 85 3,952 3,842 745 725 1,500 1,493 4,417 4,227 11,242 10,957 –11,242 –10,957 – – – – – –Total revenues 4,682 4,347 8,968 8,734 5,441 5,345 4,460 4,528 17,050 16,430 5,511 5,364 1,314 1,265 2,850 2,794 4,990 4,854 55,266 53,661 –11,242 –10,957 44,024 42,704 41 –11 44,065 42,693Other external income 141 167 264 234 210 256 354 269 267 304 832 735 167 134 53 127 574 572 2,862 2,798 – 4 2,862 2,802 136 152 2,998 2,954Other internal income 49 81 92 151 6 – 43 76 9 7 251 255 23 22 34 –72 1,161 1,082 1,668 1,602 –1,668 –1,602 – – – – – –Inventory changes and internally produced and capitalized assets 15 8 83 63 2 – 42 41 6 7 942 890 50 40 21 19 778 722 1,939 1,790 1,152 1,110 3,091 2,900 – – 3,091 2,900Total income 4,887 4,603 9,407 9,182 5,659 5,601 4,899 4,914 17,332 16,748 7,536 7,244 1,554 1,461 2,958 2,868 7,503 7,230 61,735 59,851 –11,758 –11,445 49,977 48,406 177 141 50,154 48,547Cost of materials –2,634 –2,495 – 5,506 – 5,383 –1,630 –1,606 –2,509 –2,513 –11,225 –10,906 –1,968 –1,870 – 594 – 539 –2,617 –2,457 –2,933 –2,826 –31,616 –30,595 9,362 9,154 –22,254 –21,441 – 4 –16 –22,258 –21,457Personnel expenses – 978 – 946 –2,050 –1,968 –2,439 –2,393 –1,654 –1,618 –3,289 –3,142 –2,945 –2,764 –338 –313 –124 –120 –3,331 –3,099 –17,148 –16,363 –1 0 –17,149 –16,363 –152 –302 –17,301 –16,665Other operating expenses – 600 – 551 –725 – 675 –1,015 –1,033 – 682 – 653 –2,115 –2,024 –1,177 –1,126 –260 –237 –130 –150 –1,439 –1,441 – 8,143 –7,890 2,308 2,218 – 5,835 – 5,672 –253 –218 – 6,088 – 5,890EBITDA 675 611 1,126 1,156 575 569 54 130 703 676 1,446 1,484 362 372 87 141 –200 –136 4,828 5,003 – 89 –73 4,739 4,930 –232 –395 4,507 4,535Scheduled depreciation 2) –258 –230 – 633 – 645 –273 –265 –230 –215 –199 –198 – 651 – 839 –141 –139 – 66 – 69 –252 –255 –2,703 –2,855 49 48 –2,654 –2,807 – 60 –73 –2,714 –2,880Impairment losses recognized/reversed 2) – 0 –1 –3 –2 –3 –14 – 5 –1 –1 45 42 – 0 0 0 –1 –1 26 29 – – 26 29 – 4 26 33EBIT (operating profit) 417 381 492 508 300 301 –190 – 90 503 477 840 687 221 233 21 72 – 453 –392 2,151 2,177 – 40 –25 2,111 2,152 –292 – 464 1,819 1,688Net operating interest 3) –1 4 – 51 – 48 –35 –39 – 47 – 51 –38 –38 –206 –245 –32 –34 –17 –16 –189 –215 – 616 – 682 –2 – – 618 – 682 – – – –Operating income after interest 3) 416 385 441 460 265 262 –237 –141 465 439 634 442 189 199 4 56 – 642 – 607 1,535 1,495 – 42 –25 1,493 1,470 – – – –
Property, plant and equipment 3,658 2,837 6,616 6,738 2,217 2,203 2,597 2,291 1,522 1,451 19,514 19,544 3,154 3,145 984 977 1,246 1,158 41,508 40,344 –751 –736 40,757 39,608 – – 40,757 39,608 Intangible assets 8 8 29 22 1,726 1,711 180 161 1,422 1,417 139 138 23 13 24 32 209 111 3,760 3,613 –30 –14 3,730 3,599 – – 3,730 3,599
thereof goodwill 0 0 6 5 1,377 1,387 1 1 1,146 1,131 – 0 0 0 – 0 14 15 2,544 2,539 – – 2,544 2,539 – – 2,544 2,539 Inventories 110 85 208 177 98 97 122 107 75 68 211 168 0 – 89 86 480 382 1,393 1,170 –24 –19 1,369 1,151 – – 1,369 1,151 Trade receivables 4) 57 75 601 437 454 320 481 458 2,504 2,506 164 134 22 29 268 233 400 372 4,951 4,564 – – 4,951 4,564 11 7 4,962 4,571 Receivables and other assets 4) 148 142 512 462 447 414 180 137 640 549 472 271 20 55 161 157 1,585 1,111 4,165 3,298 –2,052 –1,500 2,113 1,798 137 124 2,250 1,922 Receivables from financing 4) – – – – – – – – – – – – – – – – – – – – – – – – –174 –131 –174 –131 Income tax receivables – – 1 – 21 23 3 3 31 18 0 – 0 – 0 – 6 8 62 52 – – 62 52 – – 62 52 Available-for-sale assets 4) – – – – – – – – – – – – – – – – – – – – – – – – 26 0 26 0 Trade liabilities 4) –296 –248 –216 –322 – 634 – 548 – 508 – 506 –2,119 –1,975 – 587 – 529 – 92 – 88 –361 –280 – 572 – 552 – 5,385 – 5,048 1 2 – 5,384 – 5,046 –107 –111 – 5,491 – 5,157 Miscellaneous and other liabilities 4) –297 –293 – 626 – 517 –287 –242 – 619 –311 – 667 – 539 – 674 – 630 –191 –184 – 59 – 52 – 885 – 868 – 4,305 –3,636 2,049 1,500 –2,256 –2,136 –1,662 –1,496 –3,918 –3,632 Income tax liabilities 0 – –1 –1 –77 – 83 –2 – –105 – 63 – – 0 – – – –28 –18 –213 –165 18 15 –195 –150 – – –195 –150 Other provisions –35 – 60 –1,527 –1,349 –305 –137 –174 –198 –390 – 458 –275 –342 –34 – 56 –39 – 59 –2,280 –2,446 – 5,059 – 5,105 – 9 –12 – 5,068 – 5,117 – – – 5,068 – 5,117 Deferred items – 474 –386 –138 –161 –246 –126 – 4 – 6 –12 –13 – 521 – 663 –122 –131 –3 –3 –127 –135 –1,647 –1,624 –1 1 –1,648 –1,623 – – –1,648 –1,623 Deferred liabilities 4) – 95 –131 –200 –172 –194 –189 –209 –167 – 411 –373 –271 –225 –22 –17 –11 –10 –361 –323 –1,774 –1,607 – – –1,774 –1,607 1,774 1,607 – – Held-for-sale liabilities 4) – – – – – – – – – – – – – – – – – – – – – – – – – 5 – – 5 –
Capital employed 5) 2,784 2,029 5,259 5,314 3,220 3,443 2,047 1,969 2,490 2,588 18,172 17,866 2,758 2,766 1,053 1,081 –327 –1,200 37,456 35,856 –799 –763 36,657 35,093 – – 36,657 35,093
Net financial debt 463 –258 2,781 2,885 741 890 1,692 1,356 847 909 9,499 9,386 1,260 1,268 623 630 1,643 1,557 19,549 18,623 – – 19,549 18,623 – – 19,549 18,623
Investments accounted for using the equity method 1 – 4 4 99 124 38 28 11 13 1 1 0 – 0 – 332 330 486 500 – – 486 500 – – 486 500Result from investments accounted for using the equity method 0 – 1 – 7 4 –1 4 1 2 1 – – – 0 – 3 4 12 14 – – 12 14 – – 12 14
Gross capital expenditures 1,081 1,060 539 674 326 374 587 328 273 246 6,901 6,601 883 709 187 177 511 358 11,288 10,527 – 83 – 63 11,205 10,464 – – 11,205 10,464Investment grants received – – –13 – 46 –14 –2 –1 – 4 – – – 6,337 – 5,941 –719 – 606 –122 –124 –3 –1 –7,209 – 6,724 – – –7,209 – 6,724 – – –7,209 – 6,724Net capital expenditures 1,081 1,060 526 628 312 372 586 324 273 246 564 660 164 103 65 53 508 357 4,079 3,803 – 83 – 63 3,996 3,740 – – 3,996 3,740Additions due to changes in the scope of consolidation (acquisition of companies) – – – – 165 66 – 3 – 5 – – – – – – – 1 165 75 – – 165 75 – – 165 75
Employees 6) 16,548 15,993 35,881 35,651 53,056 54,650 28,842 28,257 75,817 71,888 46,969 45,375 5,804 5,463 1,734 1,721 53,877 51,937 318,528 310,935 – – 318,528 310,935 – – 318,528 310,935
1) Relating to special items and reclassification PPA amortization of customer contracts as well as the reconciliation of capital employed to the external display.
2) The non-cash items are included in the segment result shown.3) Key figure from internal reporting, no external figures.4) Content allocation in accordance with management reporting. Previous year adjusted.5) Profit transfer agreements were not assigned to segment assets or liabilities.6) The number of employees comprises the workforce, excluding vocational trainees, and dual degree students
at the end of the reporting period (part-time employees have been converted to full-time employees).
√
Deutsche Bahn 2018 Group Integrated Report
186

Notes to the consolidated financial statementsSegment information according to segments
Jan 1 through Dec 31 or respectively as of Dec 31 (€ million)
DB Long-Distance DB Regional DB Arriva DB Cargo DB Schenker DB Netze
TrackDB Netze Stations
DB NetzeEnergy
Subsidiaries/ Other
Sum of segments
Consolidation
DB Group adjusted
Reconciliation 1)
DB Group
2018 2017 2018 2017 2018 2017 2018 2017 2018 2017 2018 2017 2018 2017 2018 2017 2018 2017 2018 2017 2018 2017 2018 2017 2018 2017 2018 2017
External revenues 4,528 4,193 8,862 8,629 5,433 5,338 4,177 4,209 16,973 16,345 1,559 1,522 569 540 1,350 1,301 573 627 44,024 42,704 – – 44,024 42,704 41 –11 44,065 42,693Internal revenues 154 154 106 105 8 7 283 319 77 85 3,952 3,842 745 725 1,500 1,493 4,417 4,227 11,242 10,957 –11,242 –10,957 – – – – – –Total revenues 4,682 4,347 8,968 8,734 5,441 5,345 4,460 4,528 17,050 16,430 5,511 5,364 1,314 1,265 2,850 2,794 4,990 4,854 55,266 53,661 –11,242 –10,957 44,024 42,704 41 –11 44,065 42,693Other external income 141 167 264 234 210 256 354 269 267 304 832 735 167 134 53 127 574 572 2,862 2,798 – 4 2,862 2,802 136 152 2,998 2,954Other internal income 49 81 92 151 6 – 43 76 9 7 251 255 23 22 34 –72 1,161 1,082 1,668 1,602 –1,668 –1,602 – – – – – –Inventory changes and internally produced and capitalized assets 15 8 83 63 2 – 42 41 6 7 942 890 50 40 21 19 778 722 1,939 1,790 1,152 1,110 3,091 2,900 – – 3,091 2,900Total income 4,887 4,603 9,407 9,182 5,659 5,601 4,899 4,914 17,332 16,748 7,536 7,244 1,554 1,461 2,958 2,868 7,503 7,230 61,735 59,851 –11,758 –11,445 49,977 48,406 177 141 50,154 48,547Cost of materials –2,634 –2,495 – 5,506 – 5,383 –1,630 –1,606 –2,509 –2,513 –11,225 –10,906 –1,968 –1,870 – 594 – 539 –2,617 –2,457 –2,933 –2,826 –31,616 –30,595 9,362 9,154 –22,254 –21,441 – 4 –16 –22,258 –21,457Personnel expenses – 978 – 946 –2,050 –1,968 –2,439 –2,393 –1,654 –1,618 –3,289 –3,142 –2,945 –2,764 –338 –313 –124 –120 –3,331 –3,099 –17,148 –16,363 –1 0 –17,149 –16,363 –152 –302 –17,301 –16,665Other operating expenses – 600 – 551 –725 – 675 –1,015 –1,033 – 682 – 653 –2,115 –2,024 –1,177 –1,126 –260 –237 –130 –150 –1,439 –1,441 – 8,143 –7,890 2,308 2,218 – 5,835 – 5,672 –253 –218 – 6,088 – 5,890EBITDA 675 611 1,126 1,156 575 569 54 130 703 676 1,446 1,484 362 372 87 141 –200 –136 4,828 5,003 – 89 –73 4,739 4,930 –232 –395 4,507 4,535Scheduled depreciation 2) –258 –230 – 633 – 645 –273 –265 –230 –215 –199 –198 – 651 – 839 –141 –139 – 66 – 69 –252 –255 –2,703 –2,855 49 48 –2,654 –2,807 – 60 –73 –2,714 –2,880Impairment losses recognized/reversed 2) – 0 –1 –3 –2 –3 –14 – 5 –1 –1 45 42 – 0 0 0 –1 –1 26 29 – – 26 29 – 4 26 33EBIT (operating profit) 417 381 492 508 300 301 –190 – 90 503 477 840 687 221 233 21 72 – 453 –392 2,151 2,177 – 40 –25 2,111 2,152 –292 – 464 1,819 1,688Net operating interest 3) –1 4 – 51 – 48 –35 –39 – 47 – 51 –38 –38 –206 –245 –32 –34 –17 –16 –189 –215 – 616 – 682 –2 – – 618 – 682 – – – –Operating income after interest 3) 416 385 441 460 265 262 –237 –141 465 439 634 442 189 199 4 56 – 642 – 607 1,535 1,495 – 42 –25 1,493 1,470 – – – –
Property, plant and equipment 3,658 2,837 6,616 6,738 2,217 2,203 2,597 2,291 1,522 1,451 19,514 19,544 3,154 3,145 984 977 1,246 1,158 41,508 40,344 –751 –736 40,757 39,608 – – 40,757 39,608 Intangible assets 8 8 29 22 1,726 1,711 180 161 1,422 1,417 139 138 23 13 24 32 209 111 3,760 3,613 –30 –14 3,730 3,599 – – 3,730 3,599
thereof goodwill 0 0 6 5 1,377 1,387 1 1 1,146 1,131 – 0 0 0 – 0 14 15 2,544 2,539 – – 2,544 2,539 – – 2,544 2,539 Inventories 110 85 208 177 98 97 122 107 75 68 211 168 0 – 89 86 480 382 1,393 1,170 –24 –19 1,369 1,151 – – 1,369 1,151 Trade receivables 4) 57 75 601 437 454 320 481 458 2,504 2,506 164 134 22 29 268 233 400 372 4,951 4,564 – – 4,951 4,564 11 7 4,962 4,571 Receivables and other assets 4) 148 142 512 462 447 414 180 137 640 549 472 271 20 55 161 157 1,585 1,111 4,165 3,298 –2,052 –1,500 2,113 1,798 137 124 2,250 1,922 Receivables from financing 4) – – – – – – – – – – – – – – – – – – – – – – – – –174 –131 –174 –131 Income tax receivables – – 1 – 21 23 3 3 31 18 0 – 0 – 0 – 6 8 62 52 – – 62 52 – – 62 52 Available-for-sale assets 4) – – – – – – – – – – – – – – – – – – – – – – – – 26 0 26 0 Trade liabilities 4) –296 –248 –216 –322 – 634 – 548 – 508 – 506 –2,119 –1,975 – 587 – 529 – 92 – 88 –361 –280 – 572 – 552 – 5,385 – 5,048 1 2 – 5,384 – 5,046 –107 –111 – 5,491 – 5,157 Miscellaneous and other liabilities 4) –297 –293 – 626 – 517 –287 –242 – 619 –311 – 667 – 539 – 674 – 630 –191 –184 – 59 – 52 – 885 – 868 – 4,305 –3,636 2,049 1,500 –2,256 –2,136 –1,662 –1,496 –3,918 –3,632 Income tax liabilities 0 – –1 –1 –77 – 83 –2 – –105 – 63 – – 0 – – – –28 –18 –213 –165 18 15 –195 –150 – – –195 –150 Other provisions –35 – 60 –1,527 –1,349 –305 –137 –174 –198 –390 – 458 –275 –342 –34 – 56 –39 – 59 –2,280 –2,446 – 5,059 – 5,105 – 9 –12 – 5,068 – 5,117 – – – 5,068 – 5,117 Deferred items – 474 –386 –138 –161 –246 –126 – 4 – 6 –12 –13 – 521 – 663 –122 –131 –3 –3 –127 –135 –1,647 –1,624 –1 1 –1,648 –1,623 – – –1,648 –1,623 Deferred liabilities 4) – 95 –131 –200 –172 –194 –189 –209 –167 – 411 –373 –271 –225 –22 –17 –11 –10 –361 –323 –1,774 –1,607 – – –1,774 –1,607 1,774 1,607 – – Held-for-sale liabilities 4) – – – – – – – – – – – – – – – – – – – – – – – – – 5 – – 5 –
Capital employed 5) 2,784 2,029 5,259 5,314 3,220 3,443 2,047 1,969 2,490 2,588 18,172 17,866 2,758 2,766 1,053 1,081 –327 –1,200 37,456 35,856 –799 –763 36,657 35,093 – – 36,657 35,093
Net financial debt 463 –258 2,781 2,885 741 890 1,692 1,356 847 909 9,499 9,386 1,260 1,268 623 630 1,643 1,557 19,549 18,623 – – 19,549 18,623 – – 19,549 18,623
Investments accounted for using the equity method 1 – 4 4 99 124 38 28 11 13 1 1 0 – 0 – 332 330 486 500 – – 486 500 – – 486 500Result from investments accounted for using the equity method 0 – 1 – 7 4 –1 4 1 2 1 – – – 0 – 3 4 12 14 – – 12 14 – – 12 14
Gross capital expenditures 1,081 1,060 539 674 326 374 587 328 273 246 6,901 6,601 883 709 187 177 511 358 11,288 10,527 – 83 – 63 11,205 10,464 – – 11,205 10,464Investment grants received – – –13 – 46 –14 –2 –1 – 4 – – – 6,337 – 5,941 –719 – 606 –122 –124 –3 –1 –7,209 – 6,724 – – –7,209 – 6,724 – – –7,209 – 6,724Net capital expenditures 1,081 1,060 526 628 312 372 586 324 273 246 564 660 164 103 65 53 508 357 4,079 3,803 – 83 – 63 3,996 3,740 – – 3,996 3,740Additions due to changes in the scope of consolidation (acquisition of companies) – – – – 165 66 – 3 – 5 – – – – – – – 1 165 75 – – 165 75 – – 165 75
Employees 6) 16,548 15,993 35,881 35,651 53,056 54,650 28,842 28,257 75,817 71,888 46,969 45,375 5,804 5,463 1,734 1,721 53,877 51,937 318,528 310,935 – – 318,528 310,935 – – 318,528 310,935
1) Relating to special items and reclassification PPA amortization of customer contracts as well as the reconciliation of capital employed to the external display.
2) The non-cash items are included in the segment result shown.3) Key figure from internal reporting, no external figures.4) Content allocation in accordance with management reporting. Previous year adjusted.5) Profit transfer agreements were not assigned to segment assets or liabilities.6) The number of employees comprises the workforce, excluding vocational trainees, and dual degree students
at the end of the reporting period (part-time employees have been converted to full-time employees).
√
FIN
AN
CIA
L S
TA
TE
ME
NT
S
187
CONSOLIDATED FINANCIAL STATEMENTS — NOTES TO THE CONSOLIDATED FINANCIAL STATEMENTS
SU
ST
AIN
AB
ILIT
Y

Information by regions
Jan 1 to Dec 31 (€ million)
External revenues
Non-current assets 1)
Capital employed 1)
Gross capital expenditures
Net capital expenditures
Employees 1)
2018 2017 2018 2017 2018 2017 2018 2017 2018 2017 2018 2017
Germany 24,929 24,093 38,207 36,961 30,903 29,330 10,682 9,906 3,487 3,184 196,334 189,423Europe (excluding Germany) 13,593 13,318 6,044 6,030 5,356 5,340 506 546 492 544 92,336 93,655Asia/Pacific 3,035 2,935 847 793 787 824 79 61 79 61 16,751 15,971North America 1,905 1,801 196 192 371 339 16 9 16 9 9,736 8,921Rest of world 562 557 27 28 43 39 5 5 5 5 3,371 2,965Consolidation – – –782 –749 – 803 –779 – 83 – 63 – 83 – 63 – –
DB Group adjusted 44,024 42,704 44,539 43,255 36,657 35,093 11,205 10,464 3,996 3,740 318,528 310,935
Reconciliation 41 –11 – – – – – – – – – –
DB Group 44,065 42,693 44,539 43,255 36,657 35,093 11,205 10,464 3,996 3,740 318,528 310,935
1) As of the balance sheet date.
Basic principles and methods
Fundamental informationDeutsche Bahn AG (DB AG) and its subsidiaries (together DB Group)
provide services in the fields of passenger transport as well as freight
transport and logistics, and operate an extensive rail infrastructure
which is also available to non-Group users on a non-discriminatory basis.
Whereas rail infrastructure activities are conducted primarily in the com-
pany’s domestic market of Germany, business activities in passenger
transport are conducted on a Europe-wide basis and freight transport
and logistics activities are conducted on a worldwide basis.
DB AG, Potsdamer Platz 2, 10785 Berlin is an Aktiengesellschaft (joint
stock corporation); its shares are held entirely by the Federal Republic of
Germany (Federal Government). The company is maintained under the
number HRB 50000 in the commercial register of the Amtsgericht (local
court) Berlin-Charlottenburg. DB Group has issued securities in accor-
dance with section 2 (1) clause 1 of the Securities Trading Act (Wert-
papierhandelsgesetz; WpHG); these securities are traded on organized
markets in accordance with section 2 (11) WpHG.
These consolidated financial statements have been prepared by the
Management Board, and will be submitted to the Supervisory Board for
the Supervisory Board meeting on March 27, 2019.
Principles of preparing financial statementsThe consolidated financial statements are prepared on the basis of sec-
tion 315e Commercial Code (Handelsgesetzbuch; HGB) and in accor-
dance with the International Financial Reporting Standards (IFRS) as
applied in the EU and their interpretation by the IFRS Interpretations
Committee. The accounting standards have been consistently applied
throughout the entire reporting period with no changes compared with
the previous year.
The financial year of DB AG and its incorporated subsidiaries is the same
as the calendar year. The consolidated financial statements are prepared
in euros. Unless otherwise specified, all figures are stated in million
euros (€ million).
a) Standards, revisions of standards and interpretations which are the subject of mandatory first-time adoption for reporting periods from January 1, 2018 onwards
In the year under review, the consolidated financial statements took
account of all new and revised standards and interpretations which are
the subject of mandatory first-time adoption starting on or after January
1, 2018, which are also relevant for DB Group and which have not been
the subject of early adoption in previous periods. The changes to the
standards have been recognized in accordance with the transitional reg-
ulations. First-time adoption of these new regulations has not had any
material impact on the consolidated financial statements. The relevant
new standards, clarifications and interpretations which are significant
for DB Group are as follows:
◊ IFRS 9: “Financial Instruments” (published July 2014; applicable for
reporting periods from January 1, 2018 onwards)
With the first-time application of IFRS 9, there have been changes
affecting the classification of financial instruments as well as changes
affecting the calculation of impairments of receivables. In addition, all
investments as well as all receivables which are sold on within the frame-
work of factoring agreements will be classified “at fair value” in future.
Within the framework of IFRS 9, the number of categories previously
applicable under IAS 39 has been reduced from four to three. A distinc-
tion is still made as to whether the valuation effects from other income
are reclassified to the statement of income or remain in shareholders’
equity upon maturity or disposal.
Operational risk management and hedge accounting have been
linked more closely for the recognition of hedges.
√
186 Segment information according to segments188 Information by regions188 Basic principles and methods194 Notes to the statement of income202 Notes to the balance sheet
227 Notes to the statement of cash flows228 Notes to the segment information 229 Risk management and
derivative financial instruments233 Other disclosures
Deutsche Bahn Group 2018 Integrated Report
188

◊ IFRS 15: “Revenue from Contracts with Customers” (published May
2014; applicable for reporting periods from January 1, 2018 onwards)
The standard provides for a uniform, principle-based five-stage model
for revenue identification and recognition which is applicable for all con-
tracts with customers. It replaces in particular IAS 18 “Revenue” and IAS
11 “Construction Contracts.” IFRS 15 also contains additional details
regarding the identification of performance obligations, principal-agent
considerations and licenses, as well as regarding the application of tran-
sitional relief. The application of IFRS 15 does not have any major impact
on the consolidated financial statements.
b) Standards, revisions of standards and interpretations which had been adopted as of the reporting date, but which are not yet the subject of mandatory adoption and early adoption
Standard Subject PublishedApplicable starting Effects
IFRS 16 LeasingJanuary 2016 2019
Effects on the consolidated financial statements
IFRS 16 which was adopted in 2016 governs the way in which leases are
recognized. Accordingly, from the point of view of the lessee, a right to
use an asset has to be capitalized for every lease arrangement, and the
corresponding obligation to pay lease installments has to be capitalized
as a liability. In the case of leases for assets of low value and for short-
term leases with a term of 12 months or less, IFRS 16 provides for exemp-
tions, which are utilized by DB Group. The accounting regulations for
lessors on the other hand remain essentially unchanged.
DB Group will apply IFRS 16 for the first time as of January 1, 2019,
using the modified retrospective method, and will not adjust previous
year financial statements. In the case of leases which were active at the
time of first-time adoption and which were classified as operating leases
under IAS 17, lease liabilities are shown and, in the amount of the
remaining lease payments, are discounted with the DB incremental bor-
rowing rate at the time of first-time adoption. The initial carrying amount
of the right-of-use comprises the amount of the lease liability and any
accrued income. On the other hand, deferred income recognized for
leases reduce the carrying amount of the right-of-use.
For the first-time adoption of IFRS 16, DB Group has initiated a group-
wide project in which all leases which are affected by the changeover are
collated, inventorized and evaluated in in-house software. We anticipate
that the capital employed and financial debt will increase by € 4.2 billion
as of January 1, 2019 as a result of the first-time adoption. We do not
anticipate that the first-time adoption of IFRS 16 will have any major
impact on other balance sheet items, including the retained earnings.
There are also shifts in the statement of income as the linearized
other operating expenses of the ongoing recognition of the lease pay-
ments is no longer applicable. On the other hand, write-downs have to
be recognized in relation to the right-of-use and interest expenses from
the compounding of the lease liability. We anticipate that these changes
will result in an improvement of about € 25 million in EBIT for the 2019
financial year.
In the statement of cash flows, the different methods for stating the
former lease expenses and the depreciation charges result in an im -
proved cash flow from operating activities and lower cash flow from
financing activities.
Structure of the balance sheet and the income statementAssets and liabilities are stated in the balance sheet either as current or
non-current items. Assets and liabilities are classified as current if they
are realized or due within 12 months after the end of the year under
review. The structure of the balance sheet takes account of the require-
ments of the ordinance relating to the structure of the financial state-
ments of transport companies. The income statement uses the structure
of the total cost accounting.
Principles underlying the consolidated financial statementsComparability with the previous yearAfter due consideration is given to the following issues, the financial
information presented for the year under review is comparable with the
financial information for the previous year:
Changes in the scope of consolidationThe changes in the scope of consolidation which are not significant have
resulted in financial information in the balance sheet, the income state-
ment, the cash flow statement as well as segment reporting which is not
directly comparable with that of the previous year. Detailed information
relating to these acquisitions as well as explanations concerning the
other transactions are set out in the section “Changes in DB Group.”
Review of useful lives in the segment DB Netze TrackAt the beginning of 2018, DB Group carried out a review of the useful
lives recognized for depreciation purposes in order to determine the
extent to which they reflect actual wear and tear. For some asset classes,
the review has resulted in the recognition of higher useful lives, so that
the depreciation in the DB Netze Track segment has declined from € 839
million in the previous year to € 651 million in the year under review
mainly due to this reason. Subsequent years are also expected to see
lower depreciation compared with the previous year for the existing
assets in these asset classes.
Adjustment of estimate parameters for measuring inventories Inventories are capitalized at cost of purchase or production. At the
balance sheet date, inventories are measured individually at the lower
of cost and net realizable value. In the year under review, some estimate
parameters, in particular those relating to the usability of material which
has to be stocked for longer periods of time, have been adjusted to
reflect the changed conditions. This is the main reason for the decline in
the impairments on inventories from € 372 million to € 316 million. It is
not possible to determine the extent to which the adjustment of the
estimate parameters will have an impact on the subsequent years.
!!!
102-48
GRI
FIN
AN
CIA
L S
TA
TE
ME
NT
S
189
CONSOLIDATED FINANCIAL STATEMENTS — NOTES TO ThE CONSOLIDATED FINANCIAL STATEMENTS
SU
ST
AIN
AB
ILIT
Y
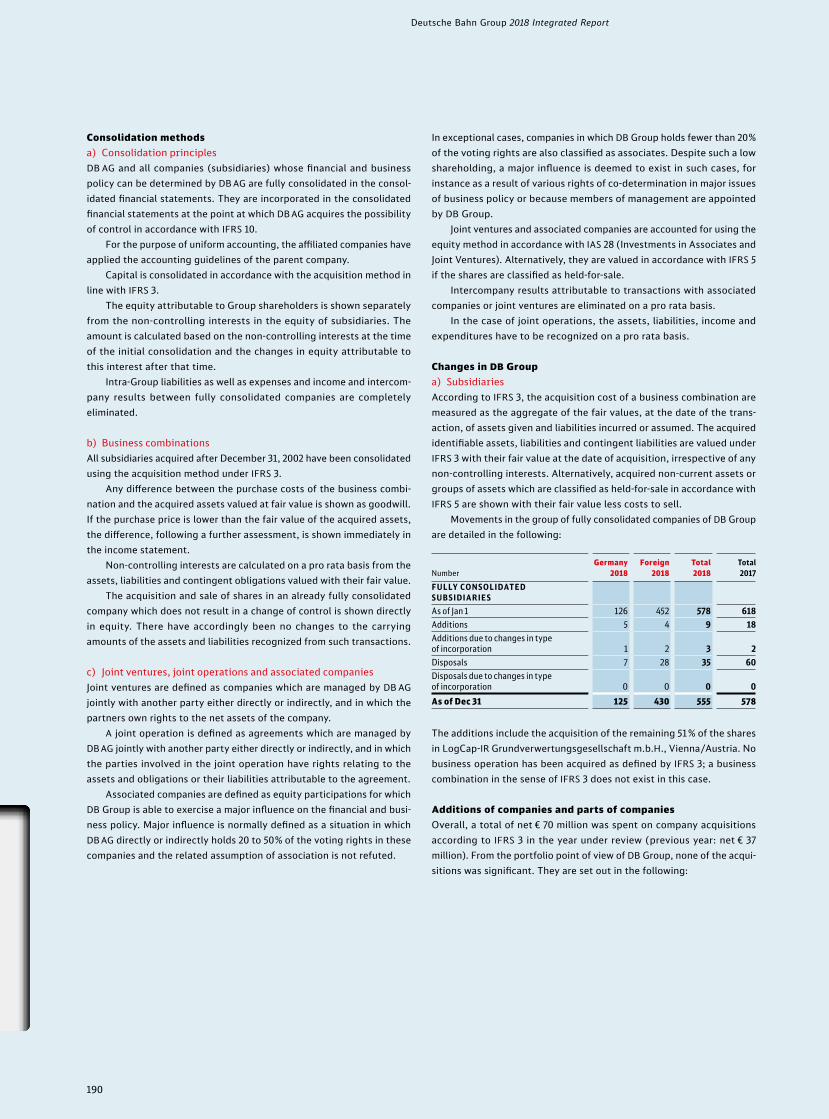
Consolidation methodsa) Consolidation principlesDB AG and all companies (subsidiaries) whose financial and business
policy can be determined by DB AG are fully consolidated in the consol-
idated financial statements. They are incorporated in the consolidated
financial statements at the point at which DB AG acquires the possibility
of control in accordance with IFRS 10.
For the purpose of uniform accounting, the affiliated companies have
applied the accounting guidelines of the parent company.
Capital is consolidated in accordance with the acquisition method in
line with IFRS 3.
The equity attributable to Group shareholders is shown separately
from the non-controlling interests in the equity of subsidiaries. The
amount is calculated based on the non-controlling interests at the time
of the initial consolidation and the changes in equity attributable to
this interest after that time.
Intra-Group liabilities as well as expenses and income and intercom-
pany results between fully consolidated companies are completely
eliminated.
b) Business combinationsAll subsidiaries acquired after December 31, 2002 have been consolidated
using the acquisition method under IFRS 3.
Any difference between the purchase costs of the business combi-
nation and the acquired assets valued at fair value is shown as goodwill.
If the purchase price is lower than the fair value of the acquired assets,
the difference, following a further assessment, is shown immediately in
the income statement.
Non-controlling interests are calculated on a pro rata basis from the
assets, liabilities and contingent obligations valued with their fair value.
The acquisition and sale of shares in an already fully consolidated
company which does not result in a change of control is shown directly
in equity. There have accordingly been no changes to the carrying
amounts of the assets and liabilities recognized from such transactions.
c) Joint ventures, joint operations and associated companiesJoint ventures are defined as companies which are managed by DB AG
jointly with another party either directly or indirectly, and in which the
partners own rights to the net assets of the company.
A joint operation is defined as agreements which are managed by
DB AG jointly with another party either directly or indirectly, and in which
the parties involved in the joint operation have rights relating to the
assets and obligations or their liabilities attributable to the agreement.
Associated companies are defined as equity participations for which
DB Group is able to exercise a major influence on the financial and busi-
ness policy. Major influence is normally defined as a situation in which
DB AG directly or indirectly holds 20 to 50% of the voting rights in these
companies and the related assumption of association is not refuted.
In exceptional cases, companies in which DB Group holds fewer than 20%
of the voting rights are also classified as associates. Despite such a low
shareholding, a major influence is deemed to exist in such cases, for
instance as a result of various rights of co-determination in major issues
of business policy or because members of management are appointed
by DB Group.
Joint ventures and associated companies are accounted for using the
equity method in accordance with IAS 28 (Investments in Associates and
Joint Ventures). Alternatively, they are valued in accordance with IFRS 5
if the shares are classified as held-for-sale.
Intercompany results attributable to transactions with associated
companies or joint ventures are eliminated on a pro rata basis.
In the case of joint operations, the assets, liabilities, income and
expenditures have to be recognized on a pro rata basis.
Changes in DB Groupa) Subsidiaries According to IFRS 3, the acquisition cost of a business combination are
measured as the aggregate of the fair values, at the date of the trans-
action, of assets given and liabilities incurred or assumed. The acquired
identifiable assets, liabilities and contingent liabilities are valued under
IFRS 3 with their fair value at the date of acquisition, irrespective of any
non-controlling interests. Alternatively, acquired non-current assets or
groups of assets which are classified as held-for-sale in accordance with
IFRS 5 are shown with their fair value less costs to sell.
Movements in the group of fully consolidated companies of DB Group
are detailed in the following:
NumberGermany
2018Foreign
2018Total 2018
Total 2017
FULLY CON S OLIDATED SUB SIDIAR IE S
As of Jan 1 126 452 578 618Additions 5 4 9 18Additions due to changes in type of incorporation 1 2 3 2Disposals 7 28 35 60Disposals due to changes in type of incorporation 0 0 0 0
As of Dec 31 125 430 555 578
The additions include the acquisition of the remaining 51% of the shares
in LogCap-IR Grundverwertungsgesellschaft m.b.H., Vienna/Austria. No
business operation has been acquired as defined by IFRS 3; a business
combination in the sense of IFRS 3 does not exist in this case.
Additions of companies and parts of companiesOverall, a total of net € 70 million was spent on company acquisitions
according to IFRS 3 in the year under review (previous year: net € 37
million). From the portfolio point of view of DB Group, none of the acqui-
sitions was significant. They are set out in the following:
!!!
Deutsche Bahn Group 2018 Integrated Report
190

Company Activities Segment
Date of inclu-sion in the consolidated financial statements
Operations in Germany (acquisition of buses, brands and property rights as well as assumption of staff)
Bus services DB Regional Jun 18, 2018
GHT Mobility GmbH (acquisition of 45.486%)
Passenger transport
Subsidi- aries/Other Aug 7, 2018
VT-ARRIVA Személyszállító es Szolgáltató Kft. (VT-Arriva), Székesfehérvár/Hungary (acquisition of 50.09 %)
Bus services DB Arriva Dec 1, 2018
The goodwill resulting from the acquisitions is calculated as follows:
(€ million) 2018
Thereof opera-
tions
Thereof GHT
Mobility GmbH
thereof VT-Arriva
PURCHA SE PR ICE
Payments made 18 2 6 10 Outstanding purchase price payments 52 – – 52
Total compensation 70 2 6 62
Fair value of the amount of equity held before the acquisitions 64 – 3 61
Fair value of net assets acquired 124 1 – 1) 123
Goodwill 1 1 – 1) 0
1) GHT Mobility GmbH was acquired with the intention of selling on the shares within one year. No purchase price allocation has been made for this reason.
The preliminary acquired net assets of the addition VT-Arriva are detailed
in the following: this purchase price allocation has not yet been finalized
as a result of the short period between the closing date and the time at
which the consolidated financial statements were prepared.
(€ million)Carrying
amount Adjustment Fair value
Property, plant and equipment 76 – 76Intangible assets 0 88 88Available-for-sale financial assets 0 0 –Inventories 1 – 1Trade receivables 17 – 17Other receivables and other assets 3 – 3Cash and cash equivalents 17 – 17
Assets 114 88 202
Financial debt 55 – 55Liabilities 12 – 12Deferred tax liabilities 4 8 12
Liabilities 71 8 79
thereof recognized contingent liabilities in accordance with IFRS 3 – – –Non-controlling interests – – –
Net assets acquired 43 80 123Purchase price paid in cash and cash equivalents 10 – 10Cash and cash equivalents acquired 17 – 17
Inflow of cash and cash equivalents due to transactions –7 – –7
The fair value of the trade receivables is € 17 million; this figure does not
include any impairments.
If VT-Arriva had been included in the consolidated financial statements
as of January 1, 2018, DB Group would have reported additional revenues
of € 71 million and an additional net profit of € 9 million.
After being initially consolidated, VT-Arriva has generated revenues
of € 7 million and a net profit of € 1 million.
Disposals of companies and parts of companies
The disposals from the scope of consolidation relate to 13 mergers, 21
liquidations and one sale. The sale has not resulted in an inflow of cash.
As was the case in the previous year, there were no major effects on
results due to the loss of control in the year under review.
The results are shown in the other operating expenses or income.
Effects on the consolidated income statement
The following table shows a summary of the effects on the consolidated
income statement resulting from the changes in the scope of consoli-
dation which have taken place compared with the previous year:
(€ million)
DB Group Jan 1 to
Dec 31, 2018
Thereof due to additions
to scope of consoli-
dation
Amounts due to disposals
from scope of consoli-
dation
Revenues 44,065 45 –1Inventory changes and internally produced and capitalized assets 3,091 0 –Overall performance 47,156 45 –1Other operating income 2,998 3 –1Cost of materials –22,258 –15 0Personnel expenses –17,301 –19 3Depreciation and impairments –2,688 –3 –Other operating expenses – 6,088 –11 1
Operating profit (EBIT) 1,819 0 2
Result from investments accounted for using the equity method 12 0 –Net interest income – 645 –1 0Other financial result –14 0 0
Financial result – 647 –1 0
Profits before taxes on income 1,172 –1 2
Taxes on income – 630 0 0
Net profit for the year 542 –1 2
FIN
AN
CIA
L S
TA
TE
ME
NT
S
191
CONSOLIDATED FINANCIAL STATEMENTS — NOTES TO ThE CONSOLIDATED FINANCIAL STATEMENTS
SU
ST
AIN
AB
ILIT
Y

The revenues attributable to changes in the scope of consolidation are
as follows:
Jan 1 to Dec 31, 2018(€ million)
Revenues due to
Additions to scope of consolidation
Disposals from scope of consolidation
Autotrans d.o.o., Cres/Croatia 1) 25 –Trans-Eurasia Logistics GmbH, Berlin (now named DB Cargo Eurasia GmbH, Berlin) 1) 7 –VT-Arriva 7 –Etihad Rail DB Operations LLC, Abu Dhabi/United Arab Emirates 5 –Innovationszentrum für Mobilität und gesellschaftlichen Wandel (InnoZ) GmbH, Berlin 1) 1 –RIVIERA TRASPORTI LINEA S.P.A., Imperia/Italy – 1
Total 45 1
1) Acquired during the previous year.
b) Joint ventures, associated companies and companies with joint operations
NumberGermany
2018Foreign
2018Total 2018
Total 2017
JOINT VENTUR E S ACCO UNTED FOR USING THE EQ UIT Y METHOD
As of Jan 1 13 17 30 30Additions 0 0 0 2Additions due to changes in type of incorporation 0 0 0 0Disposals 1 0 1 1Disposals due to changes in type of incorporation 0 3 3 1
As of Dec 31 12 14 26 30A S S O CIATED COMPANIE S ACCO UNTED FOR USING THE EQ UIT Y METHOD
As of Jan 1 50 44 94 100Additions 1 0 1 2Additions due to changes in type of incorporation 0 0 0 0Disposals 3 2 5 6Disposals due to changes in type of incorporation 0 0 0 2
As of Dec 31 48 42 90 94
COMPANIE S WITH JOINT OPER ATION S
As of Jan 1 0 0 0 0Additions 0 0 0 0Additions due to changes in type of incorporation 0 1 1 0Disposals 0 0 0 0Disposals due to changes in typeof incorporation 0 0 0 0
As of Dec 31 0 1 1 0
The disposals resulting from the changes in the type of incorporation
affecting the joint ventures accounted for using the equity method in-
clude Etihad Rail DB Operations LLC, Abu Dhabi/United Arab Emirates,
which has been reclassified to the joint operations (Joint Operations,
IFRS 11).
From the perspective of DB Group, no joint venture and associated
company is significant, either individually or when viewed together.
Currency translationCurrency translation uses the concept of functional currency according
to IAS 21 (The Effects of Changes in Foreign Exchange Rates) or IAS 29
(Financial Reporting in Hyperinflationary Economies) for annual finan-
cial statements of subsidiaries which are based in a hyperinflationary
country.
No major subsidiary was domiciled in a hyperinflationary economy
in the reporting and comparison period.
The consolidated financial statements are prepared in euros (re -
porting currency); in accordance with IAS 21, the financial statements of
subsidiaries whose functional currency is not the euro are converted into
the reporting currency.
The following exchange rates are some of the rates used for currency
translation purposes:
€ 1 equivalent to)
As of Dec 31 Annual average
2018 2017 2018 2017
Australian Dollar (AUD) 1.62200 1.53460 1.57968 1.47317Canadian Dollar (CAD) 1.56050 1.50390 1.52936 1.46472Swiss Franc (CHF) 1.12690 1.17020 1.15496 1.11167Renminbi Yuan (CNY) 7.87510 7.80440 7.80808 7.62900Danish Krone (DKK) 7.46730 7.44490 7.45317 7.43863Pound Sterling (GBP) 0.89453 0.88723 0.88471 0.87667Hong Kong Dollar (HKD) 8.96750 9.37200 9.25594 8.80451Japanese Yen (JPY) 125.85000 135.01000 130.39588 126.71118Norwegian Krone (NOK) 9.94830 9.84030 9.59749 9.32704Polish Zloty (PLN) 4.30140 4.17700 4.26149 4.25701Swedish Krona (SEK) 10.25480 9.84380 10.25826 9.63509Singapore Dollar (SGD) 1.55910 1.60240 1.59261 1.55882US Dollar (USD) 1.14500 1.19930 1.18095 1.12968
Capital management in DB Group (in accordance with IAS 1 “Presentation of Financial Statements”)The purpose of financial management of DB Group is not only to achieve
sustainable growth in the enterprise value and but also to comply with
a capital structure which is adequate for maintaining a very good rating.
Based on adjusted EBIT, return on capital employed (ROCE) is calcu-
lated as a key component of the value management concept. The capital
employed represents the use of capital provided by shareholders and
providers of debt which is tied up in DB Group and which is associated
with yield expectations. The parameter is derived on the basis of the
closing balance sheet for the year under review. The following table
shows the process of calculating capital employed, using the asset and
liability items shown in the balance sheet.
Deutsche Bahn Group 2018 Integrated Report
192

As of Dec 31 (€ million) 2018 2017
Change
absolute %
Property, plant and equipment 40,757 39,608 +1,149 +2.9 Intangible assets/goodwill 3,730 3,599 +131 + 3.6 Inventories 1,369 1,151 +218 +18.9 Trade receivables 4,962 4,571 + 391 + 8.6 Receivables and other assets 2,250 1,922 + 328 +17.1 Receivables from financing –174 –131 – 43 + 32.8 Income tax receivables 62 52 +10 +19.2 Held-for-sale assets 26 0 +26 – Trade liabilities – 5,491 – 5,157 –334 + 6.5 Miscellaneous and other liabilities –3,918 –3,632 –286 +7.9 Income tax liabilities –195 –150 – 45 + 30.0 Other provisions – 5,068 – 5,117 + 49 –1.0 Deferred items –1,648 –1,623 –25 +1.5 Held-for-sale liabilities – 5 – – 5 –
Capital employed 36,657 35,093 + 1,564 + 4.5
For further calculation, the adjusted EBIT and EBITDA in the following
table is derived from the operating result (EBIT) shown in the income
statement. The corresponding details at the segment level have been
cal culated using the same method.
(€ million) 2018 2017
Change
absolute %
Operating profit (EBIT) 1,819 1,688 +131 +7.8Income from the disposal of financial instruments – 56 –20 –36 –Expenses from the disposal of financial instruments 19 1 +18 –Restructuring/contract obligations (personnel) 120 224 –104 – 46.4Potential losses (DB Arriva) 204 – +204 –Provisions in superstructure (DB Netz AG) –24 125 –149 –Provision for civil proceedings infrastructure fees – 50 15 – 65 –Other 20 46 –26 – 56.5
Operating profit (EBIT) adjusted for special items 2,052 2,079 –27 –1.3
PPA amortization customer contracts (depreciation) 59 73 –14 –19.2
EBIT adjusted 2,111 2,152 – 41 –1.9
Depreciation 2,688 2,847 –159 – 5.6PPA amortization customer contracts (depreciation) – 59 –73 +14 +19.2Impairments and recoveries in value –1 4 – 5 –
EBITDA adjusted 4,739 4,930 –191 –3.9
Special items totaling € 233 million were adjusted in EBIT in the year
under review. These are mainly attributable to the creation of a provision
for potential losses at DB Arriva as well as provisions for restructuring
and for obligation surpluses relating to employment agreements (seg-
ment Subsidiaries/Other). The addition for restructuring relates mainly
to the segments DB Arriva and DB Cargo. On the other hand, provisions
for civil proceedings in connection with infrastructure fees were reversed
because the risk assessment has declined as a result of a ruling of the
ECJ. In addition, the amortization of customer and franchise agreements
has been reclassified from EBIT; these will be written down over the
remaining term of the respective contracts as a result of being capital-
ized as intangible assets as part of the process of purchase price alloca-
tions (PPA) (€ 59 million). This amount is mainly attributable to DB Arriva.
The capital employed and the adjusted EBIT have resulted in the
following figures for ROCE:
(€ million) 2018 2017
Change
absolute %
EBIT adjusted 2,111 2,152 – 41 –1.9 Capital employed as of Dec 31 36,657 35,093 +1,564 + 4.5
ROCE (%) 5.8 6.1 – –
Gearing is no longer used for managing the capital structure in DB Group.
Critical assessments and appraisals The consolidated financial statements are based on assessments and
assumptions relating to the future. Based on past experience and reason-
able expectations of future events, the estimates and assessments which
are derived are continuously reviewed and adjusted where appropriate.
Nevertheless, the assessments will not always correspond to subsequent
actual circumstances.
The assessments and assumptions which may involve a significant
risk during the next year under review in the form of major adjustments
to the carrying amounts of assets and liabilities are discussed under the
relevant items.
FIN
AN
CIA
L S
TA
TE
ME
NT
S
193
CONSOLIDATED FINANCIAL STATEMENTS — NOTES TO ThE CONSOLIDATED FINANCIAL STATEMENTS
SU
ST
AIN
AB
ILIT
Y

Notes to the statement of income
Revenues generated in DB Group relate to the provision of passenger
transport, freight transport and logistics services, the provision of rail
infrastructure, the sale of goods and other services related particularly
to rail operations, less value-added tax, discounts and any price reduc-
tions. They are recognized with their fair value.
Services provided by DB Group are normally completed within a few
hours/days. Accordingly, with the exception of season tickets, revenues
in regional and long-distance services are recognized at the time at
which the tickets are sold. Exceptions in this respect are the segments
DB Regional and DB Arriva, where order processing in the form of long-
term transport contracts concluded with the ordering organizations of
the Federal states in Germany and the franchisors in other European
countries are very important for the development of business. Contrac-
tual relations with clients covering several years also exist in the contract
logistics line of business in the DB Schenker segment, which accounts
for about 6% of Group revenues.
Revenue recognition in accordance with IFRS 15 is based on the
principle that revenues are recognized when control over a product
or service is transferred to the customers. Revenues generated by the
rendering of services are recognized with the amount which is expected
as the consideration as soon as control over the services has been
transferred.
All expense and income items are normally recognized without being
netted, unless the accounting principles under IFRS permit or require
netting.
Expenses are recognized in the income statement at the point at which
the service is used or at the point at which the expenses are in curred.
The special items detailed at income and expenses (“Total”) are
issues which are considered to be unusual either in terms of the amount
involved and/or the actual reason behind the issue. Irrespective of the
amount involved, this item is used for disclosing book profits and losses
arising from transactions with investments/financial investments as well
as depreciation on long-term customer contracts, which have been cap-
italized as part of the purchase price allocation process in connection
with company acquisitions. In addition, the special items recognize indi-
vidual issues if they are of an exceptional nature, if they are definable for
accounting purposes, if they can be measured and if the amount involved
is material. In addition to the special items, effects from changes in the
scope of consolidation and effects from changes in exchange rates are
also disclosed separately. The item “Total – comparable” does not
involve IFRS figures; instead, it involves additional disclosures in accor-
dance with internal reporting.
(1) Revenues
(€ million) 2018 2017
Revenues from freight and passenger transport services 39,490 38,293 thereof concession fees for rail transport 6,472 4,761Revenues from operating infrastructure 1,760 1,704Revenues from letting and leasing 437 432Revenues from sales of products 1,393 1,339Other revenues 1,057 1,004Revenue reductions –72 –79
Total 44,065 42,693 Special items – 41 11 Effects from changes in scope of consolidation – 45 –1 Effects from changes in exchange rates 507 –
Total – comparable 44,486 42,703
The revenues from freight and passenger transport services were gen-
erated mainly by companies operating in the segments DB Schenker,
DB Regional, DB Arriva and DB Long-Distance. Revenues from operating
infrastructure relate to the segments DB Netze Track and DB Netze Sta-
tions. Revenues generated by product sales were recorded mainly in the
segment DB Netze Energy, and rental and leasing revenues were mainly
generated in the segment DB Netze Stations. Other revenues relate to
virtually all segments.
Compared with the previous year, there has been a change to the
disclosure of the “thereof” item “concession fees for rail transport” from
gross contracts at DB Regional. In the previous year, the concession fees
disclosed as part of gross contracts were reduced by allowable fare rev-
enues. In the year under review, fees of DB Regional from gross contracts
are disclosed entirely as concession fees. If the same disclosure method
had been used, the previous year figure would have been € 921 million
higher. This has not changed the revenues from freight and passenger
transport services.
In the year under review, revenues increased by € 1,372 million
(+3.2%) to € 44,065 million. This revenue growth compared with the
previous year is mainly attributable to DB Long-Distance, DB Regional
and DB Schenker. DB Schenker reflects the impact of higher transport
volumes as well as higher air freight rates on the procurement side.
These cost increases can be passed on to customers to a certain extent.
The higher revenues of DB Long-Distance are attributable to consider-
ably higher volume sold as well as a higher specific revenue rate. As a
result of higher concession fees (adjusted by the change in disclosure),
DB Regional is up on the previous year, due to various factors, including
the dynamization of concession fees. DB Arriva has also outperformed
the previous year in terms of revenues, mainly as a result of higher con-
cession fees at Arriva Rail North.
Revenues include negative exchange rate effects of € 507 million,
mainly affecting DB Schenker. These negative exchange rate effects are
mainly attributable to the weaker development (compared with the pre-
vious year) of the Swedish krona and the US dollar.
Even when adjusted for special items, effects from changes in the
scope of consolidation and exchange rates, the revenues are higher than
the previous year figure (€ +1,783 million, +4.2%).
Movements in revenues broken down according to business seg-
ments and regions are set out in segment reporting.
Deutsche Bahn Group 2018 Integrated Report
194

1) The contractual assets also show claims relating to work-in-progress from long-term production.
Revenue reductions of long-term transport contracts (contractual pen-
alties) are netted directly with the revenues of freight and passenger
services. The separately disclosed revenue reductions (€ –72 million)
also relate mainly to revenues of freight and passenger services (for
instance passenger rights).
The order book of customer contracts with contractually agreed
outstanding revenues (secured revenues) is broken down as follows:
Secured order book (nominal values) as of Dec 31 (€ million) 2018
Transport contracts 62,222Logistics contracts 1) 208Other contracts 1) 114
Total 62,544
1) Contracts with a duration of at least 12 months and a total volume of at least € 5 million.
Most of the secured order book will be fulfilled within a period of ten
years, with percentages declining over a period of time (order book in
passenger transport µ114).
The exemption regulation of IFRS 15.121 (a) has been used for the
logistics contracts and the other contracts.
Variable considerations of transport contracts as well as price escala-
tion clauses or contractual penalty are only taken into consideration for
estimating the assured revenues if they are highly likely.
Claims relating to contractual assets 1) of € 29 million are recognized
together with the other receivables and assets and have developed as
follows:
Contractual assets (€ million) 2018
As of Jan 1 96Additions 113Impairments –1Changes due to changed terms of payment –Fulfillment/payment –118Other changes – 61
As of Dec 31 29
A figure of € 12 million is attributable to long-term contractual assets.
The contractual liabilities in DB Group include advance payments
received as well as other payments received in advance in relation to
revenues for subsequent periods (for example for season tickets). Obli-
gations from contractual liabilities of € 1,266 million (thereof non-current
€ 40 million) are shown under the trade payables and deferred items and
have developed as follows:
Contractual liabilities (€ million) 2018
As of Jan 1 1,158Additions 3,157Fulfillment of liabilities –3,177Other changes 128
As of Dec 31 1,266
Most of the fulfillment as of the balance sheet date relates to contractual
liabilities which accrued in the year under review.
(2) Inventory changes and internally produced and capitalized assets
(€ million) 2018 2017
Inventory changes 15 –36Other internally produced and capitalized assets 3,076 2,936
Total 3,091 2,900 Special items – – Effects from changes in scope of consolidation 0 – Effects from changes in exchange rates 0 –
Total – comparable 3,091 2,900
Own investments relate mainly to construction and project business in
rail infrastructure and also the modernization of rolling stock as well as
the processing of appropriate spare parts. The increase compared with
the previous year is attributable to a higher construction volume in rail
infrastructure.
(3) Other operating income
(€ million) 2018 2017
SERVICE S FOR THIR D PARTIE S AND SALE OF MATER IAL S
Income from maintenance and repair 5 20Sale of materials and energy 123 112Other services for third parties 505 530
633 662
Leasing and rental income 181 182Income from claims for damages and cost refunds 271 268IN COME FROM FEDER AL GR ANT S
Federal compensation payments 114 92Other investment grants 0 1Income from release of deferred items 144 144Other Federal grants 278 161
536 398
Income from the disposal of property, plant and equipment and intangible assets 278 257Income from the disposal of non-current financial instruments 56 20Income from reversal of provisions 341 336OTHER IN COME
Income from third-party fees 38 51Income from remediation of ecological burdens 51 47Utilization of provisions for potential losses 71 55Miscellaneous other income 542 678
702 831
Total 2,998 2,954 Special items –136 –152 Effects from changes in scope of consolidation –3 –1 Effects from changes in exchange rates 7 –
Total – comparable 2,866 2,801
Adjusted by special items, effects from changes in scope of consolidation
and in exchange rates, other operating income is slightly higher than
the previous year (€ +65 million). The increase in income from Federal
grants is mainly attributable to the promotion of rail freight transport
via Federal grants for train-path usage fees as well as higher compen-
sation payments for level crossings. The decline in the miscellaneous
other income is mainly attributable to the refund of the nuclear fuel tax
in the previous year (€ –104 million).
FIN
AN
CIA
L S
TA
TE
ME
NT
S
195
CONSOLIDATED FINANCIAL STATEMENTS — NOTES TO ThE CONSOLIDATED FINANCIAL STATEMENTS
SU
ST
AIN
AB
ILIT
Y

(4) Cost of materials
(€ million) 2018 2017
E XPEN SE S FOR R AW MATER IAL S AND SUPPLIE S AND OF PURCHA SED GO OD S
Energy expenses Electricity 1,872 1,771 Electricity tax 158 156 Diesel, other fuel 1,078 1,052 Other energies 233 205
Energy price derivatives 18 51
3,359 3,235
Other supplies and purchased goods 571 552Price and value adjustments for materials –176 – 91
3,754 3,696
E XPEN SE S FOR PURCHA SED SERVICE S
Purchased transport services 12,058 11,660Cleaning, security, disposal, winter service 397 359Commissions 171 161Expenses for utilization of infrastructure Train-path usage 351 359 Station usage 1) 57 63 Use of local installations 14 13
422 435
Other purchased services 1,047 953
14,095 13,568
Expenses for maintenance and production 4,409 4,193
Total 22,258 21,457 Special items – 4 –16 Effects from changes in scope of consolidation –15 0 Effects from changes in exchange rates 317 –
Total – comparable 22,556 21,441
1) Previous year’s figure adjusted.
Compared with the previous year, the cost of materials has risen by € 801
million (+3.7%).
The increases in value recognized in cost of materials amount to
€ 64 million (previous year: value adjustments of € 24 million). The
decline of € 88 million in the recognized value adjustments is due mainly
to the change in estimate parameters.
The expenses for electricity have increased compared with the pre-
vious year as a result of higher energy prices.
The expenses for purchased services have increased considerably
compared with the previous year (+3.9%). This increase is attributable
to higher expenses for purchased transport services at DB Schenker
resulting from higher transport volumes as well as higher freight rates.
The expenses for maintenance and carrying out construction mea-
sures and processing spare parts increased by 5.2% in the year under
review.
(5) Personnel expenses and employees
(€ million) 2018 2017
WAGE S AND SAL AR IE S
Employees 13,024 12,324 Civil servants assigned 1,012 1,058
14,036 13,382
S O CIAL SECUR IT Y E XPEN SE S
Employees 2,402 2,268 Civil servants assigned 229 238Expenses for adjusting staffing levels 151 282Retirement benefit expenses 483 495
3,265 3,283
Total 17,301 16,665 Special items –152 –302 Effects from changes in scope of consolidation –19 –3 Effects from changes in exchange rates 104 –
Total – comparable 17,234 16,360
The figure stated for personnel expenses (social security contributions)
includes expenses of € 1,182 million for defined contribution plans (pre-
vious year: € 1,121 million).
The amount shown for adjusting staffing levels mainly comprises
expenses for restructuring costs, obligation surpluses relating to employ-
ment agreements as well as costs of severance payment and semi-retire-
ment agreements.
The retirement benefit expenses relate to active persons as well as
persons who are no longer employed in DB Group or their surviving
dependants. They are attributable primarily to service costs, employers’
contributions to the company top-up benefit scheme as well as the con-
tributions to Pensions-Sicherungs-Verein aG (pension backing associa-
tion). The interest expense resulting from compounding the pension
obligations and the expected income from plan assets is shown in finan-
cial result. For detailed explanations regarding the development of pen-
sion obligations, please refer to Note (32) µ220 ff.
The activities of civil servants in DB Group are based on statutory
allocation within the framework of the Rail Restructuring Act (Eisen-
bahnneuordnungsgesetz; ENeuOG), Art. 2 §12. For the work of the as-
signed civil servants, DB AG reimburses to the Federal Railway Fund
(Bundeseisenbahnvermögen; BEV) those costs which would be incurred
if an employee covered by collective bargaining arrangements were to
be employed instead of the assigned civil servant (pro forma calculation).
The increase in wages and salaries in Germany is mainly attributable
to the elective model applicable since January 1, 2018 (linear increase of
2.6% in remuneration rates, six days more vacation or reduction of one
hour in weekly working time) from the collective bargaining arrange-
ment 2016/2017. The decision of the employees for 2.6% resulted in
increased remuneration rates. The decision for six days more vacation
or a reduction of one hour in weekly working time resulted in an in -
creased personnel requirement and consequently in an increase in per-
sonnel. The one-off payment of € 1,000 per employee for the period
October 2018 to June 2019 agreed in the collective bargaining agree-
ment 2018/2019 also had an impact. It has been recognized for 2018
on a pro rata basis in personnel expenses.
In addition, the increase in the number of employees has also re-
sulted in a considerable rise in personnel expenses.
Deutsche Bahn Group 2018 Integrated Report
196

The development in the number of employees in DB Group, converted
to full-time employees (FTE) in each case, is shown in the following:
(FTE)
As of Dec 31 Annual average
2018 2017 2018 2017
Employees 298,343 288,565 294,337 284,459Civil servants 20,185 22,370 22,564 24,212
Employees 318,528 310,935 316,901 308,671
Trainees and dual degree students 11,053 10,983 9,695 9,857
Total 329,581 321,918 326,596 318,528
In the event of changes in the scope of consolidation, the employees are
included on a pro rata basis up to the time of deconsolidation or after
the date of initial consolidation.
At the end of the year, the number of persons employed in DB Group
was higher than at the end of the previous year. At the level of the seg-
ments, the increase in the number of employees is evident particularly
at DB Schenker as a result of the continuing growth in the field of con-
tract logistics and at DB Netze Track in the fields of maintenance and
construction projects. There has also been an increase in the number of
employees at DB Long-Distance and DB Cargo.
The development in the number of employees, based on the number
of natural persons (NP), is shown in the following:
(NP)
As of Dec 31
2018 2017
Employees 310,443 300,391Civil servants 21,125 22,990
Employees 331,568 323,381Trainees and dual degree students 11,053 10,983
Total 342,621 334,364
(6) Depreciation and impairmentsFor property, plant and equipment, depreciation is taken to the income
statement on a straight-line basis over the expected service life of the
asset. The following useful-service lives for the main groups of property,
plant and equipment are taken as a basis:
Years
Permanent way structures, tunnels, bridges, railway crossings 15 –100Track infrastructure 13 –30Buildings, halls, roofs 10 –75Other structures 8 – 60Signaling equipment 10 – 40Telecommunications equipment 5 –20Traction current installations 10 – 40Rolling stock 10 –30Other technical equipment, machinery and vehicles 5 – 40Fixtures and fittings 3 –15
The appropriateness of the chosen depreciation method and the ser-
vice lives is subject to an annual review. Our expectations regarding the
residual value are also updated annually.
Intangible assets are depreciated using the straight-line method. The
following useful lives are used as the basis for depreciation:
Years
Franchises, rights, etc. Duration of contractTrademarks Economic lifeBrand names Economic lifeCustomer base Economic lifePurchased software 3 –10Software produced in-house 3 –15
Goodwill arises as a positive difference between the costs of purchasing
the shares and the fair values of the individually acquired assets, ab -
sorbed liabilities and contingent liabilities. It is not depreciated; instead,
it is subject to an annual impairment test. Impairment losses in relation
to goodwill are not reversed.
The adequacy of the depreciation method and the service life are
subject to an annual review.
Impairments of assetsIAS 36 governs the impairment test for property, plant and equipment
and intangible assets with a certain economic life, which is carried out
using a so-called indicator-based asset impairment test. Such an asset
impairment test has to be carried out when indicators (so-called trig-
gering events) indicate a possible loss of value. In addition, according to
IAS 36, goodwill as well as intangible assets with an indefinite service life
have to be subjected at least once a year to an impairment test.
Definition of cash-generating unitsGoodwill impairment tests have to be carried out at the level of individual
assets as part of the asset impairment test. If it is not possible to deter-
mine future cash flows, which are to a large extent independent, for an
individual asset, so-called cash-generating units (CGUs) have to be
formed as an aggregation of assets whose future cash flows depend on
each other. Since the beginning of the 2016 financial year, the CGU
structure is fully in line with the planning and reporting structure of
DB Group. In the 2018 financial year, no adjustments were made to the
CGU structure.
Due to the congruence between management structure and legal
structure, the identified CGUs also always consist of at least one legal
unit. This means that the data necessary for the asset impairment test
can be derived from annual financial statements and planning data.
The impairment test for goodwill is carried out at the level of the CGU
or group of CGUs to which the goodwill has been allocated. This has been
equivalent to the operating segments since January 1, 2016. Significant
goodwill currently exists in the CGUs DB Arriva and DB Schenker. With
regard to the recognition of goodwill for each CGU, please also refer to
the segment information according to business segments.
FIN
AN
CIA
L S
TA
TE
ME
NT
S
197
CONSOLIDATED FINANCIAL STATEMENTS — NOTES TO ThE CONSOLIDATED FINANCIAL STATEMENTS
SU
ST
AIN
AB
ILIT
Y

MethodIn the impairment test in accordance with IAS 36, the carrying amount of
an asset or a CGU has to be compared with the corresponding recoverable
amount. If the positive carrying amount is no longer covered by the recov-
erable amount, this results in a corresponding impairment requirement.
The carrying amount of a CGU is established by adding the carrying
amounts of the assets less the liabilities which are related to the relevant
assets (net position). In addition, for determining the carrying amount
of a CGU, it is also necessary to recognize corporate assets and corporate
liabilities jointly used by several CGUs, and the working capital necessary
for the corresponding CGU must also be taken into consideration.
The recoverable amount is defined as the higher of the fair value less
costs of disposal and the value in use. In the impairment tests carried
out in DB Group, the recoverable amount is represented by the value in
use. The value in use is established as the present value of the free cash
flows before interest and after tax attributable to the continuation of a
CGU. A global tax rate of 30.5% has again been used in relation to EBIT
(unchanged compared with the previous year). The forecast of cash flows
reflects previous experience, and takes account of management expec-
tations with regard to future market developments. These cash flow fore-
casts are based on the mid-term planning adopted by the Group Man-
agement Board of DB AG and which covers a planning horizon of five
years. If cash flow forecasts are necessary beyond the five-year planning
horizon, a sustainable free cash flow is derived from the forecast and is
extrapolated on the basis of a growth rate related to the specific market
development. As was the case in the previous year, an average growth
rate of 1% per annum has been assumed. For the CGU DB Arriva, a
growth rate of 1% has also been used since the 2018 financial year (pre-
vious year: 2%); a uniform assumption for growth has thus been made
for all CGUs in DB Group.
A weighted average cost of capital is used for discounting the free
cash flows; this reflects the expectation of return on the capital market
for providing debt capital and shareholders’ equity to DB Group. Because
free cash flow after taxes has been calculated, a cost-of-capital rate after
tax has also been used. Risks of free cash flows are recognized by a
risk-equivalent capitalization rate.
Compared with the previous year, the cost of capital of DB Group has
declined from 4.8% to 4.7%. Taking account of the typical tax rate of
30.5% in relation to EBIT, this is equivalent to a corresponding capital-
ization rate before tax of 6.8% (previous year: 7.0%).
A specific cost of capital rate is determined for passenger transport,
freight transport and logistics as well as infrastructure.
The WACCs of the CGUs of the various segments which are applicable
for the 2017 and 2018 annual financial statements are detailed in the
following table:
(%)
2018 2017
Before taxes
After taxes
Before taxes
After taxes
DB Group 6.8 4.7 7.0 4.8 Passenger transport 6.9 4.8 7.3 5.1 Freight transport and logistics 8.5 5.9 8.6 6.0 Infrastructure 5.8 4.0 6.0 4.2
The changes in the WACCs compared with the previous year are attribut-
able to current expectations of medium- to long-term developments of
the capital market.
Asset impairment testProcesses which comply with the specific requirements of IAS 36 have
been implemented in order to carry out the asset impairment test. The
service lives of the individual CGUs used for the asset impairment test are
based on the service life of the asset or a group of homogenous assets
which is (are) most significant for the particular CGU.
In addition, the process of establishing the service life disregards
assets or future cash flows which result from major structural changes,
disinvestment measures or extension investments. Resultant adjustments
to the original plans relate mainly to the major new and expansion infra-
structure projects, where it is assumed that the construction process will
be completed beyond the mid-term (beyond 2023) and for which most of
the planned own funds have not yet been invested. Accordingly, the
project Stuttgart 21 also did not have to be taken into consideration for
calculating the value in use (in accordance with IAS 36.44) because a
major part of the capital expenditures had not been realized as of the
balance sheet date and because the project is to be completed beyond
the mid-term period. The cash flow forecasts take account of internal
transfer prices on the basis of arm’s length assessments of the companies
involved. The published infrastructure prices are applicable for goods
and services exchanged between transport and infrastructure segments;
price increases in the period covered by the forecast have also been
taken into consideration.
After the medium-term planning has been completed, a regular
check is carried out to determine whether impairments are necessary at
the CGU level. In addition to this annual cycle, a test is also performed if
current issues arising from the development in business or changes in
assumptions indicate that there has been a major deterioration in the
value in use.
The impairment tests carried out in the period under review identi-
fied surplus cover for all CGUs.
Deutsche Bahn Group 2018 Integrated Report
198

Independently of the impairment tests carried out in relation to the CGUs,
impairments are recognized in relation to individual assets which are no
longer capable of being used fully. These impairments are shown under
the disclosures for the respective balance sheet item.
Goodwill impairment testA goodwill impairment test must be carried out annually for all CGUs to
which goodwill can be allocated. Because the goodwill which arises in
DB Group as a result of acquisitions is always clearly allocated to a CGU,
this goodwill impairment test is an integral part of the asset impairment
test which is always carried out annually for all CGUs.
The goodwill impairment tests carried out for the segments which
are carrying goodwill did not identify any impairment requirement for
the CGUs.
The respective recoverable amount is represented by the value in use
of the CGU, which in turn has been derived from the mid-term planning
of the relevant segments. The details relating to methods presented
above are thus applicable correspondingly. At DB Arriva and DB Schenker
it also has to be borne in mind that separate assumptions relating to the
development of the economy, market and competition as well as currency
relations have been made for the relevant international markets. These
assumptions have been based on the external and internal expert assess-
ments available at the time of the planning.
Critical assessments and appraisalsImpairment of cash-generating units (CGUs)
Within the framework of the impairment tests, the main assumptions
which have an impact on the value of a CGU are reviewed in the form of
standard sensitivity analyses.
DB Cargo is still facing major challenges from the market and the
competition. Sustainable stabilization of the profit situation continues
to be expected starting in the 2019 financial year.
Also infrastructure CGUs are still exposed to risks relating to the
extent of long-term investment grants for replacement capital expendi-
tures in the existing network and the related extent of own funds at the
infrastructure companies. The investment grants included in mid-term
planning are based on the Performance and Financing Agreement (Leis-
tungs- und Finanzierungsvereinbarung; LuFV) II which has since been
signed by the Federal Ministry of Transport and Digital Infrastructure
(Bundesministerium für Verkehr und digitale Infrastruktur; BMVI) and
DB Group.
EBIT margin
The risk of an EBIT margin reduced by 10% has been considered for
analyzing a scenario in which results fail to perform in line with budget.
This model calculation has identified an impairment requirement at
DB Cargo of € 303 million; this means that the value-in-use for this CGU
no longer provides adequate cover for the carrying amount of the capital
employed. In scenarios in which the EBIT margin is reduced, the CGU
DB Cargo is robust up to a reduction of 5.8%. All other CGUs report stable
surplus coverage even if the EBIT margin is reduced by 10%.
Average real growth rate of cash flows
A reduction of 10% in the long-term growth rate has been simulated in
order to assess the sensitivity of the impairment test result in relation to
the assumed long-term growth of cash flow (1%). As was the case in the
previous year, no impairment requirement has been identified for any of
the CGUs considered in this scenario.
Weighted average cost of capital
Risks relating to the assumptions of the capitalization rate, which is
normally used for calculating the present value of value in use, have
been analyzed by simulating the value of each CGU in conjunction with
a capital cost mark-up of 10%. The currently used weighted costs of
capital (after tax) have been used as the basis of this simulation:
DB Group 4.7%, passenger transport 4.8%, freight transport and logistics
5.9%, infrastructure 4.0%. In this scenario, there is no impairment
requirement for any CGU. The CGU DB Cargo shows slight surplus cover
in this scenario.
Useful life and residual value
With regard to the assumptions relating to useful life and residual value,
the effect of a 10% reduction in the residual value at the end of useful
life (= terminal value) was analyzed. All CGUs also showed surplus cover
in this scenario.
Depreciation is broken down as follows:
(€ million) 2018 2017
Scheduled depreciation 2,714 2,880Recognized impairments 25 165Recognized recoveries in value – 51 –198
Total 2,688 2,847 Special items – 60 – 69 Effects from changes in scope of consolidation –3 – Effects from changes in exchange rates 6 –
Total – comparable 2,631 2,778
In the year under review, depreciation was lower than in the previous
year, and relates mainly to the property, plant and equipment used as
rail infrastructure as well as the rolling stock. It is shown in the income
statement less any recovery in value recognized in the reporting period.
The decline in depreciation is attributable to the recognition of higher
useful lives for individual asset classes (Comparability with the previous
year µ189).
For further explanations, please refer to the details concerning the
development in property, plant and equipment or intangible assets under
Notes (13) µ202 ff. and (14) µ204 f.
FIN
AN
CIA
L S
TA
TE
ME
NT
S
199
CONSOLIDATED FINANCIAL STATEMENTS — NOTES TO ThE CONSOLIDATED FINANCIAL STATEMENTS
SU
ST
AIN
AB
ILIT
Y

(7) Other operating expenses
(€ million) 2018 2017
E XPEN SE S FROM LE A SING , R ENT S AND LE A SE S
Operating lease expenses 1,801 1,768Conditional leasing expenses 1 2
1,802 1,770
Legal, consultancy and audit fees 355 345Fees and contributions 248 249Insurance expenses 172 179Advertising and sales promotion expenses 178 188Printing and stationery expenses 69 73Travel and representation expenses 323 311Research and non-capitalized development costs 29 23OTHER PURCHA SED SERVICE S
Purchased IT services 487 435Other communication services 47 55Other services 794 745
1,328 1,235
Expenses from claims for damages 175 164Impairments recognized in relation to receivables and other assets 1) 27 36Losses from the disposal of property, plant and equipment and intangible assets 116 136Expenses from disposal of non-current financial instruments 19 1Other operating taxes 67 66OTHER E XPEN SE S
Grants for third-party facilities 94 81Concession fees for passenger transport 124 111Other personnel-related expenses 230 213Miscellaneous other expenses 732 709
1,180 1,114
Total 6,088 5,890 Special items –253 –218 Effects from changes in scope of consolidation –11 –1 Effects from changes in exchange rates 71 –
Total – comparable 5,895 5,671
1) Including payments for receivables written down in the previous year.
The other operating expenses have increased by € 198 million (+3.4%)
compared with the previous year.
This increase is mainly attributable to other purchased services. The
purchased IT services have increased in virtually all segments. The in -
crease in other services is attributable to the expansion of business in
contract logistics in the segment DB Schenker.
The increase in other expenses is mainly attributable to the seg-
ment DB Arriva. The miscellaneous other expenses include the addition
to the provision for potential losses at DB Arriva. On the other hand, the
miscellaneous other expenses declined in the segment Subsidiaries/
Other due to the fact that the addition to the provision for ecological
burdens included in the previous year is now longer applicable.
The legal, consultancy and audit fees comprise fees of € 29.4 million for
the auditor of the consolidated financial statements (previous year: € 27.6
million 1)); this figure comprises auditing services of € 8.2 million (previous
year: € 8.1 million), other certification services of € 5.0 million (previous
year: € 4.2 million), tax advice services of € 0.6 million (previous year: €
0.6 million) as well as other services of € 15.6 million (previous year: € 14.7
million 1)). Of the figure shown for the other rendered services, € 8.5 mil-
lion (previous year: € 7.4 million) is attributable to services of associates
of the auditor of the consolidated financial statements.
(8) Result from investments accounted for using the equity methodThe following contributions to profits are recognized in the income state-
ment as a result of shares in companies over which significant influence
can be exercised or which are managed as joint ventures.
(€ million) 2018 2017
JOINT VENTUR E S
VT-ARRIVA Személyszállíto es Szolgáltató Kft., Székesfehérvár/Hungary 5 6Trieste Trasporti S.P.A., Trieste/Italy 4 3Other 0 4
9 13
A S S O CIATED COMPANIE S
EUROFIMA European Company for the Financing of Railroad Rolling Stock (EUROFIMA), Basel/Switzerland 3 3Other 0 –2
3 1
Total 12 14
(9) Net interest income
(€ million) 2018 2017
INTER E ST IN COME
Net interest income from pension provisions 6 4Other interest and similar income 21 43Income from securities 0 1
Operating interest income 27 48
Interest income from the reversal of deferred items and other interest income –3 5
24 53
INTER E ST E XPEN SE S
Other interest and similar expenses – 519 – 624Net interest expenses for pension provisions – 99 – 82Interest expenses from finance leases –27 –27
Operating interest expenses – 645 –733
Compounding of long-term provisions and liabilities –24 –24
– 669 –757
Total – 645 –704 Special items – 0 Effects from changes in scope of consolidation 1 0 Effects from changes in exchange rates –1 –
Total – comparable – 645 –704
For information only:Net operating interest income – 618 – 685
Of the figure shown for the decline in income from other interest and
similar income, about € 17 million is attributable to the refund of the
nuclear fuel tax in the previous year.
1) Figure adjusted.
Deutsche Bahn Group 2018 Integrated Report
200

The expenses from other interest and similar expenses have declined
considerably as a result of the average lower interest rates for the bonds
issued in the year under review and the previous year compared with
the bonds repaid in this period despite an overall increase in financial
debt. The decline is also attributable to the fact that interest expenses
of one-off items in the previous year are no longer applicable.
(10) Other financial result
(€ million) 2018 2017
Result from equity investments 1 0Result from currency exchange gains – 57 324Result from currency-related derivatives 59 –343Result from other derivatives 0 5Result from disposal of financial instruments 0 –Impairments on financial instruments – 8 –Other financial result – 9 –16
Total –14 –30 Special items – – Effects from changes in scope of consolidation 0 0 Effects from changes in exchange rates –3 –
Total – comparable –17 –30
Dividend income is recognized at the point at which the right to receive
the payment arises. Interest income is recognized in the income state-
ment using the effective interest method in the period in which the
income arises.
The result from exchange rate effects is attributable to the conver-
sion of foreign currency liabilities and receivables with an impact on the
income statement using the spot rate applicable on the reference date
(IAS 21). The result from exchange rate effects has to be netted with the
result from currency-related derivatives. The moderate exchange rate
fluctuations in the year under review are mainly attributable to the devel-
opment of the exchange rate between the euro and the Swiss franc, the
Australian dollar and the Japanese yen. The significant exchange rate
fluctuations in the previous year were due to the exchange rate between
the euro and most other currencies, and in particular the Swiss franc.
The result from currency-related derivatives comprises reclassifications
of currency-related changes in the market value of cash flow hedges
recognized under shareholders’ equity with no impact on the income
statement. The result from other derivatives relates to the development
in the market value of derivatives which are not classified as effective
hedges in accordance with IAS 39 (Financial Instruments: Recognition
and Measurement).
(11) Taxes on income
(€ million) 2018 2017
Actual tax expense –222 –202Income due to lapsing of tax obligations 30 22
Actual taxes on income –192 –180
Deferred tax expense – 438 –23
Taxes on income – 630 –203
The actual taxes on income continued to be incurred mainly at foreign
Group companies. In the year under review, the expenses associated with
deferred taxes were considerably higher than was the case in the pre-
vious year. This is attributable almost exclusively to Germany, and is the
result primarily of the writing down of deferred tax assets. Because of
the weaker expectations for profits in the planning period, it is expected
that there will be less utilization in future of loss carry-forwards as well
as temporary differences. Outside Germany, there are effects attribut-
able to higher income tax risks as well as new tax losses which will
probably not be able to be used for offsetting purposes.
Starting with the net profit of DB Group before taxes on income and
the theoretical taxes on income calculated using a theoretical tax rate
of 30.5%, the following reconciles the calculated taxes with the actual
taxes on income:
(€ million) 2018 2017
Profit before taxes on income 1,172 968Group tax rate (%) 30.5 30.5
Expected tax expense (–) –357 –295
Adjustment of the expected future use of loss carry-forwards and new temporary differences which have arisen and loss carry-forwards –299 –3Impact of tax rate changes 0 –15Income not subject to tax 30 28Tax effects related to IAS 12.33 55 59Expenses not deductible for tax purposes –16 –7Differences in tax rates for foreign companies 30 48Other effects –73 –18
Taxes on income as reported – 630 –203Effective tax rate (%) 53.8 21.0
The reconciliation amount as detailed in IAS 12.33 relates exclusively to
additional tax write-downs resulting from the fact that tax-free grants
in the IFRS financial statements have been deducted directly from the
costs of purchasing the assets. It is not permissible for deferred taxes to
be created in relation to these temporary differences.
In the year under review, the other effects include in particular
effects attributable to the difference in the assessment bases of different
income tax bases, and the creation of provisions for income tax risks
outside Germany.
(12) Earnings per shareUnder IAS 33 (Earnings per Share), undiluted earnings per share are cal-
culated by dividing the net profit of DB Group attributable to the share-
holders of DB AG by the weighted average number of shares in issue
during the year under review. Undiluted earnings per share correspond
to diluted earnings per share.
(€ million) 2018 2017
Net profit for the year 542 765 thereof attributable to non-controlling interests 14 20 thereof due to shareholders of DB AG 528 745Number of issued shares as of Dec 31 430,000,000 430,000,000Earnings per share (€ per share) undiluted 1.23 1.73 diluted 1.23 1.73
FIN
AN
CIA
L S
TA
TE
ME
NT
S
201
CONSOLIDATED FINANCIAL STATEMENTS — NOTES TO ThE CONSOLIDATED FINANCIAL STATEMENTS
SU
ST
AIN
AB
ILIT
Y

Notes to the balance sheet
(13) Property, plant and equipmentProperty, plant and equipment is measured at cost in accordance with
IAS 16 (Property, Plant and Equipment). The cost of production com-
prises individual costs as well as overhead costs which are directly
allocatable.
If at least two years are required for manufacturing an asset in order
to place it in its intended state in which it is capable of being used or
sold, any directly attributable borrowing costs are capitalized as costs
of production of the asset. If a direct link cannot be established, the
average borrowing cost rate of the year under review is used. Turnover
tax incurred in connection with the purchase or production of property,
plant and equipment is only capitalized if input tax is not permitted to
be deducted.
Subsequent costs are capitalized if the expenses enhance the economic
benefit of the property, plant and equipment and if the costs can be
reliably measured. On the other hand, all other repairs or maintenance
are expensed.
Components of property, plant and equipment which are significant
in relation to the total costs of purchase and costs of production are
recognized separately and written down over their useful lives using the
straight-line method.
Investment grants are deducted directly from the cost of purchase
or cost of production of the assets for which the grants have been given.
Finance lease assetsRented and leased assets where the underlying leases are classified as
finance leases under IAS 17 (Leases) are capitalized with the lower of fair
value or the present value of minimum lease payments at the start of the
lease, and are depreciated using the straight-line method over the finan-
cial service life of the asset or the shorter duration of the lease.
Property, plant and equipment (€ million) Land
Commercial, operating and other buildings
Permanent way
structures
Track infra-structure, signaling
and control equipment
Rolling stock for
passenger and freight
transport
Technical equipment
and machinery
Other equipment, operational
and office equipment
Advance payments
and con-struction in
progress Total
CO ST OF PURCHA SE AND CO ST OF PRODU C TION
As of Jan 1, 2018 4,150 7,707 15,210 16,921 31,317 1,842 5,107 4,108 86,362Changes in the scope of consolidation 3 30 – – 112 1 1 0 147 thereof additions 3 30 – – 112 1 1 0 147 thereof disposals – – – – – – 0 – –Additions 51 326 767 1,168 1,868 114 447 6,138 10,879Addition borrowing costs – – – – – – – 39 39Investment grants 0 – 87 – 640 –1,012 –16 –24 – 53 – 5,335 –7,167Transfers 8 226 160 135 220 56 157 – 961 1Transfers related to held-for-sale assets – – – – – – – – –Changes with no impact on the income statement – 0 – – – – 0 – 0Disposals – 55 –79 –22 –194 – 529 –76 –369 26 –1,298Currency translation differences –2 –10 0 0 –34 –3 – 5 0 – 54As of Dec 31, 2018 4,155 8,113 15,475 17,018 32,938 1,910 5,285 4,015 88,909
ACCUMUL ATED DEPR ECIATION
As of Jan 1, 2018 – 681 –3,489 – 5,253 –12,583 –20,049 –1,295 –3,399 – 5 – 46,754Changes in the scope of consolidation 0 –14 – – –36 –1 0 – – 51 thereof additions – –14 – – –36 –1 0 – – 51 thereof disposals – – – – – – 0 – –Depreciation – 8 –245 –193 –353 –1,224 – 97 –398 0 –2,518Impairments –1 –2 0 –1 –3 –1 –2 – –10Recoveries in value – 0 – 45 5 1 0 – 51Transfers 1 4 0 1 28 9 – 42 –1 0Disposals 19 60 13 178 444 71 314 0 1,099Currency translation differences 0 7 0 1 19 1 3 0 31As of Dec 31, 2018 – 670 –3,679 – 5,433 –12,712 –20,816 –1,312 –3,524 – 6 – 48,152
Carrying amount as of Dec 31, 2018 3,485 4,434 10,042 4,306 12,122 598 1,761 4,009 40,757Carrying amount as of Dec 31, 2017 3,469 4,218 9,957 4,338 11,268 547 1,708 4,103 39,608
Deutsche Bahn Group 2018 Integrated Report
202

Property, plant and equipment (€ million) Land
Commercial, operating and other buildings
Permanent way
structures
Track infra-structure, signaling
and control equipment
Rolling stock for
passenger and freight
transport
Technical equipment
and machinery
Other operational
and office equipment
Advance payments and
construction in progress Total
CO ST OF PURCHA SE AND CO ST OF PRODU C TION
As of Jan 1, 2017 4,194 7,517 14,984 16,869 30,286 1,762 4,976 3,623 84,211Changes in the scope of consolidation 9 22 – – 36 3 2 0 72 thereof additions 11 28 – – 52 3 3 – 97 thereof disposals –2 – 6 – – –16 0 –1 – –25Additions 23 257 740 1,338 1,468 87 497 5,796 10,206Addition borrowing costs – – – – – – – 38 38Investment grants 0 –108 – 653 –1,222 – 49 –12 – 58 – 4,594 – 6,696Transfers 3 126 150 127 200 49 104 –763 – 4Transfers related to held-for-sale assets – – – – – – 1 – 1Changes with no impact on the income statement – 0 – – – – 0 – 0Disposals – 67 –76 –10 –191 – 578 – 42 –380 9 –1,335Currency translation differences –12 –31 –1 0 – 46 – 5 –35 –1 –131As of Dec 31, 2017 4,150 7,707 15,210 16,921 31,317 1,842 5,107 4,108 86,362
ACCUMUL ATED DEPR ECIATION
As of Jan 1, 2017 – 819 –3,306 – 5,038 –12,160 –19,395 –1,254 –3,349 – 6 – 45,327Changes in the scope of consolidation –1 –10 – – –23 –3 –3 – – 40 thereof additions –1 –12 – – –34 –3 –3 – – 53 thereof disposals – 2 – – 11 0 0 – 13Depreciation – 8 –247 –223 – 521 –1,197 – 86 –394 – –2,676Impairments 0 – 5 –1 –127 – 8 –1 0 – –142Recoveries in value 120 0 – 48 30 0 0 – 198Transfers 0 1 0 0 –1 5 – 6 1 0Disposals 23 63 8 177 521 40 328 0 1,160Currency translation differences 4 15 1 0 24 4 25 0 73As of Dec 31, 2017 – 681 –3,489 – 5,253 –12,583 –20,049 –1,295 –3,399 – 5 – 46,754
Carrying amount as of Dec 31, 2017 3,469 4,218 9,957 4,338 11,268 547 1,708 4,103 39,608Carrying amount as of Dec 31, 2016 3,375 4,211 9,946 4,709 10,891 508 1,627 3,617 38,884
The additions to the borrowing costs include an average borrowing cost
rate of 2.54% (previous year: 2.77%).
The impairments of € 10 million (previous year: € 142 million) mainly
relate to rolling stock for passenger and freight transport.
Recoveries in value of € 51 million (previous year: € 198 million) re
late mainly to track infrastructure, signaling and control equipment of
DB Netz AG (€ 45 million) as well as freight transport of Euro Cargo Rail
SAS, Paris/France.
In the year under review, the carrying amount disposals for assets
under construction included carrying amount disposals of € 27 million
(previous year: € 18 million). These are attributable to the repayment of
investment grants which had been received in previous years and
deducted from assets.
As of December 31, 2018, restrictions to rights of disposal in relation
to property, plant and equipment existed to the extent of € 39 million (as
of December 31, 2017: € 37 million) mainly at S.I.A. Società Italiana Auto
servizi S.P.A., Brescia/Italy and S.A.B. Autoservizi S.R.L., Bergamo/Italy.
Property, plant and equipment includes rented assets which are
shown separately in the following overview. The rented property, plant
and equipment comprises assets which are substantially but not legally
owned by DB Group, so that the underlying lease agreements have to be
classified as finance leases.
Rented assets classified as finance leases (€ million) Land
Commer-cial, oper-ating and
other buildings
Rolling stock for
passen-ger and freight
transport
Other opera-
tional andoffice equip-
ment Total
Cost of purchase and cost of production 17 711 143 0 871Accumulated depreciation – 5 –233 – 51 0 –289
Carrying amount as of Dec 31, 2018 12 478 92 0 582
Cost of purchase and cost of production 20 646 171 0 837Accumulated depreciation – 5 –219 – 63 0 –287
Carrying amount as of Dec 31, 2017 15 427 108 0 550
The figure shown for the commercial, operating and other buildings
under leased assets also relates to real estate of DB AG, concourse build
ings of DB Station&Service AG and energy installations of DB Energie
GmbH. The figure shown under rolling stock for passenger and freight
transport relates mainly to rolling stock used by the transport companies
of DB Group (locomotives, freight cars and buses). The additions in the
year under review relate mainly to commercial and operating buildings
as well as rolling stock for passenger and freight transport.
The assets which in certain cases are determined on the basis of ret
rospective calculations and completed surveys and which are leased by
way of operating leases have the following residual carrying amounts:
FIN
AN
CIA
L S
TA
TE
ME
NT
S
203
CONSOLIDATED FINANCIAL STATEMENTS — NOTES TO ThE CONSOLIDATED FINANCIAL STATEMENTS
SU
ST
AIN
AB
ILIT
Y

Intangible assets (€ million)
Capitalized development
costs – products in use
Capitalized development
costs – products under develop-
ment
Purchased intangible
assets
Goodwill
Intangible assets with indefinite useful life
Advance payments
Total
2018 2017 2018 2017 2018 2017 2018 2017 2018 2017 2018 2017 2018 2017
CO ST OF PURCHA SE AND CO ST OF PRODU C TION
As of Jan 1 175 108 186 239 2,455 2,281 3,026 3,120 5 5 0 0 5,847 5,753Changes in the scope of consolidation – – – – 89 20 1 9 – – – – 90 29 thereof additions – – – – 89 21 1 10 – – – 0 90 31 thereof disposals – – – – – –1 – –1 – – – – – –2Additions 59 60 230 143 37 55 – 0 – 0 – – 326 258Investment grants – –1 – 41 –26 –1 –1 – – – – – – – 42 –28Transfers 45 13 –71 –154 25 145 0 – – 0 – 0 –1 4Changes with no impact on the income statement – – – – 0 –10 – – – – – – 0 –10Disposals –1 – 4 – 8 –15 –170 –11 –2 0 – – 0 – –181 –30Currency translation differences –1 –1 0 –1 – 9 –24 0 –103 – 0 – – –10 –129As of Dec 31 277 175 296 186 2,426 2,455 3,025 3,026 5 5 0 0 6,029 5,847
ACCUMUL ATED DEPR ECIATION
As of Jan 1 adjusted – 40 –30 –2 –2 –1,719 –1,546 – 487 – 484 0 0 – – –2,248 –2,062Changes in the scope of consolidation – – – – 0 0 – – – – – – 0 0 thereof additions – – – – 0 0 – – – – – – 0 0 thereof disposals – – – – – 0 – – – – – – – 0Depreciation –22 –14 – – –174 –190 – – – – – – –196 –204Impairments – 5 – – 5 – 6 – 4 –17 –1 – – – – – –15 –23Recoveries in value – – – – – – – – – – – – – –Transfers – – 2 0 –1 0 – – – 0 – – 1 0Disposals 0 4 – 6 147 16 3 – – 0 – – 150 26
Currency translation differences 0 0 – 0 5 18 4 –3 – 0 – – 9 15As of Dec 31 – 67 – 40 – 5 –2 –1,746 –1,719 – 481 – 487 0 0 – – –2,299 –2,248
Carrying amount as of Dec 31 210 135 291 184 680 736 2,544 2,539 5 5 0 0 3,730 3,599Carrying amount as of Dec 31 of previous year 135 78 184 237 736 735 2,539 2,636 5 5 0 0 3,599 3,691
Rented assets classified as operating leases (€ million) Properties Mobile assets
Cost of purchase and cost of production 1,470 6,092Accumulated depreciation – 459 – 4,616
Carrying amount as of Dec 31, 2018 1,011 1,476
Cost of purchase and cost of production 1,518 5,781Accumulated depreciation – 469 – 4,522
Carrying amount as of Dec 31, 2017 1,049 1,259
The residual carrying amounts and cumulative depreciation for the prop
erties (land and buildings) and also the mobile assets (mainly vehicles)
are in line with the previous year figures. The increased leasing of new
vehicles or vehicles with higher cost of purchase or cost of production
compared with the previous year was one of the factors resulting in
slightly higher residual carrying amounts for mobile assets as well as a
slight increase in the scheduled depreciation. Rental and leasing income
resulting from the rental and leasing of these assets are expected to be
received in future years as detailed in the following:
Expected rental and leasing income (nominal values) (€ million)
Residual maturity
TotalLess than
1 year 1 to 2 years 2 to 3 years 3 to 4 years 4 to 5 yearsMore than
5 yearsTotal more than 1 year
A S OF DEC 31 , 201 8
Minimum lease income 374 206 170 147 133 671 1,327 1,701
A S OF DEC 31 , 201 7
Minimum lease income 377 228 177 127 104 434 1,070 1,447
(14) Intangible assetsPurchased intangible assets are shown with their cost of purchase in
accordance with IAS 38 (Intangible Assets). Intangible assets manufac-
tured in-house are recognized with their cost of production, and consist
mainly of software.
Cost of production comprise mainly costs for materials and services,
wage and salary costs as well as relevant overhead costs.
Intangible assets (excluding goodwill and the Arriva brand) are sub-
sequently valued at cost of purchase or cost of production less depreci-
ation and impairments plus any recoveries in value.
Deutsche Bahn Group 2018 Integrated Report
204

The acquired intangible assets mainly comprise software (about € 276
million carrying amount), franchises and rights (about € 148 million car
ry ing amount) and acquired customer and franchise contracts (about
€ 210 million carrying amount).
There are no other legal, regulatory, contractual, competitionre lated,
economic or other factors which limit the useful life of the acquired Arriva
brand (carrying amount € 32 million).
Impairments of about € 14 million (previous year: € 23 million) were
recognized mainly at DB Cargo AG and Transportes Ferroviarios Especiales
S.A., Madrid/Spain.
Segment reporting shows the allocation of reported goodwill to the
various segments.
(15) Investments accounted for using the equity method Shares in associated companies and joint ventures are accounted for
using the equity method. The carrying amount, based on the Group costs
of purchase at the time of the purchase, is updated according to DB Group
share of changes in equity position of the company accounted for using
the equity method.
The shares in the investments accounted for using the equity
method have developed as follows:
(€ million) 2018 2017
As of Jan 1 500 534Additions 0 0Disposals –26 –1Share of DB Group in profits 12 14Capital increase 0 0Dividends received –11 –19Impairments – –Currency translation differences 11 –28Other valuation 0 0
As of Dec 31 486 500
The figure shown in the balance sheet as of December 31, 2018 is mainly
attributable to the shares held in the associated companies EUROFIMA
European Company for the Financing of Railroad Rolling Stock
(EUROFIMA), Basel/Switzerland and Barraqueiro SGPS SA, Lisbon/Por
tugal. The shares in EUROFIMA are subject to restrictions in terms of
being sold; new shareholders must be railway administration entities
which additionally require a guarantee of their respective country guar
anteeing their obligations. The disposals relate mainly to VT-Arriva
µ190 ff.
(16) Deferred taxesDeferred taxes are calculated in accordance with IAS 12 (Income Taxes).
The theoretical income tax rate for corporations for domestic com-
panies used as the basis for calculating deferred taxes is 30.5%. The
income tax rate comprises the corporation tax rate plus solidarity sur-
charge and an average trade tax rate. Foreign subsidiaries use their rel-
evant local tax rates for calculating deferred taxes.
A deferred tax asset is recognized in accordance with IAS 12.24 or IAS
12.34 if, after corresponding deferred tax liabilities have been deducted,
it is likely that adequate taxable income is available. The mid-term plan-
ning is used as the basis in this respect. Deferred tax assets relating to
income which can be generated after the mid-term period are not recog-
nized, on the grounds that they cannot be reliably determined.
Deferred taxes are established on the basis of the tax rates which
can be expected for the period in which the deferred tax is realized on
the basis of existing laws or laws which have in essence been adopted.
Critical assessments and appraisalsThe calculation of deferred tax assets is generally based on the mid-term
planning. If the sum of net profits planned for the mid-term planning
period were to decline by 10% in conjunction with otherwise unchanged
tax parameters, deferred tax assets would have to be reduced by € 93
million (previous year: € 142 million).
Deferred tax assets are broken down as follows:
As of Dec 31 (€ million) 2018 2017
Deferred tax assets in respect of temporary differences 506 652Deferred tax assets in respect of losses carried forward 526 764
Total 1,032 1,416
No deferred tax assets have been created in relation to the following
losses carried forward and temporary differences:
As of Dec 31 (€ million) 2018 2017
Tax loss carry-forwards for which no deferred tax asset has been created 14,440 13,564Temporary differences for which no deferred tax asset has been created 4,622 3,917Temporary differences which are not permitted to be recognized in accordance with IAS 12.24b in conjunction with 12.33 2,273 2,465
Total 21,335 19,946
The losses carried forward are mainly attributable to the tax law treat
ment of Federal Government grants paid in the past to DB AG in accor
dance with section 21 (5) and section 22 (1) Deutsche Bahn Foundation
Act (Deutsche Bahn Gründungsgesetz; DBGrG) as a contribution.
On the basis of current law, the domestic losses carried forward are
fully allowable in accordance with current legislation (in terms of the
actual amount and justification).
The temporary differences which are not permitted to be recognized
in accordance with IAS 12.33 relate exclusively to additional tax depreci
ation from previously received taxfree investment grants.
The following deferred tax assets and deferred tax liabilities shown
in the balance sheet are due to statement and valuation differences for
the individual balance sheet items and tax losses carried forward:
FIN
AN
CIA
L S
TA
TE
ME
NT
S
205
CONSOLIDATED FINANCIAL STATEMENTS — NOTES TO ThE CONSOLIDATED FINANCIAL STATEMENTS
SU
ST
AIN
AB
ILIT
Y

(€ million)
Other investments Securities Total
2018 2017 2018 2017 2018 2017
As of Jan 1 38 10 3 3 41 13Currency translation differences 0 0 0 0 0 0Changes in scope of consolidation –1 – – – –1 –Additions 15 28 0 0 15 28Disposals through sale 0 0 – 0 0 0Other disposals 0 – – – 0 –Fair value changes – – –1 0 –1 0Reclassifications – 8 0 – – – 8 0Other 0 0 – – 0 0
As of Dec 31 44 38 2 3 46 41 thereof at cost/cost of purchase – 38 0 0 0 38 thereof fair value (recognized directly in equity) 28 – 2 3 30 3 thereof fair value (recognized in the income statement) 16 – – – 16 –Non-current portion 44 38 1 2 45 40Current portion – – 1 1 1 1
As of Dec 31 (€ million)
Deferred tax assets Deferred tax liabilities
2018 2017 2018 2017
NON - CUR R ENT A S SET S
Property, plant and equipment 119 186 150 145Intangible assets 3 2 43 42Shares in companies accounted for using the equity method 1 1 1 1Other financial assets 5 5 0 2CUR R ENT A S SET S
Inventories 3 3 1 1Trade receivables 8 9 1 1Other financial assets 5 5 9 12NON - CUR R ENT LIABILITIE S
Financial debt 38 71 2 3Other liabilities 61 45 4 7Derivative financial instruments 4 7 0 0Pension obligations 207 172 3 3Other provisions 109 138 0 1CUR R ENT LIABILITIE S
Financial debt 6 23 1 1Other liabilities 39 41 46 20Other provisions 30 72 23 10Losses carried forward 526 764 0 0
Total 1,164 1,544 284 249
Netting 1) –132 –128 –132 –128
Amount stated in the balance sheet 1,032 1,416 152 121
1) To the extent permitted by IAS 12 (Income Taxes).
Tax assets and liabilities are netted if they exist in relation to the same
tax authority, if they are of identical maturity and if they relate to the
same tax subject.
Of the deferred tax assets of € 1,164 million (as of December 31, 2017:
€ 1,544 million), a figure of € 91 million (as of December 31, 2017: € 153
million) will probably be realized in the course of the next 12 months. Of
the deferred tax liabilities of € 284 million (as of December 31, 2017: € 249
million), a figure of € 83 million (as of December 31, 2017: € 45 million)
will probably be realized in the course of the next 12 months.
Deferred tax assets recognized directly in equity (€ 110 million; as
of December 31, 2017: € 77 million) are shown in the figure disclosed in
the balance sheet for deferred taxes.
(17) Other investments and securitiesOther investments are shown with their fair value.
Long- or short-term securities are recognized with their market values
as of the reporting date – where such values exist. Changes in fair value
are recognized with no impact on the income statement in the reserve
attributable to the marking-to-market of securities.
Other investments and securities have developed as follows:
(18) InventoriesAll costs which are directly related to the procurement process are cap-
italized as the costs of purchase of the inventories. The average method
is used as the basis for establishing the cost of purchase of fungible and
homogeneous raw materials and supplies. The costs of production com-
prise the individual costs and also the directly attributable overheads;
borrowing costs and idle costs are not capitalized, and instead are rec-
ognized as expense in the period in which they are incurred.
As of the balance sheet date, inventories are measured with the lower
of cost or net realizable value.
Inventories are broken down as follows:
As of Dec 31 (€ million) 2018 2017
Raw materials, consumables and supplies 1,383 1,253Unfinished products, unfinished services 159 136Finished products and goods 102 93Advance payments 41 41Impairments –316 –372
Total 1,369 1,151
Deutsche Bahn Group 2018 Integrated Report
206

(19) Receivables and other assetsIn general, receivables and other financial assets are measured at amor-
tized cost of purchase. Finance lease receivables, advance payments
made and plan assets in accordance with IAS 19 (Employee Benefits) are
not allocated to any category of IFRS 9 (previous year: IAS 39) (valuation
categories in accordance with IFRS 9 µ219).
Receivables for which there are substantial objective indications of
an impairment are adjusted appropriately. Portfolio-based allowances
are also recognized in relation to groups of assets; in particular, histor-
ical default rates are taken into consideration. In DB Group, the matur-
ities of the receivables and default risks are monitored constantly.
Some transport contracts include a handing over obligation speci-
fying that the deployed assets owned by DB Group have to be handed
over at the end of the contract. Other transport contracts include that the
deployed assets have to be rented from the contracting organization or a
capital service guarantee to be provided by the contracting organization
for leasing from independent financial service providers. In accordance
with IFRIC 12 (Service Concession Arrangements), the corresponding cap-
ital expenditures are capitalized as receivables from transport concession
arrangements at the end of the contract, with the guaranteed residual
values being separated. The receivables are redeemed out of the conces-
sion fees, which means that not all of the concession fees result in reve-
nues. The residual value receivables are disclosed at their present value
under the financing receivables.
Critical assessments and appraisalsThe impairment of doubtful receivables to a considerable extent com-
prises assessments and appraisals of individual receivables which are
based on the creditworthiness of the particular customer, current eco-
nomic developments as well as an analysis of historical bad debts at
the portfolio level. If the impairment is derived on the basis of historical
default rates at the portfolio level, any decline in the overall volume
of receivables results in a corresponding reduction of such pro visions
(and vice versa).
Receivables and other assets comprise the following:
(€ million)Trade
receivables
Receivables from
financing
Receivables from trans-
port conces-sions
Advance payments
Other assets Total
A S OF DEC 31 , 201 8
Gross value 5,128 184 163 282 1,638 7,395Impairments –142 –10 0 – –31 –183
Net value 4,986 174 163 282 1,607 7,212 thereof due from related parties 34 12 – 0 384 430
A S OF DEC 31 , 201 7
Gross value 4,791 137 126 243 1,442 6,739Impairments –181 – 6 – – – 59 –246
Net value 4,610 131 126 243 1,383 6,493 thereof due from related parties 41 14 – 0 276 331
DB Group concluded factoring agreements with a bank; according to the
terms of this agreement, the bank is obliged to purchase on a revolving
basis current trade receivables in certain companies of the DB Schenker
segment up to a maximum volume of € 709 million. Criteria for defining
the receivables include the following: legal enforceability, the invoice
falling due within 180 days of the invoice date, and the fact that the
debtor is not an intraGroup debtor. The agreement has been concluded
for an indefinite period of time. DB Group will continue to be responsible
for sales ledger accounting and the dunning system on behalf of the
bank until further notice. The risks relating to the receivables which are
sold and which are relevant for the risk assessment are the credit risk
and the risk of late payment. The purchase price is equivalent to the
nominal amount. DB Group bears bad debt related to credit risks from
the various tranches as well as latepayment risks up to a maximum
amount of € 162 million. The other bad debts related to the credit risk
are borne by the bank. Virtually none of the opportunities and risks
associated with the receivables have been transferred or retained (break
down of major risks between DB Group and bank). For some of the
receivables, the right of disposal over the receivables which have been
sold has been transferred to the bank as the bank has the actual ability
to sell on the receivables. These receivables have been completely de
recognized. As of December 31, 2018, outstanding receivables with a
volume of € 686 million had been sold; of this figure, an amount of € 250
million had been entirely derecognized and an amount of € 436 million
had been derecognized to the extent of the transferred risk. Purchase
price payments received by the bank increased the cash flow from oper
ating activities.
FIN
AN
CIA
L S
TA
TE
ME
NT
S
207
CONSOLIDATED FINANCIAL STATEMENTS — NOTES TO ThE CONSOLIDATED FINANCIAL STATEMENTS
SU
ST
AIN
AB
ILIT
Y

The receivables from financing include residual values of € 62 million
agreed with the public transport authorities for transport contracts. These
residual value receivables mainly relate to rolling stock which are sold for
a fixed price at the end of the transport contract to the public transport
authority or to a third party designated by the public transport authority.
The other assets disclose for the first time contract fulfillment costs
of € 22 million.
The impairments for the financial instruments classified in accor
dance with IFRS 7 have developed as follows:
(€ million)
Trade receiv-
ables
Receiv-ables from
financ-ing
Receiv-ables from
transport conces-
sionsOther
assets Total
As of Jan 1, 2018 –181 – 6 – – 59 –246Change in method IFRS 9 24 0 – 0 24Additions –26 – 4 0 –3 –33Reversals 24 – – 11 35Amounts used 17 0 – 20 37Changes in the scope of consolidation 0 – – 0 0Currency translation differences 0 0 – 0 0
As of Dec 31, 2018 –142 –10 0 –31 –183
As of Jan 1, 2017 –206 –3 – – 47 –256Change in method IFRS 9 – – – – –Additions –15 –3 0 –18 –36Reversals 32 – – 5 37Amounts used 7 0 – 1 8Changes in the scope of consolidation –2 0 – 0 –2Currency translation differences 3 0 – 0 3
As of Dec 31, 2017 –181 – 6 – – 59 –246
Individual allowances are created in relation to receivables if there are
objective indications of an impairment. In the case of identical receivables
(portfolios of receivables) which cannot be identified as impaired individ
ually, the year under review has for the first time seen the creation of risk
provisioning for expected loan losses within the framework of the first
time adoption of IFRS 9 µ188. Any impairments which are recognized are
deducted from financial assets on the assets side of the balance sheet.
Previous impairments are reversed if the reasons for the original impair
ments are no longer applicable.
Expenses of € 49 million were incurred in the year under review for
the complete derecognition of receivables and other assets (previous
year: € 50 million).
Income of € 16 million was reported for payments received in relation
to previously derecognized receivables and other assets (previous year:
€ 5 million).
For trade receivables, DB Group uses the simplified approach accord ing
to IFRS 9 in order to measure the expected loan losses. Accordingly, for
all trade receivables, the loan losses expected over the life of the receiv
ables are used for this purpose. For measuring the expected loan losses,
trade receivables are pooled on the basis of common credit risk features.
The expected loan losses are determined on a collective basis using
impairment matrices. These are determined on the basis of the in dividual
segments within DB Group. The expected loan losses amounted to € 23
million as of December 31, 2018.
As of Dec 31, 2018 (€ million)
Net carrying
amount
Expect- ed loss
rate (%)Risk pro-
visioning
thereof risk pro-
visioning for past
due receiv-
ables
thereof risk provi-
sioning for receiv-
ables not past due
Trade receivables 4,986 0.46 23 13 10
Major receivable defaults can be used as the basis for breaking down the
impairment matrices for past due receivables into the following maturity
structure:
As of Dec 31, 2018 (€ million)
Past due (days)
up to 30 31–120more
than 120
Risk provisioning for past due receivables 1 7 5
For receivables from financing as well as other financial receivables, the
expected impairment requirement for major items was determined in
relation to specific receivables. Risk provisioning totaling € 6 million was
created for this purpose as of December 31, 2018.
For major other financial receivables, the current counterpartyspe
cific default rates are used for this purpose. With a gross carrying amount
of € 55 million, this results in a loss rate of 6.0%. The average rated default
rate of a specific country is used for other financial receivables. With a
gross carrying amount of € 1,456 million, this results in a loss rate of 0.2%.
The change in the process of determining expected losses results
in a oneoff positive effect of € 24 million in DB Group; this was dis
closed separately in equity (Consolidated statement of changes in equity
µ185).
The following overview shows the maturity structure of the receiv
ables for the financial instruments classified in accordance with IFRS 7
and the advance payments which have been made:
Deutsche Bahn Group 2018 Integrated Report
208

(€ million)
Residual maturity
TotalLess
than 1 year 1 to 2 years 2 to 3 years 3 to 4 years 4 to 5 yearsMore
than 5 yearsTotal more than 1 year
A S OF DEC 31 , 201 8
Trade receivables 4,962 15 8 1 0 0 24 4,986Receivables from financing 98 3 1 1 1 70 76 174Receivables from transport concessions 16 10 10 10 10 107 147 163Advance payments 230 52 – – – – 52 282Other assets 1,526 27 3 15 6 30 81 1,607
Total 6,832 107 22 27 17 207 380 7,212 thereof non-financial assets 549 64 2 5 0 13 84 633
A S OF DEC 31 , 201 7
Trade receivables 4,571 17 14 7 1 0 39 4,610Receivables from financing 77 7 3 1 1 42 54 131Receivables from transport concessions 13 10 10 10 10 73 113 126Advance payments 196 47 – – – – 47 243Other assets 1,334 30 11 0 0 8 49 1,383
Total 6,191 111 38 18 12 123 302 6,493 thereof non-financial assets 513 47 – – – 6 53 566
The significant increase in trade receivables compared with the previous
year was attributable to almost all segments. A slightly opposite devel
opment was evident mainly in the DB LongDistance segment.
The current other assets also comprise the customs receivables
of the DB Schenker segment. In virtually all segments, there have been
increases in the other assets compared with the previous year; sig ni fi
cant reductions relate to the DB Arriva segment. The increase in the
other assets was mainly due to higher receivables due from the Federal
Government.
As a result of the large number of customers in the various operating
segments, there is no evidence of any concentration of credit risks with
trade receivables.
The fair values of the balance sheet items receivables and other
assets, trade receivables as well as other receivables and assets essen
tially correspond to the carrying amounts.
The maximum default risk is essentially equivalent to the carrying
amount in each case. Collateral is not normally held.
As of the closing date, there are no indications that debtors of the
receivables which are neither impaired nor overdue will not meet their
payment obligations.
(20) Income tax receivablesThe income tax receivables relate to advance payments which have been
made as well as allowable withholding taxes.
(21) Derivative financial instrumentsUpon conclusion of a contract, derivative financial instruments are gen-
erally classified as hedging instruments for hedging the cash flows from
contractual obligations or anticipated transactions (cash flow hedge).
Cash flow hedgesCash flow hedges are used to provide protection against fluctuations in
the cash flows of financial assets or liabilities or anticipated transactions.
When future cash flows are hedged, the hedging instruments are also
recognized with their fair value. Changes in value are initially recognized
in shareholders’ equity with no impact on the income statement, and are
only recognized in the income statement at the point at which the corre-
sponding losses or profits from the underlying have an impact on the
income statement or the transactions expire. Any ineffectiveness is rec-
ognized in the income statement in accordance with IFRS 9.
Derivative financial instruments which do not satisfy the requirements for recognizing hedges in accordance with IFRS 9If hedges which in economic terms are used for interest, currency or price
hedging do not satisfy the restrictive requirements of IFRS 9 for being
recognized as a hedge, the changes in value are immediately recognized
in the income statement.
Calculation of the fair valueThe fair value of financial instruments which are traded in an active
market is derived from the market price applicable on the balance sheet
date. Common valuation methods such as option price or present-value
models are used for determining the fair value of financial instruments
which are not traded in an active market. If valuation-relevant parame-
ters are not directly observable on the market, forecasts are used based
on comparable financial instruments which are traded in an active
market; these forecasts are then adjusted by premiums or discounts on
the basis of historical data. The mean value of bid and offer rates is used.
Trades for which no premium has been paid have a fair value of zero
upon conclusion. DB AG operates with long-dated financial derivatives
on a hedged basis, and does not perform any credit risk adjustment for
FIN
AN
CIA
L S
TA
TE
ME
NT
S
209
CONSOLIDATED FINANCIAL STATEMENTS — NOTES TO ThE CONSOLIDATED FINANCIAL STATEMENTS
SU
ST
AIN
AB
ILIT
Y

the present value for hedged transactions. For considerations of materi-
ality, no credit risk adjustment is used for current derivatives. If credit
risk adjustment is used, the relevant discounts are derived from the credit
default swap (CDS) figures observable on the market.
All derivatives used in DB Group are measured using common
methods such as option price or present value models, because their fair
values are not traded on an active market. No parameters from non-ob-
servable markets are used for measurement purposes.
The volume of hedges which have been taken out is shown in the
following overview of nominal values:
As of Dec 31 (€ million)
Nominal values of the hedged liabilities
2018
Remain-ing term
up to 1 year
Remain-ing term
more than 1
year 2017
INTER E ST- BA SED CONTR AC T S
Interest swaps 92 0 92 100
92 0 92 100CUR R EN C Y- BA SED CONTR AC T S
Currency swaps 796 796 0 925Currency forwards 1,683 1,636 48 1,471Cross-currency swaps 6,061 248 5,813 5,545
8,540 2,680 5,861 7,941
As of Dec 31 (1,000 t)
Volume
2018
Remain-ing term
up to 1 year
Remain-ing term
more than 1
year 2017
OTHER CONTR AC T S
Diesel 962 126 836 1,117Hard coal 4,116 1,284 2,832 60
The volume of interest rate swaps declined to € 92 million; no new busi
ness was transacted. The changes in holdings of currency swaps and
forwards vary in line with the corresponding hedging requirements of
the subsidiaries. In the year under review, the nominal value of the
crosscurrency swaps increased by € 516 million to € 6,061 million,
because the year under review saw the issue of foreign currency bonds
whose cash flows were swapped into euros.
The volume of diesel derivatives declined by 0.1 million t to 1.0 mil
lion t as the volume of the expiring transactions exceeded the new trans
actions. The volume of coal hedges has increased considerably as of
December 31, 2018 by about 4.0 million t to 4.1 million t due to a higher
hedging preference.
The following table shows the average hedging prices/hedging rates
for the main derivative hedging instruments of DB Group (per currency)
in the year under review:
Currency
Hedging price Hedging rate
DieselHard
coal
Cross- currency
swaps(CCS)
Interestrate
swaps(IRS)
Currency swap
Currency forward
EUR 533.51 66.40 – 0.04 – –USD – – 1.27 – 1.15 1.15GBP 381.91 – 0.87 – 0.90 0.90CHF – – 1.22 – – 1.13JPY – – 117.50 – – 127.52AUD – – 1.52 – – 1.60HKD – – – – 9.02 8.93NOK – – 8.67 – 9.94 9.88SEK – – 8.99 – – 10.31DKK – – 7.46 – – 7.47SGD – – 1.63 – 1.56 1.57NZD – – 1.65 – – 1.67PLN 1,706.00 – 4.23 – 4.47 4.29CZK 10,853.69 – 26.26 – – 25.79HUF – – 300.20 – – 327.67RON – – 4.51 – 4.66 4.68HRK – – 7.45 – 7.47 7.42CNY – – – – – 7.96ILS – – – – – 4.27SAR – – 4.29 – – –AED – – – – – 4.19QAR – – – – – 4.39
All derivative financial instruments are markedtomarket on the reporting
date. The following overview shows the structure of the item stated in
the balance sheet depending on the type of underlying hedge:
As of Dec 31 (€ million)
Assets Liabilities
2018 2017 2018 2017
INTER E ST- BA SED CONTR AC T S
Interest swaps – – 9 11Interest forwards 0 – – –
0 – 9 11
CUR R EN C Y- BA SED CONTR AC T S
Currency swaps 1 1 5 3Currency forwards 4 5 6 5Other currency derivatives 0 0 0 0Cross-currency swaps 202 126 326 316 thereof effects from currency hedges 199 119 222 194
207 132 337 324
OTHER CONTR AC T S
Energy price derivatives 56 47 45 47
56 47 45 47
Total 263 179 391 382Interest-based contracts – – 9 11Currency-based contracts 168 113 326 296Other contracts 48 47 37 34
Non-current portion 216 160 372 341
Current portion 47 19 19 41
Deutsche Bahn Group 2018 Integrated Report
210

Cash flow hedgesIn order to minimize the interest rate and exchange rate risk, foreign
currency issues as well as intraGroup foreign currency loans within the
Group are in principle translated into euros, and floatingrate financial
liabilities are generally converted into fixedincome financial liabilities.
Energy price hedging is intended to reduce price fluctuations attribut
able to energy sourcing.
The negative valuation of the interest rate swaps is still due to a
continuous decline in the level of interest rates since the transactions
were concluded. The development in the value of the crosscurrency
swaps is mainly attributable to the weakening of the euro against the
Swiss franc and the Japanese yen, partially offset by the strengthening
against the British pound and Australian dollar.
The positive market value of the energy price derivatives reflects the
development on the underlying raw materials markets.
The market values of the cash flow hedges are shown as follows
under assets and liabilities:
As of Dec 31 (€ million)
Assets Liabilities
2018 2017 2018 2017
INTER E ST- BA SED CONTR AC T S
Interest swaps – – 9 11
– – 9 11
CUR R EN C Y- BA SED CONTR AC T S
Currency swaps 1 1 5 3Cross-currency swaps 202 126 291 277
203 127 296 280
OTHER CONTR AC T S
Energy price derivatives 56 47 45 47Miscellaneous/other derivatives – – 0 –
56 47 45 47
Total 259 174 350 338Interest-based contracts – – 9 11Currency-based contracts 167 113 291 256Other contracts 48 47 37 34
Non-current portion 215 160 337 301
Current portion 44 14 13 37
Cash flow hedges are not classified under any category of IFRS 9.
The hedged cash flows of the underlyings will probably materialize,
and have an impact on the income statement, in the years 2019 to 2032
(interest payments and payments of principal) or in the years 2019 to 2025
(payments for energy).
Details for hedges and underlyings in accordance with IFRS 9
(€ million)
2018 31.12.2018
Change in hedges
Change in underlyings
Status of hedging cash
flow hedges
INTER E ST- BA SED CONTR AC T S
Interest swaps +2 – – 6CUR R EN C Y- BA SED CONTR AC T S
Currency swaps –2 – +1Cross-currency swaps + 62 – –112OTHER CONTR AC T S
Energy price hedges +11 – + 4
In the case of interest and crosscurrency hedges, the effectiveness of the
hedge is assessed prospectively using the critical terms match method.
This method is used because the major valuation parameters of the
underlying and hedges are identical. Ineffectiveness is measured as of
every balance sheet date by means of the hypothetical derivative method.
In this method, the development in value of the hedge which is actually
taken out is compared with the development in value of a theoretical
hedge in which all valuationrelevant parameters are identical to those
of the underlying. The retrospective effectiveness measurement is carried
out as of every balance sheet date by means of linear regression. The
ineffectiveness is calculated using the dollaroffset method. Under this
method, the changes in the market values of the underlying are compared
with the changes in the market value of the hedging instrument. The
resultant quotient determines the ineffectiveness.
The ineffectiveness of cash flow hedges of the energy price deriva
tives recognized in the income statement amounted to € 0 million in the
year under review (previous year: € 0 million).
Non-hedge derivativesCurrency forwards taken out to hedge operations are normally classified
as nonhedge derivatives.
The market values of the nonhedge derivatives are shown under
assets and liabilities as follows:
As of Dec 31 (€ million)
Assets Liabilities
2018 2017 2018 2017
INTER E ST- BA SED CONTR AC T S
Interest forwards – – – –
– – – –
CUR R EN C Y- BA SED CONTR AC T S
Currency forwards 4 5 6 5Cross-currency swaps – – 35 39
4 5 41 44
OTHER CONTR AC T S
Energy price derivatives 0 0 – –
0 0 – –
Total 4 5 41 44Currency-based contracts 1 0 35 40
Non-current portion 1 0 35 40Current portion 3 5 6 4
The crosscurrency swaps are based on a redesignation of hedges as a
result of the transfer of transactions between banks. The conditions in
cluding the cash flows of the derivatives were unchanged and the eco
nomic hedge is thus still in place. The slight decline is attributable to the
reversal of the redesignated amounts in line with the remaining matur
ities of the swaps.
The nonhedge derivatives are classified under the category held
fortrading of IFRS 9.
The financial instruments recognized at fair value are classified under
valuation level 2 and to a lesser extent under valuation level 1.
FIN
AN
CIA
L S
TA
TE
ME
NT
S
211
CONSOLIDATED FINANCIAL STATEMENTS — NOTES TO ThE CONSOLIDATED FINANCIAL STATEMENTS
SU
ST
AIN
AB
ILIT
Y

As of Dec 31 (€ million)
2018 2017
Level 1 Level 2 Level 3 Total Level 1 Level 2 Level 3 Total
A S SET S
Available-for-sale financial assets (securities at fair value) 2 – – 2 2 – – 2Derivatives – non-hedging – 4 – 4 – 5 – 5Derivatives – hedging – 259 – 259 – 174 – 174
Total 2 263 – 265 2 179 – 181
LIABILITIE S
Derivatives – non-hedging – 41 – 41 – 44 – 44Derivatives – hedging – 350 – 350 – 338 – 338
Total – 391 – 391 – 382 – 382
There have been no reclassifications between the valuation levels in the
year under review.
For establishing the fair values of the derivative financial instru
ments, the contractually agreed or most probable cash flows are dis
counted using the appropriate market interest rate, whereby due con
sideration is given to the credit risk by means of credit spreads. No credit
risk markdowns have been recognized in the case of secured exposures.
The credit risk resulting from the derivative portfolio is treated on a net
basis. Credit support annexes, which are subject to daily security settle
ment with a threshold value of € 0, were concluded to minimize the credit
risk of longterm interest and crosscurrency transactions.
(22) Cash and cash equivalentsThis item comprises cash in hand and checks, deposits at banks which are
due on sight, as well as cash equivalents. Cash at banks comprises over-
night money as well as time deposits (including repurchase agreements
(repos)) due within three months.
Cash and cash equivalents are recognized with their nominal value
(at amortized cost).
Cash and cash equivalents are broken down as follows:
As of Dec 31 (€ million) 2018 2017
Cash in hand and cash at banks 3,543 3,396Cash equivalents 1 1
Total 3,544 3,397
Effective interest rate on short-term bank deposits (%) – 0.20 – 0.16Average term of short-term bank deposits (months) 0.4 0.4
The interest rates for current bank deposits were in a range of between
–0.60% and 0.19% (previous year: between –0.55% to 0.18%) and relate
to investments in euros. The maturities of the investments are between
one day and three months.
With regard to cash and cash equivalents, please refer to section
“Notes to the statement of cash flow” µ227.
(23) Assets available for saleUnder IFRS 5, non-current assets are classified as held-for-sale non-cur-
rent assets if their carrying amount is to be realized by way of sale and
not by way of continued use. This can be an individual asset, a disposal
group or part of a company. Non-current held-for-sale assets are stated
with the lower of carrying amount or market value less costs which are
incurred.
The disclosure relates to GHT Mobility GmbH, Berlin, in which DB
Group acquired a majority of shares in the year under review by way of
several tranches. The simplified method according to IFRS 5, IG example
13, was used for integrating the company.
(24) Subscribed capital The share capital of DB AG is € 2,150 million. It consists of 430,000,000
noparvalue bearer shares. All shares are held by the Federal Republic
of Germany.
(25) Reservesa) Capital reservesCapital reserves comprise reserves which have not been part of profits.
b) Reserve resulting from valuation with no impact on the income statementReserve for currency translation differencesThe currency translation differences resulting from the method of func
tional currency (IAS 21) are shown separately as part of consolidated
shareholders’ equity.
Deutsche Bahn Group 2018 Integrated Report
212

Reserve for market valuation of securitiesThe reserve includes the changes in the market value of financial instru
ments to be recognized directly in equity. The reserve has to be reversed
to the income statement or eliminated when a financial instrument is
sold, became due or was reclassified.
In the year under review, the measurement of financial instruments
directly in equity has not resulted in the creation of any deferred tax
assets (as of December 31, 2017: none).
Reserve attributable to the market valuation of cash flow hedgesThe development in the reserve is shown in the following:
(€ million) 2018 2017
As of Jan 1 –121 –168Change in market value 90 –368Reclassifications Financial result – 59 344 Net interest income 3 24 Cost of materials –18 51Changes in deferred taxes –1 – 4
As of Dec 31 –106 –121
Reserve for the revaluation of pensionsThe effects resulting from the revaluation of defined benefit plans in
accordance with IAS 19 (Employee Benefits) are recognized directly in
equity.
Other changes in the reservesThis item mainly shows amounts resulting from transactions in relation
to reductions or increases in noncontrolling interests between the
shareholders of DB AG and the noncontrolling interests.
(26) Retained earningsThe generated shareholders’ equity comprises the entire net profits gen
erated since January 1, 1994 less the goodwill offset under HGB up to
December 31, 2002 as well as the dividends paid to the shareholder.
This item also shows the impact on shareholders’ equity attributable
to the firsttime adoption of IFRS if they are not included in the reserves
attributable to valuation with no impact on the income statement.
(27) Non-controlling interestsNoncontrolling interests comprise the share of third parties in the net
assets of consolidated subsidiaries. Thirdparty interests in the currency
reserve amount to € –8 million (as of December 31, 2017: € –6 million).
(28) Financial debtLiabilities are normally recognized in accordance with IFRS 9 with their
nominal amount, which corresponds to the fair value at the point at
which the liability is initially recognized and the amortized costs of pur-
chase up to the date at which the liability is settled. Financial debt and
other non-current liabilities, when initially recognized, are stated with
the amount which corresponds to the fair value of the received assets,
where appropriate less transaction costs. Subsequently, they are stated
using amortized costs of purchase using the effective interest method.
The differences between the amount paid out less transaction costs and
the amount repaid are recognized in the income statement over the life
of the liability.
Interest-free loans which are related to infrastructure capital expen-
ditures are recognized with the present value of the amounts to be
repaid, and are adjusted to their nominal repayment amount over their
life. The difference between the nominal amount of the loan and the
present value is recognized as an interest benefit under deferred items.
The income from pro rata reversal of these deferred items is shown as
other operating income.
Liabilities arising from leases which are classified as finance leases
in accordance with the allocation criteria of IAS 17 are recognized at the
lower of fair value and the present value of minimum leasing payments
at the beginning of the lease, and are subsequently stated under finan-
cial debt in the amount of amortized cost of purchase. The leasing
installments are broken down into an interest component and a repay-
ment component. The interest component of the leasing installment is
recognized in the income statement. Liabilities arising from finance
leases are not classified under any category of IFRS 9.
Some transport contracts comprise the leasing particularly of rail
vehicles from the public sector or from independent financial service
providers, whereby the latter receive a capital service guarantee, a rede-
ployment guarantee or similar from the public transport authority. The
present value of these payment obligations is shown under the financing
liabilities from transport concessions.
The financial debt comprises all interestbearing liabilities including
the interestfree loans stated with their present values. The maturity
structure of financial debt is as follows:
FIN
AN
CIA
L S
TA
TE
ME
NT
S
213
CONSOLIDATED FINANCIAL STATEMENTS — NOTES TO ThE CONSOLIDATED FINANCIAL STATEMENTS
SU
ST
AIN
AB
ILIT
Y

(€ million)
Residual maturity
TotalUp to 1 year 1 to 2 years 2 to 3 years 3 to 4 years 4 to 5 yearsMore than
5 yearsTotal more than 1 year
A S OF DEC 31 , 201 8
Interest-free loans 174 153 140 134 128 122 677 851Bonds 1,958 2,137 1,804 1,544 1,916 11,353 18,754 20,712Bank borrowings 240 4 1 400 0 1 406 646EUROFIMA loan – – 200 – – – 200 200Finance lease liabilities 44 43 59 36 41 339 518 562Finance liabilities from transport concessions 6 6 6 7 7 13 39 45Other financial liabilities 196 24 1 0 6 1 32 228
Total 2,618 2,367 2,211 2,121 2,098 11,829 20,626 23,244 thereof due to related companies 186 153 341 134 128 122 878 1,064
A S OF DEC 31 , 201 7
Interest-free loans 200 167 146 134 128 239 814 1,014Bonds 1,900 1,940 2,085 1,809 1,547 10,335 17,716 19,616Bank borrowings 121 5 2 2 400 1 410 531EUROFIMA loan – – – 200 – – 200 200Finance lease liabilities 75 33 33 42 28 290 426 501Finance liabilities from transport concessions 6 6 6 6 7 21 46 52Other financial liabilities 58 102 0 1 0 1 104 162
Total 2,360 2,253 2,272 2,194 2,110 10,887 19,716 22,076 thereof due to related companies 208 167 146 335 128 239 1,015 1,223
The following fair values are summarized compared with the carrying
amounts:
As of Dec 31 (€ million)
2018 2017
Carrying amount
Fair value
Carrying amount
Fair value
Interest-free loans 851 955 1,014 1,152Bonds 20,712 21,722 19,616 20,921Bank borrowings 646 647 531 532EUROFIMA loan 200 223 200 229Finance lease liabilities 562 712 501 647Financing liabilities from transport concessions 45 47 52 53Other financial liabilities 228 229 162 172
Total 23,244 24,535 22,076 23,706
The differences between the carrying amounts and the fair values of the
financial debt are due to the usually changed market interest rates for
financial debt with a comparable risk profile. In view of the short matur
ities involved and also in view of the fact that interest charged is closely
linked to market rates, there are no significant differences between the
carrying amounts and the fair values of other financial liabilities.
Interestfree loans are attributable almost exclusively to financing
provided by the Federal Government for capital expenditures in
expanding and replacing track infrastructure. This is based on the
responsibility for the transport needs of the public which is anchored in
section 87e (4) of the Basic Law (Grundgesetz; GG) and specified in the
Federal Rail Infrastructure Extension Act (Bundesschienenwegeaus
bau gesetz; BSWAG).
The arrangements for repaying the loans are detailed in individual and
collective financing agreements. In general, the loans are repaid in equal
annual installments, which are based on the corresponding annual depre
ciation applicable for the financed assets.
Interestfree loans have developed as follows:
(€ million) 2018 2017
As of Jan 1 1,014 1,172Redemption –204 –206Reclassifications – –Compounding 41 48
As of Dec 31 851 1,014
The issued bonds consist of the following transactions:
Deutsche Bahn Group 2018 Integrated Report
214

Bonds as of Dec 31 (€ million)Issue
volume Issue
currency
Residual maturity
(years)
Effective interest rate
(%)
2018 2017
Carrying amount Fair value
Carrying amount Fair value
UNLI STED B OND S
DB Finance 973AUD, JPY,
EUR 0.8 – 13.8 931 994 731 784
931 994 731 784
LI STED B OND S OF DB FINAN CE
Bond 2003 – 2018 1,000 EUR 0.0 5.000 – – 1,000 1,010Bond 2004 – 2018 300 EUR 0.0 4.850 – – 300 303Bond 2006 – 2018 300 EUR 0.0 4.510 – – 300 303Bond 2007 – 2019 600 EUR 0.6 5.110 600 617 599 649Bond 2009 – 2019 1,000 EUR 0.2 4.923 1,000 1,009 999 1,061Bond 2009 – 2021 600 EUR 2.7 4.445 599 669 599 697Bond 2010 – 2020 500 EUR 1.4 3.572 500 526 499 545Bond 2010 – 2025 500 EUR 6.5 3.870 497 597 496 618Bond 2010 – 2020 410 JPY 1.8 1.150 374 381 349 358Bond 2010 – 2022 500 EUR 3.8 3.464 498 562 498 578Bond 2010 – 2020 567 CHF 1.4 1.924 664 686 638 675Bond 2011 – 2021 700 EUR 2.4 3.797 699 765 699 791Bond 2012 – 2022 496 GBP 3.5 2.821 446 468 449 482Bond 2012 – 2023 400 EUR 4.1 2.116 398 431 398 436Bond 2012 – 2024 83 CHF 5.1 1.586 88 96 85 93Bond 2012 – 2024 500 EUR 5.2 3.119 497 567 497 580Bond 2012 – 2072 75 GBP 53.9 4.524 67 105 67 110Bond 2013 – 2018 300 EUR 0.0 FRN – – 300 300Bond 2013 – 2028 50 EUR 9.1 2.707 50 58 50 58Bond 2013 – 2025 202 NOK 6.2 4.017 151 166 152 172Bond 2013 – 2023 386 CHF 4.6 1.425 421 452 405 439Bond 2013 – 2026 497 GBP 7.6 3.351 468 518 471 534Bond 2013 – 2023 500 EUR 4.7 2.578 498 553 498 560Bond 2013 – 2020 300 EUR 1.8 1.899 299 311 298 316Bond 2013 – 2019 186 USD 0.2 FRN 218 218 208 208Bond 2014 – 2024 59 AUD 5.1 5.395 55 61 59 64Bond 2014 – 2021 142 SEK 2.1 2.940 122 128 127 135Bond 2014 – 2021 40 SEK 2.1 FRN 34 34 36 36Bond 2014 – 2019 73 SGD 0.1 2.338 80 80 78 78Bond 2014 – 2024 246 CHF 5.7 1.522 266 290 256 282Bond 2014 – 2029 500 EUR 10.2 2.886 494 581 493 588Bond 2014 – 2020 300 EUR 1.6 FRN 300 301 300 302Bond 2014 – 2022 300 EUR 3.7 FRN 300 302 300 304Bond 2014 – 2022 300 EUR 3.1 FRN 300 302 300 303Bond 2015 – 2023 600 EUR 4.8 FRN 599 605 599 610Bond 2015 – 2025 600 EUR 6.8 1.391 595 628 594 630Bond 2015 – 2030 366 NOK 11.8 2.760 341 344 345 350Bond 2015 – 2025 115 AUD 6.8 3.864 110 117 116 120Bond 2015 – 2030 650 EUR 11.8 1.707 644 678 644 685Bond 2015 – 2025 161 CHF 6.9 0.143 155 155 149 150Bond 2016 – 2026 500 EUR 7.2 0.880 496 503 495 509Bond 2016 – 2031 750 EUR 12.5 0.964 742 709 742 713Bond 2016 – 2021 350 EUR 2.5 0.040 350 350 350 349Bond 2016 – 2028 500 EUR 9.7 0.765 493 487 493 487Bond 2016 – 2024 41 HKD 5.2 2.100 39 37 37 36Bond 2017 – 2032 79 NOK 13.1 2.514 70 68 71 71Bond 2017 – 2032 500 EUR 13.9 1.541 497 504 497 510Bond 2017 – 2025 341 GBP 6.5 1.437 334 328 337 335Bond 2017 – 2032 55 SEK 13.6 2.226 52 51 54 52Bond 2017 – 2030 261 CHF 11.9 0.463 266 262 256 257Bond 2017 – 2024 300 EUR 5.9 FRN 303 301 303 305Bond 2018 – 2027 1,000 EUR 9.0 1.086 993 1,013 – –Bond 2018 – 2033 750 EUR 14.6 1.680 745 765 – –Bond 2018 – 2028 346 CHF 9.6 0.470 356 359 – –Bond 2018 – 2031 500 EUR 12.2 1.508 493 505 – –Bond 2018 – 2043 125 EUR 24.9 1.867 125 125 – –
Total 19,781 20,728 18,885 20,137
Total amount bonds 20,712 21,722 19,616 20,921
FIN
AN
CIA
L S
TA
TE
ME
NT
S
215
CONSOLIDATED FINANCIAL STATEMENTS — NOTES TO ThE CONSOLIDATED FINANCIAL STATEMENTS
SU
ST
AIN
AB
ILIT
Y

In the year under review, one fixedincome listed bond of Deutsche Bahn
Finance GmbH (DB Finance) for € 1,600 million (issued in three tranches:
€ 1,000 million and two issues of € 300 million) and a variableinterest
listed bond for € 300 million were repaid on schedule.
DB Finance also issued six bonds and topped up an existing bond.
The transactions had a total value of € 2,948 million. They comprised five
fixedincome listed bonds of € 1,000 million, € 750 million, CHF 400 mil
lion (€ 346 million), € 500 million and € 125 million as well as one fixed
income unlisted bond for AUD 206 million (€ 133 million). One fixedin
come unlisted bond was topped up by AUD 150 million (€ 94 million).
Bank borrowings are detailed in the following table:
Bank borrowings as of Dec 31 (€ million) Currency
Residual maturity
(years)
Nominal interest rate
(%)
2018 2017
Carrying amount Fair value
Carrying amount Fair value
Bank loan 2002 – 2022 EUR 3.7 FRN 200 200 200 200Bank loan 2003 – 2022 EUR 3.7 FRN 200 200 200 200Other 246 247 131 132
Total 646 647 531 532
The increase in other bank borrowings is mainly attributable to an in
crease in shortterm collateral (€ 114 million; previous year; € 61 million)
resulting from collateral agreements within the framework of derivative
transactions.
Liabilities are not secured in DB Group in principle.
As of December 31, 2018, guaranteed credit facilities with a total
volume of € 4,561 million (as of December 31, 2017: € 4,292 million) were
available to DB Group. Of this figure, € 2,080 million (as of December 31,
2017: € 2,080 million) was attributable to backup lines for the € 2.0 billion
commercial paper program of DB AG and DB Finance. None of these
backup lines had been drawn down as of December 31, 2018. Global
credit facilities totaling € 2,481 million (as of December 31, 2017: € 2,212
million) are used for working capital and surety for payment financing
of subsidiaries with worldwide operations, primarily in the segments
DB Schenker and DB Arriva.
The liabilities due to EUROFIMA are detailed in the following:
Liabilities due to EUROFIMA as of Dec 31 (€ million) Currency
Residual maturity
(years)
Nominal interest rate
(%)
2018 2017
Carrying amount Fair value
Carrying amount Fair value
Loan 2010 – 2021 EUR 2.8 4.050 200 223 200 229
Total 200 223 200 229
No new EUROFIMA loans were raised. The liabilities due to EUROFIMA are
secured by way of transfer of ownership of rolling stock in view of the
statutes of EUROFIMA.
Of the figure shown for liabilities from finance leases, € 19 million (as
of December 31, 2017: € 22 million) related to a real estate lease for a
concourse building of DB Station&Service AG.
The mobile asset lease for rail cars was repaid on schedule at the end of
the year under review. These agreements have been concluded mainly
as saleandleaseback transactions for achieving advantageous financing
conditions with German lessors.
The following table provides information concerning the main
finance leases:
As of Dec 31 (€ million)Nominal
volume Currency
Residual maturity
(years)
Nominal interest rate
(%)
2018 2017
Carrying amount Fair value
Carrying amount Fair value
FINAN CE LE A SE S MOBILE A S SET S
Diesel rail cars for regional transport (2009) 55 EUR 0.0 8.34 0 0 44 47
0 0 44 47
FINAN CE LE A SE S R E AL E STATE
Concourse buildings (1998) 254 EUR 3.0 5.550 19 21 22 24
19 21 22 24
Other 543 691 435 576
Total 562 712 501 647
The finance lease agreement for the concourse building of DB Station &
Service AG has a remaining term of three years, and cannot be termi
nated during the fixed lease. At the end of the lease, the lessee is able
to buy the assets for a fixed price. If this option is not exercised, the
lease is extended for a second period, at the end of which the lessor has
a put option for the property with regard to DB Station&Service AG.
In addition, liabilities attributable to finance leases (Note (13) µ202 ff.) are secured by rights of the lessors in relation to the leased assets. The
leased assets have a carrying amount of € 582 million (as of December 31,
2017: € 550 million).
The position Other comprises numerous Europewide leases for
buses and trains at DB Arriva and the carrying amount of a power pro
curement agreement of DB Energie GmbH worth € 58 million (as of
December 31, 2017: € 67 million) as well as the carrying amount of an
Deutsche Bahn Group 2018 Integrated Report
216

inverter agreement of DB Energie GmbH in the amount of € 28 million (as
of December 31, 2017: € 32 million). Both agreements are classified as
embedded financial leases as a result of the fact that the power is pro
cured primarily by DB Energie GmbH and also in view of the underlying
agreement duration in accordance with IFRIC 4 in conjunction with IAS 17.
The increase in the item Other is attributable to the acquisition of
finance leases for buses in the amount of € 51 million as a result of the
purchase of VTArriva as well as a contract prolongation ahead of schedule
(€ 41 million) and also a reclassification within the framework of a contract
prolongation (€ 38 million) for two existing properties. On the other hand,
the financing volume declined due to scheduled repayments.
In the subsequent years, the following payments have to be made
in connection with finance leases:
Liabilities from finance leases (€ million)
Residual maturity
TotalLess than
1 year 1 to 2 years 2 to 3 years 3 to 4 years 4 to 5 yearsMore than
5 yearsTotal more than 1 year
A S OF DEC 31 , 201 8
Minimum lease payments (nominal) 63 61 75 50 54 497 737 800Less future interest charges 19 18 16 14 13 158 219 238
Total 44 43 59 36 41 339 518 562
A S OF DEC 31 , 201 7
Minimum lease payments (nominal) 96 50 48 56 40 450 644 740Less future interest charges 21 17 15 14 12 160 218 239
Total 75 33 33 42 28 290 426 501
The finance liabilities from transport concessions in accordance with
IFRIC 12 are detailed in the following:
Finance liabilities from transport concessions as of Dec 31 (€ million) Currency
Residual maturity
(years)
Nominalinterest rate
(%)
2018 2017
Carrying amount Fair value
Carrying amount Fair value
Freight locomotives (2016) EUR 7.0 1.06 36 38 42 43Rail cars (2016) EUR 7.0 1.06 9 9 10 10
Total 45 47 52 53
In order to enable the company to meet its obligations with regard to
providing regional rail passenger transport services in the SchleswigHol
stein network, various locomotives and rail cars were leased by the rele
vant contracting organization over the entire term of the transport con
tract of nine years. The finance liabilities from transport concessions are
opposed by receivables from transport concessions (Note (19) µ207 ff.).
The fair values of the noncurrent financial debt are allocated to the
following valuation categories:
As of Dec 31 (€ million)
2018 2017
Level 1 Level 2 Level 3 Total Level 1 Level 2 Level 3 Total
NON - CUR R ENT FINAN CIAL DEBT
Interest-free loans – 781 – 781 – 952 – 952Bonds 2,642 17,095 – 19,737 1,902 17,104 – 19,006Bank borrowings – 407 – 407 – 411 – 411EUROFIMA loan – 223 – 223 – 229 – 229Finance lease liabilities – 668 – 668 – 572 – 572Finance liabilities from transport concessions – 41 – 41 – 47 – 47Other financial liabilities – 33 – 33 – 114 – 114
Total 2,642 19,248 – 21,890 1,902 19,429 – 21,331
The interestfree loans shown at amortized cost are established by dis
counting the nominal values of the interestfree loans broken down into
maturity buckets using the DB interest curve (market interest curve plus
current DB spread; source: Thomson Reuters or Bloomberg) and a term
until 2024.
Market prices from an active market, multiplied by the foreign cur
rency rates applicable on the balance sheet date, are used for bonds of
DB Finance which are classified as level 1. Various sources are used for
these prices, including Thomson Reuters and Bloomberg. The bonds for
which the market activity does not comply with the requirements of an
active market have been allocated to level 2. For establishing the market
prices of these bonds, binding offers were used from various sources,
including Thomson Reuters and Bloomberg; these have been verified on
the basis of the valuation models using the parameters which are observ
able on the market, such as interest rate curves and exchange rates.
Theoretical refinancing via bonds of DB Finance are assumed for
assessing the market value of outstanding EUROFIMA loans. A dis
counted cash flow method is used for calculation purposes. The refer
ence interest rate which is used is established by interpolation of the
yields for matching maturities of bonds of DB Finance.
FIN
AN
CIA
L S
TA
TE
ME
NT
S
217
CONSOLIDATED FINANCIAL STATEMENTS — NOTES TO ThE CONSOLIDATED FINANCIAL STATEMENTS
SU
ST
AIN
AB
ILIT
Y

The fair value of the finance leases as well as finance liabilities from
transport concessions is calculated by discounting the outstanding
leasing payments using the DB interest curve (market interest curve plus
current DB spread; source: Thomson Reuters or Bloomberg).
(29) Other liabilitiesLiabilities are normally recognized in accordance with IFRS 9 with their
nominal amount, which corresponds to the fair value at the point at
which the liability is initially recognized and the amortized costs of pur-
chase up to the date at which the liability is settled, where applicable
less transaction costs. Subsequently, non-current liabilities are stated
using amortized costs of purchase using the effective interest method.
The differences between the amount paid out less transaction costs and
the amount repaid are recognized in the income statement over the life
of the liability.
The fair values of the balance sheet items other liabilities, trade lia-
bilities and other liabilities essentially correspond to the carrying amounts.
Severance package obligations for agreements agreed as of the bal-
ance sheet date are recognized as other liabilities and – if they are not yet
included in individual agreements and if they are part of a restructuring
obligation in accordance with IAS 37 – are stated as other provisions.
Movements in other liabilities are shown in the following:
(€ million)
Residual maturity
TotalUp to 1 year 1 to 2 years 2 to 3 years 3 to 4 years 4 to 5 yearsMore than
5 yearsTotal more than 1 year
A S OF DEC 31 , 201 8
Trade liabilities including received prepayments 5,491 116 14 15 9 13 167 5,658Miscellaneous other liabilities 3,660 10 7 7 6 61 91 3,751
Total 9,151 126 21 22 15 74 258 9,409 thereof non-financial liabilities 2,306 24 2 1 2 11 40 2,346 thereof received prepayments 219 24 2 1 2 11 40 259 thereof due to related parties 323 0 0 0 0 0 0 323
A S OF DEC 31 , 201 7
Trade liabilities including received prepayments 5,157 59 57 13 10 20 159 5,316Miscellaneous other liabilities 3,399 13 9 6 7 39 74 3,473
Total 8,556 72 66 19 17 59 233 8,789 thereof non-financial liabilities 1,998 30 24 2 1 12 69 2,067 thereof received prepayments 177 30 24 2 1 12 69 246 thereof due to related parties 222 0 0 0 0 0 0 222
Nonfinancial liabilities and received prepayments are not classified under
any category of IFRS 9.
The miscellaneous other liabilities comprise the following:
As of Dec 31 (€ million) 2018 2017
PER S ONNEL- R EL ATED LIABILITIE S
Unused holiday entitlements 368 339Outstanding overtime 279 248Social security 118 115Severance payments 25 25Christmas bonuses 8 6Holiday pay 24 17Other personnel obligations 889 741OTHER TA XE S
Value-added tax 97 56Payroll and church taxes, solidarity surcharge 139 148Miscellaneous other taxes 140 125
Interest payable 206 257Revenue reductions 62 114Deferred construction grants 277 185Liabilities due to Railway Crossings Act 3 2Reconveyance obligations 4 4Miscellaneous other liabilities 1,112 1,091
Total 3,751 3,473
The other personnel obligations also include bonus obligations.
As of December 31, 2018, other liabilities were secured in an amount
of € 0 million (as of December 31, 2017: € 0 million).
The miscellaneous other liabilities include existing risks for factoring
agreements.
(30) Income tax liabilitiesThe income tax liabilities as of December 31, 2018 related mainly to obli
gations to the fiscal authorities in Great Britain, the USA and Germany.
Deutsche Bahn Group 2018 Integrated Report
218

(31) Additional disclosures relating to the financial instrumentsIf covered by the scope of IFRS 9, the financial assets and liabilities are
categorized and measured in accordance with IFRS 9. Financial assets
and liabilities which are not covered by the scope of IFRS 9 are measured
in accordance with the relevant standards and not categorized under any
measurement category according to IFRS 9.
The carrying amounts as well as the net result per valuation cate-
gory of IFRS 9 are shown in the following. The fair values and the details
of individual classes of financial instruments are shown within the notes
to the respective balance sheet items.
In DB Group, financial assets which are allocated to a valuation cat-
egory according to IFRS 9 mainly comprise trade receivables and cash
and cash equivalents.
In DB Group, financial liabilities which are allocated to a valuation
category according to IFRS 9 mainly comprise interest-free loans, bonds,
EUROFIMA loans, bank borrowings, trade payables and other liabilities.
a) Classification of financial assets Due to first-time adoption of IFRS 9 µ188, the number of categories
previously applicable under IAS 39 has been reduced from four to three.
The previous category “Available for sale” has been transferred to the
category “Fair value through profit or loss” (€ 24 million) and the cate-
gory “Fair value through other comprehensive income” (€ 14 million).
The reclassification has not had any impact on results. A distinction is
still made as to whether the valuation effects from other comprehensive
income are reclassified to the income statement or remain in share-
holders’ equity.
Fair value (through
profit or loss)
Fair value (through
other com-prehensive
income)
Amortized cost of
purchase
Financial assets as of December 31, 2017 5 2 9,333Reclassification of other investments +24 +14 –38Reclassification of receivables earmarked for factoring + 353 – –353
Financial assets as of Jan 1, 2018 382 16 8,942
The valuation categories of IFRS 9 are set out in the following:
Since the year under review, and following the first-time adoption of IFRS
9 in DB Group, other participations have been measured at fair value and
not, as previously, classified under the category “Available for sale.”
There have also been changes in relation to trade receivables which
are sold on within the framework of factoring agreements and which
have previously been classified under the category “At amortized cost
of purchase”; these have now been classified under the category “Fair
value through profit or loss.”
The net result according to valuation categories in particular in-
cludes interest income of € 18 million (previous year: € 34 million) as well
as interest expenses of € 516 million (previous year: € 595 million) relating
to the financial assets and liabilities which are not measured at fair value
through profit or loss.
b) Hedge accountingWith regard to the recognition of hedges, there have been additions in
the field of designation possibilities as well as a closer link between
hedge accounting and risk management. There is also the need to imple-
ment extended accounting and measurement logic. In DB Group, this is
relevant particularly for a differentiated treatment of the currency basis
spreads which, under IFRS 9, will not be an element of the underlying of
a hedge. Any resultant ineffectiveness is, where necessary, recognized
in the income statement. With IFRS 9, the quantitative limits for the
effectiveness test are no longer applicable.
(€ million)
Fair value through profit or loss
Fair value through other comprehensive incomeDerivatives
in hedgesAt amortized
cost of purchaseNot covered
by scope of IFRS 7 Totalwith recycling without recycling
2018 2017 2018 2017 2018 2017 2018 2017 2018 2017 2018 2017 2018 2017
C AR RYING AMO UNT A S OF DEC 31
Non-current financial assets 17 0 1 2 28 – 215 160 295 282 85 58 641 502Current financial assets 598 358 1 0 – – 44 14 9,207 8,698 600 538 10,450 9,608Non-current financial liabilities 35 40 – – – – 337 301 20,326 19,454 558 495 21,256 20,290Current financial liabilities 6 4 – – – – 13 37 9,419 8,843 2,355 2,073 11,793 10,957
Net result –1 6 – – – – – – 30 20 – 531 – 632 – 502 – 606
FIN
AN
CIA
L S
TA
TE
ME
NT
S
219
CONSOLIDATED FINANCIAL STATEMENTS — NOTES TO THE CONSOLIDATED FINANCIAL STATEMENTS
SU
ST
AIN
AB
ILIT
Y

(32) Pension obligationsDB Group grants post-employment benefits to its employees in numerous
countries. The form of the pension commitments depends on the legal,
economic and tax conditions applicable in the particular country.
In DB Group, there are defined benefit as well as defined contribution
retirement pension schemes. The defined benefit commitments are
accounted for in accordance with IAS 19. Major pension obligations exist
only in Germany and in Great Britain. For this reason, only these pension
obligations are described in greater detail in the following.
GermanyPension obligations of DB Group in Germany comprise pension obliga-
tions for civil servants and also for employees.
After they retire, civil servants assigned to the companies of DB Group
receive pensions from the BEV under the Civil Servants Benefits Act
(Be amten versorgungsgesetz).
Only while the assigned civil servants are actively working for
DB Group are payments made to the Federal Railroad Fund as part of a
pro forma settlement in the same way as for newly recruited employees
(section 21 (1) DBGrG). This also includes theoretical amounts for contri-
butions to statutory pension insurance schemes as well as theoretical
costs in accordance with the collective bargaining agreement regarding
the additional company pension scheme for employees of DB AG (Tarif-
vertrag über die betriebliche Zusatzversorgung für die Arbeitnehmer der
DB AG; ZVersTV). The payments made to the Federal Railroad Fund for
retirement pensions and supplementary benefits of civil servants are
defined contribution retirement schemes.
The pension obligations with regard to employees mainly relate to
the following:
a) Employees who were employed by DB AG before the company was
established (January 1, 1994) enjoy supplementary benefits in view of
their former membership of the public sector. The employees are entitled
to benefits from this additional pension insurance from German Pension
Fund Knappschaft-Bahn-See (KBS). As an official authority, KBS has not
only assumed responsibility for managing and paying the statutory pen-
sion for DB Group employees; it also continues the additional pension
insurance for the transferred employees who are beneficiaries.
The Federal Railroad Fund bears the costs of these additional bene-
fits, less the contribution made by the employees themselves (section 14
(2) DBGrG). Accordingly, DB AG does not set aside any provisions for these
public sector benefits.
b) Employees of the former Deutsche Reichsbahn and the employees
who have been recruited after January 1, 1994 receive an additional
company pension from DB AG within the framework of the ZVersTV. This
supplementary company pension is a defined benefit scheme, which is
linked to salary and length of service. The current pension benefits are
adjusted every year in line with the regulations of the Company Pensions
Act (Betriebsrentengesetz). Retirement benefits, invalidity benefits and
benefits to surviving dependants are provided in the form of a lifetime
pension. No plan assets are created for this scheme.
c) Various defined benefit pension obligations exist with regard to senior
executives in DB Group who were granted a senior executive commitment
before January 1, 2007. The extent of the benefits depend on the length
of service and the salary of the beneficiary. In general, retirement bene-
fits, invalidity benefits and benefits to surviving dependants are provided
in the form of a lifetime pension. Apart from a small number of reinsur-
ance policies, there are no plan assets.
d) Senior executives of DB Group who were granted a senior execu-
tive commitment after December 31, 2006, are provided with a retirement
benefit scheme in the form of a defined contribution commitment. For
this purpose, a benefit module is calculated in each year of service,
depending on the salary and age of the beneficiary. These benefits are
financed by way of a contractual trust arrangement (CTA), namely Deut-
sche Bahn Pension Trust e.V. The extent of the benefits depends on the
yield of the CTA, whereby a minimum return is guaranteed. To avoid
longevity risks, the benefits are granted in the form of a five-year install-
ment. The assets of the CTA are classified as plan assets. The pension
obligation is covered by the plan assets on the assumption that the CTA
produces a corresponding performance, thus minimizing investment
risks. There are no legal or regulatory obligations requiring Deutsche
Bahn Pension Trust e.V. to make minimum payments into the scheme.
The contributions are invested in line with the fundamental assumption
that the benefit commitment is guaranteed by a corresponding guar-
antee element. For each payment relating to the individual beneficiary,
an age-related amount is invested in prime zero bonds. The investment
amount remaining after the payment has been made into the guarantee
element is mainly invested in passively managed European equity and
bond funds (or equivalent products) with the aim of optimizing returns.
e) Senior executives are able to participate in a deferred compen-
sation program. This employee-financed form of company pension
scheme constitutes a defined benefit obligation.
Great Britain a) The company pension scheme of DB Cargo (UK) Holdings Limited is
essentially a defined benefit pension scheme (linked to salary and length
of service) within the British Railway Pension Scheme. The plan assets
are managed by an independent trustee. The process of collating the
data of members in the plan for the purpose of compliance with legal
requirements in relation to the members of the plan is generally carried
out every three years, most recently as of December 31, 2016. As of the
intermediate valuation dates, the obligations in the plan are measured
on the basis of the correspondingly updated data. The pension scheme
is based on final salary, and lifetime pensions are provided as benefits.
The pension obligations are essentially covered by plan assets. Capital
is invested by the trustee of the plan assets following liaison with
DB Group.
Deutsche Bahn Group 2018 Integrated Report
220

b) At DB Arriva, there are mainly defined benefit retirement benefit com-
mitments. Important defined benefit plans (related to salary and length
of service) relate to employees of DB Arriva within the Railway Pension
Scheme in Great Britain. These are sections other than the DB Cargo UK
scheme within the railway pension scheme. The costs of the pension
schemes are shared between the employer and the employee in the ratio
60:40 and accordingly recognized in the balance sheet. The pension
schemes are based on final salary, and lifetime pensions are provided as
benefits. The corresponding pension obligations are to a large extent
covered by fund assets. Capital is invested by the trustee of the plan
assets following liaison with DB Group.
Some companies pay contributions within the framework of a fran-
chise agreement to the British Railway Pension Scheme for employees
employed for the duration of the agreement (franchise period). The obli-
gations to these employees as well as the plan assets are completely
disclosed after deduction of the element financed by the employees
(40%). Within the framework of recognizing the effect of franchise agree-
ments, the present value of the contributions payable for the duration
of the franchise agreements for reducing a scheme deficit remains as a
net liability recognized in the balance sheet. The current contributions
to the benefit scheme are shown as personnel expenses.
In addition, individual companies of DB Arriva also issued defined
contribution retirement benefit commitments to their employees. Under
such arrangements, the employer does not enter into any obligations
apart from paying contributions to an external benefit scheme. The
extent of the future pension benefits depends exclusively on the amount
of contributions paid to the external benefit scheme, including the
income generated by investing these contributions.
In addition, some contributions have also been paid to social pension
funds within the context of statutory regulations (government schemes).
Critical assessments and appraisalsIn the case of the defined benefit pension obligations in Germany and
abroad, the actuarial risks are borne by DB Group. Actuarial methods
have been used for measuring defined benefit pension commitments as
well as benefit commitments which are similar to pensions and the resul-
tant expenses and income. The valuations are based on actuarial as -
sump tions. There are the following actuarial risks which are considered
to be typical for companies with defined benefit schemes.
◊ Interest risk: The discount factors which are used reflect the interest
rates (giving due consideration to the duration of the underlying
obligation) which are achieved on the balance sheet date for high-
quality fixed-income bonds with a corresponding term. A change in
the discount rate results in a change in the present value of the total
obligation (DBO).
◊ Inflation risk: Part of the pension obligations, particularly as a result
of adjustments to current pensions, is linked to the development of
inflation.
◊ Longevity risk: A longevity risk may occur in the form of extended
periods in which pensions are paid out as a result of an increase in
life expectancy in future.
◊ Investment risk: In the case of externally financed pension plans, the
values of the corresponding plan assets or the refund claims are based
on the market values as of the balance sheet date. The capital invest-
ment is exposed to numerous risks, which may have an impact on the
present value recognized for the plan assets. In the case of pension
schemes with an obligation to pay into the scheme, the amount of
future contributions may be affected by the investment risk.
Key assumptions for expenses and income attributable to pension com-
mitments and benefit commitments similar to pensions are to some extent
based on current market conditions. Expenses and income relating to
pension commitments and benefit commitments similar to pensions may
change as a result of changes to these underlying key assumptions.
The figures stated for pension provisions in the balance sheet are
detailed in the following:
As of Dec 31 (€ million)
GemanyEurope
(excluding Germany) Rest of world Total
2018 2017 2018 2017 2018 2017 2018 2017
Funded obligations 307 268 6,262 6,932 57 54 6,626 7,254Unfunded obligations 3,691 3,008 309 269 9 7 4,009 3,284
Total obligations 3,998 3,276 6,571 7,201 66 61 10,635 10,538Fair value of plan assets –225 –200 – 4,505 – 5,060 –36 –38 – 4,766 – 5,298Effects due to cost sharing – – – 422 – 526 – – – 422 – 526Effects due to franchise agreements – – – 625 –779 – – – 625 –779Amount not recognized as an asset as a result of the restriction of IAS 19.58 – – 0 0 – – 0 –Assets recognized in the balance sheet as pension assets – – 1 5 – – 1 5Net obligations recognized in the balance sheet 3,773 3,076 1,020 841 30 23 4,823 3,940
FIN
AN
CIA
L S
TA
TE
ME
NT
S
221
CONSOLIDATED FINANCIAL STATEMENTS — NOTES TO THE CONSOLIDATED FINANCIAL STATEMENTS
SU
ST
AIN
AB
ILIT
Y

(€ million)
GermanyEurope
(excluding Germany) Rest of world Total
2018 2017 2018 2017 2018 2017 2018 2017
Obligations as of Jan 1 3,276 3,717 7,201 7,162 61 78 10,538 10,957Service cost, excluding employee contributions 110 126 70 84 3 3 183 213Employee contributions 2 2 45 47 0 0 47 49Interest expense 78 59 126 113 1 1 205 173Payments – 81 –74 –232 –185 – 4 –3 –317 –262 thereof pensions – 80 –74 –203 –185 – 4 –3 –287 –262 thereof payments for settlements –1 – –29 – – – –30 –Past service costs and profit or losses from settlements 9 1 –2 –2 0 0 7 –1Transfers 3 6 – 636 6 – 1 – 633 13Changes in scope of consolidation – – – – – – – –Actuarial gains (-) or losses (+) 601 – 561 50 232 6 –14 657 –343Revaluations based on experience –14 – 47 262 128 0 – 9 248 72 Due to change in demographic assumptions 28 –1 3 – 95 0 – 31 – 96 Due to change in financial assumptions 587 – 513 –215 199 6 – 5 378 –319 Effects from changes in exchange rates – – – 51 –256 –1 – 5 – 52 –261
Obligations as of Dec 31 3,998 3,276 6,571 7,201 66 61 10,635 10,538
The figures shown under transfers in the preceding and following tables
mainly relate to disposals following the loss of a franchise agreement
(Arriva Trains Wales).
The development of the plan assets is detailed in the following:
(€ million)
GermanyEurope
(excluding Germany) Rest of world Total
2018 2017 2018 2017 2018 2017 2018 2017
Fair value of plan assets as of Jan 1 200 191 5,060 4,791 38 41 5,298 5,023Employer contributions 22 20 103 113 1 2 126 135Employee contributions 2 0 44 47 0 0 46 47Expected return from plan assets 5 3 107 92 1 0 113 95Payments – 5 – 5 –218 –173 – 4 –3 –227 –181 thereof pensions – 5 – 5 –189 –173 – 4 –3 –198 –181 thereof payments for settlements – – –29 – – – –29 –Transfers 0 1 –387 4 – – –387 5Revaluation 1 –10 –162 377 1 1 –160 368Administration costs: costs of pension assurance – – –10 –13 0 0 –10 –13Effects from changes in exchange rates – – –32 –178 –1 –3 –33 –181
Fair value of plan assets as of Dec 31 225 200 4,505 5,060 36 38 4,766 5,298
The reported plan assets are broken down as follows:
As of Dec 31 (€ million)
GermanyEurope
(excluding Germany) Rest of world Total
2018 2017 2018 2017 2018 2017 2018 2017
Stocks and other securities 7 6 3,047 3,606 13 15 3,067 3,627 thereof with market price listing 7 6 3,047 3,606 13 15 3,067 3,627Interest-bearing securities 138 113 802 823 18 19 958 955 thereof with market price listing 138 113 802 823 18 19 958 955Reinsurance 79 80 73 23 – – 152 103 thereof with market price listing 79 80 16 1 – – 95 81 thereof without market price listing – – 57 22 – – 57 22Private equity – – 329 337 – – 329 337 thereof without market price listing – – 329 337 – – 329 337Investments in infrastructure – – 152 181 – – 152 181 thereof with market price listing – – 116 110 – – 116 110 thereof without market price listing – – 36 71 – – 36 71Cash and other assets 1 1 102 90 5 4 108 95 thereof with market price listing 1 1 66 63 3 2 70 66 thereof without market price listing – – 36 27 2 2 38 29
225 200 4,505 5,060 36 38 4,766 5,298 thereof assets classified as pension assets 0 0 –1 – 5 0 – –1 – 5
225 200 4,504 5,055 36 38 4,765 5,293
The development of the total pension obligations is detailed in the
following:
Deutsche Bahn Group 2018 Integrated Report
222

(€ million)
GermanyEurope
(excluding Germany) Rest of world Total
2018 2017 2018 2017 2018 2017 2018 2017
Provision as of Jan 1 3,076 3,526 841 959 23 37 3,940 4,522Pension expenses 192 185 98 116 4 4 294 305 thereof service cost 110 128 71 84 3 3 184 215 thereof interest income and interest expenses 73 56 19 21 1 1 93 78 thereof administrative expenses – – 10 13 0 0 10 13 thereof past service costs and profits or losses from settlements 9 1 –2 –2 0 0 7 –1Employer contributions –22 –20 –102 –113 –2 –2 –126 –135Payments –76 – 69 –14 –12 0 0 – 90 – 81 thereof pensions –75 – 69 –14 –12 0 0 – 89 – 81 thereof payments for settlements –1 – – – – – –1 –Transfers 3 5 0 2 – 1 3 8Changes in scope of consolidation – – – – – – – –Revaluation 600 – 551 213 – 84 5 –15 818 – 650 Revaluations based on experience –14 – 47 198 66 0 – 9 184 10 Due to change in demographic assumptions 29 –1 15 –75 0 – 44 –76 Due to change in financial assumptions 587 – 513 –149 227 6 – 5 444 –291 Difference between actual income and theoretical income from plan assets –2 10 149 –302 –1 –1 146 –293Effects from changes in exchange rates – – –11 –30 0 –2 –11 –32Change in recognized assets – – – 5 3 – 0 – 5 3
Provisions as of Dec 31 3,773 3,076 1,020 841 30 23 4,823 3,940
The effects of cost splitting and franchise agreements increased by € 1
million in the year under review as a result of revaluations (previous year:
decline of € 61 million). The interest expense and expected income from
the plan assets are recorded under net interest income.
All other items are recognized under personnel expenses.
The actuarial parameters used for assessing the value of most of the
pension provision are set out in the following:
(%) 2018 2017
DI S CO UNT R ATE
Germany and abroad (excluding Great Britain) 1.70 2.40Great Britain 2.80 2.60E XPEC TED R ATE OF WAGE AND SAL ARY INCR E A SE S
Germany and abroad (excluding Great Britain) 3.10 3.10Great Britain 4.00 4.00E XPEC TED R ATE OF PEN SION INCR E A SE S (DEPENDENT ON STAFF GRO UP)
Germany and abroad (excluding Great Britain) 2.00 1.75Great Britain 2.30 2.30
The 2018 G mortality tables of Professor Dr. Klaus Heubeck (previous
year: mortality tables 2005 G) have been used for valuing the pension
obligations for the German Group companies. Country- or benefit- scheme-
specific mortality tables have been used for valuing the pension obliga-
tions of the other Group companies.
Sensitivities and additional information:
As of Dec 31 (€ million) 2018 2017
Total obligation for an interest rate increased by 1 percentage point 8,774 8,716Total obligation for an interest rate reduced by 1 percentage point 13,030 12,850Total obligation with salary growth increased by 0.5 % 10,807 10,721Total obligation for pensions increased by 0.5 % 11,318 11,201Total obligation for life expectancy increased by 1 year 10,964 10,862Total obligations 10,635 10,538 thereof active beneficiaries 5,688 5,587 thereof former employees 1,587 1,543 thereof pensioners 3,360 3,408Payments into plan assets expectedfor next year 117 118Direct pension payments for next year 104 99Duration of benefit obligation (years) 20.1 19.8
The sensitivity figures have been established using the method which
was used for calculating the extent of the obligation. One assump-
tion was modified while the other assumptions were retained, which
means that interdependencies between the individual assumptions were
dis regarded.
The development of the net pension provision is detailed in the fol-
lowing:
FIN
AN
CIA
L S
TA
TE
ME
NT
S
223
CONSOLIDATED FINANCIAL STATEMENTS — NOTES TO THE CONSOLIDATED FINANCIAL STATEMENTS
SU
ST
AIN
AB
ILIT
Y

(€ million)
Personnel-related provisions
Revenue reductions
Provisions for pending losses
Decommissioning provisions
Environmental protection provisions Other provisions Total
2018 2017 2018 2017 2018 2017 2018 2017 2018 2017 2018 2017 2018 2017
As of Jan 1 1,094 1,140 1,166 1,021 191 186 349 765 1,064 940 1,253 1,282 5,117 5,334Currency translation differences 0 –2 0 0 –2 –2 0 0 0 –1 –2 – 6 – 4 –11Changes in scope of consolidation 0 0 0 0 0 0 – – – – 0 0 0 0 thereof additions 0 0 – – – – – – – – 0 0 0 0 thereof disposals 0 0 0 0 0 0 – – – – 0 0 0 0Amounts used –290 –325 –223 –235 –78 – 65 – 41 – 429 – 51 – 48 –240 –242 – 923 –1,344Reversals – 89 –148 –138 –129 –39 –31 0 – 8 0 0 –256 –160 – 522 – 476Reclassifications – 5 – 8 1 4 0 0 – – – – –2 2 – 6 –2Additions 287 436 492 505 324 103 1 4 0 170 285 379 1,389 1,597Compounding and discounting 1 1 – – 0 0 17 17 –3 3 2 –2 17 19
As of Dec 31 998 1,094 1,298 1,166 396 191 326 349 1,010 1,064 1,040 1,253 5,068 5,117
(33) Other provisionsOther provisions are set aside if there is a legal or constructive obligation
resulting from a past event which is more than 50% likely to result in an
outflow of resources and if the extent of the obligation can be reliably
estimated (IAS 37 – Provisions, Contingent Liabilities and Contingent
Assets).
Non-current provisions are discounted using market interest rates.
Environmental protection provisions for the remediation of existing eco-
logical burdens are discounted on the basis of real interest rates, which
are adjusted to reflect the risk and the period until fulfillment. The dif-
ference between the nominal value of the expected outflows and the
present value recognized for the environmental protection provisions of
DB AG for transferred liabilities for the remediation of ecological burdens
from the time previous to the foundation of DB AG is stated under
deferred items, and represents the interest benefit resulting from the
longer-term release of the provision. The cumulative interest expense
attributable to other provisions is recognized in financial result. Provi-
sions for potential losses are measured as the lower of the amount of the
expected costs for fulfilling the contract and the expected costs for ter-
minating the contract.
Critical assessments and appraisalsThe process of determining all types of provisions is associated with
estimates regarding the extent and/or timing of obligations.
The environmental protection provisions relate primarily to the obli-
gation of DB AG to remedy the ecological burdens which arose before
January 1, 1994 on the land of Deutsche Bundesbahn and the former
Deutsche Reichsbahn. Ecological burdens are defined as contamination
of soil and groundwater which requires rehabilitation and which pose
risks, considerable disadvantages or considerable problems for private
individuals or society at large. The legal basis for defining rehabilitation
obligations are summarized in the soil and water laws of the Federal
Government and the Federal states of Germany. The process of dealing
with ecological burdens also comprises necessary rehabilitation mea-
sures for existing sewers, in order to avoid soil and groundwater contam-
ination caused by leaks from the sewer system, as well as measures for
shutting down old landfill sites.
The provision has been calculated on the basis of a discounting
method using the present value, where rehabilitation measures are prob-
able, the rehabilitation costs can be reliably estimated and no future
benefit is expected to be derived from these measures.
The estimation of future rehabilitation costs is subject to various
factors. Major drivers in this respect can be the application of innovative
rehabilitation measures, changes in legal conditions and also the devel-
opment in market prices for disposing of the high volumes of hazardous
waste.
In order to make a realistic assessment of the rehabilitation costs in
individual cases, the working programs have included adjustments to
cost estimates as a result of greater knowledge and official agreements
in the successive processing stages.
For the valuation of provisions as of the balance sheet date, the
investigation and rehabilitation obligations which are currently known
have been used as the basis for estimating the expected costs in relation
to the current price level.
The provision is discounted on the basis of expected cash outflows,
using a risk-adjusted rate of 0.74% (previous year: 0.74%). Provisions for
potential losses of pending transactions are created if a loss is probable
and can be reliably estimated. In view of the uncertainty associated with
this assessment, the actual losses may differ from the original estimates
and may thus also differ from the amount of the provision. In DB Group,
such uncertainty results particularly from the estimates of future income
from transport contracts, the associated material- and personnel-related
expenses as well as any penalty payments. Changes in the estimates of
these potential losses from pending transactions may have a consider-
able impact on the future results of operations.
Movements in other provisions are shown in the following:
Deutsche Bahn Group 2018 Integrated Report
224

The following table breaks down the other provisions into current and
non-current amounts, and also details their estimated residual maturity:
(€ million)
Residual maturity
TotalUp to 1 year 1 to 2 years 2 to 3 years 3 to 4 years 4 to 5 yearsMore than
5 yearsTotal more than 1 year
A S OF DEC 31 , 201 8
Personnel-related provisions 402 162 112 69 52 201 596 998Revenue reductions 1,298 – – – – – – 1,298Provisions for pending losses 260 37 29 26 21 23 136 396Decommissioning provisions 24 22 18 18 18 226 302 326Environmental protection provisions 57 52 54 54 54 739 953 1,010Miscellaneous other provisions 781 62 27 21 23 126 259 1,040
Total 2,822 335 240 188 168 1,315 2,246 5,068
A S OF DEC 31 , 201 7
Personnel-related provisions 472 173 119 73 53 204 622 1,094Revenue reductions 1,166 – – – – – – 1,166Provisions for pending losses 67 43 24 19 14 24 124 191Decommissioning provisions 42 23 23 22 22 217 307 349Environmental protection provisions 62 56 59 58 58 771 1,002 1,064Miscellaneous other provisions 934 111 28 20 27 133 319 1,253
Total 2,743 406 253 192 174 1,349 2,374 5,117
Personnel-related provisionsBenefits arising on the occasion of the termination of employment agree-
ments (severance packages) become payable if an employee is released
from his/her duties under the terms of an early-retirement or semi-retire-
ment scheme before reaching normal pensionable age (which would not
involve any reduction of retirement benefits) or if an employee volun-
tarily terminates his/her employment contract in return for a severance
package. Severance payments are recognized if there is a demonstrable
obligation either to terminate the employment agreements of current
employees in accordance with a detailed formal plan which cannot be
reversed or to pay severance payments if the employment contract is
voluntarily terminated by employees within the framework of employ-
ment contract termination agreements.
Severance package obligations for agreements agreed as of the bal-
ance sheet date are recognized as other liabilities and – if they are not yet
included in individual agreements and if they are part of a restructuring
obligation in accordance with IAS 37 – are stated as other provisions.
Semi-retirement agreements are based on the so-called block model.
The top-up amounts paid in addition to salary by DB Group during the
semi-retirement period as well as additional contributions to the statu-
tory pension insurance scheme are collected in installments up to the end
of the active phase of the semi-retirement period and are recognized as
provisions in accordance with IAS 19. The compensation backlog (plus
the employer’s contributions to social insurance) for the additional work
performed during the employment phase is also shown with the present
pro rata value as another non-current employee benefit.
If certain conditions are satisfied, DB Group offers its employees the
opportunity to reduce their working hours to a level below their regular
working hours (special semi-retirement arrangement). In these cases, the
number of working hours is reduced to 81% of the reference or regular
working hours, whereby the employees’ remuneration is topped up to
90%. Payments into the company pension scheme are granted on the
basis of 100% of the reference or regular working hours.
The personnel-related provisions are structured as follows:
As of Dec 31 (€ million) 2018 2017
Contractual personnel obligations 525 608Early retirement and semi-retirement obligations 228 232Service anniversary provisions 116 116Other 129 138
Total 998 1,094
The personnel-related provisions include obligations arising from em -ployment agreements which result from the entitlement of many em -
ploy ees under labor law and the willingness of DB AG not to terminate
employment contracts for operational reasons. In such cases, DB Group
will incur losses in the form of personnel expenses which will have to be
borne until the employment contract is terminated or the employee is
placed with another company; no reciprocal benefit will be provided
in return for these costs (obligation surpluses relating to employment
agreements). The contractual personnel obligations also include restruc-
turing provisions.
A figure of about € 402 million was allocated to the provision for
obligation surpluses as of December 31, 2018; this item accounts for a
considerable percentage of the personnel provisions in DB Group (as of
December 31, 2017: € 435 million). This provision recognizes the person-
nel-related obligations of DB AG for the employment guarantee included
in the collective bargaining agreement designed to address demographic
change (Demografietarifvertrag; DemografieTV).
In the DB Schenker segment, € 83 million (as of December 2017:
€ 118 million) were added for the global restructuring program Boost
(boosting profitability).
The provisions set aside to cover semi-retirement and early retire-
ment obligations cover the obligations arising from collective bargaining
agreements, and have mostly been calculated on the basis of actuarial
reports. In the regulations of the DemografieTV, this includes an amount
of € 88 million (as of December 31, 2017: € 90 million) for the entitlement
of employees with many years of service and also many years of shift
working to enjoy special semi-retirement benefits.
FIN
AN
CIA
L S
TA
TE
ME
NT
S
225
CONSOLIDATED FINANCIAL STATEMENTS — NOTES TO THE CONSOLIDATED FINANCIAL STATEMENTS
SU
ST
AIN
AB
ILIT
Y

Revenue reductionsThe items disclosed under revenue reductions include cuts in connection
with concession fees.
Provisions for pending lossesThe provisions for pending losses mainly relate to transport contracts in
which obligation surpluses build up over the life of the contracts. The
additions relate mainly to DB Arriva and DB Regional.
Decommissioning provisionsThe decommissioning provisions refer to the pro rata decommissioning
obligation in relation to a joint power station. The valuation of the pro-
vision is based on an unchanged discount rate of 5.0%.
Environmental protection provisionOf the figure stated for environmental protection provisions, € 1,003 mil-
lion (as of December 31, 2017: € 1,055 million) relate to remedial action
obligations of DB AG. In order to take account of the remedial action
obligations recognized in the environmental protection provisions, DB AG
has set up various programs, including the following programs:
◊ the 4-stage soil decontamination program
◊ the 3-stage sewerage network program
◊ the 2-stage landfill shut-down program
The structured processing ensures that the procedure for recognizing,
assessing the risk and taking appropriate remedial action is consistent
with all legal requirements and optimized in terms of costs.
In the 4-stage soil decontamination program, existing soil and/or
groundwater contamination is localized via the stages “historic explora-
tion,” “orienting investigation” and “detail investigation,” and is assessed
on the basis of the relevant statutory testing criteria. If any negative
change in soil conditions or ecological burdens is identified, implemen-
tation of the necessary remedial action is planned by the steps feasibility
study, model planning and approval planning. The process of carrying
out the remedial action is supported by a binding remedial action plan
or a public-sector agreement with defined remedial action objectives.
Stage 1 “historic exploration” has been completed.
The 3-stage sewerage network program aims to remedy any contam-
ination of soil and/or groundwater resulting from leaks. The program
also involves a plan to optimize the existing sewerage network to ensure
that it is capable of meeting future requirements and to ensure that the
need to take remedial action can be limited to this future network. The
network which is not necessary for operation will be decommissioned.
The sewerage program will be carried out via the stage 1 “recording,”
stage 2 “inspection” and stage 3 “remedial action/decommissioning.”
Legal requirements are set out in the Water Resources Accounting Act
(Wasserhaushaltsgesetz; WHG), the Water Acts of the Federal states and
the own control regulations.
The 2-stage program “shut-down of landfill sites” systematically
records all legacy landfill sites operated by DB Group (stage 1). The
requirements resulting from the Recycling Accounting Act (Kreislauf-
wirtschaftsgesetz; KrWG) and the Landfill Site Regulation (Deponiever-
ordnung; DepV) are used as the basis for planning and implementing the
processes of decommissioning and recultivating the areas (stage 2a) and
the subsequent maintenance (stage 2b).
Miscellaneous other provisionsThe miscellaneous other provisions comprise provisions for litigation
risks, decommissioning and demolition obligations, claims for damages,
real estate risks, guarantee and warranty obligations, other tax risks,
third-party obligations for maintenance, liability pensions, as well as in -
surance and project risks for numerous other issues which individually
are of minor significance.
(34) Deferred items DB Group receives various public-sector grants, which are provided in
relation to specific assets or on the basis of a specific performance. The
grants are recognized in the balance sheet as soon as it is certain that
they will be provided and as soon as the conditions necessary for receiving
the grants have been satisfied. The grants related to assets, and in par-
ticular investment grants, are deducted directly from the assets for which
the grants have been received. The interest benefit (difference between
nominal value and present value) of interest-free loans is deferred on the
basis of the contractual grant conditions. The income from pro rata
reversal of these accruals is shown as other operating income.
Deferred profits from sale-and-lease-back agreementsIf capital gains are realized in conjunction with sale-and-lease-back
agreements and if the subsequent lease is classified as a finance lease,
these are deferred and released with an impact on the income statement
over the life of the relevant agreements.
The deferred items contain the following:
As of Dec 31 (€ million) 2018 2017
Deferred Federal grants 569 699Deferred revenues 775 584Other 304 340
Total 1,648 1,623Non-current portion 627 785Current portion 1,021 838
The deferred Federal grants comprise mainly the interest benefit (differ-
ence between the nominal value and present value) attributable to the
interest-free loans; this has developed as follows during the year under
review:
(€ million) 2018 2017
As of Jan 1 499 643Reversals –144 –144
As of Dec 31 355 499
Of the figure shown for reversals in the year under review, € 59 million
(previous year: € 59 million) is attributable to the annual reversal of
deferred items. The remainder is attributable to the release of amortized
deferrals relating to premature one-off repayments at the present value
in 1999, 2004 and in 2011.
Deferred revenues constitute that part of compensation which is
attributable to the period after the balance sheet date.
Deutsche Bahn Group 2018 Integrated Report
226

Notes to the statement of cash flows
The statement of cash flows shows the changes in cash and cash equiv-
alents in the year under review, and was prepared in accordance with IAS
7 (Cash Flow Statements). The indirect method has been used for show-
ing the cash flow from operating activities.
Interest income and interest payments, dividend income as well as
tax payments are stated under operating activities.
Cash and cash equivalents include the cash and cash equivalents
stated in the balance sheet with a residual maturity of less than three
months (cash in hand, cash deposited with the Bundesbank, cash at
banks and checks as well as securities). In the year under review, of the
total figure stated for cash and cash equivalents, € 856 million (previous
year: € 638 million) was subject to disposal restrictions mainly as a result
of provisions of the rail franchises in Great Britain, external solvency
requirements for DB Group’s own insurance companies as well as coun-
try-specific and contractual restrictions particularly in international
logistics business.
Cash and cash equivalents also include current receivables due from
banks (€ 216 million; previous year: € 271 million) resulting from hedges
in connection with financial futures. These receivables are repaid in the
event of a positive market development, and are repaid by no later than
the maturity of the financial futures.
Cash flow from operating activitiesThe cash flow from operating activities is calculated by adjusting the
net profit for the period before taxes by items which are not cash-ef-
fective (in particular additions to and reversals of other provisions) and
by adding other changes in current assets, in liabilities (excluding finan-
cial debt) and provisions. The cash flow from operating activities is
then established after due consideration is given to interest and tax
payments.
The inflow of cash from operating activities increased considerably
compared with the previous year. This is due mainly to higher pension
provisions.
Information regarding the changes in financial liabilities in accordance with IAS 7
The non-cash effective expenses and income have declined (€ –420 mil-
lion), and mainly comprise slightly lower expenses relating to additions
to other provisions as well as higher income from the reversal of other
provisions.
Cash flow from investing activitiesThe cash flow from investing activities is calculated as the cash flow
provided by the disposal of property, plant and equipment and intan-
gible assets as well as by investment grants, and the cash outflow for
capital expenditures in property, plant and equipment and intangible
assets as well as for non-current financial assets.
Payments received from investment grants are shown under
investing activities due to the close connection between investment
grants received and the payments made for capital expenditures in prop-
erty, plant and equipment assets.
The slight increase in the outflow of cash from investing activities is
mainly due to the increase in outflows for capital expenditures in prop-
erty, plant and equipment (+6.8%) in conjunction with another increase
in the net inflows of investment grants (+7.6%). The outflows for the
acquisition of shares in consolidated companies have declined signifi-
cantly compared with the previous year (year under review: € 3 million;
previous year: € 30 million).
When changes take place in the scope of consolidation as a result of
the acquisition or sale of companies, the acquisition price which is paid
(excluding any liabilities which are transferred) less the acquired or sold
financial resources are stated as cash flow from investing activities.
Cash flow from financing activitiesThe cash flow from financing activities is due to the net inflows and
outflows attributable to issued bonds, changes in bank borrowings and
other loans as well as outflows for the redemption of finance lease lia-
bilities and interest-free loans.
The increase in cash flow from financing activities is due in particular
to considerable increases resulting from the issuing and redemption of
bonds, an increase in net inflows from the raising of funds as well as a
profit distribution to the Federal Government reduced by € 150 million.
(€ million) Jan 1, 2018
Cash-effective
change (inflow (+)/outflow (–))
Non-cash-effective changes
As of Dec 31, 2018
Acqui- sition (+)/sale (–) of
companies Currency
effects
Addi-tion (+)/
disposal (–) of finance
leasesCom-
pounding
Receivables from financing –131 – 43 – 0 – – –174LIABILITIE S FROM FINAN CING
Interest-free loans 1,014 –204 – – – 41 851Bonds 19,616 1,027 – 56 – 13 20,712Commercial paper – – – – – – –Bank borrowings 531 115 – 0 – – 646EUROFIMA loan 200 – – – – – 200Finance lease liabilities 501 – 42 55 – 21 27 562Liabilities from transport concessions 52 –7 – – – – 45Other financial liabilities 162 66 – 0 – – 228
22,076 955 55 56 21 81 23,244
Total 21,945 912 55 56 21 81 23,070
FIN
AN
CIA
L S
TA
TE
ME
NT
S
227
CONSOLIDATED FINANCIAL STATEMENTS — NOTES TO THE CONSOLIDATED FINANCIAL STATEMENTS
SU
ST
AIN
AB
ILIT
Y

Notes to the segment information
Segment reporting of DB Group has been prepared in accordance with
IFRS 8 (Operating Segments). The operating segments of DB Group
result from the aggregation of fully consolidated legal entities; these
legal entities have been allocated to specific segments on the basis of
the company-specific operational performance on a defined market. The
Group Management Board takes its decisions and carries out economic
analyses as well as appraisals at the level of the operating segments
(“management approach”).
The allocation of legal entities to operating segments in external
ac counting is consistent with the allocation in internal management re-
porting. This means that the management and legal structure of DB
Group are coincident. As a result of this allocation principle, there are no
partial balance sheets or partial income statements within a legal entity
which are allocated to different segments.
In this connection, management reporting is addressed to the Group
Management Board in its function as the primary decision maker. Man-
agement reporting in DB Group is based on the accounting principles in
accordance with IFRS. With regard to reconciling the segment data with
the corresponding corporate data, it is accordingly mainly necessary to
take account of consolidation effects. For this reason, a consolidation
column is used for reconciliation purposes. The operations of the busi-
ness segments are covered in the reporting format in line with the cor-
porate organization structure of DB Group. The main regions covered by
DB Group are detailed in the segment information by regions.
DB Group uses the following primary segments:
◊ DB Long-Distance: The segment DB Long-Distance comprises all
cross-regional transport operations and other passenger transport
services. Most of these transport services are provided in Germany.
◊ DB Regional: The segment DB Regional combines the activities for
the German transport and general services in regional rail and road
local passenger transport. These activities also comprise the S-Bahn
(metro) operations in Berlin and Hamburg.
◊ DB Arriva: All European local transport activities (rail and bus) out-
side Germany are pooled in the DB Arriva segment.
◊ DB Cargo: The segment DB Cargo pools the European activities in
rail freight transport. It operates primarily in Germany, Denmark, the
Netherlands, Italy, Great Britain, France, Poland and Spain.
◊ DB Schenker: All global logistics activities of DB Group are managed
in the DB Schenker segment. These comprise the freight, transport
and other services in commodity and goods transport.
◊ DB Netze Track: The segment DB Netze Track is responsible for
installing, maintaining and operating the complete track-related rail
infrastructure in Germany.
◊ DB Netze Stations: The segment DB Netze Stations comprises the
operation, development and marketing of passenger stations and
retail facilities in stations in Germany.
◊ DB Netze Energy: The segment DB Netze Energy provides all stan-
dard energy products in the fields of transport energy and stationary
energy.
◊ Subsidiaries/Other: DB AG with its numerous management, financing
and service functions in its capacity as the management holding of
DB Group is shown in this segment. This also includes the service
companies which mostly render the services within DB Group in the
fields of transport, logistics, information technology and telecom-
munications. The other subsidiaries and remaining activities are
classified under Subsidiaries/Other as well.
The data concerning the segments are shown after intra-segment rela-
tions have been eliminated. The transactions between the segments
(inter-segment relations) are eliminated in the column consolidation.
The income and expenses detailed on the basis of operating seg-
ments in the segment information are adjusted by issues which are of an
exceptional nature in terms of the amount involved or in terms of the
reason for the specific issue. A general adjustment is recognized for book
profits and losses attributable to transactions with investments/financial
investments and in the amount of the depreciation on long-term cus-
tomer contracts, which have been capitalized as part of the purchase
price allocation process of company acquisitions. In addition, an adjust-
ment is recognized for individual issues if they are of an exceptional
nature, if they are definable for accounting purposes, if they can be
measured and if the amount involved is material. They are shown in the
reconciliation column. This column also reconciles the balance sheet
items of capital employed (contents allocated in accordance with man-
agement reporting) and the external presentation in accordance with
the consolidated balance sheet of DB Group.
Segment reporting is based on the management key figures which
are used for internal management of the operating segments. These key
figures form the basis of the value-oriented management concept (see
Capital management in DB Group (in accordance with IAS 1) µ192 f.).
The external revenues and other revenues consist exclusively of
income generated by the segments with non-Group parties. The internal
revenues and other income show the income with other segments
(inter-segment income). Market prices are used for establishing the
transfer prices for intra-Group transactions.
EBITDA (earnings before interest, taxes, depreciation and amortiza-
tion) is used for assessing the purely operational profitability of the
operating segments. It does not include any costs of essential capital in
the form of depreciation and interest. Accordingly, EBITDA is not influ-
enced by segment-specific financing structures and long-term invest-
ment cycles (in particular in the infrastructure segments); consequently,
depreciation is incurred sooner than the positive returns generated by
these capital expenditures. EBITDA thus has the character of pre-tax
cash flow.
On the other hand, EBIT additionally comprises depreciation recog-
nized in relation to fixed assets (property, plant and equipment and
intangible assets). EBIT is the result generated by operations which is
available for meeting the return requirements of the providers of capital.
The financing costs which are incurred as a result of the (in certain
cases) very high amounts of capital tied up in the operating segments
of DB Group (particularly in the infrastructure segments) are also rele-
vant for a long-term assessment of results. This is the reason why net
operating interest is additionally taken into consideration in the key
figure operating income after interest.
The essential assets which are used (capital employed) also have to
be taken into consideration in addition to the above-mentioned param-
eters for internal management of the operating segments. The capital
employed comprises the essential capital which is used by providers of
equity and providers of debt and for which interest has to be paid.
Deutsche Bahn Group 2018 Integrated Report
228

Net financial debt is defined as the balance of interest-bearing external
liabilities and finance lease liabilities as well as cash and cash equivalents
and interest-bearing external receivables. The net financial debt of the
segments also comprises the receivables and liabilities attributable to
Group financing and internal finance lease.
Gross capital expenditures consist of capital expenditures in prop-
erty, plant and equipment and intangible assets excluding capitalized
borrowing costs. Net capital expenditures are calculated by deducting
the participation of third parties in the financing of specific capital ex -
penditure projects (essentially the investment grants of the Federal
Government and the Federal states).
Additions from changes in the scope of consolidation are shown as
part of segment gross capital expenditures, and comprise exclusively the
capital expenditures in property, plant and equipment and intangible
assets, including the goodwill acquired as part of company acquisitions
or included in the consolidated financial statements for the first time.
The number of employees comprises the workforce, excluding
trainees and dual degree students (students on courses combining
theory and practice), at the end of the reporting period (part-time em -
ployees have been converted to full-time employees).
The accounting and valuation principles described for the segments
are the same as those applicable for the consolidated financial state-
ments of DB Group (Basic principles and methods µ188 ff.). Intra-Group
segment transactions are generally conducted on an arm’s length basis.
Explanations concerning the information by regionsExternal revenues are stated on the basis of the registered offices of the
Group company providing the service.
Non-current assets are allocated on the basis of the location of the
company. The non-current assets comprise intangible assets, property,
plant and equipment as well as non-current receivables and other assets
(excluding financial instruments, deferred tax assets, rights from insur-
ance policies as well as assets in conjunction with benefits after termi-
nation of the employment agreement).
Information concerning major customersIn the year under review as in the previous year, no single customer
accounted for more than 10% of overall Group revenues.
Risk management and derivative financial instruments
Management of financial and energy price risksAs a mobility, transport and logistics group with international opera-
tions, DB Group is exposed to financial risks in the form of changes in
interest rates and exchange rates. In addition, there are also energy price
risks on the procurement side as a result of fluctuations in the prices of
diesel fuel and electricity. One of the aspects of corporate policy is to
actively manage and thus limit these risks by means of the use of deriv-
ative financial instruments.
DB AG is responsible for all financing and hedging transactions of
DB Group with its central Group Treasury, and operates in close cooper-
ation with the subsidiaries, where the risk positions primarily rise. Group
Treasury follows the relevant regulations for risk management (minimum
requirements for risk management (Mindestanforderungen an das Risi-
komanagement; MaRisk) and Corporate Sector Supervision and Trans-
parency Act (Gesetz zur Kontrolle und Transparenz im Unternehmens-
bereich; KonTraG)). Speculation is not permitted. Ongoing market and
risk assessment takes place as part of risk management.
Derivative financial instruments are used exclusively for hedging
interest, currency and energy price risks. All individual transactions cor-
respond to on-balance-sheet or anticipated underlyings (for instance
bonds, purchases of diesel fuel and electricity). The aim is to achieve
qualification as an effective hedge in accordance with IFRS 9.
Interest rate risksThe interest rate risks are attributable to borrowings raised in conjunc-
tion with variable interest rates.
In accordance with IFRS 7, the effects of theoretical changes in
market interest rates on income and shareholders’ equity are investi-
gated by means of a sensitivity analysis. For this purpose, the following
financial instruments are considered:
◊ Derivatives designated in cash flow hedges (interest hedges and
cross-currency hedges) have an impact on the hedge reserve in
shareholders’ equity and are therefore taken into consideration in
the sensitivity calculations relating to shareholders’ equity.
◊ The sensitivity calculations for net interest income include financial
instruments with variable interest (cash at banks, short-term bor-
rowings/investments, cross-currency swaps, loans, finance leases).
If the level of market interest rates for the exposure had been 100 basis
points higher (lower) as of the balance sheet date, the comprehensive
income would have been affected as follows:
(€ million)
2018 2017
Change in market level of interest rates
+100 BP 1) –100 BP 1) +100 BP 1) –100 BP 1)
Impact on comprehensive income +28 –31 + 40 – 43 thereof net profit for the year +7 –7 + 8 – 8 thereof covered directly in equity +21 –24 +21 –24
1) Basis points.
Foreign currency risksThe foreign currency risks are attributable to financing measures and
operating activities.
In order to avoid interest rate and foreign currency risks, the foreign
currency bonds issued and loans within the framework of Group financ-
ing are converted into euro liabilities and receivables by means of cross-
currency swaps. However, it is not necessary for such bonds to be con-
verted in individual cases if there is a guarantee that the bond can be
serviced out of inflows of foreign currency payments.
Subsidiaries hedge all significant foreign currency positions in their
functional currency via Group Treasury. In exceptional cases and to a
limited extent, subsidiaries are permitted to hedge foreign currency
positions with banks themselves.
The currency sensitivity analysis in accordance with IFRS 7 is based
on the following assumptions:
◊ The cross-currency swaps which are concluded and the current cur-
rency transactions are always allocated to original underlyings.
◊ All major foreign currency positions arising from operating activities
are always 100% hedged. If exchange rate changes are 100% hedged,
they do not have any impact on profits or equity capital.
◊ Foreign currency risks can only occur if a 100% hedge does not exist
in justified exceptional cases; for instance if a conservative estimate
is made for hedge volumes for anticipated foreign currency cash
flows in order to avoid overhedging.
FIN
AN
CIA
L S
TA
TE
ME
NT
S
229
CONSOLIDATED FINANCIAL STATEMENTS — NOTES TO THE CONSOLIDATED FINANCIAL STATEMENTS
SU
ST
AIN
AB
ILIT
Y

◊ On-balance-sheet foreign currency risks may result from energy
price hedging which is not denominated in the respective func-
tio nal currency.
If the following foreign currencies for currency hedges had weakened (or
strengthened) by 10% as of the balance sheet date, comprehensive income
would not have been significantly affected.
(€ million)
2018 2017
Appreciation of foreign currency by
+10% –10% +10% –10%
USD + 4 – 4 +7 –7CNY + 4 – 5 + 3 –3ILS +1 –1 0 0QAR +1 –1 +1 –1SAR +1 –1 +1 –1MXN 0 0 –1 +2SGD –2 +2 0 0TRY –1 +2 0 0
DB Group has numerous equity investments in foreign subsidiaries,
whose net assets are exposed to a translation risk. This translation risk
is not perceived to be a foreign currency risk for the purposes of IFRS 7,
and is not hedged.
Energy price risksThe Energy Price Risk Management Committee (ERMC) is responsible
for managing and minimizing energy risks; this committee is responsible
for ensuring the implementation of the risk policy of DB Group specifi-
cally with regard to energy price risks (in particular for procurement of
diesel and electricity). The ERMC takes decisions with regard to specific
hedging strategies and measures in which financial and energy deriva-
tives are used.
Swaps relating to the commodities underlying the price formulae
(coal and heavy fuel oil) are used as hedges for the risks of price changes
for sourcing electricity.
Diesel price risks are for instance limited by taking out diesel swaps
(hybrid hedges of diesel price and currency risks and individual hedges
of currency risks are possible in exceptional cases).
The following assumptions have been made for performing the sen-
sitivity analyses in accordance with IFRS 7:
◊ In the case of energy price swaps, the effective part is recognized in
shareholders’ equity, and the ineffective part is recognized in the
income statement.
◊ If options are used (collars), the intrinsic value constitutes the effec-
tive part of the hedge, so that the intrinsic value is shown in share-
holders’ equity. On the other hand, the fair value is not part of the
hedge, and is shown in the income statement.
If the energy prices at the end of the year had been 10% lower (or higher),
comprehensive income would have been affected as follows:
(€ million)
2018 2017
Changes in market prices
+10% –10% +10% –10%
Impact on comprehensive income +71 –71 + 50 – 50 thereof covered directly in equity +71 –71 + 50 – 50 Diesel + 42 – 42 + 50 – 50 Hard coal +29 –29 0 0
Counterparty default risk of interest, currency and energy derivativesThe default risk is actively managed by way of strict requirements
relating to the creditworthiness of the counterparty at the point at which
the transactions are concluded and also throughout the entire life of the
transactions, and also by way of defining risk limits.
In order to minimize the credit risk of derivatives, DB AG has con-
cluded credit support agreements (CSAs) with its core banks. In the CSA,
it was agreed that both parties would mutually provide cash securities
for interest and cross-currency swaps as well as energy derivatives. Secu-
rities are exchanged daily with all relevant banks.
Related amounts which are not netted in the balance sheet:
As of Dec 31 (€ million)
Financial assets/ liabilities shown
in the balance sheet
Related amounts which are not netted in the balance sheet
Financial InstrumentsCash securities
received/provided Net amounts
2018 2017 2018 2017 2018 2017 2018 2017
Derivative financial instruments – assets 263 179 –149 –111 –114 – 61 0 7Derivative financial instruments – liabilities 391 382 –149 –111 –216 –271 26 0
The assets of financial derivatives and thus the maximum counterparty
default risk have increased as a result of exchange rate fluctuations of
the euro against other currencies, particularly against the Swiss franc
and the Japanese yen. The liabilities of derivative financial instruments
have increased only slightly. The cash collateral provided is still predom-
inant. The maximum individual risk (default risk in relation to individual
contract partners) is € 54 million (as of December 31, 2017: € 33 million)
and exists in relation to a bank with a Moody’s rating of A1. For trans-
actions with terms of more than one year, all contract partners which
are exposed to a default risk have a Moody’s rating of at least Baa2.
Deutsche Bahn Group 2018 Integrated Report
230

Maturity analysis of financial liabilities as of Dec 31, 2018 (€ million)
2019 2020 2021 – 2023 2024 – 2028 2029 ff.
Fixed/variable interest
Redemp-tion
Fixed/variable interest
Redemp-tion
Fixed/variable interest
Redemp-tion
Fixed/variable interest
Redemp-tion
Fixed/variable interest
Redemp-tion
NON - DER IVATIVE FINAN CIAL LIABILITIE S
Interest-free loans – 178 – 163 – 469 – 155 – – Bonds 438 1,900 359 1,940 821 5,441 713 6,669 396 3,666 Commercial paper – – – – – – – – – – Bank borrowings 0 240 0 4 – 401 – 1 – – EUROFIMA loan 8 – 8 – 8 200 – – – – Finance lease liabilities 19 44 18 43 42 136 47 140 111 199 Finance liabilities from transport concessions 1 6 1 6 7 20 1 13 – – Other financial liabilities 3 196 – 24 – 7 – 1 – –Trade payables – 5,157 – 59 – 80 – 20 – –Other/miscellaneous liabilities – 3,399 – 13 – 22 – 39 – –DERIVATIVE FINANCIAL LIABILITIES (NET/GROSS SETTLED)
Cross-currency derivatives connected with cash flow hedges 59 30 58 439 124 321 122 1,407 16 448 Interest derivatives not connected with cash flow hedges – – – – – – – – – –Interest derivatives connected with cash flow hedges 5 – 5 – 4 – – – – –Currency derivatives connected with cash flow hedges – 463 – – – – – – – –Currency derivatives not connected with cash flow hedges – 1,131 – 2 – – – – – –Energy price derivatives 20 – 12 – 12 – 4 – – –DERIVATIVE FINANCIAL ASSETS (GROSS SETTLED)
Cross-currency derivatives connected with cash flow hedges 65 301 58 649 108 530 77 1,364 26 506 Interest derivatives not connected with cash flow hedges – – – – – – – – – –Interest derivatives connected with cash flow hedges – – – – – – – – – –Currency derivatives connected with cash flow hedges – 339 – 0 – – – – – –Currency derivatives not connected with cash flow hedges – 726 – 38 – 7 – – – –Energy price derivatives – – – – – – – – – –VOLUNTARY INFOR MATION AB O UT DER IVATIVE S
DERIVATIVE FINANCIAL ASSETS (NET SETTLED)
Cross-currency derivatives connected with cash flow hedges – – – – – – – – – –Interest derivatives not connected with cash flow hedges – – – – – – – – – –Interest derivatives connected with cash flow hedges – – – – – – – – – –Currency derivatives connected with cash flow hedges – – – – – – – – – –Currency derivatives not connected with cash flow hedges – 0 – 0 – – – – – –Energy price derivatives –15 – –13 – –22 – – 6 – – –INFLOW OF FUNDS FROM DERIVATIVE FINANCIAL INSTRUMENTS (GROSS SETTLED)
Cross-currency derivatives connected with cash flow hedges –116 –372 –112 –1,155 –272 – 870 –250 –2,676 – 63 – 915 Interest derivatives not connected with cash flow hedges – – – – – – – – – –Interest derivatives connected with cash flow hedges – – – – – – – – – –Currency derivatives connected with cash flow hedges – – 800 – – – – – – – –Currency derivatives not connected with cash flow hedges – –1,856 – – 42 – – 8 – – – –Energy price derivatives – – – – – – – – – –FINAN CIAL WAR R ANTIE S
Financial warranties – 17 – – – – – – – –
Liquidity riskLiquidity management involves maintaining adequate liquid assets, con-
stantly checking the commercial paper market for ensuring adequate
market liquidity and depth, and the constant availability of financial
resources via guaranteed credit facilities of banks (Note (28) µ213 ff.).
The following table shows the contractually agreed undiscounted
interest payments and redemption payments relating to the original
financial liabilities as well as the derivative financial instruments with a
positive and negative fair value of DB Group:
FIN
AN
CIA
L S
TA
TE
ME
NT
S
231
CONSOLIDATED FINANCIAL STATEMENTS — NOTES TO ThE CONSOLIDATED FINANCIAL STATEMENTS
SU
ST
AIN
AB
ILIT
Y

Maturity analysis of financial liabilities as of Dec 31, 2017 (€ million)
2018 2019 2020 – 2022 2023 – 2027 2028 ff.
Fixed/variable interest
Redemp-tion
Fixed/variable interest
Redemp-tion
Fixed/variable interest
Redemp-tion
Fixed/variable interest
Redemp-tion
Fixed/variable interest
Redemp-tion
NON - DER IVATIVE FINAN CIAL LIABILITIE S
Interest-free loans – 204 – 178 – 476 – 311 – – Bonds 481 1,900 401 1,942 824 5,453 654 6,561 331 3,842 Commercial paper – – – – – – – – – – Bank borrowings 0 121 0 5 1 404 – 1 – – EUROFIMA loan 8 – 8 – 16 200 – – – – Finance lease liabilities 21 75 16 33 41 103 45 121 114 169 Finance liabilities from transport concessions 1 6 1 6 1 19 0 21 – – Other financial liabilities 3 58 3 102 – 1 – 1 – –Trade liabilities – 5,157 – 59 – 80 – 20 – –Other/miscellaneous liabilities – 3,399 – 13 – 22 – 39 – –DERIVATIVE FINANCIAL LIABILITIES (NET/GROSS SETTLED)
Cross-currency derivatives connected with cash flow hedges 58 241 53 106 116 730 85 1,143 11 261 Interest derivatives not connected with cash flow hedges – – – – – – – – – –Interest derivatives connected with cash flow hedges 5 – 5 – 4 – – – – –Currency derivatives connected with cash flow hedges – 717 – – – – – – – –Currency derivatives not connected with cash flow hedges – 886 – 7 – – – – – –Energy price derivatives 22 – 9 – 15 – 6 – – –DERIVATIVE FINANCIAL ASSETS (GROSS SETTLED)
Cross-currency derivatives connected with cash flow hedges 63 126 60 216 127 668 121 1,517 39 599 Interest derivatives not connected with cash flow hedges – – – – – – – – – –Interest derivatives connected with cash flow hedges – – – – – – – – – –Currency derivatives connected with cash flow hedges – 208 – 0 – – – – – –Currency derivatives not connected with cash flow hedges – 901 – 3 – 1 – – – –Energy price derivatives – – – – – – – – – –VOLUNTARY INFOR MATION AB O UT DER IVATIVE S
DERIVATIVE FINANCIAL ASSETS (NET SETTLED)
Cross-currency derivatives connected with cash flow hedges – – – – – – – – – –Interest derivatives not connected with cash flow hedges – – – – – – – – – –Interest derivatives connected with cash flow hedges – – – – – – – – – –Currency derivatives connected with cash flow hedges – – – – – – – – – –Currency derivatives not connected with cash flow hedges – 0 – 0 – – – – – –Energy price derivatives –16 – –11 – –15 – – 8 – – –INFLOW OF FUNDS FROM DERIVATIVE FINANCIAL INSTRUMENTS (GROSS SETTLED)
Cross-currency derivatives connected with cash flow hedges –115 –361 –104 –347 –262 –1,396 –260 –2,612 – 67 – 825 Interest derivatives not connected with cash flow hedges – – – – – – – – – –Interest derivatives connected with cash flow hedges – – – – – – – – – –Currency derivatives connected with cash flow hedges – – 924 – – – – – – – –Currency derivatives not connected with cash flow hedges – –1,787 – –10 – –1 – – – –Energy price derivatives – – – – – – – – – –FINAN CIAL WAR R ANTIE S
Financial warranties – 17 – – – – – – – –
This includes all instruments which were held as of December 31, 2018
and for which payments had already been agreed. Foreign currency
amounts have been translated using the spot rate applicable as of the
reference date. The variable interest payments attributable to the finan-
cial instruments have been calculated on the basis of the interest rates
applicable on December 31, 2018 (previous year: on December 31, 2017).
Financial liabilities which can be repaid at any time are allocated to the
earliest possible time segment.
The financial liabilities are opposed by cash and cash equivalents of
€ 3,544 million (as of December 31, 2017: € 3,397 million), consisting of
positive account balances and current fixed-term deposits.
Deutsche Bahn Group 2018 Integrated Report
232

Other disclosures
(35) Contingent receivables and liabilities, and guarantee obligationsContingent receivables were stated as € 46 million as of December 31,
2018 (as of December 31, 2017: € 23 million). They mainly comprise a
recovery claim in conjunction with construction grants which have been
provided but which had not been sufficiently determined as of the bal-
ance sheet date in terms of the specific amount and the time at which
the claim would become due.
As of the balance sheet date, no contingent receivables had been
recognized for all injunction proceedings in view of the high level of
uncertainty relating to refund claims, the timing of refunds and the
probability of refunds.
The contingent liabilities are broken down as follows:
As of Dec 31 (€ million) 2018 2017
Contingent liabilities from warranties – 30Other contingent liabilities 99 124
Total 99 154
Other contingent liabilities also comprise risks arising from litigation
which had not been stated as provisions because the expected proba-
bility of occurrence is less than 50%.
There are also contingencies of € 17 million from guarantees as of
December 31, 2018 (as of December 31, 2017: € 17 million). Property, plant
and equipment with carrying amounts of € 13 million (as of December 31,
2017: € 7 million) were also used as security for loans. The reported figure
essentially relates to rolling stock used at the operating companies in
the segment DB Long-Distance.
DB Group acts as guarantor mainly for equity participations and
consortiums, and is legally subject to joint and several liability for all
consortiums in which it is involved.
(36) Other financial obligationsThe other financial obligations amounted to € 21,964 million as of
December 31, 2018 (as of December 31, 2017: € 20,507 million).
Capital expenditures in relation to which the company has entered
into contractual obligations as of the balance sheet date, but for which
no consideration has yet been received, are broken down as follows:
As of Dec 31 (€ million) 2018 2017
Committed capital expenditures Property, plant and equipment 15,931 14,478 Intangible assets 31 55Acquisition of financial assets 417 402
Total 16,379 14,935
The increase in committed capital expenditures in property, plant and
equipment is mainly due to the planned expenditures due to own con-
struction services; these are opposed mainly by effects resulting from
acquisitions/deliveries of new vehicles. In the case of some supply
arrangements, there are independent admissions of guilt with regard to
fulfilling the order commitment; these are opposed by claims of the same
amount, backed by bank guarantees and insurance policies with very
good ratings. The order commitment for the acquisition of property, plant
and equipment also contains future obligations for vehicles in connection
with transport contracts to be recognized in accordance with IFRIC 12.
The figure of € 417 million shown for the acquisition of financial
assets (as of December 31, 2017: € 402 million) relates to outstanding
contributions at EUROFIMA which have not been called in.
Various companies in DB Group have leased assets, e.g. property, build-
ings, technical equipment, plant and machinery as well as operational and
business equipment within the framework of operating lease agreements.
The terms of the future minimum lease payments arising from oper-
ating lease agreements are set out in the following table:
As of Dec 31 (€ million)
Nominal values
2018 2017
Up to 1 year 1,174 1,2891 to 2 years 820 8482 to 3 years 604 6513 to 4 years 463 4664 to 5 years 380 369More than 5 years 1,264 1,175
Total 4,705 4,798
Future operating leases have also resulted in minimum lease payments
totaling € 880 million (as of December 31, 2017: € 774 million) – thereof up
to one year: € 33 million (as of December 31, 2017: € 5 million), thereof 1
to 5 years: € 291 million (as of December 31, 2017: € 242 million), thereof
more than 5 years: € 556 million (as of December 31, 2017: € 527 million).
(37) Structured companies DB AG holds 100% of the shares in DB Barnsdale AG and DB Competition
Claims GmbH. The purpose of these structured companies is to enforce
claims for damages from cartel operations; they are included as subsid-
iaries in the consolidated financial statements. There are profit and loss
transfer agreements with DB AG.
(38) Infrastructure and transport contractsThe following notes and information refer to the requirements of SIC-29
(Disclosure – Service Concession Arrangements).
Infrastructure contractsThe main rail infrastructure companies (RIC) of DB Group are DB Netz
AG, DB Station&Service AG and DB Energie GmbH.
On the basis of section 6 of the General Railways Act (Allgemeines
Eisenbahngesetz, AEG), the RICs which operate track, control and secu-
rity systems or platforms require approval for such operations. This is
applicable particularly for DB Netz AG and DB Station&Service AG,
whose approvals are valid until the end of December 31, 2048.
The rights of the RIC to operate the railway infrastructure is connect ed
to various obligations. In particular, they are obliged to ensure that their
operations are managed safely, that all rail infrastructure is constructed
safely and maintained in a safe condition (section 4 (3) AEG). With regard
to compliance with this regulation, the RIC of DB Group are regulated by
the Federal Railway Authority (Eisenbahn- Bundesamt; EBA).
In addition, the RIC also have to observe statutory duties in the case
of any new and expansion projects, for instance with regard to noise
abatement. DB Group voluntarily participates in the rail noise abatement
program of the Federal Government for existing lines.
The RIC provide non-discriminatory access to the rail infrastructure
in accordance with sections 10 ff. Railway Regulation Act (Eisenbahnre-
gulierungsgesetz; EReG), and charge the TOC for this access. The fees
of DB Netz AG and DB Station&Service AG must comply with the require-
ments of the EReG. The fees for the usage of traction power lines of
DB Energie GmbH have to comply with the requirements of the Energy
Industry Law (Energiewirtschaftsgesetz; EnWG).
FIN
AN
CIA
L S
TA
TE
ME
NT
S
233
CONSOLIDATED FINANCIAL STATEMENTS — NOTES TO ThE CONSOLIDATED FINANCIAL STATEMENTS
SU
ST
AIN
AB
ILIT
Y

In the year under review, DB Netz AG, DB Station&Service AG and
DB Energie GmbH generated overall revenues of € 9,516 million (previous
year: € 9,218 million); thereof € 3,434 million (previous year: € 3,269 mil-
lion) was generated with non-Group customers.
The assets of the rail infrastructure are the legal and economic prop-
erty of the companies.
Transport contractsDB Regio AG and its subsidiaries provide transport services on the basis
of ordered services. These so-called transport contracts for local rail pas-
senger transport services are signed with the contracting organization of
the transport services authorized by the Federal states (e.g. special-pur-
pose association, local transport company); these contracts determine
the volume and the quality level of the transport service, the future devel-
opment as well as the compensation (concession fees).
The funds necessary for this purpose are made available to the Fed-
eral states by the Federal Government in accordance with the regulations
of the Regionalization Act (Regionalisierungsgesetz; RegG). The total
concession fees received by the subsidiaries of the segment DB Regional
for rail transport amounted to € 5,474 million in the year under review
(previous year: € 3,900 million) (Note (1) µ194 f.). Contrary to the pre-
vious year, this amount includes a figure of € 1,438 million (previous year:
€ 921 million) for revenues from fares which had to be netted against the
claims for concession fees within the framework of gross contracts.
In addition, there are similar transport contracts with internation -
al contracting organizations in the segment DB Arriva, with a volume
of € 998 million in the year under review (previous year: € 861 million)
(Note (1) µ194 f.).
About 80% of the secured transport contracts run until at least 2022,
about 40% run until at least 2027 and about 25% run until at least
2030. The transport contracts can only be terminated by the ordering
orga nization during the term of the contract for a compelling reason.
In many cases, the companies enjoy legal and beneficial ownership
of the assets necessary for providing the services, and in particular the
rolling stock. Some transport contracts include obligations whereby the
assets which are deployed have to be handed over at the end of the life
of the contract. In addition, DB Group is recording an increasing share
of transport contracts in which the rolling stock is either leased by the
contracting organization or for which the leasing arrangement is sup-
ported by capital service guarantees by the contracting organization.
(39) Related-party disclosuresThe following parties are deemed to be related parties of DB Group in
accordance with IAS 24 (Related-Party Disclosures):
◊ the Federal Government in its capacity as the owner of all shares in
DB AG,
◊ the companies or enterprises subject to the control of the Federal
Government (Federal companies),
◊ affiliated, non-consolidated and associated companies as well as
joint ventures of DB Group, as well as
◊ the members of the Management Board and the Supervisory Board
of DB AG and their close relatives.
Transactions with related parties are conducted on an arm’s length basis.
The figures attributable to related companies and persons are stated
under the corresponding items of the “Notes to the balance sheet” with
the designation “thereof.” Individual figures are set out in the Notes (19)
µ207 ff., (28) µ213 ff. and (29) µ218.
Details and explanations of transactions between DB Group and the
Federal Government are included in the Notes (3) µ195, (5) µ196 f.,
(9) µ200 f., (13) µ202 ff., (32) µ220 ff., (36) µ233 and (38) µ233 f.
Significant economic relations which need to be reported separately
between DB Group and related companies and persons are explained in
the following:
Relationships with the Federal Government
(€ million)
Federal Government
2018 2017
SERVICE S R ECEIVED BY DB GRO UP
Purchase of goods and services 1,333 1,386Rents and leases 1 1Other services 0 0Investment grants 1) 6,314 5,612Other income grants 229 215
7,877 7,214SERVICE S R ENDER ED BY DB GRO UP
Sale of goods and services 382 339Rents and leases 14 13Other services 107 61Repayment of loans 204 206Repayment of investment grants 29 41Repayment from cartel proceedings – 2
736 662OTHER DI S CLO SUR E S
Unsecured receivables 2) 384 276Unsecured liabilities 2) 1,155 1,217Current total of guarantees received 2) 1,139 1,104
1) Including € 406 million EU subsidies paid out via the Federal Government (previous year: € 257 million).2) As of the balance sheet date.
Purchases of goods and services mainly comprise the fees paid to the
Federal Government within the framework of the pro forma billing of the
allocated civil servants as well as cost refunds for staff secondments in
the service provision field.
With the law for improving the opportunities for re-integration on
the labor market, the corresponding regulations in German social security
code (Sozialgesetzbuch; SGB) III were revised. In accordance with section
54 SGB III, the Federal Employment Agency provides a subsidy of up to
€ 231 per month for career opportunity qualifications. In the year under
review, about 280 young persons were offered a training opportunity
within the framework of the career preparation program Chance plus.
DB AG and the RIC have signed a Performance and Financing Agree-
ment (Leistungs- und Finanzierungsvereinbarung; LuFV) I with the
Federal Government represented by the Federal Ministry of Transport,
Building and Urban Development (Bundesministerium für Verkehr, Bau
und Stadtentwicklung; BMVBS) for the initial period 2009 to 2013. This
agreement has reformed the financing regime for the existing network.
Whereas up to the point at which the LuFV I came into force, framework,
individual and collective agreements have been used as the basis for
financing replacement capital expenditures in relation to individual mea-
sures, the use of Federal funds within the LuFV framework is managed
in a quality-oriented manner. The plannability, efficiency and transpar-
ency of the use of funds for maintaining the infrastructure has been
improved with the LuFV I. The agreement came into force on January 1,
2009. The duration of the LuFV was extended from the end of 2013 to
the end of 2015 by way of a second addendum to the performance and
financing agreement of September 6, 2013. The LuFV I was replaced by
the follow-up agreement LuFV II with effect from January 1, 2015.
203-1
GRI
Deutsche Bahn Group 2018 Integrated Report
234

The negotiations concerning the LuFV II between DB Group and the Fed-
eral Government were concluded in October 2014. The LuFV II, which was
signed on January 12, 2015 and which has been applicable since January 1,
2015, is a target-oriented instrument for financing and managing capital
expenditures. The core objectives are to maintain and further improve the
quality and availability of the existing infrastructure (existing network)
and to assure financing for the existing network for the years 2015 to 2019.
Under the terms of the LuFV II, the contractually defined volume of
funds was considerably increased: the infrastructure contribution of the
Federal Government was increased to an average of € 3.316 billion per
calendar year. The envisaged dividend distributions of DB AG are rein-
vested completely in the rail infrastructure as Federal grants. The share
for improving local rail passenger transport was increased to € 1.1 billion
for the entire life of the LuFV II. The maintenance contribution to be
provided by the RIC has increased to a minimum of € 8.0 billion for the
life of the LuFV II.
The own funds to be provided by the RIC for capital expenditures
every year on the other hand now amount to € 100 million per calendar
year (LuFV I: € 500 million per calendar year).
The quality parameters from the LuFV I have been retained in prin-
ciple, whereby the targets have been increased. A new “status category
fully and partially renewed bridges” has been agreed in the LuFV II. If at
least 875 railway bridges are not fully or partially renewed during the life
of the LuFV II, and/or if the average status category of these bridges
does not improve by at least one status category, the Federal Govern-
ment can demand a one-off repayment of € 15 million.
In addition to the previous reasons for demanding repayments, the
Federal Government can demand repayment of € 1.0 million per bridge
in the event of a bridge having to be closed due to a fault for which the
RIC is responsible. In addition, under certain conditions, the Federal
Government can also demand repayment in the event of data errors. And
finally, the Federal Government can demand repayment of a propor-
tionate amount in the event of a deliberate or grossly negligent contra-
vention of the principle of efficient and cost-effective application of
funds if it is disadvantaged in this way.
The LuFV II has also specified in greater detail the statutory assess-
ment and audit rights of the Federal Audit Office (Bundesrechnungshof).
The negotiations for the LuFV III are currently ongoing. This is ex -
pected to come into force on January 1, 2020.
The RIC and the Federal Government signed the Requirement Plan
Implementation Agreement (Bedarfsplanumsetzungsvereinbarung;
BUV) on July 25, 2017. This came into force on January 1, 2018, and gov-
erns the financing of requirement plan projects. Key elements include a
readjustment of planning costs, fixing the own fund participation of the
RIC in the projects as well as the agreement of binding commissioning
dates which are subject to penalties if not met.
The Federal Government will in future absorb all costs of the proj-
ects, in other words also the entire planning costs. The previous regu-
lation in the form of a fixed amount for planning costs equivalent to
18% of the construction costs has been canceled.
In future, the RIC will participate in all costs of the projects in accor-
dance with their own economic benefit, i.e. including the entire construc-
tion costs. This provides a powerful incentive to avoid increases in con-
struction costs.
The RIC give the Federal Government a commitment for milestones
and binding commissioning dates for the projects. The penalties in the
event of failure to meet these deadlines provide an incentive for com-
plying with the deadlines.
Further investment grants are provided in accordance with the Municipal
Transport Financing Act (Gemeindeverkehrsfinanzierungsgesetz; GVFG)
for measures of the transport program, in accordance with the noise
abatement program of the Federal Government in relation to existing
track of the railways and within the framework of the Future Capital Ex -
penditure Program (Zukunftsinvestitionsprogramm; ZIP) which was
adopted in 2016.
DB Netz AG has received funds from the European Union for infra-
structure projects in the field of trans-European networks (TEN) and for
priority measures for expanding the trans-European network (Connect-
ing Europe Facility; CEF funds).
The grants recognized in the income statement relate also to pay-
ments provided by the Federal Government for covering excessive bur-
dens borne by DB Group as a result of operating and maintaining level
crossings with roads of all construction authorities.
Sales of products and services also comprise services for carrying
severely disabled persons, Bundeswehr soldiers and Bundeswehr traffic.
DB AG repaid to the Federal Government interest-free loans of € 204
million (previous year: € 206 million) in accordance with the BSWAG. The
payments were made within the framework of the agreed annual stan-
dard redemption payment to the Federal Government.
The liabilities due to the Federal Government comprise the extended
loans, which are shown here with their present values, and other liabili-
ties of € 304 million (as of December 31, 2017: € 203 million).
The guarantees received from the Federal Government primarily
relate to the loans received from EUROFIMA as well as the outstanding
contributions and liabilities arising from collective liability of DB AG at
EUROFIMA. The guarantees which have been received include a max-
imum commitment of € 1,153 million of the Federal Government for loans
of EUROFIMA. The loan volume amounted to € 200 million as of December
31, 2018 (unchanged).
The following agreements were concluded with the Federal Govern-
ment in the year under review:
Eight new financing agreements were concluded in the year under
review in addition to the Adjustment Agreement 2018 (Anpassungs-
vereinbarung; APV), in certain cases still charged against the ZIP. The
Federal Government has provided finance totaling about € 1,325 million
for the new agreements. Of this figure, about € 19 million related to the
year under review. The financing agreements have different terms, which
in certain cases extend to the year 2029. Financing is provided com-
pletely in the form of investment grants which do not have to be repaid.
Sections 21 (5) No. 2 and (6) of the DBGrG have resulted in claims of
DB AG against the Federal Government. Section 21 (5) No. 2 DBGrG spec-
ifies that the Federal Government bears those costs which are incurred
by DB AG in the performance of technical, operational or organizational
measures as a result of the fact that employment agreements cannot be
terminated. Section 21 (6) DBGrG states that (5) No. 2 is applicable
accordingly for assigned civil servants. The joint implementation of the
DBGrG is based on an agreement in accordance with section 21 (8) DBGrG
in relation to section 21 (5) No. 2 and (6) DBGrG of June 10/17, 2015
between the Federal Railway Fund on the one hand and DB AG on the
other. The Federal Ministry of Transport and Digital Infrastructure (Bun-
desministerium für Verkehr und digitale Infrastruktur; BMVI) and the
Federal Ministry of Finance (Bundesministerium der Finanzen; BMF)
approved this agreement on June 24/July 28, 2015. The new agreement
states that DB AG shall provide evidence (with documentation of each
individual case) that an employee of DB JobService GmbH (a civil servant
or employee subject to collective bargaining agreements satisfying cer-
tain criteria at the foundation in 1994) was affected by a rationalization
!!!
FIN
AN
CIA
L S
TA
TE
ME
NT
S
235
CONSOLIDATED FINANCIAL STATEMENTS — NOTES TO ThE CONSOLIDATED FINANCIAL STATEMENTS
SU
ST
AIN
AB
ILIT
Y

measure and employment elsewhere is not possible. The personnel
expenses plus an additional amount of 10% of the personnel expenses
to cover costs shall be reimbursed only after each individual case has
been reviewed by the Federal Railway Fund. By the end of the year under
review, a total of € 84.6 million (excluding reimbursement costs) was
settled for the cases which have so far been confirmed by the Federal
Railway Fund. The Federal Railway Fund transferred a figure of € 8.5
million as reimbursement of costs to DB JobService GmbH.
The annual financial statements 2018 of DB JobService GmbH disclose
reimbursement claims of DB AG against the Federal Government in the
total amount of € 64.4 million (including 10% reimbursement of costs)
on the basis of section 21 (5) and (6) DBGrG. Reimbursements in accor-
dance with Section 21 (5) No. 2 and (6) DBGrG are audited by the Federal
Railway Fund on the basis of individual documentation. For those cases
which have changed to DB JobService GmbH in January 2014 after the
DemografieTV came into force (new cases), extensive supporting evi-
dence has to be provided on the basis of original receipts by the compa-
nies. In the autumn of 2017, the Federal Railway Fund carried out a further
audit of the 670 outstanding cases (dissent cases) which were concluded
in the year under review. Of the 670 outstanding cases, 389 were con-
firmed (confirmation rate: 57.5%), and a total of € 40.7 million (includ-
ing reimbursement of costs) was recognized retrospectively for the years
2015 to 2017. The annual financial statements 2017 of DB AG recognized
a receivable due from the Federal Railway Fund of € 28.7 million for the
outstanding cases for the years 2015 to 2017 on the basis of an assumed
confirmation ratio of 50%. Accordingly, the actual retrospective recogni-
tion in the year under review for the previous years was higher than the
figure assumed in the annual financial statements 2017 as a result of the
higher confirmation ratio.
Relations with Federal companiesMost of the transactions carried out in accordance with IAS 24 in the
year under review and in the previous year related to operations, and
were overall of minor significance for DB Group. The receivables and
liabilities which had arisen were virtually completely settled as of the
balance sheet date.
Business relations with Deutsche Telekom and Deutsche Post re -
gard ing the use of telecommunications and postal services have taken
place to the usual extent.
Relations with affiliated, non-consolidated companies, associates and joint ventures In the year under review, DB Group purchased goods and services worth
€ 116 million (previous year: € 114 million), mainly for purchasing pas-
senger transport and freight services. At € 85 million (previous year: € 80
million), most of the total figure which has been reported is attributable
to transactions with associates. Rental and leasing payments of € 6 mil-
lion were also made (previous year: € 7 million).
Interest payments of € 8 million (previous year: € 8 million) were also
incurred in the year under review. This figure relates almost exclusively to
interest payments for the loans extended by EUROFIMA (Note (28) µ213 ff.).
In the year under review, DB Group generated revenues of € 386
million (previous year: € 373 million) from sales of goods and services.
The revenues were generated mainly in the DB Cargo segment and relate
to revenues generated by transport services which were provided.
Guarantees totaling € 6 million (as of December 31, 2017: € 6 million)
have been extended; of this figure € 6 million (as of December 31, 2017:
€ 6 million) was attributable to joint ventures. An equivalent volume of
transactions with related companies was conducted in the previous year.
Relations with the Management Board and Supervisory Board of DB AG
The following section sets out the transactions between DB Group and
the members of the Management Board and the Supervisory Board, as
well as the companies in which members of the Management Board or
the Supervisory Board own a majority interest.
(€ thousand) 2018 2017
SERVICE S R ENDER ED BY DB GRO UP
Sale of goods and services 6,603 11,748Trade receivables as of Dec 31 435 255SERVICE S R ECEIVED BY DB GRO UP
Purchase of goods and services 3,976 11,220Trade liabilities as of Dec 31 889 1,740
The revenues of € 6,603 thousand (previous year: € 11,748 thousand)
generated by DB Group (service provider) mainly relate to transport and
freight forwarding services of the segments DB Cargo and DB Schenker
which were provided to the Georgsmarienhütte Holding GmbH Group.
The goods and services purchased by DB Group (service recipient)
comprise almost entirely supplies of Georgsmarienhütte Holding GmbH
Group.
Compensation of the Management Board
(€ thousand) 2018 2017
Benefits due in the short term 6,498 6,270Post-employment benefits 1,222 1,940Other benefits due in the long term 1,049 369Payments on the occasion of termination of employment contracts – 2,251Share-based compensation – –
Total compensation of the Management Board according to IFRS 8,769 10,830 Fixed 4,665 4,906 Variable 4,104 3,673 Payments on the occasion of termination of employment contracts – 2,251Pension provisions for active members of the Management Board 1) 17,885 23,409
Total compensation of the Management Board according to HGB 6,498 8,521
Compensation of former members of the Management Board and their surviving dependants 10,406 14,865Retirement benefit obligations in respect of former members of the Management Board and their surviving dependants 1) 171,091 149,214
1) Details of defined benefit obligations.
No loans and advances were extended to members of the Management
Board in the year under review. Nor did the company take on any contin-
gencies for the benefit of members of the Management Board.
Compensation of the Supervisory Board
(€ thousand) 2018 2017
Total compensation of the Supervisory Board 865 910 thereof short-term 865 910 thereof fixed 514 508 thereof variable 154 224 thereof attendance fees 46 42 thereof benefits in kind from discounted travel 61 89 thereof compensation for membership in supervisory board/advisory boards of DB Group companies (including attendance fees) 90 47
Deutsche Bahn Group 2018 Integrated Report
236

No compensation was incurred for former members of the Supervisory
Board and their surviving dependants. There are no pension obligations
for former members of the Supervisory Board and their surviving depen-
dants. The members of the Supervisory Board only receive benefits due
in the short term.
No loans and advances were extended to members of the Supervi-
sory Board in the year under review. Nor did the company take on any
contingencies for the benefit of members of the Supervisory Board.
The total amount of compensation for the Management Board and
Supervisory Board was € 9,634 thousand in the year under review (pre-
vious year: € 11,740 thousand). Individual details as well as further details
concerning the payments of the members of the Management Board and
Supervisory Board are included in the Corporate Governance report in
the Group management report.
(40) Events after the balance sheet dateBond issuesIn January and February 2019, the following bonds were issued by
DB Finance:
Issue volume Duration (years) Coupon (%) Placing
€ 1 billion 10 1.125
Institutional inves-tors mainly in
Germany, France and Great Britain
GBP 300 million (about € 340 million) 7 1.875
Institutional investors mainly
in Great BritainNOK 1 billion (about€ 103 million) 15 2.705 Private placement
Wage bargaining negotiationsThe wage bargaining negotiations with the EVG and GDL trade unions
were successfully concluded on December 14, 2018 and January 4, 2019
respectively. The agreements are due to run (retrospectively from Octo-
ber 1, 2018) for 29 months until February 28, 2021.
(41) Exemption of subsidiaries from the disclosure requirements of the German Commercial CodeThe following subsidiaries intend to utilize the possibility of section 264
(3) or 264b HGB not to disclose their financial statements:
◊ AMEROPA-REISEN GmbH, Bad Homburg v. d. Höhe
◊ Autokraft GmbH, Kiel
◊ Bayern Express&P. Kühn Berlin GmbH, Berlin
◊ BRN Busverkehr Rhein-Neckar GmbH, Ludwigshafen am Rhein
◊ BVO Busverkehr Ostwestfalen GmbH, Bielefeld
◊ BVR Busverkehr Rheinland GmbH, Düsseldorf
◊ DB Barnsdale AG, Berlin
◊ DB Cargo BTT GmbH, Mainz
◊ DB Cargo Logistics GmbH, Kelsterbach
◊ DB Cargo Vermögensverwaltungs-Aktiengesellschaft, Mainz
◊ DB Competition Claims GmbH, Berlin
◊ DB Dialog GmbH, Berlin
◊ DB Engineering&Consulting GmbH, Berlin
◊ DB FuhrparkService GmbH, Frankfurt am Main
◊ DB Gastronomie GmbH, Frankfurt am Main
◊ DB Intermodal Services GmbH, Mainz
◊ DB JobService GmbH, Berlin
◊ DB Kommunikationstechnik GmbH, Berlin
◊ DB Media&Buch GmbH, Kassel
◊ DB Projekt Stuttgart — Ulm GmbH, Stuttgart
◊ DB Regio Bus Bayern GmbH, Ingolstadt
◊ DB Regio Bus Mitte GmbH, Ludwigshafen am Rhein
◊ DB Regio Bus Nord GmbH, Hamburg
◊ DB Regio Bus Ost GmbH, Potsdam
◊ DB Regionalverkehr Bayern GmbH, Ingolstadt
◊ DB Sicherheit GmbH, Berlin
◊ DB Systel GmbH, Frankfurt am Main
◊ DB Systemtechnik GmbH, Minden
◊ DB Vertrieb GmbH, Frankfurt am Main
◊ DB Zeitarbeit GmbH, Berlin
◊ Deutsche Bahn Connect GmbH, Frankfurt am Main
◊ Deutsche Bahn Digital Ventures GmbH, Berlin
◊ Deutsche Bahn International Operations GmbH, Berlin
◊ DVA Deutsche Verkehrs-Assekuranz-Vermittlungs-GmbH,
Bad Homburg v. d. Höhe
◊ ELAG Emder Lagerhaus und Automotive GmbH, Emden
◊ EVAG Emder Verkehrs und Automotive Gesellschaft mbH, Emden
◊ Friedrich Müller Omnibusunternehmen GmbH, Schwäbisch Hall
◊ Haller Busbetrieb GmbH, Walsrode
◊ Hanekamp Busreisen GmbH, Cloppenburg
◊ ioki GmbH, Frankfurt am Main
◊ Karpeles Flight Services GmbH, Frankfurt am Main
◊ Mobimeo GmbH, Berlin
◊ MTS MarkenTechnikService GmbH&Co. KG, Karlsruhe
◊ NVO Nahverkehr Ostwestfalen GmbH, Münster
◊ Omnibusverkehr Franken GmbH (OVF), Nuremberg
◊ ORN Omnibusverkehr Rhein-Nahe GmbH, Mainz
◊ RBO Regionalbus Ostbayern GmbH, Regensburg
◊ Regional Bus Stuttgart GmbH RBS, Stuttgart
◊ Regionalbus Brunswick GmbH – RBB –, Brunswick
◊ Regionalverkehr Allgäu GmbH (RVA), Oberstdorf
◊ Regionalverkehr Oberbayern Gesellschaft mit beschränkter Haftung,
Munich
◊ Regionalverkehre Start Deutschland GmbH, Frankfurt am Main
◊ RMV Rhein-Mosel Verkehrsgesellschaft mbH, Koblenz
◊ RVS Regionalverkehr Südwest GmbH, Karlsruhe
◊ S-Bahn Hamburg Service GmbH, Hamburg
◊ SBG SüdbadenBus GmbH, Freiburg im Breisgau
◊ Schenker Aktiengesellschaft, Essen
◊ Schenker Dedicated Services Germany GmbH, Essen
◊ Schenker Deutschland AG, Frankfurt am Main
◊ Schenker Europe GmbH, Frankfurt am Main
◊ Schenker Global Management&Services GmbH, Essen
◊ Schenker GmbH für Beteiligungen, Essen
◊ Schenker Technik GmbH, Essen
◊ TFG Transfracht Internationale Gesellschaft für kombinierten
Güterverkehr mbH, Mainz
◊ TRANSA Spedition GmbH, Offenbach am Main
◊ UBB Usedomer Bäderbahn GmbH, Heringsdorf
◊ Verkehrsgesellschaft mbH Untermain – VU –, Aschaffenburg
◊ Verkehrsgesellschaft Start Augsburg mbH, Frankfurt am Main
◊ Verkehrsgesellschaft Start Emscher — Münsterland mbH,
Frankfurt am Main
◊ Verkehrsgesellschaft Start Niedersachsen mbH, Frankfurt am Main
◊ Verkehrsgesellschaft Start NRW mbH, Frankfurt am Main
◊ Verkehrsgesellschaft Start Ostsachsen mbH, Berlin
◊ Verkehrsgesellschaft Start Unterelbe mbH, Cuxhaven
◊ WB Westfalen Bus GmbH, Münster
◊ Weser — Ems Busverkehr GmbH (WEB), Bremen
FIN
AN
CIA
L S
TA
TE
ME
NT
S
237
CONSOLIDATED FINANCIAL STATEMENTS — NOTES TO ThE CONSOLIDATED FINANCIAL STATEMENTS
SU
ST
AIN
AB
ILIT
Y

(42) List of shareholdingsThe list of shareholdings is set out on the following pages.
Breakdown of shareholdings of DB AG
(in accordance with section 313 (2) HGB)
Subsidiary Name and registered offices Currency
Share-holders’
equity (TLC) 1)
Owner-ship (%)
DB LONG - DI STAN CE
FULLY CONSOLIDATED
AMEROPA-REISEN GmbH, Bad Homburg v. d. Höhe EUR 2,869 100.00DB Bahn Italia S. r. l., Verona/Italy EUR 8,357 100.00DB Fernverkehr Aktiengesellschaft, Frankfurt am Main EUR 2,337,182 100.00DB Reise&Touristik Suisse SA, Basel/Switzerland CHF – 4,054 100.00AT EQUITY
Alleo GmbH, Saarbrücken 2), 3) EUR 380 50.00Railteam B. V., Amsterdam/the Netherlands 2), 4) EUR 116 20.00Rheinalp GmbH, Frankfurt am Main 2), 3) EUR 131 50.00DB R EGIONAL
FULLY CONSOLIDATED
Autokraft GmbH, Kiel EUR 17,250 100.00Bayern Express&P. Kühn Berlin GmbH, Berlin EUR 7,217 100.00BRN Busverkehr Rhein-Neckar GmbH, Ludwigshafen am Rhein EUR 8,431 100.00Busverkehr Märkisch-Oderland GmbH, Strausberg EUR 5,017 51.17Busverkehr Oder-Spree GmbH, Fürstenwalde EUR 8,265 51.17BVO Busverkehr Ostwestfalen GmbH, Bielefeld EUR 13,127 100.00BVR Busverkehr Rheinland GmbH, Düsseldorf EUR 7,918 100.00DB Regio Aktiengesellschaft, Frankfurt am Main EUR 2,185,464 100.00DB Regio Bus Bayern GmbH, Ingolstadt EUR 7,242 100.00DB Regio Bus Mitte GmbH, Ludwigshafen am Rhein EUR 59,591 100.00DB Regio Bus Nord GmbH, Hamburg EUR 1,729 100.00DB Regio Bus Ost GmbH, Potsdam EUR 6,316 100.00DB Regio Bus Rhein-Mosel GmbH, Montabaur EUR 2,117 74.90DB Regionalverkehr Bayern GmbH, Ingolstadt EUR 50 100.00DB RegioNetz Verkehrs GmbH, Frankfurt am Main EUR 61,334 100.00DB ZugBus Regionalverkehr Alb-Bodensee GmbH (RAB), Ulm EUR 61,869 100.00Friedrich Müller Omnibusunternehmen GmbH, Schwäbisch Hall EUR 3,175 100.00Haller Busbetrieb GmbH, Walsrode EUR 6,315 100.00Hanekamp Busreisen GmbH, Cloppenburg EUR 3,345 100.00KOB GmbH, Oberthulba EUR 2,055 70.00NVO Nahverkehr Ostwestfalen GmbH, Münster EUR 873 100.00Omnibusverkehr Franken GmbH (OVF), Nuremberg EUR 22,601 100.00ORN Omnibusverkehr Rhein-Nahe GmbH, Mainz EUR 13,718 100.00RBO Regionalbus Ostbayern GmbH, Regensburg EUR 15,853 100.00Regional Bus Stuttgart GmbH RBS, Stuttgart EUR 26,862 100.00Regionalbus Braunschweig GmbH – RBB –, Brunswick EUR 8,562 100.00Regionalverkehr Allgäu GmbH (RVA), Oberstdorf EUR 4,490 70.00Regionalverkehr Oberbayern Gesellschaft mit beschränkter Haftung, Munich EUR 19,938 100.00Regionalverkehre Start Deutschland GmbH, Frankfurt am Main EUR 5,903 100.00rhb rheinhunsrückbus GmbH, Simmern EUR 170 48.69
Subsidiary Name and registered offices Currency
Share-holders’
equity (TLC) 1)
Owner-ship (%)
RMV Rhein-Mosel Verkehrsgesellschaft mbH, Koblenz EUR 12,966 74.90RVS Regionalverkehr Südwest GmbH, Karlsruhe EUR 17,020 100.00S-Bahn Berlin GmbH, Berlin EUR 170,251 100.00S-Bahn Hamburg GmbH, Hamburg EUR 84,511 100.00S-Bahn Hamburg Service GmbH, Hamburg EUR 25 100.00SBG SüdbadenBus GmbH, Freiburg im Breisgau EUR 15,486 100.00Verkehrsgesellschaft mbH Untermain – VU –, Aschaffenburg EUR 3,228 100.00Verkehrsgesellschaft Start Augsburg mbH, Frankfurt am Main EUR 48 100.00Verkehrsgesellschaft Start Emscher- Münsterland mbH, Frankfurt am Main EUR 17 100.00Verkehrsgesellschaft Start Niedersachsen mbH, Frankfurt am Main EUR 49 100.00Verkehrsgesellschaft Start NRW mbH, Frankfurt am Main EUR 49 100.00Verkehrsgesellschaft Start Ostsachsen mbH, Berlin EUR 49 100.00Verkehrsgesellschaft Start Unterelbe mbH, Cuxhaven EUR 1,550 100.00WB Westfalen Bus GmbH, Münster EUR 9,872 100.00Weser-Ems Busverkehr GmbH (WEB), Bremen EUR 13,711 100.00AT EQUITY
“Rhein-Nahe Nahverkehrsverbund GmbH,” Ingelheim am Rhein 2), 3) EUR 125 28.67“ZOB” Zentral-Omnibus-Bahnhof Gesellschaft mit beschränkter Haftung, Bremen 2), 4) EUR 29 25.60Bodensee-Oberschwaben Verkehrsverbund-gesellschaft mit beschränkter Haftung, Ravensburg 2), 3) EUR 205 25.32Connect-Fahrplanauskunft GmbH, Hannover 2), 4) EUR 198 42.00FahrBus Ostalb GmbH, Aalen 2), 3) EUR 255 49.90Filsland Mobilitätsverbund GmbH, Göppingen 2), 3) EUR 79 30.00FSN Fahrzeugservice Neunkirchen GmbH, Neunkirchen 2), 4) EUR 172 47.50Kahlgrund-Verkehrs-Gesellschaft mit beschränkter Haftung, Schöllkrippen 2), 3) EUR 8,960 28.00Kitzinger Nahverkehrsgemeinschaft (KiNG), Kitzingen 2), 5) EUR 4 50.00Kreisbahn Aurich GmbH, Aurich 2), 3) EUR 1,141 33.33Main-Spessart-Nahverkehrsgesellschaft mbH i. L., Gemünden (Main) 2), 5) EUR 107 25.00Niedersachsentarif GmbH, Hanover 2), 3) EUR 54 12.50NSH Nahverkehr Schleswig-Holstein GmbH, Kiel 2), 3) EUR 46 46.90OstalbMobil GmbH, Aalen 2), 3) EUR 50 39.30RBP Regionalbusverkehr Passau Land GmbH, Bad Füssing 2), 4) EUR 67 33.33Regio-Verkehrsverbund Freiburg GmbH (RVF), Freiburg im Breisgau 2), 3) EUR 343 42.50Saarländische Nahverkehrs-Service GmbH, Saarbrücken 2), 4) EUR 60 31.67stadtbus Ravensburg Weingarten GmbH, Ravensburg 2), 3) EUR 25 45.20TGO – Tarifverbund Ortenau GmbH, Offenburg 2), 3) EUR 100 49.00Verkehrsgemeinschaft am Bayerischen Untermain – VAB GmbH, Aschaffenburg 2), 4) EUR 25 60.00Verkehrsgemeinschaft Mittelthüringen GmbH (VMT), Erfurt 2), 3) EUR 123 11.11Verkehrsgesellschaft Landkreis Nienburg mbH (VLN), Nienburg/Weser 2), 4) EUR 26 48.54Verkehrsunternehmen Hegau-Bodensee Verbund GmbH (VHB), Konstanz 2), 3) EUR 30 34.00
102-45
GRI
Deutsche Bahn Group 2018 Integrated Report
238

Subsidiary Name and registered offices Currency
Share-holders’
equity (TLC) 1)
Owner-ship (%)
Verkehrsunternehmens-Verbund Mainfranken GmbH – VVM, Würzburg 2), 3) EUR 30 18.64Verkehrsverbund Großraum Nürnberg GmbH (VGN), Nuremberg 2), 3) EUR 54 25.93Verkehrsverbund Neckar-Alb-Donau GmbH (naldo), Hechingen 2), 3) EUR 440 18.12Verkehrsverbund Schwarzwald-Baar GmbH (VSB), Villingen-Schwenningen 2), 3) EUR 115 45.00Verkehrsverbund Süd-Niedersachsen GmbH (VSN), Göttingen 2), 3) EUR 98 31.16VGC Verkehrsgesellschaft Bäderkreis Calw mbH, Calw 2), 3) EUR 780 32.50VHN Verkehrsholding Nord GmbH&Co. KG, Schleswig 2), 3) EUR 720 20.00VHN Verwaltungsgesellschaft mbH, Schleswig 2), 3) EUR 1,131 20.00VMS Verkehrs-Management und Service GmbH, Trier 2), 3) EUR 30 38.46WNS Westpfälzische Nahverkehrs-Service GmbH, Kaiserslautern 2), 4) EUR 212 45.00WTV Waldshuter Tarifverbund GmbH, Waldshut-Tiengen 2), 3) EUR 84 40.00FAIR VALUE
Regio Verkehrsverbund Lörrach GmbH (RVL), Lörrach 2), 3) EUR 116 54.00Verkehrsverbund Pforzheim-Enzkreis GmbH (VPE), Pforzheim 2), 3) EUR 51 25.00Verkehrsverbund Rottweil GmbH (VVR), Villingen-Schwenningen 2), 5) EUR 72 70.20vgf Verkehrs-Gemeinschaft Landkreis Freudenstadt GmbH, Waldachtal 2), 3) EUR 199 51.42VVW Verkehrsverbund Warnow GmbH, Rostock 2), 3) EUR 27 21.61DB AR R IVA
FULLY CONSOLIDATED
00741078 Limited, Sunderland/Great Britain GBP 569 100.00ACTIJOVEN CONSULTING&TRAVELLING s. l., Madrid/Spain EUR 376 100.00Alliance Rail Holdings Ltd, Sunderland/Great Britain GBP 0 100.00Ambuline Limited, Sunderland/Great Britain GBP 1,551 100.00APS (Leasing) Ltd, Sunderland/Great Britain GBP 676 100.00Arriva Alpetour, družba za prevoz potnikov, d. o. o., Kranj/Slovenia EUR 35,158 100.00Arriva Bus&Coach Holdings Limited, Sunderland/Great Britain GBP 28,275 100.00Arriva Bus&Coach Ltd, Sunderland/Great Britain GBP 15,164 100.00Arriva Bus Abu Dhabi Limited, Sunderland/Great Britain GBP 0 100.00Arriva Bus Transport Polska Sp. z o. o., Toruń/Poland PLN 10,433 99.80Arriva City s. r. o., Prague/Czech Republic CZK 719,536 100.00Arriva Cymru Limited, Sunderland/Great Britain GBP 39,285 100.00Arriva Danmark A/S, Kastrup/Denmark DKK 1,629,101 100.00Arriva Dolenjska in Primorska, družba za prevoz potnikov, d. o. o., Koper/Slovenia EUR 35,214 100.00Arriva Durham County Limited, Sunderland/Great Britain GBP 39,647 100.00Arriva East Herts&Essex Ltd, Sunderland/Great Britain GBP 0 100.00Arriva Finance Holding B. V., Heerenveen/the Netherlands EUR 48 100.00
Subsidiary Name and registered offices Currency
Share-holders’
equity (TLC) 1)
Owner-ship (%)
Arriva Finance Lease Limited, Sunderland/Great Britain GBP 1,570 100.00Arriva Galicia S. L., Ferrol/Spain EUR 23,278 100.00Arriva Hongarije Holding BV, Heerenveen/ the Netherlands EUR 33,473 100.00Arriva Hrvatska d. o. o., Osijek/Croatia HRK 273,514 100.00Arriva Hungary Zrt., Budapest/Hungary HUF 24,937,360 100.00Arriva Insurance A/S, Kastrup/Denmark DKK 87,623 100.00Arriva Insurance Company (Gibraltar) Limited, Gibraltar/Gibraltar GBP 4,252 100.00Arriva International (Northern Europe) Limited, Sunderland/Great Britain EUR 404 100.00Arriva International (Southern Europe) Limited, Sunderland/Great Britain EUR 404 100.00Arriva International Limited, Sunderland/Great Britain EUR 1,178,456 100.00Arriva International Trains (Leasing) Limited, Sunderland/Great Britain EUR 15,699 100.00ARRIVA INVESTIMENTOS SGPS,SA, Almada/Portugal EUR 222,599 100.00Arriva Italia Rail S. R. L., Milan/Italy EUR 2,708 100.00Arriva Italia s. r. l., Milan/Italy EUR 334,860 100.00Arriva Kam-Bus, družba za prevoz potnikov, d. o. o., Kamnik/Slovenia EUR 6,341 100.00Arriva Kent&Surrey Limited, Sunderland/Great Britain GBP 75,576 100.00Arriva Kent Thameside Limited, Sunderland/Great Britain GBP 76,156 100.00Arriva Letbane ApS, Kastrup/Denmark DKK 1,546 100.00ARRIVA Liorbus, a. s., Ružomberok/Slovakia EUR 15,343 60.42ARRIVA LISBOA TRANSPORTES SA, Almada/Portugal EUR –1 100.00Arriva LITAS d. o. o. Požarevac, Požarevac/ Serbia RSD 1,982,952 100.00Arriva Liverpool Limited i. L., Sunderland/Great Britain GBP 0 100.00ARRIVA LONDON NORTH LTD, Sunderland/Great Britain GBP 66,206 100.00ARRIVA LONDON SOUTH LTD, Sunderland/Great Britain GBP 72,314 100.00ARRIVA MADRID MOVILIDAD S. L., Madrid/ Spain EUR 39,509 100.00Arriva Manchester Limited, Sunderland/Great Britain GBP 0 100.00Arriva Merseyside Limited, Sunderland/Great Britain GBP 143,485 100.00ARRIVA METROPOLITANA S. L., Paseo de la Estacion/Spain EUR 237 100.00ARRIVA Michalovce, a. s., Michalovce/Slovakia EUR 12,245 60.14Arriva Middle East FZE, Dubai/United Arab Emirates AED –11 100.00Arriva Midlands Limited, Sunderland/Great Britain GBP 47,454 100.00Arriva Midlands North Limited, Sunderland/Great Britain GBP 44,046 100.00Arriva Mobility Solutions, s. r. o., Nitra/Slovakia EUR 159 100.00Arriva Morava a. s., Ostrava/Czech Republic CZK 1,713,093 100.00Arriva Motor Holdings Limited, Sunderland/Great Britain GBP 97,345 100.00Arriva Multimodaal BV, Heerenveen/ the Netherlands EUR 18 100.00ARRIVA NITRA a. s., Nitra/Slovakia EUR 17,244 60.48Arriva North East Limited, Sunderland/Great Britain GBP 6,319 100.00Arriva North West Limited, Sunderland/Great Britain GBP 5,395 100.00
FIN
AN
CIA
L S
TA
TE
ME
NT
S
239
CONSOLIDATED FINANCIAL STATEMENTS — NOTES TO ThE CONSOLIDATED FINANCIAL STATEMENTS
SU
ST
AIN
AB
ILIT
Y

Subsidiary Name and registered offices Currency
Share-holders’
equity (TLC) 1)
Owner-ship (%)
Arriva Northumbria Limited, Sunderland/Great Britain GBP 26,653 100.00ARRIVA Nove Zamky, a. s., Nove Zamky/ Slovakia EUR 15,714 60.36Arriva Östgötapendeln AB, Stockholm/Sweden SEK 17,291 100.00Arriva Passenger Services Pension Trustees Limited, Sunderland/Great Britain GBP 0 100.00Arriva Personenvervoer Nederland BV, Heerenveen/the Netherlands EUR 307,428 100.00Arriva plc, Sunderland/Great Britain GBP 706,611 100.00Arriva Polen Holding B. V., Heerenveen/ the Netherlands EUR 2,540 100.00Arriva Polska Sp. z o. o., Warsaw/Poland PLN 18,199 100.00ARRIVA PORTUGAL – TRANSPORTES LDA, Guimaraes/Portugal EUR 8,782 100.00Arriva Rail East Midlands Limited, Sunderland/Great Britain GBP 0 100.00Arriva Rail London Limited, Sunderland/Great Britain GBP 28,958 100.00Arriva Rail North Limited, Sunderland/Great Britain GBP –144,839 100.00Arriva Rail XC Limited, Sunderland/Great Britain GBP 0 100.00Arriva RP Sp. z o. o., Toruń/Poland PLN 28,407 100.00Arriva Scotland West Limited, Inchinnan/ Great Britain GBP 2,669 100.00Arriva Service A/S, Kastrup/Denmark DKK 230 100.00Arriva Service s. r. o., Komárno/Slovakia EUR 30,152 100.00Arriva Services a. s., Králův Dvůr/Czech Republic CZK 92,285 100.00ARRIVA Slovakia a. s., Nitra/Slovakia EUR 15,972 100.00Arriva South Eastern Rail Limited, Sunderland/Great Britain GBP 0 100.00ARRIVA SPAIN HOLDING, S. L., Madrid/Spain EUR 62,167 100.00Arriva Spain Rail S. A., Madrid/Spain EUR 260 100.00Arriva Stajerska, družba za prevoz potnikov, d. d., Maribor/Slovenia EUR 15,588 75.90Arriva Středni Čechy s. r. o., Kosmonosy/ Czech Republic CZK 794,307 100.00Arriva Sverige AB, Stockholm/Sweden SEK 626,743 100.00Arriva Sverige Buss Regional AB, Stockholm/Sweden SEK 3,678 100.00Arriva Tag AB, Malmö/Sweden SEK 45,431 100.00Arriva Techniek BV, Heerenveen/the Netherlands EUR 1,030 100.00Arriva the Shires Limited, Sunderland/ Great Britain GBP 67,192 100.00Arriva Tog A/S, Kastrup/Denmark DKK 112,858 100.00Arriva Touring BV, Heerenveen/the Netherlands EUR 1,593 100.00Arriva Trains Holdings Limited, Sunderland/Great Britain GBP 107,755 100.00Arriva Trains Romania SRL, Bucharest/ Romania RON 7,463 100.00Arriva Trains Wales/Trenau Arriva Cymru Limited, Sunderland/Great Britain GBP 31,566 100.00Arriva Transport Ceska Republika a. s., Prague/Czech Republic CZK 3,402,970 100.00Arriva Transport Solutions Limited, Sunderland/Great Britain GBP –1,359 100.00ARRIVA TRANSPORTES DA MARGEM SUL, SA, Almada/Portugal EUR 84,293 100.00ARRIVA Trnava, a. s., Trnava/Slovakia EUR 19,491 60.50Arriva Trustee Company Limited, Sunderland/Great Britain GBP 0 100.00
Subsidiary Name and registered offices Currency
Share-holders’
equity (TLC) 1)
Owner-ship (%)
Arriva UK Bus Holdings Limited, Sunderland/Great Britain GBP 447,479 100.00Arriva UK Bus Investments Limited, Sunderland/Great Britain GBP 393,251 100.00Arriva UK Bus Limited, Sunderland/Great Britain GBP 3,896 100.00Arriva UK Bus Properties Limited, Sunderland/Great Britain GBP 1,681 100.00Arriva UK Trains Limited, Sunderland/Great Britain GBP 352,879 100.00Arriva Veneto S. r. l., Venice/Italy EUR 614 50.00ARRIVA VIAJES AGENCIA OPERADORA S. L., Madrid/Spain EUR 350 100.00Arriva vlaky s. r. o., Prague/Czech Republic CZK 51,577 100.00Arriva Východní Čechy a. s., Chrudim/ Czech Republic CZK 680,212 100.00Arriva West Sussex Limited i. L., Sunderland/Great Britain GBP 0 100.00Arriva Yorkshire Ltd, Sunderland/ Great Britain GBP 52,559 100.00Arriva Zuid Europa Holding B. V., Heerenveen/the Netherlands EUR 347 100.00At Seat Catering (2003) Limited, Sunderland/Great Britain GBP 14 100.00Autobusni kolodovr d. o. o. Karlovac, Karlovac/Croatia HRK 3,776 72.87Autocares Mallorca, s. l., Alcudia/Spain EUR 4,629 100.00Autoprometno poduzeće d. d. Požega, Požega/Croatia HRK 90,650 77.98Autos Carballo, S. L., Paseo de la Estacion/Spain EUR 7,304 100.00Autoservizi F. V. G. S. P. A. – SAF, Udine/Italy EUR 89,192 60.00Autotrans d. o. o., Cres/Croatia HRK 166,276 78.35Autotrans Lika d. d., Otočac/Croatia HRK 5,219 62.24Bergamo Trasporti Est S. c. a. r. l., Bergamo/ Italy EUR 10 93.67Botniatag AB, Umeå/Sweden SEK 43,038 60.00Bus Nort Balear s. l., Alcudia/Spain EUR 41 100.00BUS Service Jármüjavitó és Szolgáltató Kft., Budapest/Hungary HUF 485,953 100.00Busdan 32.1 A/S, Kastrup/Denmark DKK 55,027 100.00BUSDAN 34 ApS, Kastrup/Denmark DKK 53,083 100.00BUSDAN 35 ApS, Kastrup/Denmark DKK 25,072 100.00BUSDAN 36 ApS, Kastrup/Denmark DKK 125,642 100.00BUSDAN 37 ApS, Kastrup/Denmark DKK 260,578 100.00BUSDAN 38 ApS, Kastrup/Dänemark DKK 50,921 100.00BUSDAN 39 ApS, Kastrup/Denmark DKK 40,508 100.00Centrebus Holdings Limited, Sunderland/Great Britain GBP 1,317 100.00Classic Coaches (Continental) Limited, Sunderland/Great Britain GBP 0 100.00CSAD MHD Kladno a. s., Kladno/Czech Republic CZK 263,025 100.00DB Regio Tyne and Wear Limited, Sunderland/Great Britain GBP –1,094 100.00EMPRESA DE BLAS Y COMPANIA S. A., Madrid/Spain EUR 124,082 100.00ESFERA BUS S. L., Madrid/Spain EUR 1,737 100.00Estacion de autobuses de Ferrol S. A., Ferrol/Spain EUR 380 80.14Grand Central Railway Company Limited, Sunderland/Great Britain GBP 16,193 100.00Great North Eastern Railway Company Limited, Sunderland/Great Britain GBP 0 100.00Great North Western Railway Company Ltd, Sunderland/Great Britain GBP 0 100.00Greenline Travel Ltd, Sunderland/ Great Britain GBP 8 100.00
Deutsche Bahn Group 2018 Integrated Report
240

Subsidiary Name and registered offices Currency
Share-holders’
equity (TLC) 1)
Owner-ship (%)
INTEGRAL AVTO prodaja, servisi in tehnični pregledi vozil d. o. o., Jesenice/Slovenia EUR 3,315 100.00KD SERVIS a. s., Kladno/Czech Republic CZK 151,320 100.00KM S. P. A., Cremona/Italy EUR 7,798 100.00London and North Western Railway Company Limited, Sunderland/Great Britain GBP 15,562 100.00M40 Trains Limited, Sunderland/Great Britain GBP 77,324 100.00MTL Services Limited, Sunderland/Great Britain GBP 115,999 100.00NETOSEC S. L., Madrid/Spain EUR 278 100.00Network Colchester Limited, Sunderland/Great Britain GBP 0 100.00NV Personeel de Noord-Westhoek, Heerenveen/the Netherlands EUR 421 100.00PAA Pan Alpen Adria Internationale Personenverkehrssysteme GmbH i. L., Ludwigshafen am Rhein EUR 68 78.35Panturist dioničko društvo za prijevoz putnika i turizam d. d., Osijek/Croatia HRK 38,510 99.88Premier Buses Ltd, Sunderland/ Great Britain GBP 2,000 100.00S. A. B. AUTOSERVIZI S. R. L., Bergamo/Italy EUR 47,006 100.00S. I. A. Società Italiana Autoservizi S. P. A., Brescia/Italy EUR 56,892 100.00SAB Piemonte S. r. l. a socio unico, Grugliasco (TO)/Italy EUR 19,294 100.00SAD INVEST, s. r. o., Trnava/Slovakia EUR 1,026 60.50SADEM – SOCIETÀ PER AZIONI, Turin/Italy EUR 18,265 100.00SAVDA Autoservizi Valle d’Aosta S. p. A., Aosta/Italy EUR 18,542 100.00Stevensons of Uttoxeter Limited, Sunderland/Great Britain GBP 1 100.00Teamdeck Limited, Sunderland/Great Britain GBP 0 100.00TGM (Holdings) Limited, Sunderland/Great Britain GBP 0 100.00TGM Operations Limited, Sunderland/Great Britain GBP 0 100.00TGM Services Limited, Sunderland/Great Britain GBP 0 100.00TGM Group Limited, Sunderland/Great Britain GBP 16,577 100.00The Chiltern Railway Company Limited, Sunderland/Great Britain GBP 51,888 100.00Transcare Solutions Limited, Sunderland/Great Britain GBP 599 100.00Transportes Sul do Tejo S. A., Almada/Portugal EUR 2,008 100.00TRANSURBANOS DE GUIMARAES TP, LDA, Guimaraes/Portugal EUR – 558 100.00Trasporti Brescia Nord S. c. a. r. l., Brescia/Italy EUR 100 92.00Trasporti Brescia Sud S. c. a. r. l., Brescia/Italy EUR 100 93.00TUF-TRANSPORTES URBANOS DE FAMALICAO, LDA, Vila Nova de Famalicao/Portugal EUR – 55 66.67UCPLUS A/S, Kastrup/Denmark DKK 15,458 100.00Velebit Turist d. o. o., Gospić/Croatia HRK – 518 78.35VT-ARRIVA Személyszállító es Szolgáltató Kft., Székesfehérvár/Hungary HUF 39,154,598 100.00White Rose Bus Company Limited, Sunderland/Great Britain GBP 0 100.00XC Trains Limited, Sunderland/Great Britain GBP 29,470 100.00Yorkshire Tiger Limited, Sunderland/ Great Britain GBP 5,072 100.00Zeta Automotive Limited, Bicester/Great Britain GBP –1,042 51.00
Subsidiary Name and registered offices Currency
Share-holders’
equity (TLC) 1)
Owner-ship (%)
AT EQUITY
Aquabus BV, Heerenveen/the Netherlands 2), 6) EUR 6,040 50.00ATOC Limited, London/Great Britain 2) GBP –13,646 23.81Autopromet d. d. Slunj, Slunj/Croatia 2), 3) HRK 9,995 21.81Barraqueiro SGPS SA, Lisbon/Portugal 6) EUR 92,096 31.50Bergamo Trasporti Ovest S. c. a. r. l., Bergamo/Italy 3) EUR 10 65.76Bergamo Trasporti Sud Scarl, Bergamo/ Italy 3) EUR 10 25.57Estacion Autobuses de Pobra, Ferrol/ Spain 2), 3) EUR 3 33.33Explotacion Gasoleos de la Coruña, s. l., Ferrol/Spain 2), 3) EUR 135 40.00EXTRA.TO S. c. a. r. l., Turin/Italy 2), 3) EUR 114 30.01Intercambiador de Transportes Principe PIO S. A., Madrid/Spain 2), 3) EUR 8,903 30.00Lecco Trasporti S. c. a. r. l., Lecco/Italy 3) EUR 10 56.94London Overground Rail Operations Limited, London/Great Britain 2), 6) GBP 736 50.00NRES Limited, London/Great Britain 2) GBP 71 25.00Omnibus partecipazioni S. R. L., Mailand/ Italy 2), 3) EUR 8,567 50.00Prometro S. A., Porto/Portugal 2), 3) EUR 6,115 20.00Rail Settlement Plan Limited, London/ Great Britain 2) GBP 621 25.00Rail Staff Travel Limited, London/ Great Britain 2) GBP –2,605 25.00Rodinform – Informatica Aplicada aos Transportes, SA, Lisbon/Portugal 2), 4) EUR –2 20.00S. I. T. VALLEE SOC. CONS. AR. L., CHARVENSOD (AO)/Italy 2), 3) EUR 75 25.00S. T. I. Servizi Trasporti Interregionali SpA, Cordenons PN/Italy 2), 3) EUR 1,248 9.81TPL FVG Scarl s. r. l., Gorizia/Italy 2), 3) EUR 111 15.00Train Information Services Limited, London/Great Britain 2) GBP –36 25.00Trieste Trasporti S. P. A., Trieste/Italy 3) EUR 55,447 39.94Viajeros del Eo, Ferrol/Spain 2), 3) EUR 10 50.00West Yorkshire Ticketing Company Limited, Altrincham/Great Britain 2) GBP 0 42.47WSMR (Holdings) Limited, London/ Great Britain 2), 4) GBP 0 50.00DB C ARGO
FULLY CONSOLIDATED
ATG Autotransportlogistic Sp. z o. o., Malaszewicze/Poland PLN 5,196 100.00Compañía Aragonesa de Portacoches S. A., Saragossa/Spain EUR 7,394 65.28Container-Terminal Púchov s. r. o., Púchov/ Slovakia EUR 131 100.00Corridor Operations DB Cargo B Logistics N. V. i. L., Brussels/Belgium EUR 1,677 51.00DB Cargo (UK) Holdings Limited, Doncaster/Great Britain GBP 178,146 100.00DB Cargo (UK) Limited, Doncaster/Great Britain GBP – 41,264 100.00DB Cargo Aktiengesellschaft, Mainz EUR 351,941 100.00DB Cargo BTT GmbH, Mainz EUR 2,130 100.00DB Cargo Bulgaria EOOD, Sofia/Bulgaria BGN 15,053 100.00DB Cargo Components Limited, Doncaster/Great Britain GBP 8,880 100.00DB Cargo Czechia s. r. o., Ostrava/Czech Republic CZK 22,186 100.00DB Cargo Danmark Services A/S, Taastrup/Denmark DKK 9,109 100.00DB Cargo Eurasia GmbH, Berlin EUR 6,526 90.00
FIN
AN
CIA
L S
TA
TE
ME
NT
S
241
CONSOLIDATED FINANCIAL STATEMENTS — NOTES TO ThE CONSOLIDATED FINANCIAL STATEMENTS
SU
ST
AIN
AB
ILIT
Y

Subsidiary Name and registered offices Currency
Share-holders’
equity (TLC) 1)
Owner-ship (%)
DB Cargo Hungaria Kft., Györ/Hungary HUF 2,156,097 100.00DB Cargo Information Services Limited, Doncaster/Great Britain GBP 2,052 100.00DB Cargo International Limited, Doncaster/Great Britain GBP 24,636 100.00DB Cargo Italia S. r. l., Milan/Italy EUR 16,510 60.00DB Cargo Italia Services S. r. l., Milan/Italy EUR 1,564 100.00DB Cargo Italy S. r. l., Novate Milanese/Italy EUR 10,109 100.00DB Cargo Logistics GmbH, Kelsterbach EUR 56,362 100.00DB Cargo Maintenance Limited, Doncaster/Great Britain GBP 1,154 100.00DB Cargo Nederland N. V., Utrecht/ the Netherlands EUR 2,644 100.00DB Cargo Polska S. A., Zabrze/Poland PLN 326,013 100.00DB Cargo Scandinavia A/S, Taastrup/ Denmark DKK 281,915 100.00DB Cargo Schweiz GmbH, Glattbrugg/Switzerland CHF – 4,992 100.00DB Cargo Services Limited, Doncaster/ Great Britain GBP 709 100.00DB Cargo Spedkol Sp. z o. o., Kędzierzyn-Koźle/Poland PLN 17,944 100.00DB Cargo Vermögensverwaltungs- Aktien gesellschaft, Mainz EUR 50 100.00DB Hungaria Holding Kft., Budapest/Hungary HUF 7,845,629 100.00DB Intermodal Services GmbH, Mainz EUR 10,016 100.00DB PORT SZCZECIN Sp. z o. o., Szczecin/Poland PLN 32,673 96.82Deutsche Bahn Cargo Romania S. R. L., Timişoara/Romania RON –16,112 100.00Deutsche Bahn Iberica Holding, S. L., Barcelona/Spain EUR 95,620 100.00Deutsche TRANSFESA GmbH Internationale Eisenbahn-Spezial-Transporte, Kehl/Rhein EUR 2,382 77.33Doker-Port Sp. z o. o., Szczecin/Poland PLN 1,440 96.82DUSS Italia Terminal s. r. l., Verona/Italy EUR 54 80.00Euro Cargo Rail SAS, Paris/France EUR 32,548 100.00Infra Silesia S. A., Rybnik/Poland PLN 4,752 100.00KombiTerminal Burghausen GmbH, Mainz EUR 1,375 67.62Locomotive 6667 Ltd, Doncaster/ Great Britain GBP 140,751 100.00Locomotive Operating Leasing Partnership, Doncaster/Great Britain GBP 156,272 100.00MDL Distribución y Logistica S. A., Madrid/ Spain EUR 2,433 77.33Mitteldeutsche Eisenbahn GmbH, Schkopau EUR 1,068 80.00New Locomotive Finance Ltd, Doncaster/Great Britain GBP 0 100.00OOO DB Cargo Russija, Moscow/Russia RUB 103,845 100.00OOO Trans-Eurasia Logistics Vostok, Moscow/Russia RUB 576 90.00Rail Express Systems Ltd, Doncaster/ Great Britain GBP 33,440 100.00Rail Service Center Rotterdam B. V., Rotterdam/the Netherlands EUR 3,734 51.00Rail Terminal Services Limited, Doncaster/Great Britain GBP –3,901 100.00RBH Logistics GmbH, Gladbeck EUR 3,954 100.00TFG Transfracht Internationale Gesellschaft für kombinierten Güterverkehr mbH, Mainz EUR 7,195 100.00Transervi S. A., Madrid/Spain EUR 1,898 77.33Transfesa France SAS, Gennevilliers Cedex/France EUR 2,423 77.33Transfesa Portugal Lda., Lisbon/Portugal EUR 346 77.33
Subsidiary Name and registered offices Currency
Share-holders’
equity (TLC) 1)
Owner-ship (%)
Transfesa UK Ltd., Rainham (Essex)/Great Britain GBP 421 77.33Transportes Ferroviarios Especiales S. A., Madrid/Spain EUR 81,682 77.33AT EQUITY
ATN Auto Terminal Neuss GmbH&Co. KG, Neuss 2), 3) EUR 6,823 50.00Autotrax Limited, Fanham/Surrey/ Great Britain 2) GBP 506 24.00baymodal Bamberg GmbH, Bamberg 2), 4) EUR 311 25.10CD-DUSS Terminal, a. s., Lovosice/ Czech Republic 2), 4) CZK 8,702 49.00Container Terminal Dortmund GmbH, Dortmund 2), 3) EUR 4,861 30.88Container Terminal Enns GmbH, Enns/ Austria 2) EUR 10,322 49.00CTS Container-Terminal GmbH Rhein-See-Land-Service, Cologne 2), 3) EUR 1,150 22.50DCH Düsseldorfer Container-Hafen GmbH, Düsseldorf 2), 3) EUR 1,178 51.00Dörpener Umschlaggesellschaft für den kombinierten Verkehr mbH (DUK), Dörpen 2), 3) EUR 5,410 35.00Hispanauto-Empresas Agrupadas A. E. I. E.©, Madrid/Spain 3) EUR 2,076 58.05INTERCONTAINER – INTERFRIGO SA i. L., Brussels/Belgium 2), 7) EUR –21,433 36.77Kombiverkehr Deutsche Gesellschaft für kombinierten Güterverkehr mbH&Co. Kommanditgesellschaft, Frankfurt am Main 2), 3) EUR 18,525 50.00Lokomotion Gesellschaft für Schienentraktion mbH, Munich 2), 3) EUR 12,081 30.00Mediterranean Hub Monfalcone S. r. l., Monfalcone/Italy EUR – 49.00OFP ATLANTIQUE SAS, La Rochelle/ France 2), 4) EUR 756 24.90OPTIMODAL NEDERLAND B. V., Rotterdam/ the Netherlands 2), 3) EUR 740 24.34PKV Planungsgesellschaft kombinierter Verkehr Duisburg mbH, Duisburg 2), 3) EUR 1,833 50.00Pool Ibérico Ferroviario A. I. E., Madrid/ Spain 3) EUR – 852 9.02SLASKIE CENTRUM LOGISTYKI S. A., Gliwice/Poland 2), 3) PLN 51,023 20.55Sociedad de Estudios y Explotacion de Material Auxiliar de Transportes, S. A. (“SEMAT”), Madrid/Spain 3) EUR 7,321 48.56Stifa S. A. i. L., Malveira/Portugal 3) EUR – 85 38.67Terminal Singen TSG GmbH, Singen 2), 3) EUR 714 50.00Xrail AG, Basel-Stadt/Switzerland 2), 3) CHF 420 36.80DB S CHENKER
FULLY CONSOLIDATED
Air Terminal Handling S. A., Tremblay en France/France EUR 2,618 100.00Almoayed Schenker W. L. L., Manama/Bahrain BHD 897 51.00Anterist + Schneider Zeebrugge B. V., Zeebrugge/Belgium EUR 1,245 100.00AO Schenker, Moscow/Russia RUB 173,157 100.00AS Schenker, Tallinn/Estonia EUR 8,233 100.00ASIMEX Anterist + Schneider Import – Export SAS, Stiring-Wendel/France EUR 1,641 100.00ATLANTIQUE EXPRESS SAS, Montaigu Cedex/France EUR 804 100.00BAX Global (Malaysia) Sdn. Bhd., Petaling Jaya/Malaysia MYR 231 100.00BAX Global (Pty.) Ltd., Johannesburg/ South Africa ZAR 968 86.75
Deutsche Bahn Group 2018 Integrated Report
242

Subsidiary Name and registered offices Currency
Share-holders’
equity (TLC) 1)
Owner-ship (%)
Bischof Gesellschaft mbH., Vienna/Austria EUR 72 100.00BTL Reinsurance S. A., Luxembourg/Luxembourg SEK 39,860 100.00Cartrend GmbH, Karlsruhe EUR 21 69.00DB France Holding SAS, Gennevilliers Cedex/France EUR 253,855 100.00DB Polska Holding Sp. z o. o., Zabrze/Poland PLN 1,424,434 100.00DB Schenker (Cambodia) Limited, Phnom Penh/Cambodia USD 3,186 100.00DB Schenker FLLC, Minsk/Belarus (Belarus) BYN – 88 100.00DB Schenker GBS Bucharest S. R. L., Bucharest/Romania RON 9,970 100.00DB Schenker Global Services Asia Pacific Inc., Taguig City/Philippines PHP 534,002 100.00DB Schenker Logistics Campus NMEA (Pty) Ltd., Kempton Park/South Africa ZAR 12,130 47.00DP Schenker, Kiev/Ukraine UAH 1,275 100.00DVA Marine Re S. A., Luxembourg/Luxembourg EUR 19,576 65.00ELAG Emder Lagerhaus und Automotive GmbH, Emden EUR 1,201 100.00Engelberg Transportes Internacionales C. A. (Entra), Caracas/Venezuela VES 1,694,440 100.00EVAG Emder Verkehrs und Automotive Gesellschaft mbH, Emden EUR 5,578 100.00EVB Handelshaus Bour GmbH, Landau in der Pfalz EUR 25 69.00Fastighets Aktiebolaget Orbyn, Gothenburg/Sweden SEK 9,464 100.00HANGARTNER Terminal AG i. L., Zurich/Switzerland CHF 0 100.00HANGARTNER Terminal S. r. l., Verona/Italy EUR 1,750 100.00Heck Slovensko s. r. o., Bratislava/Slovakia EUR 5 100.00Intertec Asia Limited, Hong Kong/China HKD 7,079 69.00Intertec Beteiligungs-GmbH, Landau in der Pfalz EUR 30,387 69.00Intertec GmbH, Landau in der Pfalz EUR 26 69.00INTERTEC Polska Sp.z o. o., Nardarzyn/Poland PLN 1,901 69.00Inter-Union Technohandel Gesellschaft m. b. H., Vienna/Austria EUR 17 69.00Inter-Union Technohandel GmbH, Landau in der Pfalz EUR 26 69.00Intreprinderea Mixta “S. C. Schenker” S. R. L., Chisinau/Moldova MDL 617 96.69Karpeles Flight Services (H. K.) Limited, Hong Kong/China HKD 13,686 100.00Karpeles Flight Services GmbH, Frankfurt am Main EUR 1,598 100.00Karpeles Freight Services Inc., Delaware/USA USD –213 100.00KB Ädelgasen 1 -Jönköping, Jönköping/Sweden SEK 95,569 100.00KB Älghunden Jönköping, Jönköping/Sweden SEK 20,623 100.00KB Älghunden 1 -Jönköping, Jönköping/Sweden SEK 22,410 100.00KB Anholt 3, Stockholm/Sweden SEK 9,106 100.00KB Arbetsbasen 4 -Stockholm, Stockholm/Sweden SEK 36,714 100.00KB Ättehögen Östra 1 -Helsingborg, Helsingborg/Sweden SEK 66,605 100.00KB Backa 107:3, Göteborg/Sweden SEK 140,140 100.00KB Baggböle 2:35 -Umeå, Umeå/Sweden SEK 25,220 100.00KB Benkammen 12 -Malmö, Malmö/Sweden SEK 135,242 100.00KB Bleket 1 -Karlstad, Karlstad/Sweden SEK 46,184 100.00
Subsidiary Name and registered offices Currency
Share-holders’
equity (TLC) 1)
Owner-ship (%)
KB Distributören 3 och 4 -Örebro, Örebro/Sweden SEK 83,934 100.00KB Forsmark 2 -Stockholm, Stockholm/Sweden SEK 58,233 100.00KB Forsmark 3 -Stockholm, Stockholm/Sweden SEK 180,501 100.00KB Forsmark 5 Stockholm, Gothenburg/Sweden SEK 449 100.00KB Frysen 1 Visby, Visby/Sweden SEK 13,272 100.00KB Fryshuset 3-Visby, Visby/Sweden SEK 1,029 100.00KB Köpmannen 10 -Västerås, Västerås/Sweden SEK 35,201 100.00KB Kungsängen 28:1 -Uppsala, Uppsala/Sweden SEK 11,356 100.00KB Langtradaren 2 Borlänge, Borlänge/Sweden SEK 34,505 100.00KB Lertaget 1, Skara, Skara/Sweden SEK 46,921 100.00KB Malmö Hamnen 22 Malmö, Malmö/Sweden SEK 62,240 100.00KB Maskinen 3 -Linköping, Linköping/Sweden SEK 62,610 100.00KB Önnestad 108:4 -Kristianstad, Kristianstad/Sweden SEK 42,520 100.00KB Överön 1:66 -Örnsköldsvik, Örnsköldsvik/Sweden SEK 10,341 100.00KB Pantern 1 -Växjö, Växjö/Sweden SEK 37,139 100.00KB Reläet 8 -Norrköping, Norrköping/Sweden SEK 25,471 100.00KB Sörby 24:3 -Gävle, Gävle/Sweden SEK 39,319 100.00KB Storheden 1:8 -Luleå, Luleå/Sweden SEK 30,736 100.00KB Tingstadsvassen 31:3 -Göteborg, Gothenburg/Sweden SEK 20,344 100.00KB Transporten 1 -Hultsfred, Hultsfred/Sweden SEK 19,048 100.00KB Transportören 1 -Värnamo, Värnamo/Sweden SEK 87,453 100.00KB Viken 3 -Karlshamn, Karlshamn/Sweden SEK 11,279 100.00KB Vindtrycket 1 -Borås, Borås/Sweden SEK 67,554 100.00KB Vivstamon 1:13 -Timrå, Timrå/Sweden SEK 49,550 100.00Kiinteistö Oy Porin Kiitolinja, Pori/Finland EUR 113 100.00Kiinteistö Oy Seinäjoen Kiitolinja-asema, Seinäjoki/Finland EUR 467 100.00Kiinteistö Oy Tampereen Rahtiasema, Tampere/Finland EUR 1,164 100.00Kiinteistö Oy Tir-Trans, Joentaustankatu/ Finnland EUR 898 100.00Kiinteistö Oy Turun Nosturinkatu 6, Turku/Finnland EUR 1,051 100.00Kiinteistömaaliikenne Oy, Helsinki/Finland EUR 2,529 54.70Langtradaren i Jämtland AB, Gothenburg/Sweden SEK 8,160 100.00LogCap Immorent Uno s. r. o., Bratislava/Slovakia EUR 2,264 100.00LogCap-IR Grundverwertungsgesellschaft m. b. H., Vienna/Austria EUR 5,845 100.00Luxemburger Transport Logistik Diekirch S. A., Wilwerdange/Luxembourg EUR 1,522 100.00MTS HandelService GmbH, Landau in der Pfalz EUR 26 69.00MTS MarkenTechnikService GmbH&Co. KG, Karlsruhe EUR 57,846 69.00MTS MarkenTechnikService Verwaltungs- GmbH, Karlsruhe EUR 127 69.00PT. Schenker Petrolog Utama, Jakarta/Indonesia USD 26,548 71.00Redhead Freight Limited, Bradford/Great Britain GBP 11,158 100.00
FIN
AN
CIA
L S
TA
TE
ME
NT
S
243
CONSOLIDATED FINANCIAL STATEMENTS — NOTES TO ThE CONSOLIDATED FINANCIAL STATEMENTS
SU
ST
AIN
AB
ILIT
Y

Subsidiary Name and registered offices Currency
Share-holders’
equity (TLC) 1)
Owner-ship (%)
Redhead Holdings Limited, Bradford/Great Britain GBP –202 100.00Rengaslinja Oy, Helsinki/Finland EUR 587 100.00S. B. International Freight Limited, Christchurch/New Zealand NZD 0 100.00SCHENKER&CO AG, Vienna/Austria EUR 123,397 100.00Schenker (Asia Pacific) Pte. Ltd., Singapore/Singapore SGD 775,226 100.00Schenker (H. K.) Ltd., Hong Kong/China HKD 124,909 100.00Schenker (Ireland) Ltd., Shannon/Ireland EUR 18,186 100.00Schenker (L. L. C), Dubai/United Arab Emirates AED 192,222 100.00Schenker (Lao) Sole Co., Ltd., Vientiane/Laos LAK 1,951,596 100.00Schenker (NZ) Limited, Auckland/New Zealand NZD 17,956 100.00Schenker (Thai) Holdings Ltd., Bangkok/Thailand THB 448,385 100.00Schenker (Thai) Ltd., Bangkok/Thailand THB 1,797,799 100.00Schenker A. E., Athens/Greece EUR –245 100.00Schenker A/S, Hvidovre/Denmark DKK 105,379 100.00Schenker AB, Gothenburg/Sweden SEK 108,338 100.00Schenker AG&Co. Beteiligungsverwaltungs OHG, Essen EUR 172 100.00Schenker Åkeri AB, Gothenburg/Sweden SEK 118,936 100.00Schenker Aktiengesellschaft, Essen EUR 1,632,775 100.00Schenker Americas, Inc., Wilmington/USA USD 175,124 100.00Schenker Angola, Limitada, Luanda/Angola AOA 196,871 99.90Schenker Argentina S. A., Buenos Aires/Argentina ARS 41,405 100.00Schenker AS, Oslo/Norway NOK 650,661 100.00Schenker Australia Pty. Ltd., Alexandria/Australia AUD 146,800 100.00Schenker BITCC Customs Broker (Beijing) Co. Ltd., Beijing/China CNY 728 70.00Schenker BITCC Logistics (Beijing) Co., Ltd., Beijing/China CNY 88,174 70.00Schenker Business Services LLC, Moscow/Russia RUB 178,932 100.00Schenker Chile S. A., Santiago/Chile CLP 4,911,939 100.00Schenker China Ltd., Pudong/Shanghai/China CNY 1,823,449 100.00Schenker Consulting AB, Gothenburg/Sweden SEK 8,349 100.00Schenker d. d., Ljubljana/Slovenia EUR 20,857 100.00SCHENKER d. o. o., Sarajevo/Bosnia-Herzegovina BAM 1,184 100.00Schenker d. o. o., Rugvica/Croatia HRK 13,435 100.00Schenker d. o. o., Novi Banovci/Serbia RSD 150,876 100.00Schenker Dedicated Services AB, Gothenburg/Sweden SEK 18,746 100.00Schenker Dedicated Services Germany GmbH, Essen EUR 1,345 100.00Schenker Deutschland AG, Frankfurt am Main EUR 64 100.00Schenker Distribution Solutions, Inc., Paranaque City/Philippines PHP 108,729 98.51Schenker do Brasil Transportes Internacionais Ltda., São Paulo/Brazil BRL 23,343 100.00SCHENKER DOOEL, Skopje/Macedonia MKD 74,709 100.00Schenker Egypt Ltd., Cairo/Egypt EGP 75,203 100.00SCHENKER EOOD, Sofia/Bulgaria BGN 32,807 100.00Schenker Equipment AB, Gothenburg/Sweden EUR 8,462 100.00
Subsidiary Name and registered offices Currency
Share-holders’
equity (TLC) 1)
Owner-ship (%)
Schenker Europe GmbH, Frankfurt am Main EUR 25 100.00Schenker Filen 8 Aktiebolag, Gothenburg/Sweden SEK 17,541 100.00SCHENKER FRANCE SAS, Montaigu Cedex/France EUR 184,695 100.00Schenker Global Management&Services GmbH, Essen EUR –11,146 100.00Schenker Global Management&Services PTE LTD., Singapore/Singapore SGD –7 100.00Schenker Global Management&Technology Center Americas Inc., Wilmington/USA USD 173 100.00Schenker GmbH für Beteiligungen, Essen EUR 65 100.00SCHENKER INDIA PRIVATE LIMITED, New Delhi/India INR 3,001,683 100.00Schenker International (HK) Ltd., Hong Kong/China HKD 1,654,839 100.00Schenker International (Macau) Ltd., Macau/Macau HKD 32,171 100.00Schenker International S. A. de C. V., Mexico City/Mexico MXN 708,298 100.00Schenker Italiana S. p. A., Peschiera Borromeo (MI)/Italy EUR 65,954 100.00Schenker Jinbei Logistics (Shenyang) Co. Ltd., Shenyang/China CNY 170,253 50.00Schenker Khimji’s LLC, Maskat/Sultanate of Oman OMR 1,176 60.00Schenker Korea Ltd., Seoul/Republic of Korea KRW 38,740,725 100.00Schenker Limited, London/Great Britain GBP 27,941 100.00Schenker Limited, Nairobi/Kenya KES 206,255 100.00Schenker Logistics (Chengdu) Co., Ltd., Chengdu/China CNY –1,988 100.00Schenker Logistics (Chongqing) Co. Ltd, Chongqing/China CNY 25,435 100.00Schenker Logistics (Guangzhou) Company Ltd., Guangzhou/China CNY 88,228 100.00Schenker Logistics (Kunshan) Co., Ltd., Kunshan/China CNY 31,492 100.00Schenker Logistics (Malaysia) Sdn Bhd., Kuala Lumpur/Malaysia MYR 273,247 100.00Schenker Logistics (Shanghai) Co., Ltd., Shanghai/China CNY 113,868 100.00Schenker Logistics (Shenzhen) Co. Ltd., Shenzhen/China CNY 28,734 100.00Schenker Logistics (Suzhou) Company Ltd., Suzhou/China CNY 101,882 100.00Schenker Logistics (Thai) Ltd., Bangkok/Thailand THB 6,982 100.00Schenker Logistics (Xiamen) Co. Ltd., Xiamen/China CNY 65,082 100.00Schenker Logistics AB, Gothenburg/Sweden SEK –15,967 100.00Schenker Logistics Inc., Calamba City/Philippines PHP 7,034 100.00Schenker Logistics L. L. C., Abu Dhabi/United Arab Emirates AED 52,115 100.00Schenker Logistics Nederland B. V., Rotterdam/the Netherlands EUR 62,277 100.00Schenker Logistics Romania S. A., Bucharest/Romania RON 334,202 99.47Schenker Logistics S. A., Barcelona/Spain EUR 125,166 100.00Schenker Logistics Vietnam Co., Ltd., Ho Chi Minh City/Vietnam VND 62,203,839 100.00Schenker Logistics W. L. L., Doha/Qatar QAR –1,696 60.00SCHENKER LUXEMBURG GMBH, Leudelange/Luxembourg EUR 2,392 100.00Schenker Manila Administrative Competence Center Inc., Taguig City/Philippines PHP 34,723 100.00
Deutsche Bahn Group 2018 Integrated Report
244

Subsidiary Name and registered offices Currency
Share-holders’
equity (TLC) 1)
Owner-ship (%)
Schenker Maroc S. A. S, Casablanca/Morocco MAD 21,247 100.00Schenker Middle East FZE, Dubai/United Arab Emirates AED 363,056 100.00Schenker Myanmar Co., Ltd., Yangon/Myanmar MMK 1,809,390 100.00Schenker Namibia (Pty) Ltd., Windhoek/Namibia NAD 7,781 100.00Schenker Nederland B. V., Tilburg/the Netherlands EUR 15,483 100.00Schenker Nemzetközi Szállítmányozási és Logisztikai Kft., Szigetszentmiklos/Hungary HUF 6,661,574 100.00Schenker NV, Antwerp/Belgium EUR 25,099 100.00Schenker of Canada Ltd., Toronto/Canada CAD 65,781 100.00Schenker OY, Helsinki/Finland EUR 86,058 100.00Schenker Panama S. A., Panama City/Panama USD 1,658 100.00Schenker Peru S. R. L., Lima/Peru PEN 1,729 100.00Schenker Philippines, Inc., Makati City/Philippines PHP 758,170 100.00Schenker Property Sweden AB, Gothenburg/Sweden SEK 107,913 100.00SCHENKER RE DESIGNATED ACTIVITY COMPANY, Dublin/Ireland EUR 42,080 100.00Schenker S. A., Guatemala City/Guatemala GTQ –20,499 100.00SCHENKER s. r. o., Bratislava/Slovakia EUR 4,641 100.00Schenker Saudi Arabia LLC, Riyadh/Saudi Arabia SAR 32,721 100.00Schenker Schweiz AG, Zurich/Switzerland CHF 53,006 100.00Schenker Shared Services (Nanjing) Co. Ltd., Nanjing/China CNY 29,516 100.00Schenker Singapore (PTE) Ltd., Singapore/Singapore SGD 275,097 100.00Schenker South Africa (Pty) Ltd., Isando/South Africa ZAR 218,799 86.75Schenker Sp. z o. o., Warsaw/Poland PLN 283,741 99.67SCHENKER spol. s r. o., Prague/Czech Republic CZK 712,365 100.00Schenker Technik GmbH, Essen EUR 5,025 100.00Schenker Technology Center (Warsaw) sp. z o. o., Warsaw/Poland PLN 4,182 100.00Schenker Transitarios, S. A., Loures/Portugal EUR 12,401 100.00Schenker Transport Aktiebolag, Gothenburg/Sweden SEK 71,072 100.00Schenker Transport Groep B. V., Tilburg/the Netherlands EUR 4,737 100.00Schenker Vietnam Co., Ltd., Ho Chi Minh City/Vietnam VND 549,174,310 100.00Schenker, Inc., New York/USA USD 116,246 100.00Schenker-Arkas Nakliyat Ve Tic. A .S., Zincirlikuyu/Turkey TRY 108,273 55.00Schenker-BTL Ltd., London/Great Britain GBP 0 100.00Schenkerocean Ltd, Wanchai/China HKD 5,998 100.00Schenker-Seino Co. Ltd., Tokyo/Japan JPY 5,989,010 80.00SIA Schenker, Riga/Latvia EUR 6,188 100.00Sky Partners OÜ, Tallinn/Estonia EUR 133 100.00SPA Systems s. r. o. i. L., Prague/Czech Republic CZK 2,022 69.00SW Zoll-Beratung GmbH, Furth im Wald EUR 3,601 100.00TEGRO AG, Schwerzenbach/Switzerland CHF 9,220 62.10Trafikaktiebolaget NP Kagström, Gothenburg/Sweden SEK 1,410 100.00TRANSA Spedition GmbH, Offenbach am Main EUR 13,763 100.00
Subsidiary Name and registered offices Currency
Share-holders’
equity (TLC) 1)
Owner-ship (%)
Transport-Gesellschaft mit beschränkter Haftung (vormals J. Hevecke TRG), Hamburg EUR 496 96.70Transworld Asig – Broker de Asigurare SRL, Bucharest/Romania RON 639 99.47UAB “Schenker,” Vilnius/Lithuania EUR 699 100.00Viktor E. Kern Gesellschaft m. b. H., Vienna/Austria EUR 1,543 69.00AT EQUITY
ADRIA KOMBI d. o. o., Ljubljana, Ljubljana/Slovenia 2), 3) EUR 10,898 33.72ATS Air Transport Service AG, Zurich/Switzerland 2), 3) CHF 2,685 26.00Autoport Emden GmbH, Emden 2), 3) EUR 188 33.30Bäckebols Åkeri AB, Gothenburg/Sweden 2), 3) SEK 49,597 35.00BTU – Bilspedition Transportörer Utvecklings AB, Solna/Sweden 2), 3) SEK 6,368 50.00Elevator-Gesellschaft mit beschränkter Haftung, Hanover 2) EUR 111 50.00Express Air Systems GmbH (EASY), Kriftel 2), 3) EUR 4,415 50.00Gardermoen Perishables Center AS, Gardermoen/Norway 2), 3) NOK 10,914 33.30Germans Corbalan&Alvarez, S. L., Manresa (Barcelona)/Spain 2), 3) EUR 954 20.00I. M. “Moldromukrtrans” S. R. L., Chisinau/Moldova 2), 3) MDL 14,153 33.15Intermodal Sea Solutions, S. L., Orejo-Cantabria/Spain 3) EUR –307 24.75Trans Jelabel S. L., Aldeamayor de San Martin/Spain 2), 3) EUR 830 20.00Transatlantic Shipping and Trading SRL, Bucharest/Romania 2), 3) RON 5,176 49.73Värnamo Åkeri AB, Värnamo/Sweden 2), 3) SEK 18,397 50.00Volla Eiendom AS, Oslo/Norway 2), 3) NOK 13,858 50.00DB NETZE TR ACK
FULLY CONSOLIDATED
DB Fahrwegdienste GmbH, Berlin EUR 2,765 100.00DB Netz Aktiengesellschaft, Frankfurt am Main EUR 8,628,426 100.00DB RegioNetz Infrastruktur GmbH, Frankfurt am Main EUR 3,571 100.00Deutsche Umschlaggesellschaft Schiene – Straße (DUSS) mbH, Bodenheim am Rhein EUR 1,653 87.50MegaHub Lehrte Betreibergesellschaft mbH, Hanover EUR 262 65.62AT EQUITY
EEIG Corridor Rhine – Alpine EWIV, Frankfurt am Main 2), 4) EUR 0 25.00EWIV Atlantic Corridor, Paris/France 2), 3) EUR 0 25.00Güterverkehrszentrum Entwicklungs-gesellschaft Dresden mbH, Dresden 2), 4) EUR 3,475 24.53TIA GmbH, Augsburg 2), 4) EUR 289 42.88TKN Terminal Köln-Nord GmbH, Cologne 2), 8) EUR 6 42.88TriCon Container-Terminal Nürnberg GmbH, Nuremberg 2), 3) EUR 2,196 21.88DB NETZE STATION S
FULLY CONSOLIDATED
DB BahnPark GmbH, Berlin EUR 6,473 51.00DB Station&Service Aktiengesellschaft, Berlin EUR 1,486,225 100.00MEKB GmbH, Berlin EUR 32 100.00Station Food GmbH, Berlin EUR 1,835 51.00AT EQUITY
Clever Order Services GmbH, Berlin 2), 6) EUR 200 25.00
FIN
AN
CIA
L S
TA
TE
ME
NT
S
245
CONSOLIDATED FINANCIAL STATEMENTS — NOTES TO ThE CONSOLIDATED FINANCIAL STATEMENTS
SU
ST
AIN
AB
ILIT
Y

Subsidiary Name and registered offices Currency
Share-holders’
equity (TLC) 1)
Owner-ship (%)
DB NETZE ENERGY
FULLY CONSOLIDATED
DB Energie GmbH, Frankfurt am Main EUR 423,215 100.00AT EQUITY
inno2grid GmbH, Berlin 2), 3) EUR 134 50.00OTHER SUB SIDIAR IE S
FULLY CONSOLIDATED
BAX Global Inc., Norfolk/USA USD 82,288 100.00DB (UK) Investments Limited, Sunderland/Great Britain GBP 816,538 100.00DB Bahnbau Gruppe GmbH, Berlin EUR 28,654 100.00DB Barnsdale AG, Berlin EUR 12,079 100.00DB Cargo Belgium BVBA, Antwerp/Belgium EUR 5,743 100.00DB Competition Claims GmbH, Berlin EUR 18,125 100.00DB Czech Holding s. r. o., Rudná/Czech Republic CZK 439,126 100.00DB Danmark Holding ApS, Hvidovre/Denmark DKK 380,198 100.00DB Dialog GmbH, Berlin EUR 1,125 100.00DB Engineering&Consulting GmbH, Berlin EUR 90,297 100.00DB Engineering&Consulting USA Inc., Delaware/USA USD – 406 100.00DB Fahrzeuginstandhaltung GmbH, Frankfurt am Main EUR 244,439 100.00DB FuhrparkService GmbH, Frankfurt am Main EUR 78,456 100.00DB Gastronomie GmbH, Frankfurt am Main EUR 17,139 100.00DB International (Beijing) Co., Ltd., Beijing/China CNY 3,909 100.00DB International Brasil Servicos de Consultoria Ltda., Rio de Janeiro/Brazil BRL 234 100.00DB JobService GmbH, Berlin EUR – 4,444 100.00DB Kommunikationstechnik GmbH, Berlin EUR 3,935 100.00DB Media&Buch GmbH, Kassel EUR 26 100.00DB Mobility Services Austria GmbH i. L., Vienna/Austria EUR 560 100.00DB Projekt Stuttgart-Ulm GmbH, Stuttgart EUR 2,287 100.00DB Schweiz Holding AG, Zug/Switzerland CHF 126,516 100.00DB Services GmbH, Berlin EUR 13,277 100.00DB Sicherheit GmbH, Berlin EUR 2,162 100.00DB Systel GmbH, Frankfurt am Main EUR 79,015 100.00DB Systel UK Limited, Doncaster/Great Britain GBP 1,143 100.00DB Systemtechnik GmbH, Minden EUR 781 100.00DB US Corporation, Tarrytown/USA USD 463,383 100.00DB US Holding Corporation, Tarrytown/USA USD 470,344 100.00DB Vertrieb GmbH, Frankfurt am Main EUR 79,036 100.00DB Verwaltungsgesellschaft WBN mbH, Niesky EUR –26,239 100.00DB Zeitarbeit GmbH, Berlin EUR 28 100.00Deutsche Bahn Connect GmbH, Frankfurt am Main EUR 8,032 100.00Deutsche Bahn Digital Ventures GmbH, Berlin EUR 25,933 100.00Deutsche Bahn Finance GmbH, Berlin EUR 67,789 100.00Deutsche Bahn International Operations GmbH, Berlin EUR 2,705 100.00Deutsche Bahn Stiftung gGmbH, Berlin EUR 3,784 100.00DVA Deutsche Verkehrs-Assekuranz- Vermittlungs-GmbH, Bad Homburg v. d. Höhe EUR 2,001 65.00
Subsidiary Name and registered offices Currency
Share-holders’
equity (TLC) 1)
Owner-ship (%)
DVA REINSURANCE DESIGNATED ACTIVITY COMPANY, Dublin/Ireland EUR 4,862 65.00Engineering Support Group Ltd, Doncaster/Great Britain GBP – 965 100.00infraView GmbH, Mainz EUR 4,601 100.00Innovationszentrum für Mobilität und gesellschaftlichen Wandel (InnoZ) GmbH, Berlin EUR –1,413 76.99ioki GmbH, Frankfurt am Main EUR 4,025 100.00Mobimeo GmbH, Berlin EUR 10,025 100.00Precision National Plating Services, Inc., Delaware/USA USD –26,459 100.00QT Mobilitätsservice GmbH, Berlin EUR 2,744 85.00Railway Approvals Germany GmbH, Minden EUR 50 100.00Railway Approvals Ltd, Doncaster/Great Britain GBP 288 100.00Schenker (BAX) Holding Corp., Delaware/USA USD 92,244 100.00UBB Polska Sp.z o. o., Swinemünde/Poland PLN 1,065 100.00UBB Usedomer Bäderbahn GmbH, Heringsdorf EUR 7,716 100.00Unterstützungskasse der Firma H. M. Gehrckens Gesellschaft mit beschränkter Haftung i. L., Berlin EUR 6 100.00PRO R ATA
Etihad Rail DB Operations LLC, Abu Dhabi/United Arab Emirates AED 147 49.00AT EQUITY
BahnflächenEntwicklungsGesellschaft NRW mbH, Essen 2), 3) EUR 441 49.90Beijing HuaJing DeBe International Engineering Consulting Co., Ltd, Beijing/China 2), 6) CNY 6,084 25.00BwFuhrparkService GmbH, Troisdorf 2), 3) EUR 433,071 24.90EUROFIMA Europäische Gesellschaft für die Finanzierung von Eisenbahnmaterial, Basel/Switzerland 6) CHF 1,646,490 22.60Rail Technology Company Limited,Jeddah/Saudi Arabia 2), 3) SAR 7,892 24.90SSG Saar-Service GmbH, Saarbrücken 2), 4) EUR 1,375 25.50Stinnes Holz GmbH, Berlin 2), 4) EUR 79 53.00FAIR VALUE
GHT Mobility GmbH, Berlin 2), 3) EUR 390 83.87TREMA Grundstücks-Vermietungsgesellschaft mbH&Co. Objekt Bahnhöfe West KG, Berlin 2), 3) EUR 4,199 94.00TRENTO Grundstücks-Vermietungsgesellschaft mbH&Co. Objekt Bahnhöfe Ost KG i. L., Düsseldorf 2), 3) EUR –1 100.00
1) IFRS data.2) Figures reflect accounting according to local accounting principles
(in the case of companies governed by profit and loss transfer agreements, only in relation to net profit/net loss).
3) Data: 2017 financial year.4) Data: 2016 financial year.5) Data: 2015 financial year.6) Preliminary data.7) Data: 2014 financial year.8) Data from liquidation balance sheet as of July 1, 2018.
Deutsche Bahn Group 2018 Integrated Report
246

(43) Management Board and Supervisory BoardDetails of the names and memberships in (a) other supervisory boards
which are legally required to be created and (b) equivalent domestic and
international control bodies of economic enterprises of members of the
Management Board and the Supervisory Board of DB AG are set out in
the following.
Management BoardDr. Richard LutzChief Executive Officer and Chairman of the Management Board,
Berlin
a) ◊ Schenker AG (until March 31, 2018; Chairman)
◊ DEVK Deutsche Eisenbahn Versicherung
Lebensversicherungsverein a. G.
Betriebliche Sozialeinrichtung der Deutschen Bahn
◊ DEVK Deutsche Eisenbahn Versicherung
Sach- und HUK- Versicherungsverein a. G.
Betriebliche Sozialeinrichtung der Deutschen Bahn
◊ Deutsche Bahn Digital Ventures GmbH
(until April 12, 2018; Chairman)
b) ◊ DB Stiftung gGmbH (Advisory Board; Chairman)
Alexander Doll (since April 1, 2018)Finance, Freight Transport and Logistics,
Bad Homburg
a) ◊ Schenker AG (since April 1, 2018; Chairman)
◊ DB Cargo AG (since April 1, 2018; Chairman since April 15, 2018)
b) ◊ Arriva Plc, Sunderland/Great Britain
(since April 1, 2018, non-executive Director)
Berthold HuberPassenger Transport,
Weilheim
a) ◊ DB Vertrieb GmbH (Chairman) ◊ DB Fernverkehr AG (Chairman) ◊ DB Regio AG (Chairman) ◊ DB Cargo AG (Chairman until March 31, 2018) ◊ DB Fahrzeuginstandhaltung GmbH (Chairman) ◊ Arriva Plc, Sunderland/Great Britain
(Chairman of the Board of Directors)
◊ DEVK Allgemeine Lebensversicherungs AG
Prof. Dr. Sabina JeschkeDigitalization and Technology,
Berlin
a) ◊ Schenker AG (since January 1, 2018)
◊ DB Systemtechnik GmbH
(since May 1, 2018; Chairwoman since May 4, 2018)
◊ DB Systel GmbH
(since February 5, 2018; Chairwoman since July 4, 2018)
◊ Körber AG
Ronald PofallaInfrastructure,
Mülheim an der Ruhr
a) ◊ DB Netz AG (since January 1, 2018; Chairman)
◊ Deutsche Bahn Digital Ventures GmbH
(until April 13, 2018; Deputy Chairman)
◊ DEVK Rückversicherungs- und Beteiligungs-AG
b) ◊ Verband der Sparda-Banken e. V. (Advisory Board)
◊ Initiativkreis Ruhr GmbH
(since April 14, 2018; Advisory Board)
Martin Seiler (since January 1, 2018)Human Resources and Legal Affairs,
Unkel
a) ◊ Schenker AG
◊ DB Cargo AG (since January 8, 2018)
◊ DB Gastronomie GmbH (since January 9, 2018; Chairman)
◊ DB JobService GmbH (since January 9, 2018; Chairman)
◊ DB Zeitarbeit GmbH (since January 9, 2018; Chairman)
◊ DB Station&Service AG (since January 8, 2018; Chairman)
◊ DB Energie GmbH (since January 25, 2018; Chairman)
◊ DEVK Deutsche Eisenbahn Versicherung
Lebens versicherungsverein a. G.
Betriebliche Sozialeinrichtung der Deutschen Bahn
(since May 30, 2018)
◊ DEVK Deutsche Eisenbahn Versicherung
Sach- und HUK-Versicherungsverein a. G.
Betriebliche Sozialeinrichtung der Deutschen Bahn
(since May 30, 2018)
b) ◊ DB Stiftung gGmbH (since January 16, 2018; Advisory Board)
◊ Enquete-Kommission Berufliche Bildung
Supervisory BoardMichael OdenwaldSecretary of State (retired)
Chairman of the Supervisory Board (since April 17, 2018),
Kleinmachnow
a) ◊ Fraport AG
Alexander Kirchner*Deputy Chairman of the Supervisory Board,
Chairman of Eisenbahn- und Verkehrsgewerkschaft (EVG),
Runkel
a) ◊ DEVK Deutsche Eisenbahn Versicherung
Lebensversicherungsverein a. G.
Betriebliche Sozialeinrichtung der Deutschen Bahn (Chairman) ◊ DEVK Deutsche Eisenbahn Versicherung
Sach- und HUK-Versicherungsverein a. G.
Betriebliche Sozialeinrichtung der Deutschen Bahn (Chairman) ◊ DEVK Rückversicherungs- und Beteiligungs-AG (Chairman)
b) ◊ DB Stiftung gGmbH (Advisory Board)
FIN
AN
CIA
L S
TA
TE
ME
NT
S
247
CONSOLIDATED FINANCIAL STATEMENTS — NOTES TO ThE CONSOLIDATED FINANCIAL STATEMENTS
SU
ST
AIN
AB
ILIT
Y

Uwe Beckmeyer (until April 30, 2018)Parliamentary Secretary of State in the Federal Ministry
of Economics and Energy,
Bremerhaven
Guido Beermann (since April 11, 2018)Secretary of State in the Federal Ministry of Transport
and Digital Infrastructure,
Kleinmachnow
a) ◊ Flughafen München GmbH (since August 29, 2018)
Jürgen Beuttler*Head of Purchasing, Real Estate, Compliance of DB Fernverkehr AG,
Wiesbaden
Prof. Dr. Dr. Utz-Hellmuth Felcht (until March 31, 2018)Chairman of the Supervisory Board,
Munich
a) ◊ KMW + NEXTER Defense Systems N. V.
(Independent non-executive Director)
b) ◊ DB Stiftung gGmbH (until March 5, 2018; Advisory Board)
Dr. Michael Frenzel (until July 18, 2018)President of the Bundesverband der Deutschen Tourismuswirtschaft e. V.,
Burgdorf
b) ◊ AMEX GBT III B. V. (Board of Directors)
Dr.-Ing. Jürgen Großmann (until July 18, 2018)Shareholder Georgsmarienhütte Holding GmbH,
Hamburg
a) ◊ SURTECO SE (Chairman)
b) ◊ Hanover Acceptances Limited, London/Great Britain
RAG Stiftung (Chairman of Board of Trustees)
Dr. Ingrid Hengster Member of the Management Board of KfW Bank Group,
Frankfurt am Main
a) ◊ Thyssen Krupp AG
◊ KfW Capital GmbH&Co. KG
(since October 23, 2018; Chairwoman)
b) ◊ Europäische Investitionsbank (EIB), Luxembourg
(expert of the Administrative Board)
Jörg Hensel*Chairman of the Central Works Council of DB Cargo AG,
Chairman of the Business Unit Works Council of DB Cargo AG,
Chairman of the European Works Council of DB AG,
Hamm
a) ◊ DB Cargo AG
◊ DEVK Deutsche Eisenbahn Versicherung
Sach- und HUK-Versicherungsverein a. G.
Betriebliche Sozialeinrichtung der Deutschen Bahn
b) ◊ DEVK Pensionsfonds-AG (Advisory Board)
◊ DEVK Deutsche Eisenbahn Versicherung
Lebensversicherungsverein a. G.
Betriebliche Sozialeinrichtung der Deutschen Bahn
(members’ representative)
Dr. Levin Holle (since January 16, 2018)Head of Department VII in the Federal Ministry of Finance,
Berlin
a) ◊ KfW Capital GmbH&Co. KG (since November 29, 2018)
b) ◊ Bundesanstalt für Finanzdienstleistungsaufsicht (BaFin)
(Verwaltungsrat; stellvertretender Vorsitz) ◊ BwConsulting GmbH (Beirat)
Klaus-Dieter Hommel*Deputy Chairman of the Eisenbahn- und Verkehrsgewerkschaft (EVG),
Großefehn-Felde
a) ◊ DEVK Deutsche Eisenbahn Versicherung
Lebensversicherungsverein a. G.
Betriebliche Sozialeinrichtung der Deutschen Bahn ◊ DEVK Deutsche Eisenbahn Versicherung
Sach- und HUK-Versicherungs verein a. G.
Betriebliche Sozialeinrichtung der Deutschen Bahn ◊ DEVK Pensionsfonds-AG
◊ DEVK Rechtsschutz-Versicherungs-AG
◊ DB Fernverkehr AG
◊ DB Regio AG
◊ DB Vertrieb GmbH
Prof. Dr. Susanne Knorre Management consultant,
Hanover
a) ◊ Salzgitter AG (since May 24, 2018)
◊ RÜTGERS Germany GmbH
◊ Norddeutsche Landesbank
◊ STEAG GmbH
Jürgen Knörzer* (since September 11, 2018)Chairman of the Central Works Council of DB Regio AG,
Schwarzach
a) ◊ DB Regio AG
◊ DEVK Allgemeine Versicherungs-AG (Advisory Board)
Ludwig Koller* (until July 31, 2018)Chairman of the Central Works Council of DB Fernverkehr AG,
Karlsruhe
a) ◊ DB Fernverkehr AG
◊ Sparda-Bank Baden-Württemberg eG
b) ◊ DEVK Deutsche Eisenbahn Versicherung
Lebensversicherungsverein a. G.
Betriebliche Sozialeinrichtung der Deutschen Bahn
(Advisory Board)
Deutsche Bahn Group 2018 Integrated Report
248

Dr. Jürgen KrumnowSelf-employed entrepreneur,
Wiesbaden
b) ◊ Peek&Cloppenburg KG (Advisory Board)
Kirsten Lühmann Member of the German Parliament,
Hermannsburg
a) ◊ Nürnberger Beamten-Lebensversicherung AG
◊ BTA Betriebs- und Anlagengesellschaft mbH
(until May 31, 2018)
◊ Nürnberger Beamten Allgemeine Versicherung AG
(since May 1, 2018)
Heike Moll* Chairwoman of the Central Works Council of DB Station&Service AG,
Munich
a) ◊ DB Station&Service AG
b) ◊ DEVK Deutsche Eisenbahn Versicherung
Sach- und HUK-Versicherungsverein a. G.
Betriebliche Sozialeinrichtung der Deutschen Bahn
(Advisory Board)
Stefan Müller (since November 20, 2018)Member of the German Parliament,
Großenseebach
Eckhardt Rehberg (since September 20, 2018)Member of the German Parliament,
Marlow
a) ◊ DB Station&Service AG (until October 26, 2018)
b) ◊ KfW Bankengruppe (Administrative Board)
Mario Reiß*Chairman of the Works Council of DB Cargo AG, South East branch,
Süptitz
a) ◊ DB Cargo AG
b) ◊ DEVK Deutsche Eisenbahn Versicherung
Lebensversicherungsverein a. G.
Betriebliche Sozialeinrichtung der Deutschen Bahn
(Advisory Board)
Regina Rusch-Ziemba*Deputy Chairwoman of the Eisenbahn- und Verkehrsgewerkschaft (EVG),
Hamburg
a) ◊ DB Station&Service AG
◊ DB Fahrwegdienste GmbH
◊ DB Engineering&Consulting GmbH
◊ DB JobService GmbH
◊ DB Bahnbau Gruppe GmbH
◊ DEVK Allgemeine Lebensversicherungs-AG (Chairwoman)
◊ DEVK Allgemeine Versicherungs-AG
◊ DEVK Pensionsfonds-AG
Jens Schwarz*Chairman of the Group Works Council of Deutsche Bahn AG,
Chemnitz
a) ◊ DEVK Deutsche Eisenbahn Versicherung
Lebensversicherungsverein a. G.
Betriebliche Sozialeinrichtung der Deutschen Bahn
(Deputy Chairman of the Supervisory Board) ◊ DEVK Rechtsschutz-Versicherungs-AG
b) ◊ DEVK Deutsche Eisenbahn Versicherung
Sach- und HUK-Versicherungsverein a. G.
Betriebliche Sozialeinrichtung der Deutschen Bahn
(Advisory Board)
Veit Sobek*Chairman of the Central Works Council of DB Netz AG,
Halberstadt
a) ◊ Bundesbahn-Wohnungsbaugesellschaft Kassel GmbH
b) ◊ DEVK Deutsche Eisenbahn Versicherung
Lebens versicherungsverein a. G.
Betriebliche Sozialeinrichtung der Deutschen Bahn
(Advisory Board)
Oliver Wittke (since July 31, 2018)Parliamentary Secretary of State in the Federal Ministry
of Economics and Energy,
Gelsenkirchen
* Employees’ representative on the Supervisory Board
Supervisory Board committeesMembers of the Executive Committee◊ Michael Odenwald (Chairman)
◊ Alexander Kirchner
◊ Guido Beermann (Secretary of state)
◊ Jens Schwarz
Members of the Audit and Compliance Committee◊ Dr. Jürgen Krumnow (Chairman)
◊ Guido Beermann (Secretary of state)
◊ Jörg Hensel
◊ Regina Rusch-Ziemba
Members of the Personnel Committee◊ Michael Odenwald (Chairman)
◊ Alexander Kirchner
◊ Guido Beermann (Secretary of state)
◊ Jens Schwarz
Members of the Mediation Committee◊ Michael Odenwald (Chairman)
◊ Alexander Kirchner
◊ Guido Beermann (Secretary of state)
◊ Jens Schwarz
Berlin, February 28, 2019
Deutsche Bahn Aktiengesellschaft
The Management Board
FIN
AN
CIA
L S
TA
TE
ME
NT
S
249
CONSOLIDATED FINANCIAL STATEMENTS — NOTES TO ThE CONSOLIDATED FINANCIAL STATEMENTS
SU
ST
AIN
AB
ILIT
Y

Independent Auditor’s reportTo Deutsche Bahn Aktiengesellschaft, Berlin
Audit Opinions
We have audited the consolidated financial
statements of Deutsche Bahn Aktiengesell-
schaft, Berlin, and its subsidiaries (the Group),
which comprise the consolidated balance
sheet as at 31 December 2018, the consolidated
statement of income and the reconciliation of
consolidated comprehensive income, the con-
solidated statement of changes in equity and
the consolidated statement of cash flows for
the financial year from 1 January to 31 De cem-
ber 2018, and notes to the consolidated finan-
cial statements, including a summary of sig-
nificant accounting policies. In addition, we
have audited the group management report
of Deutsche Bahn Aktiengesellschaft for the
financial year from 1 January to 31 December
2018. We have not audited the content of those
parts of the group management report listed
in the “Other Information” section of our audi-
tor’s report in accordance with the German
le gal requirements.
In our opinion, on the basis of the knowl-
edge obtained in the audit,
◊ the accompanying consolidated financial
statements comply, in all material respects,
with the IFRSs as adopted by the EU, and
the additional requirements of German
commercial law pursuant to §(Article) 315e
Abs. (paragraph) 1 HGB (Handelsgesetz-
buch: German Commercial Code) and, in
compliance with these requirements, give
a true and fair view of the assets, liabilities,
and financial position of the Group as at 31
December 2018, and of its financial perfor-
mance for the financial year from 1 January
to 31 December 2018, and
◊ the accompanying group management re -
port as a whole provides an appropriate
view of the Group’s position. In all material
respects, this group management report is
consistent with the consolidated financial
statements, complies with German legal
requirements and appropriately presents
the opportunities and risks of future devel-
opment. Our audit opinion on the group
management report does not cover the
content of those parts of the group man-
agement report listed in the “Other Infor-
mation” section of our auditor’s report.
Pursuant to §322 Abs. 3 Satz (sentence) 1 HGB,
we declare that our audit has not led to any
reservations relating to the legal compliance
of the consolidated financial statements and of
the group management report.
Basis for the Audit Opinions
We conducted our audit of the consolidated
financial statements and of the group manage-
ment report in accordance with §317 HGB and
in compliance with German Generally Accepted
Standards for Financial Statement Audits pro-
mulgated by the Institut der Wirtschaftsprüfer
(Institute of Public Auditors in Germany) (IDW).
We performed the audit of the consolidated
financial statements in supplementary com-
pliance with the International Standards on
Auditing (ISAs). Our responsibilities under
those requirements, principles and standards
are further described in the “Auditor’s Respon-
sibilities for the Audit of the Consolidated Fi -
nancial Statements and of the Group Manage-
ment Report” section of our auditor’s re port.
We are independent of the group entities in
accordance with the requirements of Ger man
commercial and professional law, and we have
fulfilled our other German profession al respon-
sibilities in accordance with these re quire-
ments. We believe that the audit evidence we
have obtained is sufficient and ap propriate to
provide a basis for our audit opinions on the
consolidated financial statements and on the
group management report.
Other Information
The executive directors are responsible for the
other information. The other information com-
prises the following non-audited parts of the
group management report:
◊ the corporate governance report pursuant
to No. 6.1 of the German Federal Public Cor-
porate Governance Code
◊ the Non-financial group statement pur-
suant to §315b Abs. 1 HGB included in sec-
tion “Fundamentals” of the group manage-
ment report.
The other information comprises further the
remaining parts of the “2018 Integrated Re -
port” – excluding cross-references to external
information – with the exception of the au -dited consolidated financial statements, the
audited group management report and our
auditor’s report.
Our audit opinions on the consolidated fi -
nancial statements and on the group manage-
ment report do not cover the other informa-
tion, and consequently we do not express an
audit opinion or any other form of assurance
conclusion thereon.
In connection with our audit, our responsi-
bility is to read the other information and, in
so doing, to consider whether the other infor-
mation
◊ is materially inconsistent with the consoli-
dated financial statements, with the group
management report or our knowledge ob -
tained in the audit, or
◊ otherwise appears to be materially mis-
stated.
If, based on the work we have performed, we
conclude that there is a material misstatement
of this other information, we are required to
report that fact. We have nothing to report in
this regard.
Deutsche Bahn Group 2018 Integrated Report
250

Responsibilities of the Executive Directors and the Supervisory Board for the Consolidated Financial Statements and the Group Management Report
The executive directors are responsible for the
preparation of the consolidated financial state-
ments that comply, in all material respects,
with IFRSs as adopted by the EU and the addi-
tional requirements of German commercial law
pursuant to §315e Abs. 1 HGB and that the con-
solidated financial statements, in compliance
with these requirements, give a true and fair
view of the assets, liabilities, financial position,
and financial performance of the Group. In
addition the executive directors are respon-
sible for such internal control as they have
determined necessary to enable the prepara-
tion of consolidated financial statements that
are free from material misstatement, whether
due to fraud or error.
In preparing the consolidated financial
statements, the executive directors are re -
spon sible for assessing the Group’s ability to
continue as a going concern. They also have
the responsibility for disclosing, as applicable,
matters related to going concern. In addition,
they are responsible for financial reporting
based on the going concern basis of accounting
unless there is an intention to liquidate the
Group or to cease operations, or there is no
realistic alternative but to do so.
Furthermore, the executive directors are res-
ponsible for the preparation of the group man-
agement report that, as a whole, provides an
appropriate view of the Group’s position and
is, in all material respects, consistent with the
consolidated financial statements, complies
with German legal requirements, and appropri-
ately presents the opportunities and risks of
future development. In addition, the execu-
tive directors are responsible for such arrange-
ments and measures (systems) as they have
considered necessary to enable the preparation
of a group management report that is in accor-
dance with the applicable German legal re -
quirements, and to be able to provide sufficient
appropriate evidence for the assertions in the
group management report.
The supervisory board is responsible for
overseeing the Group’s financial reporting pro-
cess for the preparation of the consolidated
financial statements and of the group manage-
ment report.
Auditor’s Responsibilities for the Audit of the Consolidated Financial Statements and of the Group Management Report
Our objectives are to obtain reasonable assur-
ance about whether the consolidated financial
statements as a whole are free from material
misstatement, whether due to fraud or error,
and whether the group management report as
a whole provides an appropriate view of the
Group’s position and, in all material respects,
is consistent with the consolidated financial
statements and the knowledge obtained in the
audit, complies with the German legal require-
ments and appropriately presents the oppor-
tunities and risks of future development, as
well as to issue an auditor’s report that in-
cludes our audit opinions on the consolidated
financial statements and on the group manage-
ment report.
Reasonable assurance is a high level of as -
surance, but is not a guarantee that an audit
conducted in accordance with §317 HGB and in
compliance with German Generally Accepted
Standards for Financial Statement Audits pro-
mulgated by the Institut der Wirtschaftsprüfer
(IDW) and supplementary compliance with the
ISAs will always detect a material misstate-
ment. Misstatements can arise from fraud or
error and are considered material if, individu-
ally or in the aggregate, they could reasonably
be expected to influence the economic deci-
sions of users taken on the basis of these con-
solidated financial statements and this group
management report.
We exercise professional judgment and
maintain professional skepticism throughout
the audit. We also:
◊ Identify and assess the risks of material
misstatement of the consolidated financial
statements and of the group management
report, whether due to fraud or error, de -
sign and perform audit procedures respon-
sive to those risks, and obtain audit evi-
dence that is sufficient and appropriate to
provide a basis for our audit opinions. The
risk of not detecting a material misstate-
ment resulting from fraud is higher than
for one resulting from error, as fraud may
involve collusion, forgery, intentional omis-
sions, misrepresentations, or the override
of internal controls.
◊ Obtain an understanding of internal con-
trol relevant to the audit of the consolida-
ted financial statements and of arrange-
ments and measures (systems) relevant to
the audit of the group management report
in order to design audit procedures that
are appropriate in the circumstances, but
not for the purpose of expressing an au-
dit opinion on the effectiveness of these
systems.
◊ Evaluate the appropriateness of account-
ing policies used by the executive direc-
tors and the reasonableness of estimates
made by the executive directors and re -
lated disclosures.
FIN
AN
CIA
L S
TA
TE
ME
NT
S
251
CONSOLIDATED FINANCIAL STATEMENTS — INDEpENDENT AUDITOr’S rEpOrT
SU
ST
AIN
AB
ILIT
YS
US
TA
INA
BIL
ITY

◊ Conclude on the appropriateness of the
executive directors’ use of the going con-
cern basis of accounting and, based on the
audit evidence obtained, whether a mate-
rial uncertainty exists related to events or
conditions that may cast significant doubt
on the Group’s ability to continue as a go-
ing concern. If we conclude that a mate-
rial uncertainty exists, we are required to
draw attention in the auditor’s report to
the related disclosures in the consolidat-
ed financial statements and in the group
management report or, if such disclosures
are inadequate, to modify our respective
audit opinions. Our conclusions are based
on the audit evidence obtained up to the
date of our auditor’s report. However, fu -
ture events or conditions may cause the
Group to cease to be able to continue as
a going concern.
◊ Evaluate the overall presentation, struc-
ture and content of the consolidated finan-
cial statements, including the disclosures,
and whether the consolidated financial
statements present the underlying trans-
actions and events in a manner that the
consolidated financial statements give a
true and fair view of the assets, liabilities,
financial position and financial perfor-
mance of the Group in compliance with
IFRSs as adopted by the EU and the addi-
tional requirements of German commercial
law pursuant to §315e Abs. 1 HGB.
◊ Obtain sufficient appropriate audit evi-
dence regarding the financial information
of the entities or business activities within
the Group to express audit opinions on
the consolidated financial statements and
on the group management report. We are
responsible for the direction, supervision
and performance of the group audit. We
remain solely responsible for our audit
opinions.
◊ Evaluate the consistency of the group man-
agement report with the consolidated fi -
nancial statements, its conformity with
German law, and the view of the Group’s
position it provides.
◊ Perform audit procedures on the prospec-
tive information presented by the execu-
tive directors in the group management
report. On the basis of sufficient appro-
priate audit evidence we evaluate, in par-
ticular, the significant assumptions used
by the executive directors as a basis for the
prospective information, and evaluate the
proper derivation of the prospective infor-
mation from these assumptions. We do not
express a separate audit opinion on the pro-
spective information and on the assump -
tions used as a basis. There is a substantial
unavoidable risk that future events will
differ materially from the prospective in -
formation.
We communicate with those charged with gov-
ernance regarding, among other matters, the
planned scope and timing of the audit and sig-
nificant audit findings, including any signifi-
cant deficiencies in internal control that we
identify during our audit.
Berlin, 28 February 2019
PricewaterhouseCoopers GmbH
Wirtschaftsprüfungsgesellschaft
Thomas Kieper Philipp Medrow
Wirtschaftsprüfer Wirtschaftsprüfer
(German (German
Public Auditor) Public Auditor)
Deutsche Bahn Group 2018 Integrated Report
252

254 Sustainability reporting254 Compliance
◊ Compliance as an integral element of corporate culture
◊ Audit of our compliance management system
256 Data Protection ◊ Implementation of the EU General Data Protection Regulation
◊ DB Group Privacy Advisory Board advises the Management Board on strategic and core data protection issues
257 Security ◊ Increased security for customers and employees
◊ Increased number of video surveillance cameras at stations
258 Purchase/procurement ◊ Focus on social responsibility and sustainable management among our suppliers
◊ Increased internationalization
259 Deutsche Bahn Foundation ◊ Deutsche Bahn Foundation supports charitable projects
259 Social ◊ Larger share of women in management positions
◊ About 21,000 new hires
263 Environmental ◊ Greenhouse gas footprint reduced in the year under review
◊ New study on the impacts of climate change published
266 Independent Practitioner’s Report on a Limited Assurance Engagement on Sustainability Information
Notes to sustainability
SU
ST
AIN
AB
ILIT
Y

Sustainability reportingThe 2018 Integrated Report refers to the year under review, this being
calendar year 2018. For the purpose of comparison, most of the key fig-
ures are also presented for 2017 and 2016. The Integrated Report is pub-
lished on an annual basis. This report was published on March 28, 2019
(2017 Integrated Report: March 22, 2018). The 2018 Integrated Report
addresses the material stakeholder groups µ46 of Deutsche Bahn
Group (DB Group). The reporting covers all material economic, social
and environmental aspects. All of the fully consolidated companies of
DB Group are included in the report. Deviations from this reporting scope
are noted as such.
The data collection methods and bases of calculation used for the data
in the 2018 Integrated Report are oriented toward applicable standards.
The Integrated Report was prepared in agreement with the GRI
standards in the core option. Content regarding general and specific
standards information is referenced in the GRI content index µ268. At
the same time, the information in the 2018 Integrated Report serves as
a Communication on Progress regarding the implementation of the
UN Global Compact’s Ten Principles µ269. Moreover, material contents,
indicators and passages of text were audited by an independent third
party, PricewaterhouseCoopers GmbH Wirtschaftsprüfungsgesellschaft
(PwC), with limited assurance.
ComplianceCompliance is an integral element of the corporate culture at DB Group.
The compliance management system is based on national and interna-
tional legal requirements and established standards, such as the Insti-
tute of Public Auditors in Germany PS 980 auditing standard. DB Group
also applies the directive of the Federal Government on corruption pre-
vention in the German Federal administration.
The compliance management system aims to ensure that compliance
risks are identified quickly and that appropriate countermeasures are
implemented. We continuously monitor the effectiveness of our compli-
ance management system and make any necessary adjustments. Com-
pliance is a key area of internal control system monitoring. Intra-Group
auditors therefore review the compliance management systems within
DB Group as part of the internal control system audits under the Ac -
counting Law Modernization Act (Bilanzrechtsmodernisierungsgesetz;
BilMoG).
DB Group compliance management is typified by a combination of
centralized and decentralized units at the operational and organizational
levels. Group management focuses its compliance work on centralized
governance activities in particular, while business units exercise greater
operating responsibility. In the year under review, various events took
place, such as the Compliance Network Meeting, that aimed to share the
experiences of centralized and decentralized compliance officers.
Our compliance activities in DB Group focus on preventing corruption
and corporate crime in the form of fraud and embezzlement, as well as
consistently combating it.
Compliance instruments
Specific compliance instruments have been developed to protect the
com pany, employees and executives. This includes binding directives, risk
and process analyses, special communication measures and consulting.
Binding directives provide the framework that is anchored in con-
tinuous communication and training at DB Group. Revised directives on
ex port checks, sanctions, embargoes and risk minimization came into
effect in the year under review.
Compliance risk analyses are part of DB Group risk management and
are conducted by the business units and service units. A Group-wide
survey to evaluate compliance risks is conducted in accordance with
governance requirements stipulated by Group management. The com-
pulsory framework concept includes minimum requirements for plan-
ning, conducting, reporting and follow-up.
A compact compliance annual report once again provided the
Group’s Management Board with information on compliance risks
related to DB Group’s business activities. The report separately sets out
the risk exposure of DB Group business units, service units and Group
management functions and highlights existing risk-reducing factors and
countermeasures.
To achieve our compliance goals in the long term, we are continually
optimizing our instruments and are digitalizing our prevention and analy-
sis activities.
External audit of the compliance management system
An auditing and consulting company conducted an independent Group-
wide review of the DB Group compliance management system regarding
corruption and corporate crimes in terms of fraud and embezzlement.
The first audit was conducted at the Group management level in accor-
dance with audit standard IDW PS 980 and an unqualified opinion was
issued upon completion. The subsequent audits conducted within the
business units were also in line with ISO 19600 requirements and resulted
in unqualified opinions which were then issued during the year under
review.
102-50102-51102-52102-54102-56
GRI
!!!
205-1
GRI
Deutsche Bahn Group 2018 Integrated Report
254

Business partner compliance
Successful long-term business operations require the careful selection
of business partners and suppliers who must then be informed of the
DB Group values and commit to collaboration based on shared values.
DB Group has developed different formats to increase awareness among
its business partners and incorporate sustainable business practices more
firmly in the supply chain. The core topics in this respect are integrity,
legal standards and ethical issues. In addition to corruption prevention,
this also includes anti-trust compliance and human rights. Compliance
e-learning for business partners is accessible at no cost online and pro-
vides information about integrity, binding legal standards and ethical
matters. DB Group also offers a special compliance dialog program for
its medium-sized business partners to discuss mutual understanding of
compliance and how it is organized.
Integrity and human rights training programs
There are four different e-learning courses available for our employees
and executives to take: “DB Code of Conduct”, two special e-learning
courses on anti-corruption issues (“DB Corruption Prevention” and
“DB Refresher Course on Corruption Prevention”) and a course that
addresses trade compliance (export control laws, sanctions lists, etc.).
E-learning on the DB Code of Conduct includes the topics of integrity
(anti-corruption) and human rights. Executives are required to complete
e-learning. In selected companies and divisions, participation in e-learn-
ing is also mandatory for all other employees due to risk. DB employees
have free access to e-learning in several languages.
As in previous years, Group-wide on-site training was also conducted
during the year under review.
Training sessions for executives and employees 2018 2017 2016
Participants 29,700 14,408 13,095
Risk-based selection of participants, especially from typical risk areas (for example sales and distribution, procurement, construction supervision).
Increased training activities in business units dealing with freight trans-
port, logistics and infrastructure were among the main reasons why the
number of participants increased. In the previous year, the heads of
Compliance, Audit and Legal began a series of dialogs on increasing
awareness of compliance risks among top management executives.
These discussions continued in the year under review.
Whistle-blowing management in DB Group
In DB Group, the Works Council Agreement “Whistle-blowing manage-
ment” and the “Group speaker committee agreement” (Konzernsprecher-
ausschussvereinbarung) govern how to handle whistle-blowing tip-offs
that are received. The processes implemented protect whistle- blowers.
Clearly defined requirements regarding the rigor and relevance of whistle-
blowing tip-offs serve to take account of the interests of the persons
concerned.
There are various ways of submitting a whistle-blowing tip-off, such as
the electronic whistle-blower system. The system was made available in
seven more languages and so can now be used in 22 languages. All busi-
ness units use the electronic whistle-blower system. In the year under
review, the whistle-blowing management team expanded to include more
criminal law expertise. Three trusted lawyers, who are legally bound to
secrecy, and an ombudswoman can also be contacted regarding such
matters.
Corruption reporting and mitigation measures
Our central whistle-blowing management received and examined allega-
tions of corruption in the double-digit range in the year under review.
Remedial actions were introduced whenever they were necessary.
Compliance with anti-trust laws and preventing anti-trust damages
On-site training courses ensure that executives and employees are kept
aware of anti-trust law. The formats of the training courses are individ-
ually tailored to the requirements of the business units and the central
units. The target group includes all executives and employees who are
in contact with competitors or have other roles that are critical with
regard to competition. The compliance, audit and legal heads also took
up the issue under the awareness campaign. The training courses are
supplemented, in particular, by regulations specific to business units and
close cooperation with (anti-trust) legal experts.
Anti-trust damage prevention measures are an important compo-
nent of anti-trust compliance. To this end, DB Group introduced a com-
prehensive anti-trust damage prevention system in 2014. An important
part of the system is to use contractual conditions in markets where
anti-trust violations are most likely, which oblige suppliers to introduce
or maintain anti-trust compliance programs.
Human rights
Responsibility to societyProtecting and promoting human rights are of the utmost importance to
us. DB Groupʼs regulations reflect these high standards, in particular by
applying the DB Code of Conduct and the DB Code of Conduct for Busi-
ness Partners. Our particular areas of focus include fair labor conditions,
respect for workers’ rights, anti-discrimination measures and the prohi-
bition of any and all forms of child or forced labor. We report on forced
labor in accordance with the guidelines of the UK Modern Slavery Act.
We have implemented suitable measures for the application of our
own standards and we will continue to develop them. A fundamental
distinction is made between measures effective within DB Group and
measures effective in the supply chain µ258.
205-2
GRI
205-2
GRI
!!!
205-3
GRI
102-16
GRI
SU
ST
AIN
AB
ILIT
Y
255
NOTES TO SUSTAINABILIT Y — SUSTAINABILIT Y REPORTING | COmPLIANCE

measures within DB GroupThe core of our approach to human rights is identifying relevant risks with
respect to our business models and human rights-related country risks.
“Social minimum standards” are applicable to our DB Schenker busi-
ness unit which operates globally and is therefore exposed to greater
geographical risks. This policy specifies the DB Code of Conduct and is
based beyond legal requirements on the principles and recommenda-
tions of the International Labor Organization (ILO) and the UN Global
Compact. Compliance with social minimum standards is regularly audited
on site by intra-Group auditors at selected locations as part of an annual
audit process.
DB Group also provides a range of instruments for increasing aware-
ness of human rights and reporting suspected human rights violations.
Examples of these instruments include the DB Code of Conduct e-learn-
ing course and central whistle-blowing management. Central whistle-
blowing management and the three lawyers are also available at all times,
even to non Group persons. Reports can also be submitted via the elec-
tronic whistle-blower system. DB Group employees and executives in
particular can personally contact the ombudswoman regarding human
rights. A follow-up process is in place to examine alleged violations of
human rights.
The topic of human rights is also an integral part of DB Groupʼs
stakeholder dialogs. In addition, DB Group is involved in the German UN
Global Compact network and in econsense working groups.
Data protectionImplementation of the EU General Data Protection Regulation
Efforts to implement the EU General Data Protection Regulation (GDPR)
were a core part of Group data protection activities in the year under
review. Firstly, new standards were implemented, such as more compre-
hensive obligations to be transparent toward customers and employees.
Existing processes and sample contracts then had to be modified to
comply with the new regulations and new requirements had to be pro-
actively incorporated into everyday consulting. Finally, awareness of
data protection issues was raised among data controllers through var-
ious channels.
In addition to usual processes such as recruiting and HR services,
initiatives such as DB Digital Ventures, mindbox and beyond1435 are
increasingly playing a role in advising and are used by DB Group to drive
its digitalization efforts. The use of bodycams by DB Security received a
notable response from the media as part of the focus on video surveil-
lance. This was preceded by extensive consultation and dis cussion with
the competent data protection supervisory authorities regarding data
protection, including academic support from Prof. Dr. Jürgen Taeger from
the University of Oldenburg, who is also a member of the DB Group Privacy
Advisory Board.
Group data protection places great importance on communicating
openly and proactively with the relevant data protection supervisory
authorities for each Group company, particularly through the introduc-
tion of innovative procedures and processes.
Technical data protection and audit
The audit department focused on auditing key procedures and processes
related to the implementation of GDPR requirements, especially Bahn-
Card procedures (including an audit of the service provider) and central
DB HR systems. During the year under review, the department also con-
centrated on auditing the new DB Group recruiting procedures that are
used internationally.
The consulting focused on assessing various newly written order
processing agreements in terms of implementing technical and organi-
zational measures, as well as using expertise in data protection to super-
vise major projects in customer and employee data protection with
regard to measures that still need to be taken to comply with GDPR. This
includes the new sales system VENDO for passenger transport and pro-
cedures that have been developed especially for the occupational
health service.
An innovative working group called AG SoNeT conducted research
into legal advice on data protection for the use of artificial intelligence
(AI) applications with the aim of creating a practical guide for DB Group
companies. The DOM survey conducted at the start of the year under
review had a record number of participants and its results showed them
to have a good level of data protection.
Further development of professional qualifications and awareness
We increased the already high quality of consultancy provided by the
data protection organization by providing tailored professional training
opportunities. Increasing awareness of data protection issues among
all employees and executives in a targeted way involved publishing the
new online training course “fundamentals in the data protection” and reg-
ularly updating the latest data protection news at the DB Planet data
protection news blog.
International data protection
During the year under review, the digital transformation at DB Group was
a common theme for issues relating to international data protection
laws. From fleet management systems in international logistics to digital
finance solutions and international recruiting software – it is obvious
that using innovative digital technologies requires personal data to be
handled responsibly and securely.
Another key topic in this area was the implementation of GDPR. In
cooperation with the international data protection managers, who serve
as points of contact within the decentralized international data protec-
tion organization, Group data protection ensured that the new data pro-
cessing requirements were implemented within EU companies as well as
EU companies conducting business with non-EU companies.
In addition to EU legislation, we have also been keeping a close eye
on developments in international law. Developments in data protection
law that were relevant to us during the year under review included the
US CLOUD Act, various domestic legislation on data localization and data
protection legislation that used GDPR as an example.
102-12
GRI
102-44
GRI
Deutsche Bahn Group 2018 Integrated Report
256
DB Group Data Protection Advisory Board
DB Group Data Protection Advisory Board advises the Group’s Manage-
ment Board on strategic and core data protection issues, and in doing so
helps significantly to set an excellent example of data protection at
DB Group. The expertise of individual stakeholder groups on the Advisory
Board ensures that legitimate data protection-related interests of all
stakeholders involved are taken into account, particularly in discussions
on the digital transformation. The work that the Advisory Board does is
therefore an im portant contribution to DB Group stakeholder dialog on
data protection.
Useful consultation requires early and organized involvement in data
protection-related deliberations, planning and projects, as well as
applying this approach consistently to ensure exemplary data protection
within DB Group. The Advisory Board discusses new, innovative and
pragmatic solutions to protect the data protection rights of data sub-
jects, making an important contribution to ensuring digitalization initia-
tives are compliant with data protection regulations while also being key
to the success of these projects. Data-protection-related challenges can
be handled in the best possible manner through forward-looking and
constructive discussion together with trusted guidance from the Advi-
sory Board. The annual awarding of the Advisory Board’s now well-es-
tablished Data Protection Award helps to ensure that data protection is
treated with the necessary care and attention within DB Group.
SecuritySecurity for customers and employees
Security is an important commodity and a basic requirement of our cus-
tomers and employees. We have a great deal of responsibility for many
people and goods – around the clock. The security units are in an on-
going dialog with security authorities. In the railway joint security center,
Group security exchanges status information with the Federal police
around the clock. The six operations centers set up during the previous
year in DB Security’s regional areas successfully coordinate all regional
security issues and are available to be contacted by our business units
at any time. In total more than 5,000 Federal police officers and about
4,000 security staff from DB Security are deployed across Germany. In
the year under review, 160 young people started their training to become
protection and security specialists in DB Group, following on from 185
trainees in the previous year. Combined with the trainees from the cohort
graduating in 2019, there are over 400 young people undertaking spe-
cialist training in safety and security in DB Group.
Security at DB GroupDB Group spends about € 170 million annually on the security of its cus-
tomers and employees. As part of a law enforcement partnership, over
5,000 Federal police officers and about 4,000 of DB Groupʼs own security
staff work together, with technical support, to combat crime and dis rup-
tive activity and increase the security of our customers and em ployees.
Security staff on trains and in stations first and foremost work to ensure
that all passengers and station visitors feel safe. This has led to a 25%
reduction in the number of bag and luggage thefts on trains and in sta-
tions in the year under review. The measures applied in the year under
review also led to a significantly smaller increase in incidents against our
employees on trains and in stations. The measures to protect our em -
ployees and our customers coordinated with interest groups are showing
initial successes. This includes improved employee training, better
equipment, support from security technology, adaptation of personnel
concepts and deployment of guard dogs and bodycams. Bodycams were
already in regular use during the previous year in Berlin and Cologne and
seven more locations began using them in the year under review. The
deployment of bodycams reinforces the findings from trials in previous
years: employees are not attacked when wearing them. For the first time,
all 40,000 customer-facing employees were obliged to undergo regular
de-escalation and self-defense training that we provided in the year
under review. In addition, we work with security authorities to review
more new technologies to increase the safety of our customers and
employees and to modernize and expand video technology on trains and
in stations.
Development and expansion of video technologyThe number of surveillance cameras in stations increased from about
7,000 to 7,400 in the year under review and the number of stations with
video technology increased to over 1,000. In the year under review,
efforts centered on replacing existing technology at large and middle-
sized stations, so the number of cameras did not increase to the same
extent as the previous year. We are continuing our video expansion pro-
gram that was adopted jointly with the Federal Government. The
installed cameras record in full HD. This makes more details visible even
in poor light. The Federal police, who have exclusive access to the re-
corded footage, were therefore able to locate offenders in stations much
more often. In July, the Federal Ministry of the Interior and the Federal
police finished testing the biometric facial recognition software in Berlin
Südkreuz station. The software was tested over a period of 12 months
with 300 volunteer test subjects to ascertain whether it could reliably
match video footage from the station with images from a database. The
trial was the sole responsibility of the security authorities. The footage
came from the cameras that were already set up in the station.
Increased presence and more easily reachableThe Berlin S-Bahn (metro) developed a new security concept by order of
the Berlin and Brandenburg Federal states. Going forward, S-Bahn
guards at interchange stations will be contactable regarding service and
security at any time of day. In this instance, security staff will be deployed
in tan dem with guard dogs. They will be present in stations, available to
contact regarding service and security responsibilities, actively working
to prevent incidents and intervening when they occur on the platform
and on S-Bahn (metro) services.
103
GRI
SU
ST
AIN
AB
ILIT
Y
257
NOTES TO SUSTAINABILIT Y — COmPLIANCE | DATA PROTECTION | SECURIT Y

Assaults against DB employeesSecurity staff are the main targets in the majority of cases where em -
ployees are assaulted. In the year under review, DB Group employees had
been assaulted more than 2,600 times across Germany (previous year:
over 2,500 times; 2016: over 2,300 times). At the same time, the number
of serious injuries has declined, showing that the security concept is
effective. DB Group has responded with improved training for security
staff and train attendants, increased security staff and better equipment.
Purchase/procurementProcurement that is essential to success
Our procurement ensures the cost-efficient, timely and quality supply of
material, capital goods and services worldwide, thereby forming the
basis for long-term success and capacity for innovation. All procurement
initiatives contribute to the “World-Class Procurement” program which
we use to assess and further develop our excellence.
While wages continued to increase across the industry in the year
under review and pressure on prices remained high, especially in the
services sector, we successfully maintained stable conditions. We achieve
the best possible results by cooperating across departments, which is
commensurate with the process model embedded in the procurement
management system. Commodity group strategies and optimal awarding
processes were steadily refined within the procurement teams to achieve
the projected savings.
Further improvements are planned as part of the procurement dig-
italization roadmap, which offers more efficient IT support for processes.
Procurement is also a major part of our FINANCE4DB project that we
launched in the year under review to digitalize our payment processes
with the aim of improving efficiency in the procure-to-pay process. The
growing digitalization of our work processes creates more value-adding
activities within the teams and paves the way for cutting-edge office
concepts to deliver services more efficiently.
Focus on social responsibility and sustainable business among our suppliers We consider responsible procurement management to be a major value
driver for both DB Group and society. We need strong partners as part
of a transparent supply chain to make the largest possible contribution
toward sustainable development. Our suppliers take an active role in
ensuring mutual business success with their sustainability performance
and capacity to innovate. The Code of Conduct for Business Partners is
the starting point in forming sustainable supply chains and making defin-
itive procurement decisions. We also place great emphasis on compre-
hensively assessing the sustainability of our suppliers in terms of their
management system, activities and results. We have already assessed
over 500 suppliers with a purchasing power of over € 7 billion. About
two-thirds of the recently assessed suppliers improved their sustain-
ability performance, enabling us to reduce risks and increase competi-
tiveness together. We also ask our suppliers to be assessed for compli-
ance with Corporate Social Responsibility criteria. For our collaboration
with suppliers to be successful, we expect them to take measures to
eliminate risks that they have identified, especially in terms of occupa-
tional safety and purchasing management systems. As part of an intense
dialog with industry associations and ŒRailsponsible (our sustainable
supply chain initiative for the rail transport sector), we are making sus-
tainable performance a relevant criterion for awarding contracts. Our
sup pliers can already present their sustainability evaluation in the qual-
ification process. Railsponsible now has 13 international members and
one of its key focuses in the year under review was climate protection.
Together with members of the initiative, we have set our stance on the
matter in our ŒPosition Paper on Climate.
Exemplary supplier managementOur supplier manager comprises four essential elements – supplier qual-
ification, development, stabilization and evaluation – and is an ongoing
process. This standardized process helps us to ensure high-quality stan-
dards together with experienced suppliers. Supplier management
applies throughout the Group and is incorporated into our leading IT
systems. Supplier qualification remains central to DB Group’s require-
ments to be competitive. The pre-qualification system was expanded to
include more product groups for this purpose, for example facility man-
agement and security services.
Trusted collaboration with industry associations and initiatives also
makes it possible for us to orient our supplier portfolio predominantly
toward system providers with proven expertise in the rail transport
sector. Strategically we are focusing on a high rate of consolidation and
long-term framework agreements. We have concluded contracts with a
total of 18,000 suppliers, 622 of which fulfill about 80% of purchasing
volumes. Purchasing ensures a high level of operational excellence when
carried out in line with processes. The Federal Audit Office (Bundesrech-
nungshof) commissioned an audit of contracting activities, which found
that no provisions governing the awarding of contracts had been vio-
lated in the Performance and Financing Agreement (Leistungs- und
Finanzierungsvereinbarung; LuFV) µ235 f.
There is also emphasis on promoting and using our suppliers’ inno-
vations. For example, in the year under review, we once again held the
Supplier Innovation Award prize-giving at InnoTrans – the leading inter-
national trade fair for railway and transport technology – after receiving
a large number of submissions. We also rewarded outstanding work in
the fields of “General requirements and services,” “Infrastructure,”
“Rolling stock and parts” and “Environment” with the Supplier Awards.
Increased internationalizationEven if almost 90% of our prime suppliers are based in Germany, we are
procuring more and more from international markets. This is necessary
not least of all due to the increasing tendency toward consolidation in
the European railway industry. Outside of Europe, we are focusing on
developing our supplier base in Asia. With our procurement office in
Shanghai, we have identified almost 500 potential suppliers since 2015.
In the year under review, Asian suppliers participated in over 20 tender-
awarding processes which had a procurement volume of over € 200 mil-
lion in various product groups. Our activities in the year under review
also included qualifying suppliers in Russia and signing contracts in
China for the supply of freight cars and very small locomotives. We have
reinforced our quality assurance and project management processes
accordingly in our Shanghai purchasing office.
102-10
GRI
102-9
GRI
102-13
GRI
102-43
GRI
102-9
GRI
Deutsche Bahn Group 2018 Integrated Report
258

Deutsche Bahn FoundationThe Deutsche Bahn Foundation supports charitable projects.
Charitable projects in Germany (number) 2018 2017 2016
Deutsche Bahn Foundation 16 1) 13 20
1) Preliminary figure.
Expenses for charitable projects in Germany (€ thousand) 2018 2017 2016
Deutsche Bahn Foundation 2,194 1) 1,955 2,728
1) Preliminary figure.
In response to donation requests, Deutsche Bahn Foundation has also
provided funds from its general response budget.
Donations in Germany (€ thousand) 2018 2017 2016
Deutsche Bahn Foundation 133 1) 81 43
1) Preliminary figure.
No scholarships were funded by the Deutsche Bahn Foundation during
the year under review.
Scholarships in Germany (number) 2018 2017 2016
Deutsche Bahn Foundation –° 43 65
The expenses for DB Museum amounted to € 6.1 million in the year
under review (previous year: € 5.9 million).
SocialPersonnel development
Training and professional developmentAs an intra-Group partner for learning, development and change pro-
cesses, DB Training conducts training and professional development with
about 25,000 events for about 250,000 participants per year. More than
3,000 training sessions are offered, addressing all employee groups and
functions within DB Group.
DB Academy is responsible for the qualification of the about 7,900
executives and potential executives of DB Group. The portfolio offers
executives training according to their individual career and development
stages that enable them to move between strategic areas of action at
DB Group. We are constantly evolving our service offering. We are in -
creas ingly using elements from digital learning, agile methods and new
learning formats and communication.
In the year under review, regional qualification centers were set up
as pilot projects for the training and continuing education of our em -
ployees abroad. Furthermore, in Singapore the DB Schenker Training
Center was further expanded and a program for fixed-term international
project and visitation experience for specialists and potential executives
was developed.
Training and development costs for employees 1) (€ million) 2018 2017
Change
2016absolute %
Total 188 172 +16 + 9.3 169Per employee (FTE) (€) 942 883 + 59 + 6.7 872
1) Germany, including trainees and dual degree students, excluding executives.
Training and continuing education days in customer-oriented job families (days) 2018 2017 2016
Per employee (FTE) 8.8 7.6 7.1
Germany (companies with about 79% of domestic employees).
Includes only training and development days in customer-oriented job families for permanent employees, excluding vocational trainees and dual-degree students.
The training and continuing education costs per employee increased as
did the training days in comparison with the previous year.
Securing new talent
Young professionals hired as permanent staff by type of training (NP) 2018 2017 2016
Vocational trainees 2,358 2,408 2,540Dual degree students 201 220 252
Germany (companies with about 98% of domestic employees).
Hired after completion of training or dual degree studies.
Young people can complete training in over 50 apprenticeships in
DB Group. Vocational training and dual degree studies program are the
foundation of DB Group’s efforts to secure the recruitment of skilled
em ployees. This is supplemented by the long-term job preparation pro-
gram “Chance plus” for young people who need support in accessing the
labor market. In the year under review, there was particular focus on
making qualified jobs and the development of digital learning formats
fit for the future. We have also created and expanded services for super-
vising, supporting and engaging junior staff in different ways.
DiversityIn Germany, about 205,000 employees (natural persons) from over 100
nations work for DB Group and about 48,000 of them are women. The
share of employees in Germany of foreign birth or citizenship increased
to 11.6% (previous year: 10.5%).
Employees by age as of Dec 31 (NP) 2018 2017 2016
<30 years 27,351 25,593 24,73230 – 49 years 85,605 82,596 82,078
≥ 50 years 87,936 86,227 84,894
Total 200,892 194,416 191,704
Germany (companies with about 98% of domestic employees).
The share of employees over the age of 50 continues to be high.
404-2
GRI
404-1
GRI
401-1404-2
GRI
405-1
GRI
SU
ST
AIN
AB
ILIT
Y
259
NOTES TO SUSTAINABILIT Y — SECURIT Y | PURCHASE/PROCUREmENT | DEUTSCHE BAHN FOUNDATION | SOCIAL

Management level by gender as of Dec 31 (NP) 2018 2017 2016
Supervisory Board 20 20 20 Share of women (%) 25.0 30.0 30.0Senior executives 222 217 214 Share of women (%) 14.4 12.9 12.6Upper management 959 920 901 Share of women (%) 17.7 16.6 16.2Middle management 2,187 2,160 2,187 Share of women (%) 21.8 21.0 20.4
Executives (excluding the Supervisory Board) in total 3,368 3,297 3,302 Share of women (%) 20.1 19.2 18.7
Germany (companies with about 98% of domestic employees).
The share of women in management positions has increased steadily in
recent years.
Employees with severe disabilities by age as of Dec 31 (NP) 2018 2017 2016
<30 years 276 250 25730 – 49 years 2,768 2,831 2,892≥ 50 years 9,751 9,590 9,607
Total 12,795 12,671 12,756
Germany (companies with about 98% of domestic employees).
Includes employees and vocational trainees with severe disabilities or similar.
The employment rate of severely disabled employees in Germany is
about 6%. In terms of the Group companies, about half are above the
statutory quota of 5%, even in numerous areas that might not seem
particularly suitable for employees with severe disabilities at first glance.
Employment conditions
Collective agreements
Employees by employee type as of Dec 31 (NP) 2018 2017 2016
Employees subject to collective bargaining agreements 169,494 161,609 157,545Civil servants 21,113 22,982 24,423Employees on individual contracts 1) 10,285 9,825 9,736
Total 200,892 194,416 191,704
Germany (companies with about 98% of domestic employees).1) The figures for employees on individual contracts primarily include executive
employees (managers), employees paid above the wage agreement level (known as non-tariff employees) and employees with individual contractual agreements.
The working conditions for DB Group employees are oriented, in addition
to country-specific regulations, primarily on collective bargaining agree-
ments that have been concluded with the trade unions in the respective
countries.
In principle the collective wage agreements apply to employees in
Germany. The activities of civil servants in DB Group are based on stat-
utory allocation under Art. 2 (12) of the Rail Restructuring Act (Eisen-
bahnneuordnungsgesetz). The same wage agreement provisions within
DB Group therefore apply on this basis to civil servants, insofar as the
legal regulations governing civil servants do not conflict with this.
Employees with collective agreements as of Dec 31 (NP) 2018 2017
Change
2016absolute %
Employees with collective wage agreements 190,556 184,533 + 6,023 + 3.3 181,915
Share (%) 94.9 94.9 – – 94.9
Germany (companies with about 98% of domestic employees).
The share of employees subject to collective bargaining agreements
remains at a high level.
Further improvements of employment conditionsFurther developments of the employment conditions for executives and
employees not subject to collective wage agreements µ85 are being
made continuously. DB Groupʼs strategy is based on the remuneration
policy and the structure of ancillary services.
The variable compensation is consistent with the objectives of
strategy DB2020+.
To improve compatibility of work and private life, executives and
employees not subject to collective wage agreements are able to nego-
tiate a sabbatical of up to six months. We also support the provision of
part-time executive employment and interim management.
DB Group has launched the “partial retirement for older employees
and executives in DB Group” program. The purpose of the program is to
reduce the individual workload and, simultaneously, maintain the
employability of older executives until the statutory retirement age.
Social and fringe benefitsIn addition to payment that is fair and commensurate with performance,
DB Group also offers a wide range of social and fringe benefits. The five
major social partners – BSW, Bahn-Betriebskrankenkasse, Verband
Deutscher Eisenbahner Sportvereine, DEVK-Versicherungen and Sparda-
Banken – offer benefits packages for our employees. In cooperation with
BSW and awo lifebalance, DB Group offers its employees various options
for childcare. Up to 90 childcare places are available in the DB-owned
facility Bahnbini in Frankfurt am Main and 192 places are available in
childcare facilities not owned by DB Group. During the summer vacation,
the children of employees are able to take part in DB RasselBAHNde
program at various DB sites. Parents also receive support from awo life-
balance in their search for childcare options, emergency and vacation
care services, as well as with the placing of au pairs and day care staff.
Through awo lifebalance, we also offer our employees extensive support
in caring for relatives.
Balancing of a career and private life
Employees by working hours and gender as of Dec 31 (NP) 2018 2017 2016
Full-time 180,163 175,091 173,679 thereof women 34,078 32,665 32,360Part-time 20,729 19,325 18,025 thereof women 12,340 11,827 11,465
Total 200,892 194,416 191,704
Germany (companies with about 98% of domestic employees).
102-8102-41
GRI
404-2
GRI
102-8
GRI
Deutsche Bahn Group 2018 Integrated Report
260

DB Group offers various part-time models. This supports a better balance
between career and family.
Employees by contract type as of Dec 31 (NP) 2018 2017 2016
Permanent 190,770 185,149 183,339 thereof women 43,549 41,784 41,212
Temporary 10,122 9,267 8,365 thereof women 2,869 2,744 2,613
Total 200,892 194,416 191,704
Germany (companies with about 98% of domestic employees).
The share of employees with permanent employment contracts in
Germany remained very high at 95%.
Agency staff as of Dec 31 (NP) 2018 2017 2016
Total 3,751 2,893 2,651
Germany (companies with about 99% of domestic employees).
The increase compared with the previous year was a result of a change
in how data is collected at DB Schenker.
measures against discriminationDB Group is working hard to create a working environment without dis-
crimination or harassment. Capable assistance for clarifying and pro-
cessing conflict situations is available from the internal office of the
ombudsman for all employees as well as executives and HR staff, along
with the rules in the Group Employer/Works Council Agreements (Kon-
zernbetriebsvereinbarung; KBV), such as the KBV for equal treatment
and protection against discrimination or the KBV for balancing work,
family and background, as well as guidelines such as those of the Federal
General Act on Equal Treatment (Allgemeines Gleichheitsbehand lungs-
gesetz), for operational integration management or compliance guide-
lines. The focus in all this is on non-bureaucratic and independent extra-
judicial settlement of conflicts. The ombudsman also coordinates the
internal pool of mediators, with over 100 mediators actively contributing.
Actively engaging in preventive efforts and when conflicts arise helps to
continue building a constructive conflict culture and consequently a coop-
erative and positive corporate culture.
Occupational safety and health management Health rate
Health rate (% based on hours) 2018 2017 2016
DB Long-Distance 93.2 93.4 93.4
DB Regional 92.0 92.2 92.4
DB Cargo 92.6 92.7 92.8
DB Schenker 93.4 93.3 94.6
DB Netze Track 94.3 94.5 94.5
DB Netze Stations 93.2 93.4 93.0
DB Netze Energy 95.7 95.6 95.7
Other 93.6 93.6 93.5
DB Group 93.3 93.4 93.5
Germany (companies with about 97% of domestic employees).
The health rate remained nearly unchanged.
Health management Our workplace safety policy is designed to continuously decrease the
number of accidents and the severity of accidents. A special focus of
these efforts is on serious accidents at work – including accidents
involving contractors and, in particular, when working in the vicinity of
tracks. We systematically record employee exposure to potentially car-
cinogenic hazardous substances. Particular attention is paid to pre-
venting post-traumatic stress disorders among train drivers and other
employee groups. DB Group is very well positioned here. In conjunction
with Group security and the trade unions, we are also addressing new
health challenges, such as the change in the working environment caused
by digitalization and employee concerns about attacks and assault.
Occupational accidents
Occupational accidents and LTIF 2018 2017 2016
Fatal accidents worldwide 1) 6 8 7 thereof in Germany 2) 4 7 7Lost time injury frequency (LTIF) in Germany 2), 3) 24.4 25.2 25.0
1) Worldwide (companies with about 98% of employees). 2016 only in Germany.2) Germany (companies with about 97% of domestic employees).3) Non-attendance days due to occupational accidents per 1,000,000 insured work hours. LTIF-related absences of more than one calendar day.
DB Group is aware of its responsibility with regard to occupational health
and safety. Compliance with internal standards and national laws serve
to protect employees. A safe work environment as well as healthy and
motivated employees contribute to the economic success. Various qual-
ification measures were introduced with the aim of further improv ing
safety and awareness among executives and employees.
The LTIF workplace safety key figure fell slightly in Germany in the
year under review. Preparations for reporting worldwide LTIF were also
further promoted.
We have introduced further campaign “Wahlbetrieb” for works council
election purposes for reducing fatal occupational accidents. The focus
is on safety-related behavior when working in the vicinity of tracks.
Representation of employees in occupational health and safety committeesIn Germany, companies with more than 20 employees are legally required
to have an Occupational Health and Safety Committee (Arbeitsschutz-
ausschuss) (section 11 of the Occupational Safety Act; Arbeitssicherheits-
gesetz). The key here is how the operation is defined (production facility,
branch, “Wahlbetrieb” for works council election purposes). The majority
of DB Group companies in Germany fall under this category with more
than 20 employees, so the majority of all employees (more than 75%) are
rep resented in occupational health and safety committees.
403-3 403-4
GRI
403-2403-4
GRI
403-1
GRI
SU
ST
AIN
AB
ILIT
Y
261
NOTES TO SUSTAINABILIT Y — SOCIAL

Occupational and health protection within DB GroupSystematic occupational and health protection makes a vital contribution
to the physical and mental health of employees, as well as the long-term
success of the business.
In addition to occupational safety, holistic health promotion, ergo-
nomic workplace design and employee counseling are the core respon-
sibilities of occupational health management. This is based on risk as-
sessments as a core element of operational workplace safety. From these
workplace risk assessments, including mental stress, measures are drawn
up to avoid or reduce risks, employee instructions are coordinated and
preventive occupational medical care is given.
In addition, there are counseling services offered by occupational
welfare organizations (BSW and Verband Deutscher Eisenbahner Sport-
vereine) and social insurance companies affiliated with DB Group –
railway company health insurance fund (Bahn-Betriebskrankenkasse),
accident insurance for Federal agency and railway staff (Unfallversiche -
rung Bund und Bahn) and German pension fund (Knappschaft-Bahn-See;
KBS).
Development of the number of employees
Employees as of Dec 31 (NP) 2018 2017
Change
2016absolute %
DB Long-Distance 17,626 17,058 + 568 + 3.3 17,400DB Regional 37,879 37,519 + 360 +1.0 37,853DB Arriva 55,327 56,848 –1,521 –2.7 56,564DB Cargo 29,311 28,771 + 540 +1.9 30,084DB Schenker 78,780 74,628 + 4,152 + 5.6 70,805DB Netze Track 48,143 46,489 +1,654 + 3.6 44,957
DB Netze Stations 6,187 5,769 + 418 +7.2 5,396
DB Netze Energy 1,789 1,768 +21 +1.2 1,777Other 56,526 54,531 +1,995 + 3.7 53,496
DB Group 331,568 323,381 + 8,187 + 2.5 318,332
The number of employees was up on the previous year as of December
31, 2018. At the business unit level, the number of employees increased
notably at DB Schenker due to the continued growth path in the contract
logistics division as well as in the maintenance and construction divisions
at DB Netze Track. In addition, the number of employees at DB Long-Dis-
tance, DB Cargo and DB Netze stations also increased significantly. A
decline was recorded at DB Arriva as a result of the cessation of a trans-
port contract.
Employees by regions as of Dec 31 (NP) 2018 2017
Change
2016absolute %
Germany 205,041 197,985 +7,056 + 3.6 195,692Europe (excluding Germany) 96,465 97,307 – 842 – 0.9 96,119Asia/Pacific 16,885 16,046 + 839 + 5.2 15,084North America 9,798 9,055 +743 + 8.2 8,730Rest of world 3,379 2,988 + 391 +13.1 2,707
DB Group 331,568 323,381 + 8,187 + 2.5 318,332
Germany recorded the largest absolute growth year on year. This was
mainly a result of the development at DB Netze Track and DB Schenker.
The percentage of employees outside of Germany was unchanged at
about 38%.
New hires
New hires by gender as of Dec 31 (NP) 2018 2017 2016
<30 years 8,085 6,501 5,767 Share of women (%) 31.4 32.1 30.430 – 49 years 9,909 7,318 5,515 Share of women (%) 23.2 23.6 26.6≥ 50 years 2,821 2,245 1,757 Share of women (%) 22.0 20.7 27.2
DB Group 20,815 16,064 13,039
Germany (companies with about 98% of domestic employees).
This does not include the acceptance or hiring of vocational trainees and dual degree students.
The number of newly hired employees in Germany rose significantly once
again. It is still important to develop and retain existing employees in the
long term.
Employee turnover
Employee turnover (NP) 2018 2017 2016
Retirement-related turnover 2,883 3,141 2,960 thereof women 570 650 592Other employee turnover 8,524 7,144 7,204 thereof women 1,732 1,711 1,667
Total 11,407 10,285 10,164
Germany (companies with about 98% of domestic employees).
The figures indicate non-restructuring-related turnover of permanent employees. Part-time working in the lead-up to retirement is also included in retirement-related employee turnover.
Employee turnover (%) 2018 2017 2016
Retirement-related turnover 1.4 1.6 1.6 thereof women 1.2 1.5 1.4Other employee turnover 4.2 3.7 3.8 thereof women 3.8 3.9 3.9
Total 5.7 5.3 5.4
Germany (companies with about 98% of domestic employees).
The figures indicate non-restructuring-related turnover of permanent employees. Part-time working in the lead-up to retirement is also included in retirement-related employee turnover.
Turnover increased at a low level.
403
GRI
!!!
401-1
GRI
401-1
GRI
Deutsche Bahn Group 2018 Integrated Report
262

EnvironmentalEmployees for environmental protection
Through training no. 90, professional development programs and var-
ious campaigns, we bring environmental protection to life for our em -
ployees. In the year under review, more than 70 courses were held with
a total of 850 participants in Germany. DB Schenker uses an updated
e-learning eco-movie to present environmental measures and products in
its national organizations, which is also suitable for sales and customers.
Climate protection
Greenhouse gas footprint in overview
Absolute CO₂e emissions by journeys, transportsand stationary facilities (million t) 2018 2017 2016
Regional rail passenger transport 2.91 3.17 3.10 thereof in Germany 2.15 2.38 2.38Long-distance rail passenger transport 0.05 0.52 0.52Bus transport 1.72 1.76 1.78 thereof in Germany 0.60 0.63 0.67Rail freight transport 1.83 1.98 2.05Road freight transport 1) 3.67 3.90 3.89Air freight 1) 6.78 6.76 6.16Ocean freight 1) 2.27 2.27 2.07
Other transport 2) 0.11 0.11 0.11Stationary facilities 1.47 1.50 1.51
Total 20.81 21.97 21.19
Well-to-wheel (WTW), scope 1 – 3.1) With pre- and onward carriage.2) Including DB Connect, internal traffic.
Absolute CO₂e emissions in line with scopes 1 – 3 (million t) 2018 2017 2016
Total 20.8 22.0 21.2 Share of scope 1 (%) 18.4 17.8 18.3 Share of scope 2 (%) 20.5 23.3 24.3 Share of scope 3 (%) 61.1 58.9 57.5
Previous years’ figures adjusted.
Our adjusted greenhouse gas footprint shows the amount of greenhouse
gases that we emitted in one year. It consists of the emissions from all
journeys and transports of DB Group by rail, road, air transport and
shipping and the emissions of stationary facilities such as stations or work-
shops and of the fleet, which includes, for example, company cars. These
figures provide the basis for calculating specific greenhouse gas emis-
sions and determining the results of our climate target within the limits
set. They also act as a benchmark for our efficiency improvement mea-
sures and provide a basis for comparison with other companies. The
scope 2 emissions of 4.27 million tons of CO₂e take into account mar-
ket-based mechanisms, meaning that this figure includes all contractu-
ally regulated instruments for generating and trading electricity from
renewable energies. In accordance with the scope 2 guidelines of the
Greenhouse Gas Protocol on dual reporting, we also report location-
based scope 2 emissions. Based on the respective national energy mixes,
the scope 2 emissions total 5.71 million tons of CO₂e. The majority of our
greenhouse gas emissions are scope 3 emissions from our subcontrac-
tors. We are therefore set to agree on binding reduction targets with our
largest carriers to reduce total greenhouse gas emissions.
Noise reduction
Noise remediation continues as scheduled
Noise remediation in Germany as of Dec 31 2018 2017 2016
Track kilometers noise remediated in total (km) 1,785 1,703 1,605
Accumulated length of noise remediated sections of track in accordance with Annex 1 of the German Federal Government’s 2013 overall noise remediation program, including partial completion of junction projects and sections that have partially undergone noise prevention.
We have revised the key figure for noise remediation µ92 in the year
under review. For better comparability with previous years, we also
present the key figure as per the old definition.
Implementation of passive noise prevention measures
Noise prevention (new construction and expansion lines) in Germany as of Dec 31 2018 2017 2016
Homes with passive measures 1,571 1,410 1,491
Previous year’s figures adjusted.
When constructing new lines and expanding lines, we are legally obli-
gated to implement noise protection measures for residents who live
in the immediate vicinity of rail tracks and for whom the noise exceeds
the 49 dBA limit. These measures include sound-insulating windows
no. 101 and ventilators as well as noise reduction wall and roof insulation.
In the year under review, we pressed ahead with implementing these
measures as part of our new construction and expansion projects,
including in Westphalia and Rhineland-Palatinate. The “Homes with pas-
sive measures” key indicator represents the number of households
affected that have submitted feedback on the noise protection measures
in place with implementation of these measures being initiated at least
once for each section of track affected.
Resource efficiency
Recycling of ballast and concrete sleepersFor maintenance of the ballast bed, we have set up a materials cycle for
ballast, concrete ties no. 73 and tracks. About 4 to 5 million tons of
old material are removed from the network annually and then almost the
same volume is rebuilt into the network. About 1.6 million tons of ballast
are mechanically removed every year on-site by track-bound ballast
cleaning machines or mobile processing plants and immediately reused.
This significantly reduces the amount needed for new ballast, in addition
to reducing its transport costs and greenhouse gas emissions. For the
most part, the rest of the material is processed into recycled ballast
no. 51 in an external certified disposal facility for DB Group or prepared
as gravel or crushed sand for road building. A total of 3.5 million tons of
ballast were used in the year under review, about 0.7 million tons of
which were recycled ballast.
305-1305-2305-3
GRI
301-1301-2
GRI
SU
ST
AIN
AB
ILIT
Y
263
NOTES TO SUSTAINABILIT Y — SOCIAL | ENVIRONmENTAL

Air quality control
Reduction of pollutant emissionsWe have set ourselves the objective of reducing the soot particulate
emissions of our own rail and road vehicles by 55% by 2020 compared to
2010. These particulate emissions are especially dangerous to health
and are caused by burning fuel.
The ongoing modernization of our fleet of vehicles is our main action
toward achieving this goal. The high electrification rate of our rail net-
work plays a major role here because the vehicles themselves do not
produce local pollutant emissions, except for particles; the generation
of traction current only causes decentralized emissions in power plants.
By the year under review, we had already reduced soot particles by 47.7%
(previous year: 44.5%). The calculation is based on the energy consump-
tion and composition of our fleets by pollutant categories. By mid-2018,
we fully implemented the regulation on the use of low-emissions vehi-
cles and construction machinery no. 11 in urban construction sites.
DB Groupʼs combustion-related pollutant emissions are also largely
influenced by our ocean and air freight activities – for example, these
activities emit over 81% of soot particles. We constantly strive to make
improvements in this area as well in cooperation with carriers. We are
expecting there to be a sharp reduction as a result of gradually switching
our truck fleet to electric vehicles. We launched a “low sulfur” program in
the ocean freight sector that allows our customers to move their con-
tainer transport to low-sulfur marine diesel in unregulated ports for a
small surcharge.
ŒAdditional information
Absolute airborne pollutants from journeys and transports (t) 2018 2017 2016
Particulate emissions 6,757 6,846 7,244Nitrogen oxide (NOX) emissions 134,619 136,147 136,236Sulfur dioxide (SO₂) emissions 46,934 50,548 55,120Hydrocarbon (NMHC) emissions 9,530 9,723 10,550
Combustion-related, well-to-wheel (WTW), scope 1 – 3.
Previous year’s figures adjusted.
Our vehicles comply with stringent emissions standardsOur rail and road vehicles meet high Euro standards and thus ensure a
lower level of pollutant emissions:
◊ About 97% of the long-range trucks in use have the highest Euro
standards 5 and 6 (previous year: 99%).
◊ Almost all of our car fleet meets Euro 5 and 6 emissions standards.
◊ About 18% (previous year: 20%) of the rail vehicle fleet continues to
have the lowest pollutant level UIC 0. The share of rolling stock with
low-pollutant electro-traction rose slightly to about 61% (previous
year: about 59%).
◊ The share of our buses meeting the Euro 5 and 6 standards increased
to about 66% (previous year: about 63%).
Nature conservation
IT systems to document protected areasWe use geographic information systems, which store data about train
lines and surrounding land and all digitally available information on pro-
tected areas in Germany. This enables us to quickly identify the points
of contact between nature and DB Groupʼs tracks and rights of way.
These findings are important for our planning. There are different restric-
tions and conditions in each protected area, which are described in pro-
tected area ordinances. These are stored in our system and are taken into
account when planning construction and maintenance work.
Points of contact with conservation areas in Germany 2018 (km)
Protected landscape areas ◊ 7,854
Nature parks ◊ 6,819
Water protection areas ◊ 5,215
Flora and fauna habitat areas ◊ 2,331
Bird sanctuaries ◊ 1,849
Nature conservation areas ◊ 954
Biosphere reserves ◊ 694
National parks ◊ 32 There may be overlaps between conservation areas.
mitigation and compensation measuresWe take nature conservation into account during the construction,
expansion or maintenance of rail infrastructure. Our aim is to avoid inter-
fering with nature and the landscape as much as possible. If adverse
effects nevertheless occur, we try to compensate for the loss or replace
it. We document all data no. 59 on these compensation obligations in
the online specialist nature protection and compensation information
system (Fachinformationssystem Naturschutz und Kompensation; FINK).
This enables us to comply with the reporting requirements set forth by
the EBA in accordance with the Federal Nature Conservation Act
(Bundesnaturschutzgesetz). In the year under review, we recorded 3,997
compensation projects in the system, with a total of almost 25,187 mea-
sures, including some 7,291 measures on species protection.
Vegetation control as a means of ensuring safe railway operations We generally apply manual methods to control vegetation. We coordi-
nate closely with the responsible authorities and only use herbicides
where no herbicide-free procedures are available, which is currently just
in the immediate vicinity of the tracks. We have described this procedure
in our guidelines on integrated plant protection. In the year under
review, these guidelines had also been incorporated into the Federal
Government’s national action plan for the sustainable use of plant pro-
tection products.
The use and quantity of herbicides is dependent on weather condi-
tions and vegetation growth. As a result of the extremely dry summer in
the year under review, an absolute quantity of 56 t of herbicide was used.
The amount of herbicide applied corresponds to 1.0 kg per km of track
(pre vious year: 67 t herbicide; 1.2 kg/km of track). At a track length of
about 61,000 km, this means that about 92% of the tracks (previous year:
93%) were treated with the substances flazasulfuron, flumioxazin and
glyphosate in the year under review. These substances have been
approved by the Federal Office of Consumer Protection and Food Safety
305-7
GRI
Deutsche Bahn Group 2018 Integrated Report
264

(Bundesamt für Verbraucherschutz und Lebensmittelsicherheit; BVL)
especially for use in the vicinity of tracks. In November 2017, the EU
Commission extended the approval of glyphosate to the end of 2022. As
part of a project headed by DB Group, the International Union of Rail-
ways (UIC) is examining future alternatives for glyphosate.
We are conducting two studies to help develop eco-friendly vegeta-
tion maintenance along our train paths and under energy supply lines in
the future: one examining the possibilities for environmental vegetation
maintenance along rail lines; and one as part of a Federal research project,
involving Deutsche Umwelthilfe e. V. (German environmental aid), DB
Netze Energy and other operators of electrical networks, to investigate
the possibilities of habitat-linked vegetation maintenance under energy
supply lines.
Responsibility for the plant and animal worldTracks, buildings and land held by DB Group often provide a habitat for
protected species. We develop eco-friendly solutions to offset any
impact that our work has on the natural world.
Protecting birds from catenary systemsWe set up new overhead catenary systems so that birds no. 33 are
protected against electrocution. This is achieved in part by using longer
insulators. We documented about 3,300 short-circuit events caused by
animals in the year under review. About 93% of them were caused by
birds and about 7% by small mammals. Since the year under review,
isolators on existing systems have been fitted with bird deterrents as
part of the full overhead line inspection, providing birds with greater
protection from electrocution. These measures may be the reason
short-circuit events have fallen by about 400 in comparison with the
previous year. Traction current lines in areas that have a high risk of bird
collisions are also being made safe, for example by fitting special bird
diverters no. 140.
Water consumption reducedWater consumption refers to the water taken from the public supply.
Water consumption reduced in the year under review primarily as a result
of improved methods of calculating consumption at DB Schenker.
Water consumed (million m³)
2018 ◊ 8.72
2017 ◊ 8.91
2016 ◊ 8.40
Group-wide environmental management system
Share of DB Group companies with certified environmental management systems in accordance with ISO 14001 as of Nov 30 (%) 2018 2017 2016
DB Group 45 45 55
in Germany 22 56 57 in Europe (excluding Germany) 52 34 49 worldwide (excluding Europe and Germany) 61 59 77
The “Environmentally relevant companies” have formed the basis for determining the percentage of certified companies since 2016.
Our environmental targets are supported by a Group-wide environ-
mental management system no. 131 that is in accordance with DIN ISO
14001. The system’s compliant integration into our Group regulations
has been verified by an independent institute. On this basis, 65% of our
273 environmentally relevant Group companies used an environmental
management system in accordance with DIN ISO 14001 in the year under
review. The share of environmentally relevant Group companies that use
a certified environmental management system is shown by regions. Most
of the decline in Germany in the year under review is due to certificates
in bus companies expiring. The Group Environmental divisions ensures
compliance with and further development of Group-wide environmental
management standards. No significant fines or other penalties for envi-
ronmental offenses were levied against DB Group companies in the year
under review.
Destination natureSince 2001, destination nature no. 37 (Fahrtziel Natur) has promoted
the networking of sustainable tourism and eco-friendly mobility. The
Kellerwald-Edersee national park in Hesse is the 23rd Œdestination
nature and wants to give greater support to promote eco-friendly tourism.
Adjusting to the impacts of climate changeAs a “critical infrastructure” in Germany, DB Group is particularly aff ect ed
by the short and long-term impacts of climate change. This was acknowl-
edged in a study by the Potsdam Institute for Climate Impact Research
titled “Klimawandel – Auswirkungen auf die Deutsche Bahn AG” (climate
change – impacts on Deutsche Bahn AG). The study concludes that it is
mainly the seasonal shift of extreme weather events and their subse-
quent effects that will pose particular challenges for rail infrastructure
and will require measures to be taken systematically to adapt to these
changes. In response DB Group is drawing up a five-point strat egy and
implementing short-term measures to ensure safe rail ope r ation and a
track infrastructure that can cope with extreme weather events. These
measures include preemptively removing trees at risk of breaking from
storms and snowfall along the train path, structurally securing slopes
that are at risk of slipping, developing track infrastructure as well as
command and control technology that are suited to hot and cold
weather.
In addition, DB Group is participating in research by the BMVI ex pert
network on “Adjusting transport and infrastructure to climate change
and extreme weather events.” As part of this research involving collab-
oration with the EBA, DB Group regulations were analyzed to identify
areas that need to be adjusted and the first hazard maps for rail lines in
Germany were created. These hazard maps support prioritization of mea-
sures and risk communication when dealing with potential climate and
weather-related environmental risks. At the same time, DB Group is also
working with the German Institute for Standardization (Deutsches
Institut für Normung; DIN) to encourage greater consideration of cli-
mate change in national and international standards.
!!!
307-1
GRIS
US
TA
INA
BIL
ITY
265
NOTES TO SUSTAINABILIT Y — ENVIRONmENTAL

To Deutsche Bahn AG, Berlin
We have performed a limited assurance en gage-
ment on the disclosures in the sections “To our
stakeholders – Sustainability management“,
“Group Management Report – chapters Social
and Environmental” and “Notes to Sustain-
ability“ of the Integrated Report of Deutsche
Bahn AG, Berlin (hereinafter: “the Company“),
for the period from 1 January to 31 December
2018 (hereinafter: “Report“).
Responsibilities of the Executive DirectorsThe executive directors of the Company are re s-
ponsible for the preparation of the Report in
accordance with the principles stated in the Sus-
tainability Reporting Standards of the Global
Reporting Initiative (hereinafter: “GRI-Criteria“).
This responsibility of Company’s executive
directors includes the selection and applica-
tion of appropriate methods of sustainability
reporting as well as making assumptions and
estimates related to individual sustainability
disclosures, which are reasonable in the circum-
stances. Furthermore, the executive directors
are responsible for such internal control, as they
have considered necessary to enable the prepa-
ration of a Report that is free from material mis-
statement whether due to fraud or error.
Independence and Quality Control of the Audit FirmWe have complied with the German profes-
sional provisions regarding independence as
well as other ethical requirements.
Our audit firm applies the national legal
requirements and professional standards – in
particular the Professional Code for German
Public Auditors and German Chartered Audi-
tors (“Berufssatzung für Wirtschaftsprüfer und
vereidigte Buchprüfer“: “BS WP/vBP“) as well
as the Standard on Quality Control 1 published
by the Institut der Wirtschaftsprüfer (Institute
of Public Auditors in Germany; IDW): Require-
ments to quality control for audit firms (IDW
Qualitätssicherungsstandard 1: Anforderun gen
an die Qualitätssicherung in der Wirt schafts -
prüfer praxis – IDW QS 1) – and accordingly main-
tains a comprehensive system of quality control
including documented policies and pro cedures
regarding compliance with ethical require-
ments, professional standards and applicable
legal and regulatory requirements.
Practitioner´s ResponsibilityOur responsibility is to express a limited assur-
ance conclusion on the disclosures in the Report
based on the assurance engagement we have
performed.
Within the scope of our engagement, we
did not perform an audit on external sources of
information or expert opinions, referred to in
the Report.
We conducted our assurance engagement
in accordance with the International Standard
on Assurance Engagements (ISAE) 3000
(Revised): Assurance Engagements other than
Audits or Reviews of Historical Financial Infor-
mation, issued by the IAASB. This Standard
requires that we plan and perform the assur-
ance engagement to allow us to conclude with
limited assurance that nothing has come to our
attention that causes us to believe that the dis-
closures in the Company’s Report for the period
from 1 January 2018 to 31 December 2018 has
not been prepared, in all material aspects, in
accordance with the relevant GRI- Criteria.
In a limited assurance engagement the
assurance procedures are less in extent than
for a reasonable assurance engagement and
therefore a substantially lower level of assur-
ance is obtained. The assurance procedures
selected depend on the practitioner’s judgment.
Within the scope of our assurance en-
gagement, we performed amongst others the
following assurance procedures and further
activities:
◊ Obtaining an understanding of the struc-
ture of the sustainability organization and
of the stakeholder engagement
◊ Inquiries of personnel involved in the prepa-
ration of the Report regarding the prepa -
ration process, the internal control system
relating to this process and selected dis-
closures in the Report
◊ Identification of the likely risks of material
misstatement of the Report under consid-
eration of the GRI-Criteria
◊ Site visits and interviews regarding the fol-
lowing business units/sites
◊ Schenker AG, Essen
◊ DB Energie GmbH, Frankfurt am Main
◊ Central units on group level, Berlin/
Frankfurt am Main
◊ Analytical evaluation of selected disclo-
sures in the Report
◊ Comparison of selected disclosures with
corresponding data in the consolidated
financial statements and in the group man-
agement report
◊ Evaluation of the presentation of the se -
lected disclosures regarding sustainability
performance
Assurance ConclusionBased on the assurance procedures performed
and assurance evidence obtained, nothing has
come to our attention that causes us to believe
that the disclosures in the Company’s Report
for the period from 1 January 2018 to 31 De cem-
ber 2018 have not been prepared, in all mate-
rial aspects, in accordance with the relevant
GRI-Criteria.
Intended Use of the Assurance ReportWe issue this report on the basis of the engage-
ment agreed with the Company. The assurance
engagement has been performed for purposes
of the Company and the report is solely in -
tended to inform the Company as to the results
of the assurance engagement. The report is
not intended to provide third parties with sup-
port in making (financial) decisions. Our res-
ponsibility lies solely toward the Company. We
do not assume any responsibility towards third
parties.
Berlin, February 28, 2019
PricewaterhouseCoopers GmbH
Wirtschaftsprüfungsgesellschaft
Hendrik Fink p.p. Robert Prengel
Wirtschaftsprüfer
(German Public Auditor)
1) PricewaterhouseCoopers GmbH has performed a limited assurance engagement on the German version of the sections “To our stakeholders – Sustainability manage-ment“, “Group Management Report – chapters Social and Environmental“ and “Notes to Sustainability“ of the Integrated Report and issued an independent assuran ce report in German language, which is authoritative. The following text is a translation of the independent assurance report.
Independent Practitioner’s Report on a Limited Assurance Engagement on Sustainability Information 1)
Deutsche Bahn Group 2018 Integrated Report
266

268 GRI Content Index 269 UN Global Compact Index270 Glossary 274 List of abbreviations
Additional information

GRI standards (core option)
Degree of fulfillment (fulfilled, partially
fulfilled, not fulfilled) Page
GR I 102: GENER AL DI S CLO SUR E S
1. ORGANIZATIONAL PROFILE
◊ 102-1 Name of the organization Fulfilled 50 ◊ 102-2 Activities, brands, products and services Fulfilled 56 ff. ◊ 102-3 Location of headquarters Fulfilled 50 ◊ 102-4 Location of operations Fulfilled 50, 56 ff. ◊ 102-5 Ownership and legal form Fulfilled 50 ◊ 102-6 Markets served Fulfilled 58 ff. ◊ 102-7 Scale of the organization Fulfilled 50, 56 ff., 96 f., 110 ◊ 102-8 Information on employees and other workers Partially fulfilled 87, 260 f. ◊ 102-9 Supply chain Fulfilled 111, 258 ◊ 102-10 Significant changes to the organization and its supply chain Fulfilled 51, 66, 258 ◊ 102-11 Precautionary principle or approach Fulfilled 168 ff. ◊ 102-12 External initiatives Fulfilled 44 f., 47 f., 256 ◊ 102-13 Membership of associations Fulfilled 45, 258
2. STR ATEGY
◊ 102-14 Statement from senior decision maker Fulfilled 29 ff.3. ETHICS AND INTEGRITY
◊ 102-16 Values, principles, standards and norms of behavior Fulfilled 36 ff., 44, 47 f., 55, 255 f.4. GOVERNANCE
◊ 102-18 Governance structure Fulfilled 33 ff., 36 ff.5. STAKEHOLDER ENGAGEMENT
◊ 102-40 List of stakeholder groups Fulfilled 45 f. ◊ 102-41 Collective bargaining agreements Fulfilled 85, 86, 260 ◊ 102-42 Identifying and selecting stakeholders Fulfilled 45 f. ◊ 102-43 Approach to stakeholder engagement Fulfilled 43, 45 f., 74 f., 85, 258 ◊ 102-44 Key topics and concerns raised Fulfilled 43, 46, 256
6. REPORTING PR ACTICE
◊ 102-45 Entities included in the consolidated financial statements Fulfilled 238 ff. ◊ 102-46 Defining report content and topic boundaries Fulfilled 43 f. ◊ 102-47 List of material topics Fulfilled 43 f. ◊ 102-48 Restatements of information Fulfilled 66, 189 ◊ 102-49 Changes in reporting Fulfilled 43 f. ◊ 102-50 Reporting period Fulfilled 254 ◊ 102-51 Date of most recent report Fulfilled 254 ◊ 102-52 Reporting cycle Fulfilled 254 ◊ 102-53 Contact point for questions regarding the report Fulfilled Cover U5 ◊ 102-54 Claims of reporting in accordance with the GRI standards Fulfilled 254, 268 f. ◊ 102-55 GRI Content Index Fulfilled 268 f. ◊ 102-56 External assurance Fulfilled 254
GR I 103: MANAGEMENT APPROACH ◊ 103-1-3 General requirements for reporting the management approach Fulfilled 74, 77 f., 82 f., 89, 257
GR I 201 : ECONOMIC PER FOR MANCE
◊ 201-1 Direct economic value generated and distributed Fulfilled 96 ff., 185GR I 203: INDIR EC T ECONOMIC IMPAC T S
◊ 203-1 Infrastructure investments and services supported Fulfilled 108 f.GR I 205: ANTI - COR RUP TION
◊ 205-1 Operations assessed for risks related to corruption Fulfilled 254 ◊ 205-2 Communication and training about anti-corruption policies and procedures Fulfilled 255 ◊ 205-3 Confirmed incidents of corruption and actions taken Fulfilled 255
GR I 301 : MATER IAL S
◊ 301-1 Materials used by weight or volume Fulfilled 263 ◊ 301-2 Recycled input materials used Fulfilled 263
GRI Content IndexThis Integrated Report was prepared in agreement with the GRI
standards in the core option.
102-54102-55
GRI
Deutsche Bahn Group 2018 Integrated Report
268

GRI standards (core option)
Degree of fulfillment (fulfilled, partially
fulfilled, not fulfilled) Page
GR I 302: ENERGY
◊ 302-1 Energy consumption within the organization Partially fulfilled 91 ◊ 302-3 Energy intensity Fulfilled 91 ◊ 302-4 Reduction of energy consumption Fulfilled 91 ◊ 302-5 Reductions in energy requirements of products and services Partially fulfilled 91
GR I 305: EMI S SION S
◊ 305-1 Direct (scope 1) GHG emissions Fulfilled 263 ◊ 305-2 Energy indirect (scope 2) GHG emissions Fulfilled 263 ◊ 305-3 Other indirect (scope 3) GHG emissions Fulfilled 263 ◊ 305-4 GHG emissions intensity Fulfilled 90 f. ◊ 305-5 Reduction of GHG emissions Fulfilled 90 ◊ 305-7 Nitrogen oxides (NOx), sulfur oxides (SOx) and other significant air emissions Fulfilled 264
GR I 30 6: EFFLUENT S AND WA STE
◊ 306-2 Waste by type and disposal method Fulfilled 93GR I 30 7: ENVIRONMENTAL COMPLIANCE
◊ 307-1 Non-compliance with environmental laws and regulations Fulfilled 265GR I 4 01 : EMPLOYMENT
◊ 401-1 New employee hires and employee turnover Partially fulfilled 84, 87, 259, 262 f. GR I 4 03: O CCUPATIONAL HE ALTH AND SAFET Y
◊ 403-1 Workers representation in formal joint management worker health and safety committees Fulfilled 261 f.
◊ 403-2Types of injury and rates of injury, occupational diseases, lost days, and absenteeism, and number of work-related fatalities Fulfilled 261
◊ 403-3 Workers with high incidence or high risk of diseases related to their occupation Fulfilled 261 ◊ 403-4 Health and safety topics covered in formal agreements with trade unions Fulfilled 261
GR I 4 0 4: TR AINING AND EDU C ATION
◊ 404-1 Average hours of training per year per employee Partially fulfilled 259 ◊ 404-2 Programs for upgrading employee skills and transition assistance programs Fulfilled 84 ff., 86, 259 f. ◊ 404-3 Percentage of employees receiving regular performance and career development reviews Fulfilled 85 f.
GR I 4 05: DIVER SIT Y AND EQ UAL OPP ORTUNIT Y
◊ 405-1 Diversity of governance bodies and employees Fulfilled 38, 87, 259
Page
HUMAN R IGHT S
◊ Principle 1 Support and respect for international human rights 43 ff., 255 f., 258 ◊ Principle 2 Exclusion of human rights abuses 255 f., 258
L AB OR
◊ Principle 3 Preserving freedom of association and law on collective bargaining 85, 254 ff., 260 f. ◊ Principle 4 Elimination of all forms of forced labor 254 ff., 258 ◊ Principle 5 Elimination of child labor 254 ff., 258 ◊ Principle 6 Elimination of discrimination 47 f., 86 f., 261
ENVIRONMENTAL
◊ Principle 7 Preventive environmental protection 43 ff., 67, 88 ff., 263 ff.
◊ Principle 8 Initiative for greater environmental awareness43 ff., 88 f., 115 f., 120 ff., 127 f., 135 ff.,
142 f., 153 ff., 158, 161 ff., 263 ff. ◊ Principle 9 Development and dissemination of eco-friendly technologies 43 ff., 71 f., 80 f., 88 ff., 136 f., 142 f., 263 ff.
ANTI - COR RUP TION
◊ Principle 10 Measures against corruption 38, 46, 254 f.
UN Global Compact IndexUpon joining the UN Global Compact in 2009, DB Group made a commit-
ment to support its ten principles, and regularly reports on its activities
and services in a Communication on Progress.
269
ADDITIONAL INFORMATION — GRI cONTeNT INDex | UN GLObAL cOMpAcT INDex

Airborne pollutants Air pollution that can have a detrimental effect on the environment. An airborne pollutant can be caused naturally or by people, for example NOx or SO₂.
Bond Interest-bearing security which is used to borrow funds on the capital market. Helps mid- to long-term debt financing by companies.
Bus kilometers (bus km) The journey of a bus over a distance of 1 km.
Capacity utilization How much of possible capacity is actually used.
Capital employed Includes property, plant and equipment (including intangible assets) and the net current assets.
Carbon Disclosure Project (CDP) An international organization which runs the global disclosure system for investors, companies, cities, countries and regions to measure and control their environmental impacts. It is now the world’s largest emis-sions register for business-related green-house gas emissions.
Climate Not only weather, but also a snapshot of climate factors (altitude, relief, vegetation, etc.) and climate elements (rain, sunlight, etc.) at a location.
CO₂ equivalents Gases that affect climate change, such as methane and nitrous oxide, which are converted to CO₂ based on their equivalent climate impact.
Combined transport Combined transport of containers or entire trucks on rail and road.
Commercial paper program (CP program) Contractual framework or model documenta-tion for the issue of commercial papers.
Compliance An important component of corporate governance. This is understood as compliance with laws and directives, as well as voluntary codes of conduct in the company.
Contract logistics Service packages comprising multiple logis -tics activities. The service provider not only organizes transport orders, but also independently undertakes parts of the value-added chain.
Contracting organization In general, the Federal states that, as public transport authorities, order regional rail passenger transport services from transport companies.
Costs of capital Based on market values as a weighted average of risk-adequate market returns for the minimum return requirement calculated for debt and equity capital.
Credit facilities Credit facilities granted by banks which can be utilized if necessary. These are firmly com-mitted credit lines with different maturities, some of which serve as liquidity reserves that are available at all times, while umbrella credit lines are available to foreign subsidiaries in particular for working capital financing and as a guarantee line.
Customer satisfaction index Index generally rated on a grading scale of 1 (very satisfied) to 6 (very dissatisfied). These grades are converted and shown on a scale of 0 to 100: (0 points = grade 6; 20 points = grade 5; 40 points = grade 4; 60 points = grade 3; 80 points = grade 2; 100 points = grade 1).
Customer satisfaction Satisfaction of customers and partners with a product/offer or a service, surveyed on a representative basis and evaluated on behalf of DB Group by independent market research institutes by telephone, in person or online.
DBeco plus Service for rail freight transport customers to have their goods transported without CO₂ emissions on all electrified lines within Germany and Austria.
DB traction current mix Electrical traction current that DB Netze Energy uses to supply DB Group’s own rail transport com panies in Germany.
Debt issuance program Contractual framework or model documen-tation for the issuance of bonds. This guarantees a high degree of flexibility in issuing activity.
Derivative financial instruments (derivatives) Financial instruments, the price or value of which depends on the future rates or prices of other goods, assets or reference values (interest rates, indices). These are contracts in which the contracting parties agree to buy, sell or swap assets at specified conditions in the future, or alternatively make value equalization payments.
Diversity Refers to variation within the workforce with regard to gender, background, nationality, age, religion, sexual orientation and levels of physical and mental ability. Diversity also encompasses employees’ variety of views, values, professional experiences and skills.
Earnings before interest and taxes (EBIT) Operating profit before interest and taxes.
Earnings before interest, taxes, depreciation and amortization (EBITDA) Operating profit before interest, taxes, depreciation and amortization.
Ecosystem (digital) Gears structure and functionality toward organic systems. With ecosystems, a portfolio is developed from in-house developments, affiliated companies and partnerships for a specific subject area. The portfolio is orga-nizationally separate from the core business. A forward-looking digital ecosystem is the smart and flexible nesting of individual inde-pendent business models.
A
b
c
D
e
Glossary
Deutsche Bahn Group 2018 Integrated Report
270

Employee satisfaction index As part of the Group-wide employee survey conducted every two years, the index is calculated using questions about motivation, employee satisfaction and (emotional) con-nection on a scale of 1 to 5 (top value).
Employer attractiveness Measured as a weighted average of employer ranking in the main target groups, as determined by trendence – Europe’s leading research institute in employer branding, HR marketing and recruiting.
Energy mix Composition of electricity broken down by type of energy generation (for example coal, renewable energies).
Environment Plus Special offers for customers in passenger transport to travel CO₂-free.
Equity method/at-equity accounting Procedures for conducting the accounting of subsidiaries, which are not included in the consolidated financial statements on the basis of full consolidation with all assets and liabilities. The book value of the subsidiary is adjusted by the development of the pro rata equity in the holding.
Equity ratio Key financial indicator based on the balance sheet structure: proportion of equity in the balance sheet total as a percentage.
Evaluation of facilities quality To ensure maintenance funds are used according to demand and to assess im - provements stemming from implemented measures, the condition of structural and technical facilities undergo a periodic and event-driven evaluation.
Existing network Existing rail network and therefore core of the infrastructure.
Final energy The energy form for which an end consumer receives an invoice, for example for the quantity of fuel added or the traction current obtained.
Floating rate note (FRN) Bond with a variable interest rate.
Gearing Key financial indicator which, as a structural indicator, describes the ratio of net financial debt to equity as a percentage.
German Sustainability Code Provides a framework for reporting non- financial performance which can be used by organizations and companies of any size and legal form.
Global Reporting Initiative (GRI) An international organization which is com-mitted to the dissemination and im prove ment of sustainability reporting. The GRI standards are regarded as the most widely used and most internationally recognized report ing standard for sustainability.
Greenhouse Gas (GHG) Protocol A globally recognized standard for classi -fying and managing greenhouse gas emis- sions which is used by many companies, non-govern mental organizations (NGOs) and governments.
Gross capital expenditures Overall capital expenditures in property, plant and equipment and intangible assets – regardless of the type of financing.
Gross profit Amount of revenues remaining after deduc- tion of the variable costs (= revenue-related) or direct costs (= contract-related).
Health rate (according to downtime) Shows the proportion of lost labor that is not caused by illness in the overall perfor-mance (as a percentage and broken down by business units) and therefore only includes em ployees who are still paid a salary.
Hydrocarbons (NHMC) These are found in crude oil, natural gas or coal, for example. Their emissions are regarded as harmful to the environment.
Interest-free loans Loans from the Federal Government that have to be repaid, but are not interest- bearing. These result from financing contributions from the Federal Republic of Germany for capital expenditures for track expansion and replacement.
Intermodal competition Competition between different modes of transport, for example between rail and air transport.
International Financial Reporting Standards (IFRS) Internationally recognized accounting stan-dard. Since 2002, IFRS has been regarded as the leading approach to standards adopted by the International Accounting Standards Board. Previously adopted standards are still cited as International Accounting Standards (IAS).
Interoperability (multi-system capability) Ability of rolling stock to adapt to different technical standards (for example track gauges or power systems) and therefore run as seamlessly as possible between different rail networks in individual countries.
Intramodal competition Competition within a mode of transport, for example within the railway sector.
Investment grants Financing contributions from third parties in specified capital expenditure projects without future repayment requirements.
K brake shoes Brake shoe made from composite materials (K), see also V brake shoes.
F
G
H
I
K
271
ADDITIONAL INFORMATION — GLOssARy

LL brake shoe Brake shoe made from composites (LL: low noise, low friction), see also V brake shoe.
Local transport Transport services using the products IRE, RB, RE and S-Bahn (metro).
Long-distance transport Transport services using the products ICE and IC/EC.
Lost time injury frequency (LTIF) Describes the relationship between accident frequency and hours actually worked based on one million working hours.
Mode of transport Transport medium such as road or rail.
Net capital expenditures Gross capital expenditures less investment grants from third parties, for example for infrastructure capital expenditures.
Net financial debt Balance of interest-bearing external liabilities and liabilities from finance leases, as well as cash and cash equivalents and interest- bearing external receivables.
Nettable plan assets Assets that are netted against total pension obligations on the balance sheet.
Noise Disruptive or harmful noises for persons and the environment.
Noise barrier Means of active noise abatement on rail lines, usually made from materials such as aluminum, wood and concrete. New noise barriers are walls made from wire baskets filled with stones (gabions).
Noise prevention Legal claim to noise-protection measures on new construction and expansion lines.
Noise reduction Reduction of noise by active (for example noise barriers) and passive (for example soundproof windows) noise remediation, as well as noise reduction measures in vehicles.
Noise remediation program Voluntary program of the Federal Govern- ment implemented by DB Group to reduce noise on existing rail lines.
On-demand servicesServices that are supplied to customers when they need and request them.
Operating income after interest Profit figure that includes financing costs to assess profits in the long term (particularly relevant for infrastructure business units). Therefore, in comparison to EBIT, the net operating interest is also taken into account.
Operating leases Off-balance-sheet financial instruments: leased or rented assets.
Overall punctuality Covers at DB Netze Track all rail transport on DB Netz AG infrastructure.
Particles Tiny portions of matter, right down to the smallest traces, such as dust or soot.
Passenger kilometers (pkm) Unit of measurement for volume sold in pas-senger transport: product of the number of passengers transported and the average travel distance.
Percentage of staffing needs covered Represents the number of active staff, including part-time employees, trainees and dual degree students converted in full- time employees, divided by the full-time staff- ing requirements, including trainees and dual degree students.
Platooning System that enables two or more vehicles to travel in close proximity using technical driving assistance and control systems.
Primary energy Energy calculated from the energy source in its natural form, for example including pro-duction, transport and conversion.
Punctuality Share of stops on time in relation to all stops along and at the end of routes in Germany. A stop is considered on time if the stop has not exceeded the planned arrival time by more than 6 minutes in passenger transport or 16 minutes in freight transport.
Purchasing volume Net total of all order values from individual orders and batches from framework agree-ments that were concluded by the respective product areas.
Rate of people making connections on long-distance transport/long-distance transport Percentage of connections in long-distance transport shown in the schedule that are actually made.
Rating Classification of creditworthiness provided by rating agencies which impacts the refinancing options and expenses of a company.
Redemption coverage Key financial indicator that describes the ratio between the current financing strength and financial obligations of the company (adjusted net financial debt).
Renewable energies Energy from renewable sources that are theoretically unlimited in supply, such as water, wind or sunlight.
Requirement plan New and expansion lines set out in the Federal Transport Infrastructure Plan.
Resource Aid, fund, reserve, raw material.
L
M
N
O
p
R
Deutsche Bahn Group 2018 Integrated Report
272

Return on capital employed (ROCE) Key performance indicator for value-based management. Equals the return on capital employed for business operations (capital employed). Percentage ratio of (adjusted) EBIT to the capital employed.
Scope 1 – 3 (in accordance with GHG) As part of carbon accounting, emissions are divided into three scopes. For DB Group: scope 1 = greenhouse gas emissions from our own vehicles, scope 2 = traction current supply, scope 3 = transport services of our subcontractors. Due to our business model, scope 3 includes only transport-related emissions in accordance with the Greenhouse Gas Protocol.
Scope of consolidation Group of subsidiaries included in the con-solidated financial statements.
Soot particles Emissions produced during the combustion of diesel fuels. Diesel emissions also include particulate matter.
Specific Relative, for example based on the volume sold.
Stakeholders Interest groups and representatives.
Stationary facilities Buildings and facilities such as plants and train stations.
Station pricing system Transparent and non-discriminatory pricing system for the use of passenger stations. The level of station prices depends largely on the performance level and level of equip-ment at the respective station.
Supply chain The stages of production illustrated as an orderly sequence of activities. These activities add value, consume resources and are interconnected in processes.
Supply reliability Measure of the reliability of energy supply for rail operations in Germany.
Sustainability Guiding principle for the compatibility of environmental, social and economic objectives for sustainable and generationally compatible development.
Sustainable development goals (SDGs) Political targets set by the United Nations with a view to assuring sustainable develop-ment at the economic, social and environ-mental levels. The targets came into force on January 1, 2016 and run until 2030. They apply to all member states.
Swap The basic concept for financial instruments that involve the exchange of future cash flows. This allows financial risks (interest, currencies, raw materials) to be hedged in a targeted manner.
Tank-to-wheel (TTW) Calculates emissions caused by burning fuel excluding the raw material extraction and production process.
Ton kilometers (tkm) Unit of measurement for the volume sold in freight transport: product of the amount of freight carried (tons) and the distance (kilometers).
Traction Drive to move trains. Depending on the energy source, drive unit and power trans-mission, a distinction is made between electric, diesel-electric, diesel-hydraulic and other types of traction. Traction units that also have diesel-assisted traction in addition to electric traction are also referred to as hybrid vehicles.
Traction current mix Composition of the traction current of all train operating companies in Germany supplied by DB Netze Energy (in addition to other sup-pliers) through the traction current grid.
Train kilometers (train km) Equal to the journey of a train over a distance of 1 km.
Train path The share of track capacity that is required for a train to travel between two locations in a set time.
Train-path kilometers (train-path km) See volume produced.
Train-path pricing system (TPS) Includes the prices for train path utilization by customers (in particular those of train operating companies) depending on the par-ticular market segment and the train-path kilometers traveled.
Transport contract Agreement between the contracting organi-zation and train operating company to provide regional passenger transport services.
United Nations Global Compact The world’s largest and most important initia-tive for responsible corporate management. On the basis of its ten universal principles, it pursues the vision of an inclusive and sus-tainable global economy to the benefit of all people, communities and markets, today and in the future.
V brake shoes Brake shoe made from composites (Verbund-stoffen; V) which halves the rolling noise of freight cars. Collective term for K and LL brake shoes.
Vegetation control Checking and cutting/removing vegetation in and on the tracks using mechanical and chemical (only in the immediate vicinity of the tracks) procedures.
Volume produced Distance traveled by train operating compa-nies on the rail network. Unit of measure-ment: train-path kilometers (train-path km).
Volume sold Key indicator to measure the service provided in passenger and freight transport. Units of measurement: passenger kilometers (pkm), ton kilometers (tkm).
Well-to-wheel (WTW) Method of calculating fuel emissions includ - ing the entire supply process.
Whisper brake See K and LL brake shoe.
s
T
U
V
W
273
ADDITIONAL INFORMATION — GLOssARy

ABS expansion lineAEG General Railways ActAgv MoVe Mobility and Transport Services AssociationAktG Stock Corporation ActApS Pro-Rail AllianceAUD Australian dollar
bbl BarrelBEV Federal Railway FundBGB Civil CodeBGH Federal Supreme CourtBilMoG Accounting Law Modernization ActBMF Federal Ministry of FinanceBMVI Federal Ministry of Transport and Digital InfrastructureBNetzA Federal Network AgencyBR Series (Baureihe)BSW Railway Social Work FoundationBSWAG Federal Rail Infrastructure Extension ActBund German Federal GovernmentBus km Bus kilometersBUV Requirement Plan Implementation AgreementBVWP Federal Transport Infrastructure PlanB2B Business-to-businessB2C Business-to-consumer
CEF Connecting Europe FacilityCER Community of European Railway and Infrastructure CompaniesCHF Swiss francsCNY Chinese yuanCO₂ Carbon dioxideCO₂e CO₂ equivalentCOSO Committee of Sponsoring Organiza-tions of the Treadway CommissionCSA Credit Support AgreementsCSR Corporate Social ResponsibilityCSR-RUG CSR Directive Implementation ActCTA Contractual Trust Arrangement
dB DecibelDB AG Deutsche Bahn AGDB E&C DB Engineering&ConsultingDB Finance Deutsche Bahn Finance GmbHDBGrG Deutsche Bahn Foundation ActDB Group Deutsche Bahn GroupDGCN German Global Compact NetworkDNK German Sustainability CodeDSD Digital Rail for GermanyDSTW Digital interlocking
EAV Profit and loss transfer agreementEBA Federal Railway AuthorityEBIT Earnings before interest and taxesEBITDA Earnings before interest, taxes, depreciation and amortizationECB European Central BankECJ European Court of JusticeEDIP European debt issuance program
EE Renewable energiesEIU Rail infrastructure companyEnWG Energy Industry LawERegG Railway Regulation ActESTW Electronic interlockingET Electric multiple unitETCS European Train Control SystemEU European UnionEVG Railway and Transport Workers Union
Fed US Federal ReserveFRN Floating rate noteFS Ferrovie dello Stato (Italian state-owned railway)FTE Full-time employees
GBP British pound sterlingGDL Train Drivers’ UnionGDP Gross domestic productGRI Global Reporting InitiativeGVFG Municipal Transport Financing ActGWh Gigawatt hour
ha HectareHGB Commercial Code
IC IntercityICE Intercity Express ICS Internal control systemIFRS International Financial Reporting StandardsISO International Organization for StandardizationIT Information technology
KBS Social insurance for railway workers and seafarers (Knappschaft-Bahn-See)KBV Group Employer/Works Council AgreementKonTraG Act on Supervision and Transparency in the Corporate SectorkWh Kilowatt hour
LaTPS Noise-based train-path pricing systemLST Command and control technologyLTI Long-term incentiveLTIF Lost time injury frequencyLuFV Performance and Financing Agreement
m² Square metersMaRisk Minimum requirements for risk managementMitbestG Co-Determination ActMJ MegajouleMRR Minimum required rate of returnMWh Megawatt hour
NABU Nature and Biodiversity Conservation AssociationNBS New construction lineNkm Commercial vehicle kilometersNOK Norwegian kroneNOX Nitrogen oxide emissions
NP Natural persons NS Nederlandse Spoorwegen (Dutch state-owned railway)
OKM Ecosystem managementOPEX Operational excellenceÖPNV Local public transportÖSPV Public road passenger transport
P PassengersPCGK German Public Corporate Governance CodePFA Plan approval sectionPkm Passenger kilometersPKP Polskie Koleje Państwowe (Polish state-owned railway)PwC PricewaterhouseCoopers
RENFE Red Nacional de los Ferrocarriles Españoles (Spanish state-owned railway)RMS Risk management systemROCE Return on capital employed
SBB Swiss Federal RailwaysSDGs Sustainable development goalsSGV Rail freight transportSI Satisfaction indexSNCF Société Nationale des Chemins de fer Français (French state-owned railway)SO₂ Sulfur dioxide emissionsS&P S&P Global RatingsSPD Social Democratic Party of GermanySPNV Regional rail passenger transportSPS Station pricing systemSPV Rail passenger transportSts Secretary of state
T Thousandt TonTEN Trans-European NetworksTEU Twenty-foot equivalent unittkm Ton kilometersTOC Train operating companyTPS Train-path pricing systemTrain km Train kilometersTrain-path km Train-path kilometers
UIC International Union of RailwaysUNGC United Nations Global CompactUSD US dollar
VDE German unification transport projectsVDV Association of German Transport CompaniesV brake shoe Composite brake shoes
WACC Weighted average cost of capitalWi-Fi Wireless local area networkWpHG Securities Trading Act
ZIP Future Capital Expenditures Program
A
b
c
D
e
F
G
H
I
K
L
M
N
O
p
R
s
T
U
V
W
Z
List of abbreviations
Deutsche Bahn Group 2018 Integrated Report
274

Contact informationInvestor Relations
Deutsche Bahn AG
Investor RelationsEuropaplatz 110557 Berlin GermanyPhone: +49-30-2 97-6 40 31Fax: +49-69-2 65-2 01 10E-mail: ir @ deutschebahn.comInternet: www.deutschebahn.com/ir-e
This Integrated Report and the Annual Financial Statements of Deutsche Bahn AG, the Annual Reports of DB Fernverkehr AG, DB Regio AG, DB Station&Service AG and DB Netz AG (only available in German) as well as up-to-date information are also available on the Internet.
This Integrated Report and the Annual Financial Statements of Deutsche Bahn AG are published in German and English.
The 2018 Integrated Report was published on March 28, 2019 and is available on the Internet at Œdb.de/ib-e.
Corporate Communications
Corporate publications and the booklet Competition Figures are available online or can be requested from Corporate Communications:Deutsche Bahn AG
Corporate CommunicationsPotsdamer Platz 210785 BerlinGermanyPhone: +49-30-2 97-6 10 30Fax: +49-30-2 97-6 19 19E-mail: presse @ deutschebahn.comInternet: www.deutschebahn.com/en/presse
DB service number
Our service number +49-1 80-6 99 66 33 gives you direct access to all of our telephone services. These services include our Group-wide general information phone number, timetable information and booking of train tickets, our customer dialog and our frequent trav-eler system (BahnCard).
The following charges apply: calls from the German fixed-line network cost 20 ct/call; calls from the German cell phone network cost 60 ct/call at most.
Leisure and business travelers can find Œanswers
to frequently asked questions and further Œcontact
details online.
Our passenger transport services on social media
Our passenger transport is available on various social media channels for conversations, discussions and for service and product questions. You can find us on Facebook, Instagram, Twitter and YouTube.
Financial calendarJuly 25, 2019
Interim Results Press Conference,
Publication of the Integrated Interim Report
January – June 2019
March 26, 2020
Annual Results press conference,
publication of the 2019 Integrated Report
ImprintEdited by: Deutsche Bahn AG, Investor Relations, Berlin Design and typesetting: Studio Delhi, Mainz Proofreading: AdverTEXT, Düsseldorf Lithography: Koch Prepress GmbH, Wiesbaden Printing: W. Kohlhammer Druckerei GmbH + Co. KG, StuttgartPhotography and consulting: Max Lautenschläger, Berlin
Photo credits (from top to bottom; left to right; front to back): µCover page Max Lautenschläger µ1 Max Lautenschläger µ2 Max Lautenschläger µ3 Max Lautenschläger µ4 – 6 DB AG/Oliver Lang µ6 – 8 Max Lautenschläger
µ8 – 9 Max Lautenschläger µ9 – 10 Max Lautenschläger µ10 – 11 Max Lauten-schläger µ12 – 14 Max Lautenschläger µ14 – 15 DB AG/Axel Hartmann Fotografie µ15 – 17 Benjamin Pritzkuleit µ17 – 18 Max Lautenschläger
µ18 – 19 © Kai Michael Neuhold/VG Bild-Kunst µ20 – 22 Max Lautenschläger
µ22 – 23 Max Lautenschläger µ23 – 24 Pjcsmith2/flickr µ24 – 25 Ein-ride µ25 – 26 Benjamin Pritzkuleit µ28 Max Lautenschläger µ32 Max Lauten-schläger µ48 Mauricio Bustamante µ73 DB AG/Axel Hartmann Fotografie µ73 DB AG/Christian Bedeschinski µ73 Max Lautenschläger µ73 Max Lauten-schläger µ73 Max Lautenschläger µ73 DB AG/Volker Emersleben µ78 DB AG µ78 Max Lautenschläger µ79 Max Lautenschläger µ80 DB AG/MAN/Jan Hölzl µ82 Philipp von Recklinghausen/lux-fotografie µ82 Max Lauten-schläger µ82 DB AG µ82 Max Lautenschläger µ86 DB Schenker µ88 JET-Foto Kranert µ88 DB AG/Claus Weber µ88 DB AG/Claus Weber µ88 Max Lautenschläger µ88 DB AG/Holger Peters µ88 DB AG/Oliver Lang µ94 DB AG/Michael Neuhaus µ94 baranq/Shotshop.com µ94 DB AG µ94 DB AG/Pablo Castagnola µ94 DB AG/Uwe Miethe µ94 DB AG/Christian Bedeschinski
102-53
GRI

Deutsche Bahn AG Potsdamer Platz 2
10785 Berlin Germany
www.deutschebahn.com
Deu
tsch
e B
ahn
20
18
Int
egra
ted
Rep
ort