deutsche bank german, swiss & austrian conference
TRANSCRIPT

Deutsche Bank German, Swiss &Austrian ConferenceDr. Immo Querner, CFOBerlin, 8 June 2016

Deutsche Bank German, Swiss & Austrian Conference, Berlin, 8 June 2016
‘German Mittelstand’
Private policy
holders
Large German corporates, e.g.
V.a.G.
79.0%
Strong roots: originally founded by German corporat e clients; HDI V.a.G still key shareholder
Group structure
Free float
1903
1919
1953
1966
1991
1994
1998
2001
2006
2012
Foundation as ‘Haftpflichtverband der deutschen Eisen- und Stahlindustrie‘in Frankfurt
Relocation to Hannover
Companies of all industry sectors are ableto contract insurance with HDI V.a.G.
Foundation of Hannover Rück-versicherungs AG
Diversification into life insurance
IPO of Hannover Rückversicherung AG
Renaming of HDI Beteiligungs AG to Talanx AG
Start transfer of business from HDI V.a.G. to individual Talanx subsidiaries
Acquisition of Gerling insurance group by Talanx AG
IPO of Talanx AG
History
21.0%1
1 Including employee shares and stake of Meiji Yasuda (below 5%)
IndustrialLines
RetailGermany
Reinsurance (P/C and Life/Health)
RetailInternational
Founded as a lead insurer by German corporates
Listing at Warsaw Stock Exchange2014
2

Deutsche Bank German, Swiss & Austrian Conference, Berlin, 8 June 2016
IndustrialLines
RetailGermany
Reinsurance(P/C andLife/Health)
RetailInternational
CorporateOperations
Four divisions with a strong portfolio of brands
Integrated international insurance group following a multi-brand approach
3

Deutsche Bank German, Swiss & Austrian Conference, Berlin, 8 June 2016
Industrial Lines
Retail International
Reinsurance
� Local presence by own risk carriers, branches and partners create efficient network in >130 countries
� Key target growth regions: Latin America, Southeast Asia/India, Arabian Peninsula
� Target regions: CEE (incl. Turkey) and Latin America
� # 2 insurer in Poland2
# 5 motor insurer in Brazil2# 2 motor insurer in Chile2
# 9 motor insurer in Mexico2
� Global presence focussing on Western Europe, North- and South America as well as Asia
� ~5.000 customers in >150 countries
Presence in countries1
1 By branches, agencies, risk carriers, representative offices2 Source: local regulatory authorities, Talanx AG
International presence International strategy by divisions
� Total GWP: €31.8bn (2015)� 2015 GWP: 49% in Primary Insurance (2014: 53%),
51% in Reinsurance (2014: 47%)� Group wide presence in >150 countries� ~21,900 employees in 2015
Global network in Industrial Lines and Reinsurance – leading position in retail target markets
International footprint and focussed growth strategy
4

Deutsche Bank German, Swiss & Austrian Conference, Berlin, 8 June 2016
Note: Figures restated on the base of IAS81 Currency-adjusted: 4.8% 2 After adjustment for goodwill impairment in German Life business of €155m reported in Q2 2015 3 Approved by AGM on 11 May 20164 2015 Outlook for Group net income was adjusted from „at least €700m“ to „€600-650m“ following the goodwill impairment reported in Q2 2015
0.0%2.0%4.0%6.0%8.0%
10.0%12.0%
2011 2012 2013 2014 20150
200400600800
1000
2011 2012 2013 2014 2015
in €m
0.05.0
10.015.020.025.030.035.0
2011 2012 2013 2014 2015
in €bn
4.0% 4.3% 4.0% 4.1% 3.6%
0.0%
1.0%
2.0%
3.0%
4.0%
5.0%
2011 2012 2013 2014 2015
2015 Outlook Rol >3.0%
2015 Outlook RoE 7-8% 2015 Outlook Net income €600-650m 4; pay-out ratio 35-45%
2015 Outlook GWP growth +1-3%
+5.6% +3.0%+3.6%
+9.7%1
Return on Investment GWP growth
Return on Equity Net income and Payout
515626
732
��
�
+12.6%
769
€1.05 p.s.
€1.20 p.s.
Dividend pay-out ratio
€1.25 p.s.
41.1%41.5%42.1%
73410.0% 10.0% 10.2% 10.2% 9.0%
10.8%2
5.0%
4.0%
3.0%
2.0%
1.0%
0.0%
35.030.025.020.015.010.05.00.0
�
5
FY2015 – Target achievement
889 2
37.0%2
€1.30 p.s. 3
Target 2015: 8.7%
Adjustment for goodwill impairment inGerman Life (€155m/Q2 2015)
Ø pay-out ratioFY2012–15: 40.4%
Deutsche Bank German, Swiss & Austrian Conference, Berlin, 8 June 2016
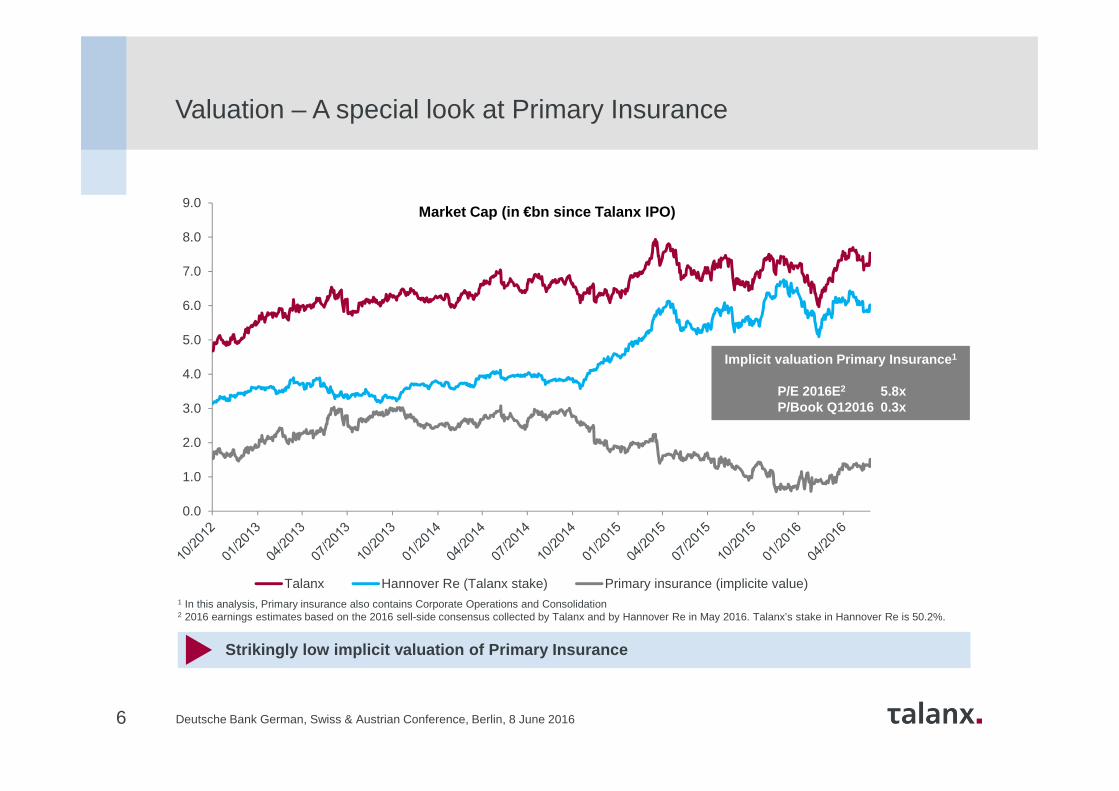
Valuation – A special look at Primary Insurance
Strikingly low implicit valuation of Primary Insura nce
1 In this analysis, Primary insurance also contains Corporate Operations and Consolidation2 2016 earnings estimates based on the 2016 sell-side consensus collected by Talanx and by Hannover Re in May 2016. Talanx’s stake in Hannover Re is 50.2%.
6
Implicit valuation Primary Insurance 1
P/E 2016E2 5.8xP/Book Q12016 0.3x
0.0
1.0
2.0
3.0
4.0
5.0
6.0
7.0
8.0
9.0
Talanx Hannover Re (Talanx stake) Primary insurance (implicite value)
Market Cap (in €bn since Talanx IPO)

Deutsche Bank German, Swiss & Austrian Conference, Berlin, 8 June 20167
Valuation – Earnings contribution from Primary Insurance
Robust and recently improved underlying results fro m Primary Insurance
2012 2013 2014 2015
197
� Underlying profit contribution of Primary Insurance robust and recently improved
� „Balanced Book“ initiative focussing on underwriting results in Property, Marine andFleet in Industrial Lines
� KuRS programme in Retail Germany adressesprofitability
� Full goodwill impairment in German Life
CommentsNet income Primary Insurance 1
1 Incl. Corporate Operations and Consolidation; adjusted for balance-sheet related charges in Retail Germany (in particular, the €155m full goodwill impairment in FY2015 and further impairments of intangible assets in 2014) and for gains from the sale of Swiss Life shares
171185
282
in €m

Deutsche Bank German, Swiss & Austrian Conference, Berlin, 8 June 20168
Valuation – Could it really be explained by a holding discount?
Rigorous focus on value creation in the Group
� Disciplined ressource-management: Generally no cash transfer into ailing Primary Insurance units
� Restrictive use of profit (and loss) sharingagreements in German Life
� Definition of standalone business-specific RoEtargets by division that also drive remuneration
� Disposal of non-core activities (e.g. Bulgaria, Luxemburg, Ukraine, Liechtenstein, non-core German assets)
� Diversification benefits reflected in our internal model
Measures to secure and to boost value in the Group
Indicative sum-of-the-partsvaluation
Talanx share price
€30.01
1 Applying an average sector P/E of 10 on an assumed Primary Insurance net profit of €271m, according to 2016 earnings estimates based on the sell-side consensusby Talanx and by Hannover Re (April 2016). Talanx’ stake in Hannover Re is 50.2%
2 Xetra closing on 31 March 2016
Primary Insurance
€10.721
Hannover Re stake€24.532
-15% discount(or 21% on the Hannover Re stake)
2

Deutsche Bank German, Swiss & Austrian Conference, Berlin, 8 June 2016
Average daily liquidity in the Talanx share
In €m
� In 2015, the Talanx share had an average daily trading volume of slightly below €10m – of which roughly €6m per day via Xetra
� In 2015, Talanx‘s free-float market cap stood at an average ~0.8% of the overall MDAX market cap
� Its respective share of traded volumes was higher at ~1.0%
� Following the 2015 increase in free-float to 21.0% given the placement of Meiji Yasuda shares, Talanx‘s position in the MDAX is well-founded(in April 2016: #34 in market cap and #42 in turnover)Source: Deutsche Börse, Bloomberg, own calculations
9
Comments
2015 2016
0.0
2.0
4.0
6.0
8.0
10.0
12.0
14.0
16.0
18.0
Jan Feb Mar Apr May Jun Jul Aug Sep Oct Nov Dec Jan Feb Mar Apr
OTC (Bloomberg)
XETRA

Deutsche Bank German, Swiss & Austrian Conference, Berlin, 8 June 2016
Total Portfolio in GWP €1,370m
Share of premium under review 2015 €300m
Corresponding written capacity under review €117bn
Premium % Capacity %
thereof already finally negotiated €303.7m101.2% (of total)
€117.7bn100.6% (of total)
premium and capacity reduction due toreduced shares and cancelled accounts
€48.1m15.8% (of
negotiated)€25.5bn
21.7% (of negotiated)
premium increase because of improved premium quality on remaining premium
€22.7m 8.9% (of
remaining)---
effect of additional reinsurance measures €8.4m €8.5bn
results €269.9m €83.7bn
Premium to exposure for finally negotiated portfolio
Relative improvement of portfolio quality i.r.o. finally negotiated premium to premium under review as end of December 2015
25.0%
Key achievements 2015Industrial Lines: „Balanced Book” – Status update
Property portfolio under review
-
+
-
Comments
Significant improvement of portfolio quality
� „Balanced Book“ targets for a more symmetrically structured and adequately priced portfolio
� A €300m premium portfolio in Property has been identified and renegotiated successfully
� The premium to risk ratio improved by 17%, or even 25% when including positive effects of additional reinsurance measures
� Similar initiatives in Fleet and in Marine
=
10

Deutsche Bank German, Swiss & Austrian Conference, Berlin, 8 June 2016
Portfolio improvement
11
Industrial Lines – Profitabilisation measures in Germany
Portfolios under review (GWP)
Results from negotiations (gross)
Pro
pert
y1
Mot
or3
Mar
ine
1
300
121
72
Negotiated €303.7m
Effects on premium - 8.4%
Capacity - 21.7%
Negotiated €121m
Effects on premium -10.1%
Effect on losses4 ~ -14%
Negotiated €71.8m
Effects on premium -5.3%
Capacity -26.9%
Premium to capacity ratio+25%1,2
Premium to capacity ratio+30%1
Expected improvement in loss ratio by FY2016≥ 3%pts5
1 In respect of portfolio under review 2 Including effect of additional specific reinsurance measures3 German business only 4 Expected, in terms of loss volume5 Assuming constant claims statistic; FY2015 loss ratio: 84.4% (gross)
€1370m
€362m
€325m
Premium negotiated

Deutsche Bank German, Swiss & Austrian Conference, Berlin, 8 June 2016
Key achievements 2015Retail Germany: Laying the foundation stone for “KuRS”
12
� Stabilisation of operations via complete reduction of backlogs (from 800 thousand items to zero)
� Further improvement of portolio quality, e.g. reduction of claims ratio
� Going live and optimisation of hdi.de application workflow for car insurance on 30 October 2015
� Initial approaches in relation to process optimisation and increasing proportion of automatic processing implemented
Life
Non-Life
Overall
� New capital efficient product portfolio developed and successfully launched with time to market less than a year (“Modern classic ”)
� Strong growth in profitable biometric and credit life insurance business
� Implementation of real time electronic risk assessment for HDI disability insurance
� Successful implementation of digital corporate pension portal solution (“HDI bAVnet ”), awarded with the price “digital lighthouse insurance in 2015” by German newspaper Süddeutsche Zeitung
� Further reduction of balance-sheet risks due to write-down of full goodwill (€155m) in 2015
� Decline in average life guarantee rate from 2.8 to 2.6% - average running yield 0.8%pt higher(2014: 0.7%pt)
� Investment and efficiency program “KuRS” launched in FY2 015 to sustainably optimize Retail Germany and its competitive position and the aim of closing the expense gap of ~€240m in Retail Germany largely until 2020. Positive yearly impact on Group net income from 2017 onwards expected
� In 2015, the Retail Germany management board was realigned with a strong and experienced leadership team to ensure clear responsibility for lines of business

Deutsche Bank German, Swiss & Austrian Conference, Berlin, 8 June 2016
TurkeyMexico
PolandBrazil
13
Key achievements 2015Retail International: Overview Core Markets
All core markets in Retail International with prof itable growth
GWP growth (local currency)
Combined ratio
EBIT (€)
GWP growth (local currency)
Combined ratio
EBIT (€)
GWP growth (local currency)
Combined ratio
EBIT (€)
GWP growth (local currency)
Combined ratio
EBIT (€)
GWP growth (local currency)
Combined ratio
EBIT (€)
GWP growth (local currency)
Combined ratio
EBIT (€)
GWP growth (local currency)
o/w Life
o/w Non-Life
Combined ratio1
EBIT (€)
o/w Life
o/w Non-Life
GWP growth (local currency)
o/w Life
o/w Non-Life
Combined ratio1
EBIT (€)
o/w Life
o/w Non-Life
+0.5%pts
+9.7%+0.3%pts
-1.3%
+0.8%pts
-19.5%
-0.7%pts
+96.8%
+18.5%-5.5%
1 Combined ratio for Warta only
+1.4%
96.4%
112.9m
23.6m
89.4m
+4.3%
-0.2%
+16.1%
99.3%
46.4m
+38.0%
93.2%
8.3m
+15.0%
102.5%
4.8m

Deutsche Bank German, Swiss & Austrian Conference, Berlin, 8 June 2016
30.1
30.4
31.8
31.8
43.6
50.3
50.4
74.2
91.9
118.5
Aviva
CréditAgricole
CNP
Talanx
Zurich
Prudential
Munich Re
Generali
AXA
Allianz
4.0
4.5
5.7
6.3
7.6
9.8
15.0
31.8
50.4
118.5
W&W
Gothaer
Signal Iduna
HUK
Vk Bayern
Debeka
R+V
Talanx
Munich Re
Allianz
Top 10 European insurersTop 10 German insurers
Third-largest German insurance group with leading p osition in Europe
Among the leading European insurance groups
14
German insurers by global GWP (2015, €bn)
1 Preliminary figures2 Figures of 20143 Gross Earned Premiums
1
2
1
2
2
2
European insurers by global GWP (2015, €bn)
1
1,3
1
1
1

Deutsche Bank German, Swiss & Austrian Conference, Berlin, 8 June 2016
GWP by regions 2015 (Primary Insurance)
Regional and segmental split of GWP and EBIT
GWP by regions 2015 (consolidated Group level)
Germany
Central and Eastern Europe including Turkey (CEE)Rest of Europe
North America
Latin America
RoW
GWP by segments 2015 1
Industrial Lines
Retail Germany
Retail International
Non-Life Reinsurance
Life/ Health Reinsurance
EBIT by segments 2015 1,2
Industrial Lines
Retail International
Non-Life Reinsurance
Life/ Health Reinsurance
Corporate Operations
Well diversified sources of premium and EBIT genera tion
28%
16%
16%
52%
15%1%
1 Adjusted for the 50.2% stake in Hannover Re2 Calculation excludes Retail Germany, which contributes an additional EBIT of €3m
due to goodwill impairment of €155m; Corporate Operations and Consolidation linehave a negative effect of €48m on Group EBIT
18%
19%
19%
16%
Germany
Central and Eastern Europe including Turkey (CEE)Rest of Europe
North America
Latin America
RoW
29%
8%
23%
17%
8%
15%
53%
14%
16%
4%
11% 2%
15

Deutsche Bank German, Swiss & Austrian Conference, Berlin, 8 June 2016
Industrial Lines
Retail Germany
Retail International
Reinsurance
� Market leader in Bancassurance� Market leader in employee affinity
business
� Core focus on corporate clients with relationships often for decades
� Blue-chip client base in Europe� Capability and capacity to lead
international programs
� ~35% of segment GWP generatedby Bancassurance
� Distribution focus on banks, brokers and independent agents
� Typically non-German business generated via brokers
Unique strategy with clear focus on B2B business models
Strategic focus on B2B and B2B2C Excellence in distribution channels 1
Brokers
Bancassurance
Automotive
Employee affinity
business
Retail Industrial/Reinsurance
Brazil
Superior service of corporate relationships lies at heart of our value proposition
B2B competence as a key differentiator
1 Samples of clients/partners
16

Deutsche Bank German, Swiss & Austrian Conference, Berlin, 8 June 2016
Key Pillars of our risk management
Asset risk is limited to less than 50% of our SCR (solvency capital require-ment)
Generating positive annual earnings with a probability of 90%
Sufficient capital to withstand at least an aggre-gated 3,000-year shock
1 2 3
17

Deutsche Bank German, Swiss & Austrian Conference, Berlin, 8 June 2016
Market risk 2
Non-life risk
Underwriting risk life
Operational risk � Total market risk stands at 45% of solvency capital requirements, which is comfortably below the 50% limit
� Self-set limit of 50% reflects the dedication to primarily focus on insurance risk
� Non-Life is the dominating insurance risk category, comprising premium and reserve risk, NatCat and counterparty default risk
� Equities ~1% of investments under own management
� GIIPS sovereign exposure 1.9% of total assets in FY2015 (FY 2014: 1.8%)
45%
35%
16%
4%
Talanx Group
Market risk sensitivity (limited to less than 50% o f solvency capital requirement) is deliberately low
1 Figures show approximate risk categorisation, in terms of solvency capital requirements,of the Talanx Group after minorities, after tax, post diversification effects as of 12/2014
2 Refers to the combined effects from market developments on assets and liabilities
CommentsRisk components of Talanx Group 1
1 Focus on insurance risk
18
Deutsche Bank German, Swiss & Austrian Conference, Berlin, 8 June 201619
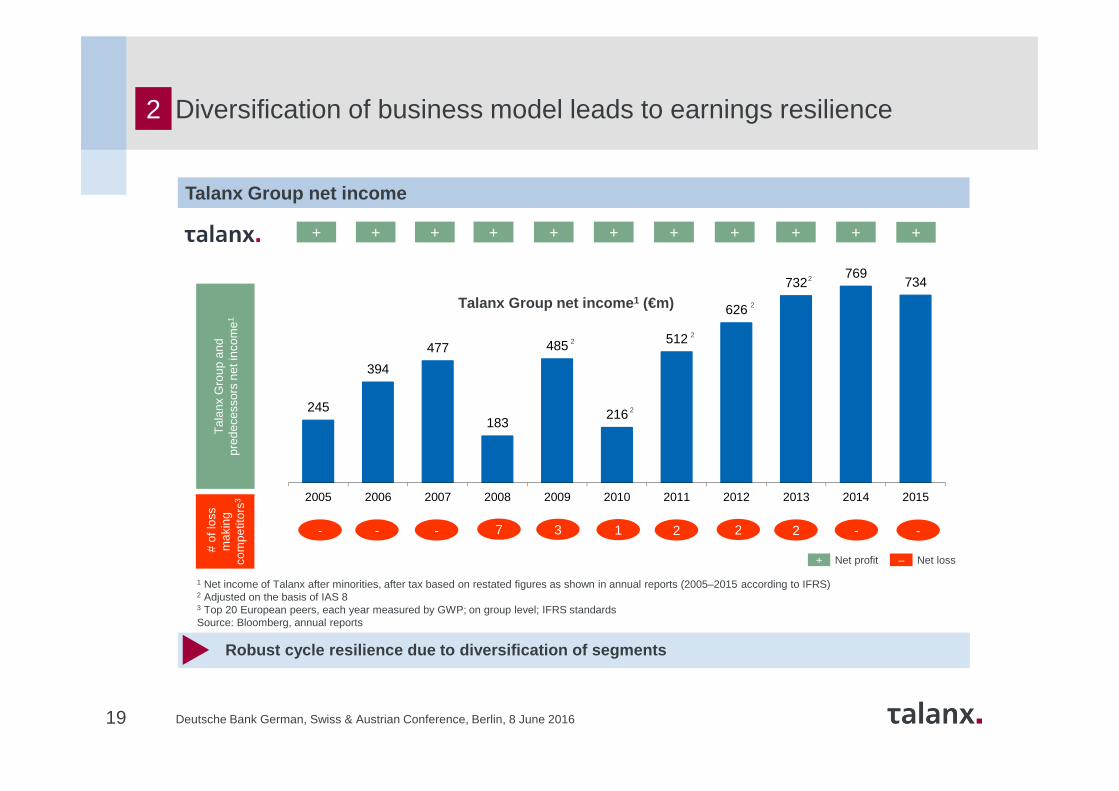
+ Net profit – Net loss
1 Net income of Talanx after minorities, after tax based on restated figures as shown in annual reports (2005–2015 according to IFRS)2 Adjusted on the basis of IAS 83 Top 20 European peers, each year measured by GWP; on group level; IFRS standardsSource: Bloomberg, annual reports
Tal
anx
Gro
up a
ndpr
edec
esso
rs n
et in
com
e1
# of
loss
mak
ing
com
petit
ors3
+ + + + + + + + + +
Talanx Group net income
Robust cycle resilience due to diversification of s egments
7 1 2- - - 3 2 2 -
245
394
477
183
485
216
512
626
732769
734
2005 2006 2007 2008 2009 2010 2011 2012 2013 2014 2015
-
+
2
2
2
2
2
Talanx Group net income 1 (€m)
Diversification of business model leads to earnings resilience 2

Deutsche Bank German, Swiss & Austrian Conference, Berlin, 8 June 201620
3TERM (Talanx Enterprise Risk Model) 2015 –Capitalisation perspectives
20
� Basic Own Funds (including hybrids and surplus funds as well as non-controlling interests)
� Risk calculated with the full internal model
� Eligible Own Funds, i.e Basic Own Funds (including hybrids and surplus funds as well as non-controlling interests) with haircut
� Operational risk modeled with standard formula, („partial internal model“)
� For the Solvency II perspective, the HDI V.a.G. as ultimate parent is the addressee of the regulatory framework
Policyholder &Debt investor
View(BOF CAR)
253%
(2014: 299%)
Limit ≥ 200 %
171%Solvency II
Ratio(2014: 182%)
Target corridor
150%-200%
Comfortable capital position from all angles
� with haircut� operational risk modeled
with standard formula� HDI solo-funds
Deutsche Bank German, Swiss & Austrian Conference, Berlin, 8 June 2016
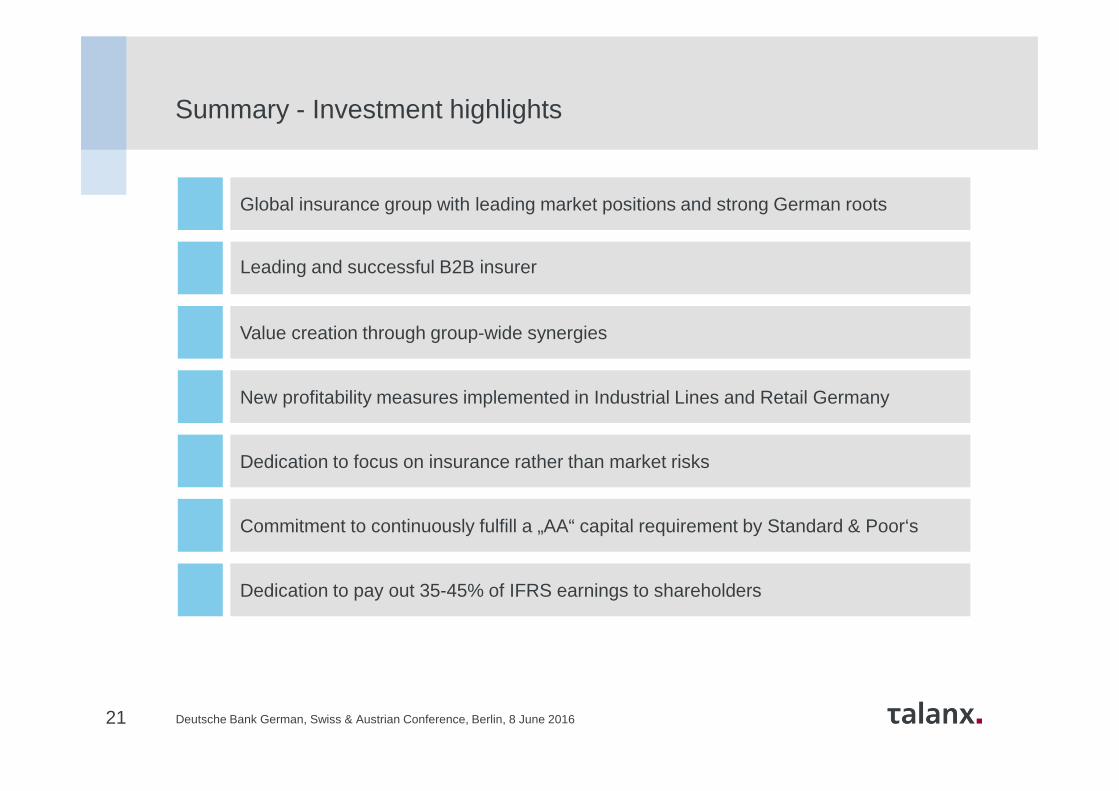
Summary - Investment highlights
Global insurance group with leading market positions and strong German roots
Dedication to focus on insurance rather than market risks
Value creation through group-wide synergies
New profitability measures implemented in Industrial Lines and Retail Germany
Leading and successful B2B insurer
Commitment to continuously fulfill a „AA“ capital requirement by Standard & Poor‘s
Dedication to pay out 35-45% of IFRS earnings to shareholders
21

Deutsche Bank German, Swiss & Austrian Conference, Berlin, 8 June 2016
- Q1 2016 -
22

Deutsche Bank German, Swiss & Austrian Conference, Berlin, 8 June 201623
Q1 2016 underpins recently increased bottom-line target for FY2016
I
Q1 2016 Group net income of €222m fully in line with FY2016 Group net incomeoutlook of ~€750m
Over the first three months, shareholders’ equity increased by ~€250m to €8,532m or €33.75 per share (31 Dec. 2015: €32.76). NAV up to €29.64 per share (FY 2015: €28.66)
In parallel to today’s reporting, risk management reports for FY2015 have been published. The Solvency II Ratio stands at a good 171 (FY 2014: 182) percent. Based on Basic Own Funds, Talanx’s capitalisation was 253 (299) percent
All Non-Life segments remained within their Q1 2016 large loss budgets. Combined ratio on Group level improved to 96.3% (Q1 2015: 96.5%)
Adjusting for last year’s “special effect” in Life/Health Reinsurance (~€19m after taxes and minorities), quarterly performance roughly in line with previous strong Q1

Deutsche Bank German, Swiss & Austrian Conference, Berlin, 8 June 201624
Summary of Q1 2016
Improvement in Group combined ratio – adjusting for base effects, Group net income is in line with strong Q1 2015
€m, IFRS Q1 2016 Q1 2015 ChangeGross written premium 8,995 9,440 (5%)Net premium earned 6,266 6,367 (2%)
Net underwriting result (422) (389) +9%
Net investment income 1,022 996 +3%Operating result (EBIT) 573 643 (11%)Net income after minorities 222 251 (11%)
Key ratios Q1 2016 Q1 2015 ChangeCombined ratio non-lifeinsurance and reinsurance
96.3% 96.5% (0.2%)pts
Return on investment 3.7% 3.6% 0.1%pts
Balance sheet Q1 2016 FY2015 ChangeInvestments underown management
101,913 100,777 +1%
Goodwill 1,039 1,037 +0%
Total assets 154,779 152,760 +1%
Technical provisions 108,686 106,831 +2%
Total shareholders' equity 13,826 13,431 +3%
Shareholders' equity 8,532 8,282 +3%
I
Comments
� GWP is down by 4.7% y/y, due to currency effects (curr.-adj.:-3.0%) and the premium decline in Retail Germany (Life) and Non-Life Reinsurance. Industrial Lines, Retail International and L/H Reinsurance with underlying growth
� Industrial Lines and Non-Life Reinsurance with improvedunderwriting result. Decline in net underwriting result ismainly due to higher RfB contribution in Retail Germany (“ZZR“), following higher realised investment gains
� Group combined ratio improved by 0.2%pts y/y to 96.3%. All segments remained within their large loss budgets for the quarter
� Increase in investment result is mainly due to a ~€107m higher extraordinary investment result, mainly financing the ZZR allocation. Ordinary investment result down by ~€60m mainly due to the negative base effect from the one-off payment in L/H Reinsurance in Q1 2015 (~€39m)
� Decline in net income can be fully explained by the one-off effect mentioned above and a negative impact from currency effects in the “other result”
� Shareholders‘ equity increased ytd to €8,532m, or €33.75 per share (FY2015: €32.76). 2015 Solvency II ratioslightly down by 6% to 171% (FY2014: 182%)
Q1 2016 results – Key financials

Deutsche Bank German, Swiss & Austrian Conference, Berlin, 8 June 2016
€m, net Primary insurance Reinsurance Talanx Group
Earthquake, Taiwan February 2016 3.3 15.6 18.9
Total Nat Cat 3.3 15.6 18.9
Fire/Property 63.8 39.9 103.7
Total other large losses 63.8 39.9 103.7
Total large losses 67.1 55.5 122.5
Impact on Combined Ratio (incurred) 4.4%pts 2.8%pts 3.5 %pts
Total large losses Q1 2015 93.5 62.0 155.5
Impact on Combined Ratio (incurred) Q1 2015 6.2%pts 3.3%pts 4.6%pts
25
I
� Group Q1 2016 large loss burden of€123m (Q1 2015: €156m) – below theGroup‘s Q1 2016 large loss budget of€264m
� Q1 2016 net burdenof €67m in Primary and €56m in Reinsurance –mainly due to man-made large losses; NatCat large loss of€19m from Taiwan earthquake
� Reinsurance wellbelow its Q1 2016 large loss budget of€189m; Primary also below its pro-ratalarge loss budget of€75m
Large losses1 in Q1 2016
1 Definition „large loss“: in excess of €10m gross in either Primary Insurance or Reinsurance
Note: Q1 2016 Primary Insurance large losses (net) are split as follows: Industrial Lines: €67m; Retail Germany: €0; Retail International: €0m, Group Functions: €0m; from FY2016 onwards, table includes large losses from Industrial Liability line, booked in the respective FY. The latter also explains the stated increase in the large loss budget forPrimary Insurance by €10m for FY2016.

Deutsche Bank German, Swiss & Austrian Conference, Berlin, 8 June 201626
Combined ratios
Development of net combined ratio 1 Combined ratio 1 by segment/selected carrier
I
Q1 2016 Q1 2015 FY2015
Industrial Lines 97.6% 98.9% 99.2%
Retail Germany 103.8% 100.5% 99.3%
Retail International 96.2% 94.6% 96.3%
HDI Seguros S.A., Brazil 101.6% 99.2% 99.3%
HDI Seguros S.A., Mexico 92.0% 90.4% 93.2%
TUiR Warta S.A., Poland 95.8% 94.7% 96.4%
TU Europa S.A., Poland 81.5% 83.2% 84.6%
HDI Sigorta A.Ş., Turkey 102.5% 102.7% 102.5%
HDI Assicurazioni S.p.A., Italy 96.4% 91.1% 95.4%
HDI Seguros S.A., Chile2 90.5% n/m n/m
Non-Life Reinsurance 94.7% 95.9% 94.5%Expense ratio Loss ratio
2015 2016
1 Incl. net interest income on funds withheld and contract deposits2 Incl. Magallanes Generales; merged with HDI Seguros S.A. on 1 April 2016
Apart from Retail Germany, combined ratios in all n on-life segments below the 100% level
26.0% 27.8% 26.8% 27.3% 28.0%
70.7% 68.6% 71.4% 66.0% 68.3%
96.5% 96.2% 98.0%93.3%
96.3%
Q1 Q2 Q3 Q4 Q1

Deutsche Bank German, Swiss & Austrian Conference, Berlin, 8 June 2016
18% 25% 22% 26% 20%
81% 73% 81% 71% 77%
99% 99% 103% 97% 98%
Q1 2015 Q2 2015 Q3 2015 Q4 2015 Q1 2016
€m, IFRS Q1 2016 Q1 2015 ∆
Gross written premium 1,921 1,889 +2%
Net premium earned 537 518 +4%
Net underwriting result 13 6 +141%
Net investment income 50 53 (6%)
Operating result (EBIT) 74 72 +3%
Group net income 48 47 +3%
Return on investment (annualised) 2.6% 2.8% (0.2%)pts
27
P&L for Industrial Lines Comments
II
� Q1 2016 GWP up 1.7% y/y, dampened by currency effects (curr.-adj.:+2.5%). Growth was mainly driven by international markets, including new business units, e.g. in Brazil. Some dampening effect from profitabilisationmeasures, namely “Balanced Book”
� Retention rate was up (Q1 2016: 55.5%; Q1 2015: 50.4%), mainly in Liability lines. Reinstatement premiums remained broadly unchanged (Q1 2016: ~€12m)
� Q1 2016 combined ratio improved mainly due to lower large losses and despite prudential reserving as well as a higher expense ratio from international growth
� Decline in net investment result mainly due tothe low interest rate environment; nosignificant extraordinary investment gains
� Net income slightly up on the back of theimproved underwriting result
Segments – Industrial Lines
Combined ratio 1
Expense ratio Loss ratio
FY2014: 103%
1Incl. net interest income on funds withheld and contract deposits
FY2015: 99%
Improvement in net underwriting result leads to higher EBI T and bottom-line contribution

Deutsche Bank German, Swiss & Austrian Conference, Berlin, 8 June 2016
33% 34% 35% 37% 36%
67% 67% 66% 57% 68%
100% 102% 101% 94% 104%
Q1 2015 Q2 2015 Q3 2015 Q4 2015 Q1 2016
28
II
CommentsP&L for Retail Germany
� Decline in Q1 2016 GWP in Life predominantly due to a base effect. Q1 2015 saw an overlap from strong FY2014 year-end business. Premium trend consistent with the targeted phase-out of classical and single-premium business
� Slight decline in Non-Life GWP particularly in Motor and Homeowner business
� In Q1 2016, costs for efficiency program “KuRS” sum up to €10m, impacting Q1 2016 EBIT by ~€8m. Negative impact of ~2.3%pts on combined ratio (0.5% pts on Q1 2016 loss ratio, 1.8%pts on cost ratio). Adjusting for impact from KuRS, Q1 2016 combined ratio was 101.5% (reported: 103.8%)
� Decline in EBIT largely explained by investments for KuRS program
� Increase in investment result due to higher extraordinary result, mainly to finance ZZR contribution, while ordinary investment broadly unchanged. Q1 2016 ZZR allocation – according to HGB – of €168m (Q1 2015: €109m). Total ZZR stock reached €1.73bn in Q1 2016, expected to rise to €2.2bn until year-end 2016
Segments – Retail Germany
Combined ratio 1
Expense ratio Loss ratio
1Incl. net interest income on funds withheld and contract deposits
€m, IFRS Q1 2016 Q1 2015 ∆
Gross written premium 1,904 2,135 (11%)
of which Life 1,155 1,373 (16%)
of which Non-Life 749 762 (2%)
Net premium earned 1,217 1,448 (16%)
Net underwriting result (478) (392) +22%
of which Life (465) (390) +19%
of which Non-Life (13) (2) +550%
Net investment income 535 445 +20%
Operating result (EBIT) 47 57 (18%)
Group net income 29 35 (17%)
Return on investment (annualised) 4.5% 3.8% +0.7%pts
FY2015: 99%
KuRS investments largely explain EBIT decline

Deutsche Bank German, Swiss & Austrian Conference, Berlin, 8 June 2016
31% 31% 31% 33% 31%
63% 65% 68% 64% 65%
95% 96% 98% 96% 96%
Q1 2015 Q2 2015 Q3 2015 Q4 2015 Q1 2016
29
II
P&L for Retail International Comments
Segments – Retail International
Combined ratio 1
Expense ratio Loss ratio
1Incl. net interest income on funds withheld and contract deposits
€m, IFRS Q1 2016 Q1 2015 Change
Gross written premium 1,148 1,206 (5%)
of which Life 390 384 +1%
of which Non-Life 759 822 (8%)
Net premium earned 986 960 +3%
Net underwriting result 8 8 +6%
of which Life (16) (26) (37%)
of which Non-Life 25 34 (27%)
Net investment income 80 79 +1%
Operating result (EBIT) 61 56 +9%
Group net income 36 33 +9%
Return on investment (annualised) 4.0% 4.0% (0.0%)pts
FY2015: 96%
2 Consolidated from 13 Feb 2015; “as-if” numbers for HDI SegurosS.A after merger (1 April 2016) with Magallanes Generales; total Chile Group: €78m GWP; €5.3m EBIT
� Q1 2016 GWP down by 4.8% y/y due to currency effects predominantly from Brazil and Poland (currency-adj.: +3.5%), mainly impacting the Non-Life business
� On a currency-adjusted level, GWP in Non-Life grew by 3.5% y/y, backed by double-digit local growth rates in Mexico, Chile and Turkey – and a high single-digit local growth rate in Brazil
� Combined ratio up to 96.2% (Q1 2015: 94.6%), mainly as currency depreciation (i.e. in Brazil) led to increased costs for spare parts in Motor, resulting in a higher loss ratio. Cost ratio slightly down to 31.2% (Q1 2015: 31.4%)
� Despite the impact from currency depreciation and a ~€4m asset tax charge in Poland, Q1 2016 EBIT grew by 9.3% to €61m (Q1 2015: €56m)
� Turkey continued its positive trend, contributing €1.4m to segment EBIT (Q1 2015: €0.9m). Strong contribution from Chile2: €69m GWP; €4.6m EBIT
EBIT improvement despite significant currency headw ind and impact from asset tax in Poland
Deutsche Bank German, Swiss & Austrian Conference, Berlin, 8 June 2016
25% 26% 25% 25% 28%
71% 69% 71% 67% 67%
96% 95% 96% 91% 95%
Q1 2015 Q2 2015 Q3 2015 Q4 2015 Q1 2016
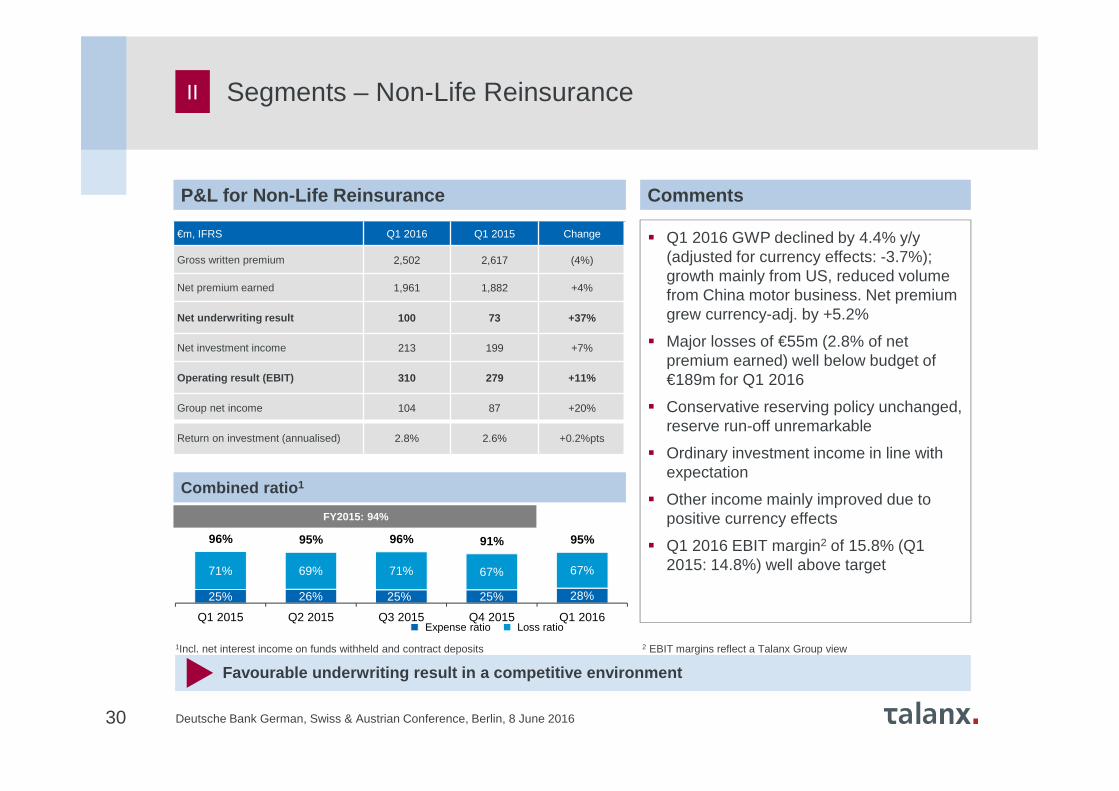
Combined ratio 1
€m, IFRS Q1 2016 Q1 2015 Change
Gross written premium 2,502 2,617 (4%)
Net premium earned 1,961 1,882 +4%
Net underwriting result 100 73 +37%
Net investment income 213 199 +7%
Operating result (EBIT) 310 279 +11%
Group net income 104 87 +20%
Return on investment (annualised) 2.8% 2.6% +0.2%pts
30
Segments – Non-Life ReinsuranceII
P&L for Non-Life Reinsurance Comments
� Q1 2016 GWP declined by 4.4% y/y (adjusted for currency effects: -3.7%); growth mainly from US, reduced volume from China motor business. Net premium grew currency-adj. by +5.2%
� Major losses of €55m (2.8% of net premium earned) well below budget of €189m for Q1 2016
� Conservative reserving policy unchanged, reserve run-off unremarkable
� Ordinary investment income in line with expectation
� Other income mainly improved due to positive currency effects
� Q1 2016 EBIT margin2 of 15.8% (Q1 2015: 14.8%) well above target
1Incl. net interest income on funds withheld and contract deposits 2 EBIT margins reflect a Talanx Group view
Expense ratio Loss ratio
FY2015: 94%
Favourable underwriting result in a competitive env ironment

Deutsche Bank German, Swiss & Austrian Conference, Berlin, 8 June 2016
176
18 44
172
103
Q1 2015 Q2 2015 Q3 2015 Q4 2015 Q1 2016
€m, IFRS Q1 2016 Q1 2015 Change
Gross written premium 1,761 1,783 (1%)
Net premium earned 1,581 1,550 +2%
Net underwriting result (68) (85) n/m
Net investment income 157 219 (28%)
Operating result (EBIT) 103 176 (41%)
Group net income 38 66 (42%)
Return on investment 3.6% 6.4% (2.8%)pts
31
Segments – Life/Health ReinsuranceII
P&L for Life/Health Reinsurance Comments
� Q1 2016 GWP slightly down up by 1.2%; adjusted for currency effects: +0.3%, mainly from UK Longevity BATs, reduced volume from Australia
� Net premium earned grew by 3.6% on currency-adjusted basis
� Favourable underwriting result reflects underlying profitability
� Ordinary investment income in line with expectation (Q1 2015 affected by positive one-off of €39m)
� Decreased “other income and expenses” due to significantly reduced positive currency effects
� Q1 2016 EBIT margin1 of 6.5% (Q1 2015: 11.3%) for the segment, meeting EBIT targets for all business divisions
EBIT (€m)
1 EBIT margin reflects a Talanx Group view
FY2015: 411
EBIT decreased due to positive one-off and currency gains in Q1 2015

Deutsche Bank German, Swiss & Austrian Conference, Berlin, 8 June 2016
€m, IFRS Q1 2016 Q1 2015 Change
Ordinary investment income 783 843 (7%)
thereof current investment income from interest 690 729 (5%)
thereof profit/loss from shares in associated companies
2 4 (66%)
Realised net gains/losses on investments 221 176 +25%
Write-ups/write-downs on investments (40) (75) (47%)
Unrealised net gains/losses on investments 31 5 +549%
Investment expenses (55) (50) +11%
Income from investments under own management 941 899 +5%
Income from investment contracts 2 2 +9%
Interest income on funds withheld and contract deposits 79 95 (16%)
Total 1,022 996 +3%
32
III
Net investment income Talanx Group Comments
� Ordinary investment income down due to the decline in interest income and the negative base effect from the one-off payment following a withdrawel from a US-transaction (~€39m) in Life/Health Reinsurance in Q1 2015
� Realised investment net gains of €221m in Q1 2016 include higher realised gains in Retail Germany to finance ZZR (allocation according to German GAAP in Q1 2016: €168m vs. Q1 2015: €109m) and clean-up of private equity portfolio in Reinsurance
� Lower writedowns on investments in Q1 2016 y/y mainly due to a base effect from Q1 2015, which had been impacted by a 50% impairment of the bond position in Heta Asset Resolution (mid double-digit €m amount)
� ROI of 3.7% (Q1 2015: 3.6%) – well above the FY2016 outlook of “at least 3.0%“
� ModCo derivatives: €-1m (Q1 2015: €0m); no impact from inflation swaps as these have been terminated in FY2015 (Q1 2015: €-15m)
Net investment income
Net investment income increased - Q1 2016 ROI reach ed 3.7%

Deutsche Bank German, Swiss & Austrian Conference, Berlin, 8 June 2016
8.7 8.0 8.1 8.3 8.5
5.44.9 5.0 5.1 5.3
2.7
1.9 1.9 1.9 1.9
16.8
14.9 15.0 15.4 15.8
31 Mar 15 30 June 15 30 Sep 15 31 Dec 15 31 Mar 16
33
Capital breakdown (€bn)
� Compared to the end of FY2015, shareholders’ equity increased by ~€250m to €8,532 million at the end of Q1 2016, predominantly driven by the net income; limited net effect from lower interest rates and currencies
� Book value per share stood at €33.75 compared to €34.60 in Q1 2015 and €32.76 in FY 2015, while NAV (excl. goodwill) per share was €29.64 (Q1 2015: €29.69, FY2015: €28.66)
� Neither book value per share nor NAV contain off-balance sheet reserves. These amounted to €449m (see next page) or €1.78 per share (shareholder share only). This added up to an adjusted book value of €35.53 per share and an NAV (excluding goodwill) of €31.42
� In June 2015, three hybrid bonds in the Group were paid back earlier, bringing subordinatedliabilities down compared to Q1 2015
III
Shareholders‘ equity Minorities Subordinated liabilities
Equity and capitalisation – Our equity base
Comments
Shareholders’ equity up by ~€250m compared to end o f December 2015

Deutsche Bank German, Swiss & Austrian Conference, Berlin, 8 June 201634
∆ market value vs. book value
III
Unrealised gains and losses (off and on balance she et) as of 31 March 2016 (€m)
Equity and capitalisation – Unrealised gains
31 Dec 15 4,894 21966 90 (294) 4,887 3,150 519 3,669 8,557(89)
5,878
66 227 98 (317)(107)
5,844
4,632
436
5,068
10,912
Loans andreceivables
Held tomaturity
Investmentproperty
Real estateown use
Subordinatedloans
Notespayable and
loans
Off balancesheet
reserves
Available forsale
Other assets On balancesheet
reserves
Totalunrealised
gains (losses)
Off-balance sheet reserves of ~€5.8bn – about €449m (€1.78 per share) attributable to shareholders (net of policyholders, taxes & minorit ies)

Deutsche Bank German, Swiss & Austrian Conference, Berlin, 8 June 2016
8,282
222
27 1
8,532
35
III Equity and capitalisation – Contribution to change in equity
Comments
� At the end of March 2016, shareholders‘ equity stood at €8,532m or €33.75 per share
� This was above the level at theend of FY2015 (€8,282m or €32.76 per share) predominantly driven by the Q1 2016 Group net income, while the impact from OCI movement was very limited
Net incomeafter
minorities
Other comprehensive
income
31 Mar 2016
Shareholders’ equity up to €8,532m or €33.75 per sh are
In €m
31 Dec 2015 Other
Deutsche Bank German, Swiss & Austrian Conference, Berlin, 8 June 2016
Risk Management Reports 2015 - Essentials IV
36
Increase in MCEV to €3.5bn, with the MCEV roughly e qually split between Primary Insurance and Reinsurance. 2013 improvement in Primary Insurance largely driven by capital market development (incl. duration management) , in Reinsu rance positive new business contribution
Significant reduction in duration gap in Life and t he more favourable yield and spread environment trigger the material decline in yield s ensitivity of the MCEV
First-time presentation of separate MCEV values for the cumulated German and foreign entities of Primary Insurance
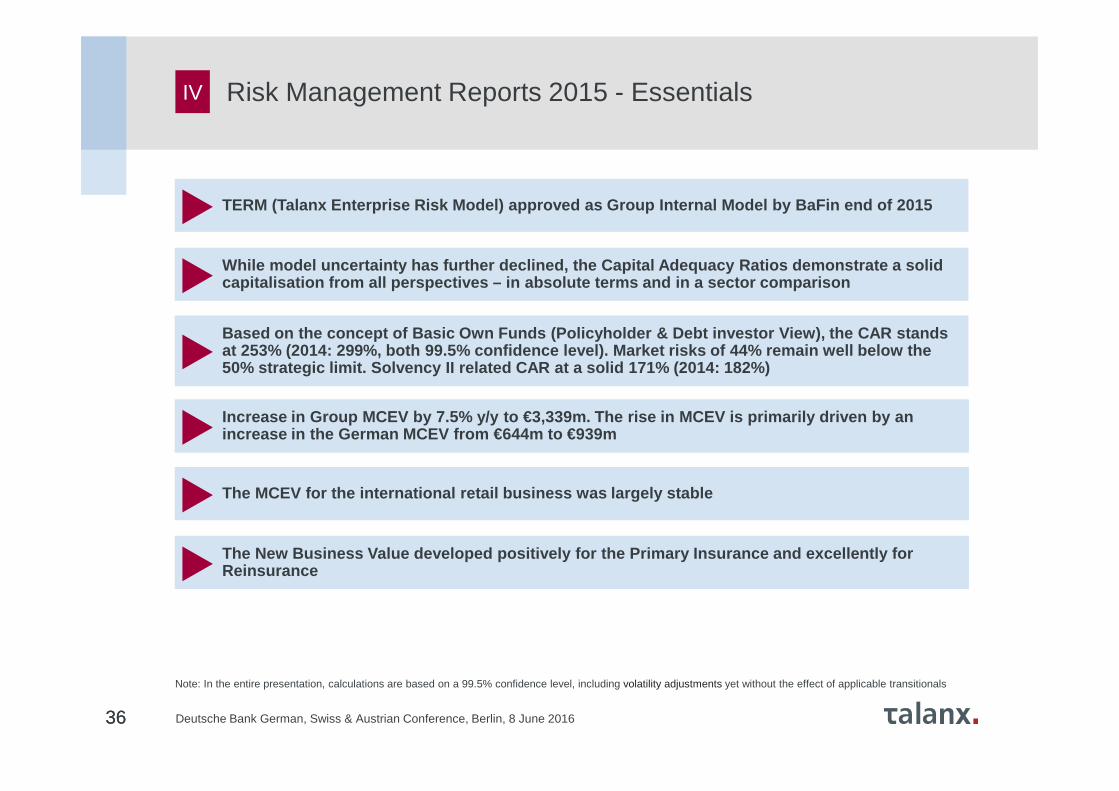
TERM (Talanx Enterprise Risk Model) approved as Grou p Internal Model by BaFin end of 2015
While model uncertainty has further declined, the C apital Adequacy Ratios demonstrate a solid capitalisation from all perspectives – in absolute t erms and in a sector comparison
Based on the concept of Basic Own Funds (Policyhold er & Debt investor View), the CAR stands at 253% (2014: 299%, both 99.5% confidence level). Market risks of 44% remain well below the 50% strategic limit. Solvency II related CAR at a s olid 171% (2014: 182%)
Increase in Group MCEV by 7.5% y/y to €3,339m. The rise in MCEV is primarily driven by an increase in the German MCEV from €644m to €939m
The New Business Value developed positively for the Primary Insurance and excellently for Reinsurance
The MCEV for the international retail business was largely stable
36
Note: In the entire presentation, calculations are based on a 99.5% confidence level, including volatility adjustments yet without the effect of applicable transitionals

Deutsche Bank German, Swiss & Austrian Conference, Berlin, 8 June 2016
TERM 2015 – Capitalisation perspectives
37
IV
� Basic Own Funds (including hybrids and surplus funds as well as non-controlling interests)
� Risk calculated with the full internal model
� Eligible Own Funds, i.e Basic Own Funds (including hybrids and surplus funds as well as non-controlling interests) with haircut
� Operational risk modeled with standard formula, („partial internal model“)
� For the Solvency II perspective, the HDI V.a.G. as ultimate parent is the addressee of the regulatory framework
Policyholder &Debt investor
View(BOF CAR)
253%
(2014: 299%)
Limit ≥ 200 %
171%Solvency II
Ratio(2014: 182%)
Target corridor
150%-200%
Comfortable capital position from all angles
� with haircut� operational risk modeled
with standard formula� HDI solo-funds
Deutsche Bank German, Swiss & Austrian Conference, Berlin, 8 June 2016
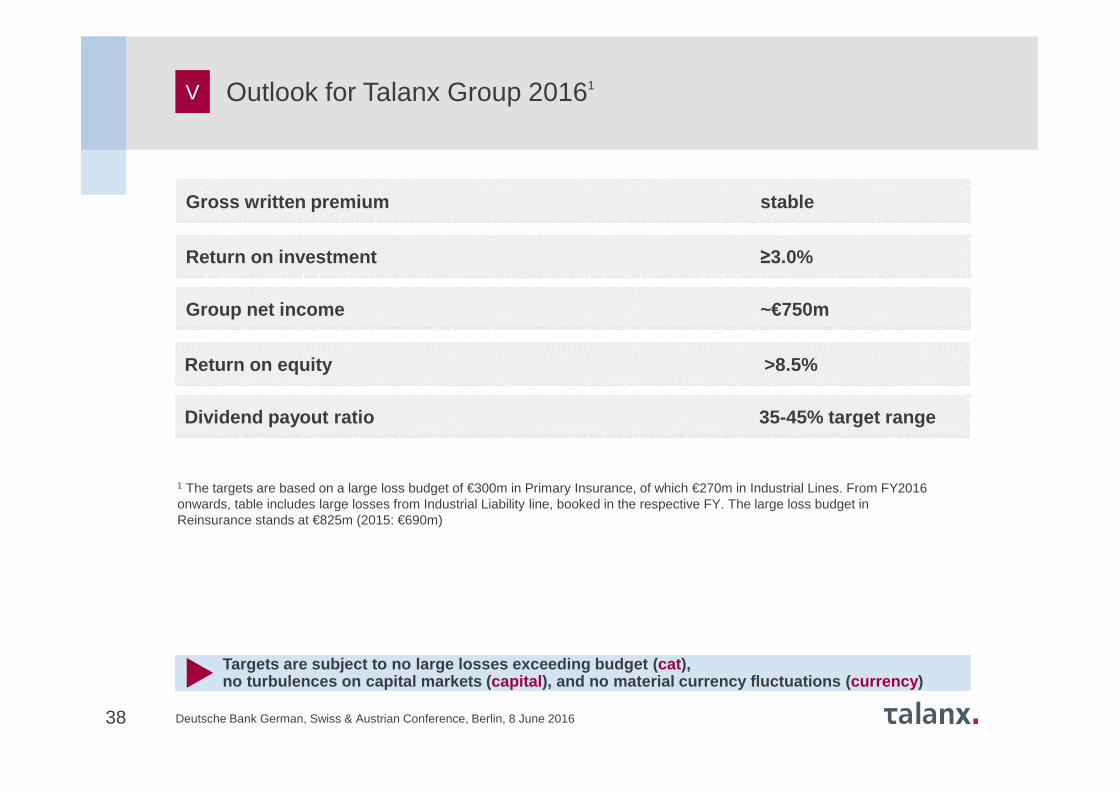
Gross written premium stable
Return on investment ≥3.0%
1 The targets are based on a large loss budget of €300m in Primary Insurance, of which €270m in Industrial Lines. From FY2016 onwards, table includes large losses from Industrial Liability line, booked in the respective FY. The large loss budget in Reinsurance stands at €825m (2015: €690m)
38
Group net income ~€750m
V Outlook for Talanx Group 20161
Targets are subject to no large losses exceeding bu dget ( cat ), no turbulences on capital markets ( capital ), and no material currency fluctuations ( currency )
Return on equity >8.5%
Dividend payout ratio 35-45% target range

Deutsche Bank German, Swiss & Austrian Conference, Berlin, 8 June 2016
Mid-term Target Matrix
1 Organic growth only; currency-neutral2 Risk-free rate is defined as the 5-year rolling average of the 10-year German
government bond yield3 Talanx definition: incl. net interest income on funds withheld and contract deposits
4 EBIT/net premium earned, 5 Reflects Hannover Re target of at least €180m6 Average throughout the cycle; currency-neutral, 7 Targets reflect Hannover Re‘stargets for 2015-2017 strategy cycleNote: growth targets are based on 2014 results. Growth rates, combined ratios andEBIT margins are average annual targets
Group
Primary Insurance
Non-Life Reinsurance 7
Life & Health Reinsurance 7
Segments
Gross premium growth1
Return on equity
Group net income growth
Dividend payout ratio
Return on investment
3 - 5%
≥ 750 bps above risk free2
mid single-digit percentage growth rate
35 - 45%
≥ risk free + (150 to 200) bps2
Key figures Strategic targets (2015 - 2019)
Gross premium growth1
Retention rate
Gross premium growth
Gross premium growth1
Combined ratio3
EBIT margin4
Gross premium growth6
Combined ratio3
EBIT margin4
3 - 5%
60 - 65%
≥ 0%
≥ 10%
~ 96%
~ 6%
3 - 5%
≤ 96%
≥ 10%
Gross premium growth1
Average value of New Business (VNB) after minorities5
EBIT margin4 financing and longevity business
EBIT margin4 mortality and health business
5 - 7%
> € 90m
≥ 2%
≥ 6%
Industrial Lines
Retail Germany
Retail International
39
A

Deutsche Bank German, Swiss & Austrian Conference, Berlin, 8 June 201640
€m, IFRS Q1 2016 Q1 2015 Change
P&L
Gross written premium 1,921 1,889 +2%
Net premium earned 537 518 +4%
Net underwriting result 13 6 +141%
Net investment income 50 53 (6%)
Operating result (EBIT) 74 72 +3%
Net income after minorities 48 47 +3%
Key ratios
Combined ratio non-life insurance and reinsurance
97.6% 98.9% (1.3%)pts
Return on investment 2.6% 2.8% (0.2%)pts
Industrial Lines
Q1 2016 Q1 2015 Change
1,904 2,135 (11%)
1,217 1,448 (16%)
(478) (392) n/m
535 445 +20%
47 57 (18%)
29 35 (18%)
103.8% 100.5% 3.3%pts
4.5% 3.8% 0.7%pts
Q1 2016 Q1 2015 Change
1,148 1,206 (5%)
986 960 +3%
8 8 +6%
80 79 +1%
61 56 +9%
36 33 +9%
96.2% 94.6% 1.6%pts
4.0% 4.0% 0.0%pts
Retail Germany Retail International
Q1 2016 Additional Information - SegmentsA

Deutsche Bank German, Swiss & Austrian Conference, Berlin, 8 June 201641
€m, IFRS Q1 2016 Q1 2015 Change
P&L
Gross written premium 2,502 2,617 (4%)
Net premium earned 1,961 1,882 +4%
Net underwriting result 100 73 +37%
Net investment income 213 199 +7%
Operating result (EBIT) 310 279 +11%
Net income after minorities 104 87 +19%
Key ratios
Combined ratio non-life insurance and reinsurance
94.7% 95.9% (1.2%)pts
Return on investment 2.8% 2.6% 0.2%pts
Q1 2016 Q1 2015 Change
1,761 1,783 (1%)
1,581 1,550 +2%
(68) (85) n/m
157 219 (28%)
103 176 (42%)
38 66 (42%)
--- --- ---
3.6% 6.4% (2.8%)pts
Q1 2016 Q1 2015 Change
8,995 9,440 (5%)
6,266 6,367 (2%)
(422) (389) n/m
1,022 996 +3%
573 643 (11%)
222 251 (11%)
96.3% 96.5% (0.2%)pts
3.7% 3.6% 0.1%pts
Non-Life Reinsurance Life and Health Reinsurance
Group
Q1 2016 Additional Information - Segments (continued)A

Deutsche Bank German, Swiss & Austrian Conference, Berlin, 8 June 201642
Retail Germany Retail International
GWP, €m, IFRS Q1 2016 Q1 2015 Change
Non-life Insurance 749 762 (2%)
HDI Versicherung AG 712 727 (2%)
Life Insurance 1,155 1,373 (16%)
HDI Lebensversicherung AG 473 515 (8%)
neue leben Lebensversicherung AG1 206 365 (44%)
TARGO Lebensversicherung AG 248 254 (2%)
PB Lebensversicherung AG 188 199 (6%)
Total 1,904 2,135 (11%)
GWP, €m, IFRS Q1 2016 Q1 2015 Change
Non-life Insurance 759 822 (8%)
HDI Seguros S.A., Brazil 172 210 (18%)
TUiR Warta S.A.2, Poland 220 233 (6%)
TU Europa S.A.3, Poland 28 59 (53%)
HDI Assicurazioni S. p. A., Italy (P&C) 84 85 (1%)
HDI Seguros S.A. De C.V., Mexico 57 57 (1%)
HDI Sigorta A.Ş., Turkey 69 71 (2%)
HDI Seguros S.A., Chile4 69 n/m (n/m)
Life Insurance 390 384 +1%
TU Warta Zycie S.A., Poland2 40 92 (57%)
TU Europa Zycie, Poland3 32 26 +25%
Open Life3 0 10 (96%)
HDI Assicurazioni S. p. A., Italy (Life) 222 155 +43%
Total 1,148 1,206 (5%)
Q1 2016 Additional Information – GWP of main risk carriersA
1 Talanx ownership 67.5%2 Talanx ownership of 75.74% 3 Talanx ownership 50% + 1 share 4 incl. Magallanes Generales; merged with HDI Seguros S.A. from 1 April 2016

Deutsche Bank German, Swiss & Austrian Conference, Berlin, 8 June 2016
40%
33%
26%1%
Other
Covered bonds
Corporate bonds
Government bonds
39%
22%
17%
22%
32%
68%
Euro
Non-Euro
Total: €101.9bn
90%
2%8%
Other
Equities
Fixed incomesecurities
43
Fixed-income-portfolio split Comments
� Investments under own management rather stable y/y at €101.9bn (Q1 2015:102.2bn)
� Investment portfolio remains dominated by fixed-income securities: ~90% portfolio share in Q1 2016 (Q1 2015: 91%)
� Nearly 80% of fixed-income portfolio invested in “A” or higher-rated bonds – broadly stable over recent quarters(Q1 2015: 80%)
� 20% of “investments under own management” held in USD, 32% overall in non-euro currencies (Q1 2015: 29%)
Investment portfolio as of 31 Mar 2016
Q1 Additional Information – Breakdown of investment portfolioA
Breakdown by rating
Breakdown by type
Total: €91.7bn
Asset allocation
Currency split
BBB and below
A
AA
AAA
Investment strategy unchanged – portfolio dominated by strongly rated fixed-income securities

Deutsche Bank German, Swiss & Austrian Conference, Berlin, 8 June 2016
Country Rating SovereignSemi-
SovereignFinancial Corporate Covered Other Total
Italy BBB 1,425 - 658 619 366 - 3,067
Spain BBB+ 802 507 279 417 315 - 2,321
Brazil BB 186 2 95 340 - 11 633
Mexico BBB+ 106 1 21 309 - - 437
Hungary BB+ 321 - 8 8 10 - 348
Russia BB+ 83 - 112 144 - - 339
South Africa BBB- 154 10 22 41 - 7 233
Portugal BB+ 35 - 3 39 17 - 93
Turkey BBB- 31 - 37 9 - - 76
Greece CCC 0 0 0 0 0 0 0
Other BBB+ 27 - 33 65 - - 125
Other BBB 87 57 46 37 - - 227
Other <BBB 82 19 57 105 - 292 555
Total 3,338 597 1,371 2,131 708 310 8,455
In % of total assets under own management 3,3% 0.6% 1.3% 2.1% 0.7% 0.3% 8.3%
In % of total Group assets 2.2% 0.4% 0.9% 1.4% 0.5% 0.2% 5.5%
44
1 investment under own management
Q1 2016 Additional Information – Details on selected fixed income country exposure
A
Investments into issuers from countries with a rati ng below A- 1 (in €m)

Deutsche Bank German, Swiss & Austrian Conference, Berlin, 8 June 2016
- Risk Management Reports 2015 -
45

Deutsche Bank German, Swiss & Austrian Conference, Berlin, 8 June 2016
Strong capitalisation despite dampening effects fro m markets and pre-approval model changes
TERM 2015 - Result History (Policyholder & Debt investorView, based on Basic Own Funds)
Comments
� Basic Own Funds (including hybrids andsurplus funds as well as non-controlling interests)
� The respective CAR (99.5% confidence level) stands at a comfortable 253%
� The decline from last year’s level of 299% reflects both the effects of the market environment as well as the effects of model changes. The latter solely refer to the Primary Life business
� This concept is used for risk budgeting andsteering at Talanx as it best reflects theeconomic capital position of the Group
Basic Own Funds (€bn) 1
Solvency Capital Required (€bn) 1
Capital Adequacy Ratio (CAR) 1
46
1 Including non-controlling interests2 Re-calculation of 2014 results with pre-approval model changes
A
46
17.1 16.9 18.0
2014 2014 MC 20152
5.7 6.17.1
2014 2014 MC 20152
299% 275% 253%
2014 2014 MC 20152

Deutsche Bank German, Swiss & Austrian Conference, Berlin, 8 June 2016
Comfortable regulatory capitalisation despite the e ffects from markets and from pre-approval model changes
TERM 2015 - Result History (Solvency II View)
Comments
� Eligible Own Funds, i.e. Basic Own Funds (including hybrids and surplus funds as well asminority interests) with haircut on Talanx‘sminority holdings
� Compared to the Policyholder & Debt investorView (BOF CAR), the higher level of the SCR reflects the measurement of operational risksby means of the standard formula
� Due to the technical regulatory framework for the regulatory view (haircut) the decrease of SII-CAR is dampened compared to the Policyholder & Debt investor View (BOF CAR)
47
1 Including non-controlling interests2 Re-calculation of 2014 results with pre-approval model changes
A
47
182% 179% 171%
2014 2014 MC 20152
Eligible Own Funds (€bn) 1
Solvency Capital Required (€bn) 1
Solvency II Ratio 1
12.0 12.0 13.4
2014 2014 MC 20152
6.6 6.77.8
2014 2014 MC 20152
Note: In the entire presentation, calculations are based on a 99.5% confidence level, including volatility adjustments yet without the effect of applicable transitionals

Deutsche Bank German, Swiss & Austrian Conference, Berlin, 8 June 2016
� Credit risk
� Interest rate
TERM 2015 – Analysis of Change
Basic Own Funds (€bn) 1
Solvency Capital Required (€bn) 1
Capital Adequacy Ratio (CAR) 1
48
A
Model Change Effect Economic Effect� Call of hybrids
� Interest rate development
� Credit spread widening
� Retention of profits
� Magallanes goodwill
� Higher risk margins
Model Change Effect Economic Effect
� Currency-adjusted (underlying) growth
� Currencies (USD)
� De-risking in the German Life portfolio
� Overall increase of exposures to credit risk
� Increased credit risk lowering diversification
� Credit spread widening
÷
=
detrimental impactmoderately negative impactfavourable impact
1 Including non-controlling interests
Few model changes further increasing model robustne ss
Pre-approval
2
2
2
� Slight decrease of Own Funds for Primary Life, due to model changes
� Higher risk margins
2

Deutsche Bank German, Swiss & Austrian Conference, Berlin, 8 June 2016
187%
217%4
202%
231%
2.1
2.6
2.2
6.9
6.5
13.4
253%
Industrial Lines
Retail Germany
Retail International
Diversification between Primary Divisions
Primary Insurance
Reinsurance & Corporate Operations
Diversification between Primary Divisions and Reinsurance & Corporate Operations
Talanx Group
49
TERM 2015 – Own Funds, SCR and CAR by Division
Equity by Division 2 CAR by Division
Own Funds, SCR and CAR by DivisionOwn Funds by Division 1 SCR by Division 3
A
49
1 Economic View based on Basic Own Funds (including hybrids, surplus funds and non-controlling interests)2 approximated IFRS equity without consideration of consolidation effects 3 Solvency capital requirement; determined according to 99.5% security level, economic view based on Basic Own Funds, including non-controlling interests 4 In the internal model view, the CAR of the German Life carriers stand at above 140% overall, for each individually above 100%
2.0
3.9
2.0
7.9
10.1
18.0
1.1
1.8
1.0
0.4
3.4
4.8
1.1
7.1
SCR by Division 3
All Divisions well capitalised

Deutsche Bank German, Swiss & Austrian Conference, Berlin, 8 June 201650
Solvency capital requirement split into components
Risk components of Talanx Group 1
A
(as of 31 December 2015, €bn)M
arke
t ris
k no
nlife
and
re
insu
ranc
e
Mar
ket
risk
prim
ary
life
Pen
sion
ris
k
Div
ersi
ficat
ion
Tot
al
mar
ket
risk
Pre
miu
m
and
rese
rve
risk
(non
life)
Nat
Cat
(non
life)
Cou
nter
part
y de
faul
t ris
k
Div
ersi
ficat
ion
Non
life
risk
Und
erw
ritin
g ris
k lif
e
Ope
ratio
nal
risk
Tot
al r
isk
befo
re t
ax a
nd
befo
re
dive
rsifi
catio
n
Tax
effe
ct
Div
ersi
ficat
ion
Tot
al r
isk
4.6
34.8%1.7
13.0%0.3
2.6%
0.8
6.3%
5.843.9%
3.5
27.0%
2.5
19.4%
0.5
3.4%
2.1
16.0%4.0
30.4%
2.5
19.0%0.4
3.2%13.1
100.0%
1.4
4.6
7.1
1 Figures show risk categorisation of the Talanx Group including non-controlling interests. Solvency capital requirement determined according to 99.5% security level for the economic view, based on Basic Own Funds (BOF)
High diversification between risk categories – marke t risk remains still below 50% threshold

Deutsche Bank German, Swiss & Austrian Conference, Berlin, 8 June 2016
Policyholder & Debt investor View
TerminologyTalanx level HDI level
BOF CAR =17,993 / 7,113 = 253%
(BOF/SCRBOF)
in €m
Figures according to Talanx’s standardised terminolog y
51
A
SII Ratio = 13,336 / 7,826 = 171%
Solvency II View
FCIIF – Financial Credit Institutions and Investmend FirmsIORP – Insitutions for Occupational Retirement Provisions
TERM 2015 – From IFRS equity to Eligible Own Funds

Deutsche Bank German, Swiss & Austrian Conference, Berlin, 8 June 2016
Talanx’s Tiering
Talanx is very well placed compared to peers
52
90.7%
7.2%
2.0%
Comments
� The SCR is based on the partial internal model, i.e. operational risk is captured by standardised methods
� The tiering of Talanx compareswell with sector peers. 88% ofOwn Funds consist of un-restricted Tier 1. The Tier 1 coverage stands at 155%
� Tier 2 mainly consists ofsubordinated bonds issued byHannover Finance and TalanxFinance
TERM 2015 – Solvency II Perspective - TieringA
Own funds composition
Unrestricted Tier 1
Restricted Tier 1
Tier 2
Solvency II Ratio 171%of whichTier 1 coverage 155%ptsTier 2 coverage 16%pts
88%
9%3%

Deutsche Bank German, Swiss & Austrian Conference, Berlin, 8 June 2016
257%
243%
204%
246%
257%
249%
253%
Interest rate +50 bps
Interest rate -50 bps
Credit spread +100 bps
NatCat event (1-in-200-years)
Equity markets +30%
Equity markets -30%
Ratio as of 31.12.2015
2
�Sensitivities are comparable to last year’s results which underlines that the risk profile is largely unchanged
�Sensitivities completely calculated in TERM which improves last year’s results. However, this effect is leveled out by increased exposures
18.0
7.1
253%
Basic Own Funds (before deductions)
SCRBOF
Policyholder & Debt investor View Estimation of stress impact 1
1 Estimated BOF CAR changes in case of stress scenarios (stress applied on both Basic Own Funds and capital requirement, approximation for loss absorbingcapacity of deferred taxes)
2 European storm; net after reinstatement premium, single event3 The credit spreads are calculated as spreads over the swap curve (credit spread stresses inculde stress on government bonds)4 Interest rate stresses based on non-parallel shifts of the interest rate curve based on EIOPA approach
4
4
3
BOF CAR after stresses comfortably above target
53
A TERM 2015 – Sensitivities of BOF CAR

Deutsche Bank German, Swiss & Austrian Conference, Berlin, 8 June 2016
175%
164%
140%
164%
174%
168%
171%
Interest rate +50 bps
Interest rate -50 bps
Credit spread +100 bps
NatCat event (1-in-200-years)
Equity markets +30%
Equity markets -30%
Ratio as of 31.12.2015
2
� In the Solvency II Perspective, sensitivities are dampened
13.4
7.8
171%
Eligible Own Funds
SCRSII
Solvency II Perspective Estimation of stress impact 1
1 Estimated solvency ratio changes in case of stress scenarios (stress applied on both Eligible Own Funds and capital requirement, approximation for loss absorbing capacity of deferred taxes)
2 European storm; net after reinstatement premium, single event3 The credit spreads are calculated as spreads over the swap curve (credit spread stresses inculde stress on government bonds)4 Interest rate stresses based on non-parallel shifts of the interest rate curve based on EIOPA approach
4
4
3
Solvency II Ratio after stresses on interest rates, NatCat and equities comfortably above target
54
A TERM 2015 – Sensitivities of Solvency II Ratio

Deutsche Bank German, Swiss & Austrian Conference, Berlin, 8 June 2016
Talanx approach
Talanx sets strategic targets for Solvency II Perspe ctive and BOF CAR
� For the Solvency II Perspective, Talanxdefines a target corridorof 150 to 200%
� For the Policyholder & Debt investor View, a minimum target of 200% is set.
� The latter reflects theconcept that is used forrisk budgeting andsteering at Talanx as itbest reflects theeconomic capitalposition of the Group
55
A Target CARs
Comments
253%
targetcorridor
≥ 200%
0%
50%
100%
150%
200%
250%
300%
Solvency II View Policyholder &Debt investor
View
171%
limit

Deutsche Bank German, Swiss & Austrian Conference, Berlin, 8 June 2016
� Increase in MCEV mainly stems from domestic business (Primary D) due to slightly higher yields at year-end and due to some positive impact from assumption changes. The MCEV of the International Primary business (Primary INT) is 10.7% up. For Reinsurance, the MCEV slightly decreased mainly due to the increase in the cost of capital factor for CoRNHR from 4.5% to 6% as required by Solvency II alignment (€ -163.3m)
� MCEV explicitly calculated for major Primary Life Insurance carriers in Germany, Italy and Poland1
� Covered businesses contribute more than 95% of total IFRS net premiums written by Primary Life Insurance and Life/Health Reinsurance businesses of Talanx Group
56
A
1 HDI-, neue leben-, PB and TARGO Lebensversicherung AG, HDI Pensionskasse AG, HDI Assicurazioni S.p.A. Life and Towarzystwo Ubezpieczen na ZycieWARTA S.A., as well as for the active Life and Health reinsurance businesses of Hannover Re
MCEV 2015 - Overview
2015 2014 2015 2014 2015 2014 2015 2014 2015 2014 Change
€m €m €m €m €m €m €m €m €m €m %
Net asset value (NAV) 671.9 771.2 336.4 303.3 1,008.3 1,0 74.5 832.9 857.1 1,841.2 1,931.5 -4.7
Present value of future profits (certainty equivalent) 1,050.0 678.1 146.3 123.3 1,196.3 801.4 1,937.4 1,707.8 3,133.7 2,509.2 24.9
Financial options and guarantees (FOGs) -592.3 -803.7 -34.5 -20.6 -626.8 -824.3 -2.0 -4.7 -628.7 -829.0 24.2
Cost of residual non-hedgeable risks (CoRNHR) -317.8 -143.6 -19.1 -18.4 -336.9 -162.0 -654.4 -353.5 -991.3 -515.6 -92.3
Cost of required capital (CoRC) -8.3 5.9 -8.3 -4.3 -16.6 1.6 -59.4 -58.8 -76.0 -57.1 -33.1
Look through and other adjustments 135.9 136.4 -16.4 -18.1 119.4 118.3 -59.2 -52.6 60.2 65.7 -8.3
Value in-force (VIF) 267.5 -127.0 67.9 62.0 335.4 -65.0 1, 162.4 1,238.2 1,497.8 1,173.2 27.7
MCEV after minorities 939.4 644.1 404.3 365.3 1,343.7 1,009.4 1,995.3 2,095.2 3,339.0 3,104.7 7.5
Primary Insurance
Primary DTalanx
Primary INT TotalReinsurance
MCEV improved on Primary Insurance and Group level

Deutsche Bank German, Swiss & Austrian Conference, Berlin, 8 June 2016
3,104.7 67.8 3,172.5
297.2198.4
134.3
171.9 533.2
366.7
3,339.0O
peni
ng M
CE
V
Initi
alad
just
men
ts
Adj
uste
d op
enin
gm
arke
tco
nsis
tent
embe
dded
val
ue(M
CEV
)
New
bus
ines
sva
lue
Rol
l for
war
d
Ope
ratin
gas
sum
ptio
ns a
ndva
rianc
es (i
ncl.
mod
el c
han
ges)
Eco
nom
ic a
ndot
her n
on-
oper
atin
gva
rianc
es
Tota
l MC
EV
earn
ings
Clo
sing
adju
stm
ents
Clo
sing
MC
EVClosing
MCEVClosing
adjustmentsTotal MCEV
earningsEconomic and
other non-operatingvariances
Operatingassumptions
and variances(incl. model
changes)
Roll forward
New businessvalue(NBV)
Adjustedopening MCEV
Initialadjustments
OpeningMCEV
57
1,009 0 1,009 36 127 137 213 512 (178) 1,344
2,095 68 2,163 261 72 (271) (41) 21 (189) 1,995
A MCEV 2015 - Movement of Embedded Value
Movement of Embedded Value (€m)
Primary Insurance benefits from slightly higher yie lds and from assumption changes –Reinsurance improved its excellent new business val ue
Primary Ins.
Reins.

Deutsche Bank German, Swiss & Austrian Conference, Berlin, 8 June 2016
Primary insurance� Increase in MCEV mainly due to
slightly higher yields and due to assumption changes
� International business developedpositively although the operatingincrease in MCEV was slightlyoffset by the negative effect of thenew Polish tax legislation (impact projected into infinity for € -7.3m)
Reinsurance� The excellent new business value
of Reinsurance is overcompensated by the increase in the cost of capital factor, further model changes as well as experience variances
Comments
58
A
VIF = Value In ForceNAV = Net Asset Value
MCEV 2015 - Analysis of change
Talanx
NAV VIF Total NAV VIF Total Total
€m €m €m €m €m €m €mOpening MCEV 1,074.5 -65.0 1,009.4 857.1 1,238.2 2,095.2 3 ,104.7
Capital injection - - - 67.8 - 67.8 67.8
Dividend payments - - - - - - -
Other implications - - - - - - -
Adjusted opening MCEV 1,074.5 -65.0 1,009.4 924.9 1,238. 2 2,163.0 3,172.5
New business value -4.1 40.2 36.0 -27.2 288.3 261.1 297.2
Expected existing business contribution (reference rate)
0.9 107.4 108.3 4.9 57.4 62.3 170.6
Expected existing business contribution (in excess of reference rate)
0.6 17.9 18.5 9.4 - 9.4 27.9
Transfers from VIF and required capital (RC) to free surplus (FS)
61.3 -61.3 - 144.5 -144.5 - -
Experience variances 33.9 -5.2 28.7 6.1 -81.8 -75.7 -47.0
Assumption changes - 231.4 231.4 4.4 61.4 65.9 297.2
Other operating variances 1.5 -125.0 -123.5 -5.4 -255.7 -261.1 -384.6
Operating MCEV earnings 94.2 205.3 299.5 136.6 -74.8 61.8 361.3
Economic variances 19.1 200.9 220.0 21.1 -61.9 -40.8 179.2
Other non-operating variances - -7.3 -7.3 - - - -7.3
Total MCEV earnings 113.2 398.9 512.2 157.7 -136.7 21.0 53 3.2
Closing adjustments -179.4 1.5 -177.9 -249.7 60.9 -188.8 - 366.7
Capital injection -168.3 1.0 -167.4 -181.0 - -181.0 -348.3
Dividend payments -10.1 - -10.1 -73.5 - -73.5 -83.6
Change in currency exchange rates -1.0 0.5 -0.4 4.9 60.9 65.8 65.3
Closing MCEV after m inorities 1,008.3 335.4 1,343.7 832 .9 1,162.4 1,995.3 3,339.0
ReinsurancePrimary insurance
Significant increase in MCEV for Primary Insurance while MCEV for Reinsurance is slightly down

Deutsche Bank German, Swiss & Austrian Conference, Berlin, 8 June 201659
� Significant increase in new business value (NBV) of domestic Primary Insurance (2015: €29.9m; 2014: €2.7m) due to a recovery of new business profitability. This resultsfrom a somewhat more favourableinterest outlook and, in particular, from an improved business mix
� NBV of international Primary Insurance virtually flat (2015: €6.2m, 2014: €6.5m). The increase of NBV in Italy is offset by an decrease in profitability in the Polish insurance market due to the new tax law
� Reinsurance improved its excellent NBV from last year (2015: €261.1m, 2014: €216.5m)
Comments
A MCEV 2015 - New Business
D
2015 2015 2015 2014 2015 2014 2015 2014 Change€m €m €m €m €m €m €m €m %
Profit/Loss on new business 2.9 -7.0 -4.1 -3.9 -27.2 -33.4 -31.3 -37.3 16.1
Present value of future prof its (certainty equivalent)
75.1 28.7 103.8 71.0 384.3 318.4 488.2 389.4 25.4
Financial options and guarantees (FOGs)
-20.7 -6.6 -27.3 -46.0 0.0 0.0 -27.3 -46.0 40.6
Cost of residual non-hedgeable risks (CoRNHR)
-25.7 -4.2 -29.9 -14.7 -77.1 -50.9 -107.1 -65.6 -63.1
Cost of required capital (CoRC)
-2.4 -1.8 -4.2 4.2 -7.5 -8.9 -11.7 -4.7 -149.5
Look through and other adjustments
0.6 -2.9 -2.3 -1.4 -11.4 -8.7 -13.6 -10.1 -35.3
New business value after minorities
29.9 6.2 36.0 9.2 261.1 216.5 297.2 225.7 31.7
New business margin 1.1% 0.8% 1.0% 0.2% 3.9% 4.1% 2.9% 2.4% 20.5%
TotalReinsurance
Primary insuranceTalanx
INT
Significant increase in Talanx’s new business value due to improvements both on the domestic Primary Insurance as well as on the Reinsurance sid e

Deutsche Bank German, Swiss & Austrian Conference, Berlin, 8 June 2016
� MCEV sensitivities for interest rate changes in Primary Insurance have significantly reduced
� Other sensitivities are more stablecompared to the previous year
� For Primary Insurance mostsensitivities have decreased in absolute terms
� Higher MCEV levels in domesticbusiness contribute to the overalldecline in Primary Insurance sensitivities in percentage terms
60
A
Comments
MCEV 2015 - Sensitivity analysis
For comparison purposes the calculation with the former cost of capital rate (4.5% - now 6%) in the CoRNHR is shown as a sensitivity.
D INT
2015 2015 2015 2014 2015 2014 2015 2014
€m €m €m €m €m €m €m €m
MCEV after minorities 939.4 404.3 1,343.7 1,009.4 1,995. 3 2,095.2 3,339.0 3,104.7
% % % % % % % %
Mortality/Morbidity + 5% (non-annuity) -3.7 -2.1 -3.2 -5.3 -34.9 -29.3 -22.2 -21.5
Mortality/Morbidity -5% (non-annuity) 3.8 2.1 3.3 5.3 35.2 29.6 22.4 21.7
Mortality +5% (annuity) 4.7 -0.0 3.3 5.7 8.5 6.1 6.4 6.0
Mortality -5% (annuity) -5.0 0.0 -3.5 -6.3 -9.0 -6.5 -6.8 -6.4
Lapse rate +10% -1.4 -1.1 -1.3 -1.4 -7.3 -6.0 -4.9 -4.5
Lapse rate -10% 1.6 1.2 1.5 1.8 8.9 7.2 5.9 5.5
Maintenance expenses +10% -10.5 -2.4 -8.1 -13.8 -2.8 -2.6 -4.9 -6.2
Maintenance expenses -10% 10.4 2.4 8.0 13.5 2.9 2.5 5.0 6.1
Yield curve +1% 19.6 -10.4 10.5 40.3 -5.7 -4.9 0.8 9.8
Yield curve -1% -63.8 1.1 -44.3 -84.8 7.1 6.6 -13.6 -23.1
Sw aption implied volatilities +25% -7.9 -4.7 -7.0 -16.4 - -0.2 -2.8 -5.4
Equity and property value +10% 7.3 1.6 5.6 7.9 0.0 0.0 2.3 2.6
Equity and property value -10% -7.8 -2.6 -6.2 -7.9 -0.0 -0.0 -2.5 -2.6
Equity option volatilities +25% -1.7 -0.0 -1.2 -2.2 - -0.0 -0.5 -0.7
CoRNHR: Cost of capital rate 4.5% 8.5 1.2 6.3 8.2 7.4
Primary insurance
TotalReinsurance Talanx
1
1
Sensitivities on Group level have considerably lowered

Deutsche Bank German, Swiss & Austrian Conference, Berlin, 8 June 2016
MCEV 2015 - Duration concepts
11.3 11.5
5.5 5.6
8.7 8.810.8 10.7
4.8 4.6
7.7 7.7
Primary Insurance(life) 2015
Primary Insurance(life) 2014
Primary Insurance(non-life) 2015
Primary Insurance(non-life) 2014
Talanx Group 2015 Talanx Group 2014
Durations of technical reserves and bond portfolio, 2015 and 2014
61
A
Technical reserves (effective) 2015 Bond portfolio (Macaulay incl. derivatives) 2015 (approx. for slightly lower modified duration)Technical reserves (effective) 2014 Bond portfolio (Macaulay incl. derivatives) 2014 (approx. for slightly lower modified duration)
∆ =0.5 ∆=0.8
∆=0.7 ∆=1.0
∆=1.0 ∆=1.1
1
Duration gaps have somewhat narrowed
Note: Effective duration bases on the concept of modified duration, i.e. indicates a relative change in portfolio/asset values in terms of interest rate changes. It additionally takes embedded options and guarantees into account. It recognises that surplus funds and taxes act as a buffer that bears parts of potential negative effects from interest rate declines.
1 Retroactively the 2014 number for the Group has been adjusted from 8.6 to 8.8. The increase results from true-up effects reflecting a more precise calculation of consolidation effects.
Deutsche Bank German, Swiss & Austrian Conference, Berlin, 8 June 2016
- Debt Financing Overview -
62

Deutsche Bank German, Swiss & Austrian Conference, Berlin, 8 June 201663
Capital / liquidity management (excluding Hannover Re)
CommentsOrganisational overview
� One central function for capital and liquidity management
� Secure a comfortable level of liquidity at Talanx AG
� Active capital and liquidity management
� Know-how centre for capital market instruments
� Central steering of all capital markets processes for the group
� Financing of group companies at arm’s-length
� Cost reduction as a consequence of concentration of all bank relations in one function and due to benchmark sizes in capital and liquidity funding
� FX / Interest rate hedging
� Investment of Liquidity buffers
Capital markets
Treasury
capital/liquidity
dividend/interests
Banks/Investors
Subordinated Bonds
Senior Bonds
Equities
Convertibles
Credit facilities
Realisation of efficiency and scale effects through central state-of-the-art treasury function

Deutsche Bank German, Swiss & Austrian Conference, Berlin, 8 June 2016
Market transactions 2012 - 2014
64
Latest capital market transactions (excluding Hanno ver Re)
1 conversion of the Tier 1 Meiji Yasuda bond
April
July
Oct
Subordinated bond 8.367%, 30-NC-10
2012
2013
Liability management exercise
Strengthening of capitalisation of Talanx
Group
Reduction of external debt
IPO
Senior bond 3.125%, 10 years
Financing of organic and inorganic growth and partially
repay amounts outstanding under two credit facilities
Refinancing of internal debt
€m
April
July
Oct
Feb
April
July
Oct
Feb
Senior bond 2.50%, 12 years
2014 500Refinancing
of internal debtJuly
Capital market footprint resulting in reasonably ef ficient market prices as a basis for new issues
500
517
(204)
750
300 1

Deutsche Bank German, Swiss & Austrian Conference, Berlin, 8 June 2016
2016 2017 2018 2019 2020 2021 2022 2023 2024 2025 2026
Outstanding Talanx hybrid and senior bonds
65
Talanx Group maturity structure (excluding Hannover Re)Outstanding, publicly held volume of hybrid and senior bonds (as of 31/03/2015):
� 2010: €500m (Hannover Finance), callable 2020
� 2012: €500m (Hannover Finance), callable 2022
� 2012: €500m (Talanx Finanz), callable 2022
� 2013: €565m (Talanx AG)
� 2014: €500m (Talanx AG)
� 2014: €500m (Hannover Rück SE), callable 2024
€500mm 30-nc-108.367%
€113m 20NC104.500%
€110m PerpNC10
6.750%
Talanx Group maturity structure
€500m o.E.C103.38%
€500m 12 year2.50%
€565m 10 year3.125%
€500m 30NC108.367%
€500m 31NC105.00% (HR)
€500m 30NC105.75%
Talanx
Hannover Re
At the moment: No refinancing needs mid-term
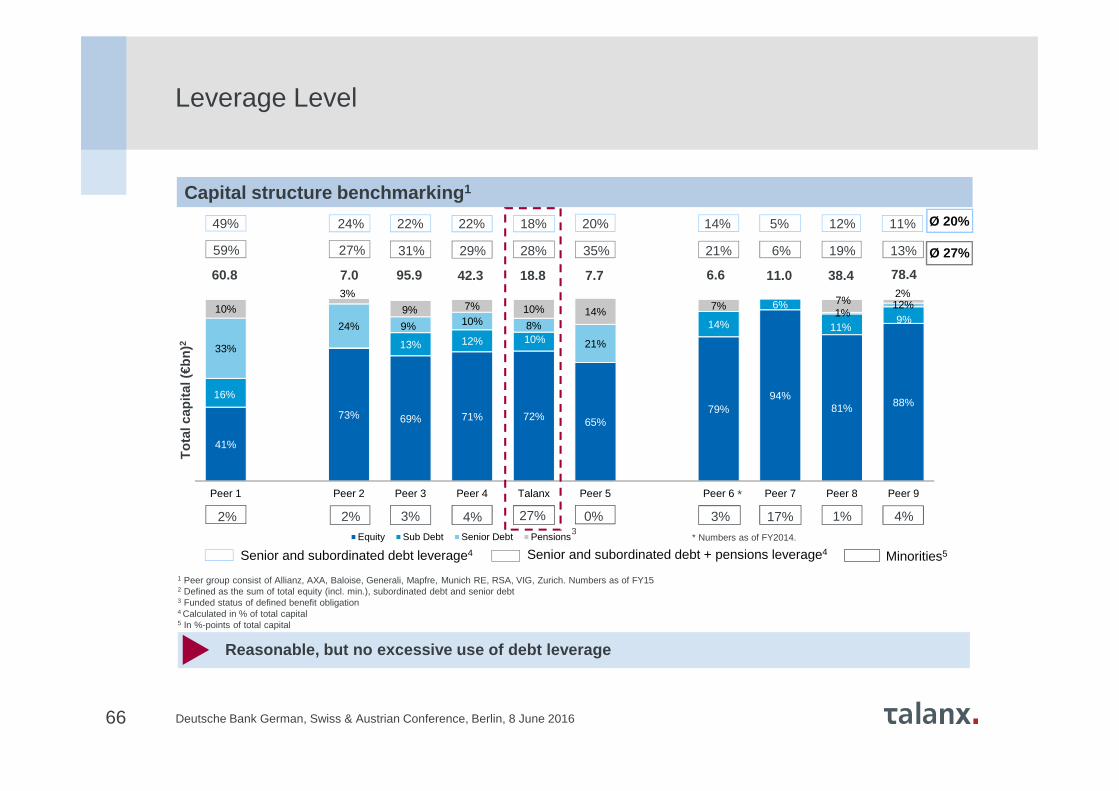
Deutsche Bank German, Swiss & Austrian Conference, Berlin, 8 June 2016
41%
73% 69% 71% 72% 65%79%
94%81% 88%
16%
13% 12% 10%14%
6%
11%9%
33%
24% 10% 8%
21%
1%12%10%
3%
9% 7% 10% 14% 7% 7%2%
Peer 1 Peer 2 Peer 3 Peer 4 Talanx Peer 5 Peer 6 Peer 7 Peer 8 Peer 9
Equity Sub Debt Senior Debt Pensions
9%
Leverage Level
66
Capital structure benchmarking 1
1 Peer group consist of Allianz, AXA, Baloise, Generali, Mapfre, Munich RE, RSA, VIG, Zurich. Numbers as of FY152 Defined as the sum of total equity (incl. min.), subordinated debt and senior debt3 Funded status of defined benefit obligation4 Calculated in % of total capital5 In %-points of total capital
Senior and subordinated debt + pensions leverage4
Tot
al c
apita
l(€b
n)2
Senior and subordinated debt leverage4
49%
59%
24%
27%
22%
31%
22%
29%
18%
28%
20%
35%
14%
21%
5%
6%
12%
19%
11%
13%
Ø 20%
Ø 27%
60.8 7.0 95.9 42.3 18.8 7.7 6.6 11.0 38.4 78.4
3
Minorities5
3%2% 4% 27% 0% 3% 17% 4%1%2%
* Numbers as of FY2014.
*
Reasonable, but no excessive use of debt leverage

Deutsche Bank German, Swiss & Austrian Conference, Berlin, 8 June 201667
This presentation contains forward-looking statements which are based on certain assumptions, expectations and opinions of the management of Talanx AG (the "Company") or cited from third-party sources. These statements are, therefore, subject to certain known or unknown risks and uncertainties. A variety of factors, many of which are beyond the Company’s control, affect the Company’s business activities, business strategy, results, performance and achievements. Should one or more of these factors or risks or uncertainties materialize, actual results, performance or achievements of the Company may vary materially from those expressed or implied as being expected, anticipated, intended, planned, believed, sought, estimated or projected.in the relevant forward-looking statement.
The Company does not guarantee that the assumptions underlying such forward-looking statements are free from errors nor does theCompany accept any responsibility for the actual occurrence of the forecasted developments. The Company neither intends, nor assumes any obligation, to update or revise these forward-looking statements in light of developments which differ from those anticipated.
Where any information and statistics are quoted from any external source, such information or statistics should not be interpreted as having been adopted or endorsed by the Company as being accurate. Presentations of the company usually contain supplemental financial measures (e.g., return on investment, return on equity, gross/net combined ratios, solvency ratios) which the Company believes to be useful performance measures but which are not recognised as measures under International Financial Reporting Standards, as adopted by the European Union ("IFRS"). Therefore, such measures should be viewed as supplemental to, but not as substitute for, balance sheet, statement of income or cash flow statement data determined in accordance with IFRS. Since not allcompanies define such measures in the same way, the respective measures may not be comparable to similarly-titled measures used by other companies. This presentation is dated as of 07 June 2016. Neither the delivery of this presentation nor any further discussions of the Company with any of the recipients shall, under any circumstances, create any implication that there has been no change in the affairs of the Company since such date. This material is being delivered in conjunction with an oral presentation by the Company and should not be taken out of context.
Disclaimer