deutsche bank leveraged finance conference -...
TRANSCRIPT
1
Deutsche Bank Leveraged Finance
ConferenceSeptember 25, 2008
Jay CraigSenior Vice President and CFO

2
Forward-Looking StatementsThis presentation contains statements relating to future results of the company (including certain projections and business trends) that are “forward-looking statements” as defined in the Private Securities Litigation Reform Act of 1995. Forward-looking statements are typically identified by words or phrases such as “believe,” “expect,” “anticipate,”“estimate,” “should,” “are likely to be,” “will” and similar expressions. There are risks and uncertainties relating to the announced spin-off of ArvinMeritor’s LVS business, including the timing and certainty of completion of the transition. In addition, actual results may differ materially from those projected as a result of certain risks and uncertainties, including but not limited to global economic and market cycles and conditions; the demand for commercial, specialty and light vehicles for which the company supplies products; risks inherent in operating abroad (including foreign currency exchange rates and potential disruption of production and supply due to terrorist attacks or acts of aggression); availability and sharply rising cost of raw materials, including steel and oil; OEM program delays; demand for and market acceptance of new and existing products; successful development of new products; reliance on major OEM customers; labor relations of the company, its suppliers and customers, including potential disruptions in supply of parts to our facilities or demand for our products due to work stoppages; the financial condition of the company’s suppliers and customers, including potential bankruptcies; possible adverse effects of any future suspension of normal trade credit terms by our suppliers; potential difficulties competing with companies that have avoided their existing contracts in bankruptcy and reorganization proceedings; successful integration of acquired or merged businesses; the ability to achieve the expected annual savings and synergies from past and future business combinations and the ability to achieve the expected benefits of restructuring actions; success and timing of potential divestitures; potential impairment of long-lived assets, including goodwill; potential adjustment of the value of deferred tax assets; competitive product and pricing pressures; the amount of the company’s debt; the ability of the company to continue to comply with covenants in its financing agreements; the ability of the company to access capital markets; credit ratings of the company’s debt; the outcome of existing and any future legal proceedings, including any litigation with respect to environmental or asbestos-related matters; product liability and warranty and recall claims; rising costs of pension and other post-retirement benefits and possible changes in pension and other accounting rules; as well as other risks and uncertainties, including but not limited to those detailed herein and from time to time in other filings of the company with the SEC. These forward-looking statements are made only as of the date hereof, and the company undertakes no obligation to update or revise the forward-looking statements, whether as a result of new information, future events or otherwise, except as otherwise required by law.

3
Agenda
• Business Unit Overview
• Driving Financial Results
• Frequently Asked Questions

4
CVS Customer Mix2007 Sales
GM
Fiat/Iveco
BAE
Hino
XCMG
Tata
Ashok Leyland
VW
PACCAR
Volvo Group
Daimler Trucks
ITE
Aftermarket, Trailers and
Other
$4.2 Billion

5
CVS Geographic Mix
North America
54%Europe
28%
South America
6%Asia Pacific
11%
2007 Sales First 9 Months, 2008
Europe36%
Asia and Other20%
North America
44%
North America
54%
Asia and Other17%
Europe29%

6
Product PortfolioBRAKING SYSTEMS BRAKING SYSTEMS
Cam brakesAir disc brakes
Hydraulic disc brakesParking brakes
Automatic slack adjustersHubs, drums and rotors
Steel and Stainless Clad Wheels
ELSA195 Air Disc Brake
Meritor Tandem Axle
Meritor® RPL Driveline
AXLES, DRIVELINES AND SUSPENSIONS AXLES, DRIVELINES AND SUSPENSIONS Front steer and drive axles
All-wheel drive axlesSingle and tandem rear drive axles
Tag/pusher axlesDrivelines, universal joints and yokes
Transfer cases
Air ride suspensionsAxles and brakes
Wheel-end systemsMeritor Tire Inflation System
by P.S.I.
TRAILER AIR SUSPENSION SYSTEMSTRAILER AIR SUSPENSION SYSTEMS
Meritor® MTC-4210 Two-Speed Transfer Case
AFTERMARKET AND AFTERMARKET AND REMANUFACTURINGREMANUFACTURING
Stopping & Safety SystemsStopping & Safety SystemsAnti-lock braking Systems
Stability enhancementHydraulic power brake and
clutch control systemsAutomatic traction control
OnGuard collision safety systems
ALTERNATIVE POWERED DRIVETRAINSALTERNATIVE POWERED DRIVETRAINSHybrid Class 8 – diesel electric
Alternative powered independent suspensionUltra-low floor axlesHybrid-specific axles
Original equipment service partsAll-makes programs
Remanufactured parts- Mascot Truck Parts- Trucktechnic
Meritor RF-611 Military
Front Steer Axle

7
Commercial Vehicle Applications

8
CVS Leadership Positions (including JVs)
Category North America Europe Other Regions
Independent truck drive axle supplier #1 #1 #1 in South
America, India
Trailer axle supplier #1 #1 in South America
Truck brake remanufacturer #1
Truck air brake supplier #1 #2
Truck driveline supplier #2
Independent off-highway axle supplier #1 in China
Truck-technic
Acquisition
Strategic Thrust
Strategic Thrust

9
North America
38%
South America
10%
Europe46%
Asia Pacific6%
VW25%
Chrysler13%
Ford10%GM
7%
PSA7%
Renault8%
Hyundai5%
Nissan2%
Aftermkt9%
Fiat2% Other
5%BMW3%
Toyota2% Honda
2%
LVS Business Portfolio2007 Value-Added Sales
Geographic Mix Customer Mix
Body Systems
60%
Chassis Systems
40%
Only 20% of sales are to the Detroit 3 in North America
Segment Mix
Ford GM Chrysler TotalNorth America 4.1% 2.9% 12.6% 19.5%South America 0.0 2.9 0.2 3.0Europe 2.7 1.5 0.0 4.2Asia Pacific 2.7 0.0 0.0 2.7

10
Shocks, Struts, Tie Rods and Links Coil Springs and Stabilizer Bars
Steel WheelsModules: Cross-car, Wheel-end, Coil-over-shock
LVS Chassis Systems Product Overview
StandardDrop Center
High VentilationArea
(in development)
Cladded

11
Latches and Motors
Door ModulesWindow Regulators
LVS Body Systems Product OverviewRoof Systems
12
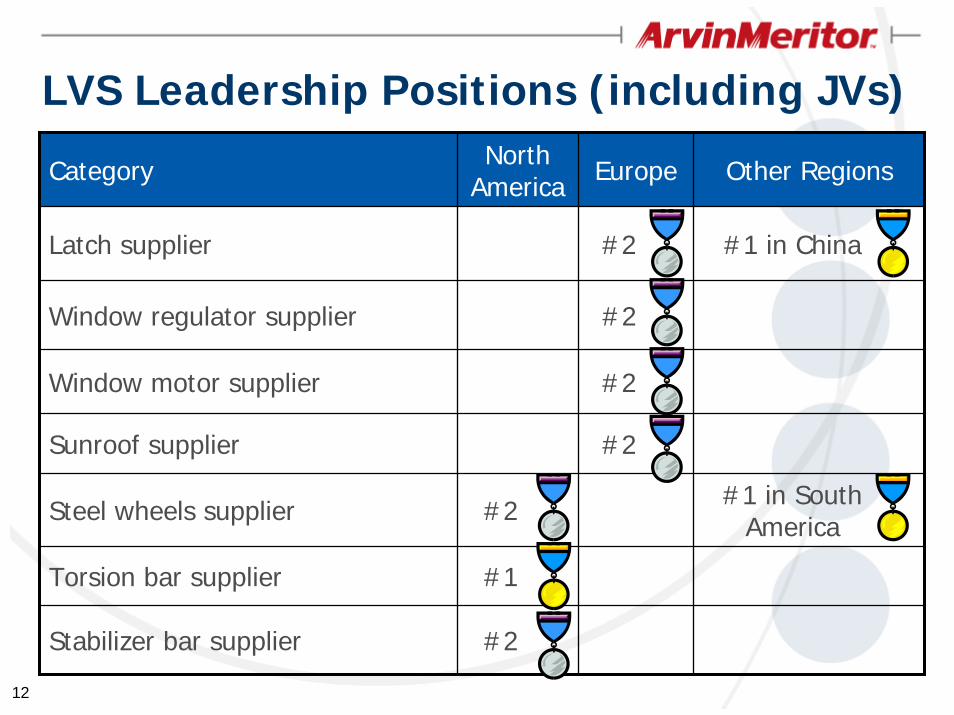
LVS Leadership Positions (including JVs)
Category North America Europe Other Regions
Latch supplier #2 #1 in China
Window regulator supplier #2
Sunroof supplier #2
Steel wheels supplier #2 #1 in South America
Torsion bar supplier #1
Window motor supplier #2
Stabilizer bar supplier #2

13
Agenda
• Business Unit Overview
• Driving Financial Results
• Frequently Asked Questions

14
$25
$50
$75
$100
$125
$100
$200
$300
$400
$5002007 (left scale)
2008 (left scale)
Trailing Twelve Months (right scale)
Q1Actual
Q2Actual
Q3Actual
Implied Midpoint
Qua
rter
ly E
BIT
DA
Positive Earnings Trend in a Difficult Environment – Total CompanyEBITDA from Continuing Operations before Special Items(1) in millions
Trai
ling
Twel
ve M
onth
EB
ITD
A
(1) See Appendix – “Non-GAAP Financial Information”

15
Most Profitable Segments Grow Rapidly
• Market leader in South America for Axles/Brakes and Suspensions• Growing bus and coach axles and brakes business in China• Commercial vehicle axles in India
– AAL joint venture is the leading independent manufacturer, with 28% CAGR since 1998
– Market leader in rapidly-growing tandem axle segment • Specialty vehicle segment
– All wheel drive systems for Military applications– Continued growth in off-highway and construction sector in Asia
• Aftermarket initiatives– Expanding presence in Europe, CIS, South America and Asia Pacific– Growing remanufacturing sales in the North American and European
markets– Acquired Mascot Truck Parts and Trucktechnic this fiscal year

16
OEM Capabilities Feed Specialized Channels
OEM Supply Off-Highway
Military
Other Specialty
Aftermarket
Capability
Reputation
Relationships
Products
Remanufacturing

17
Previous Guidance
Revised Guidance
Earnings Per ShareTop end of
$1.40 to $1.60 range
$1.55 to $1.65
Free Cash Flow in Millions(2) $(50) - $(100) Outlook improving
Fiscal Year 2008 Outlook Continuing Operations Before Special Items(1)
(1) Excluding gains or losses on divestitures, restructuring costs, and other special items(2) Cash flow from operations less capital expenditures

18
Agenda
• Business Unit Overview
• Driving Financial Results
• Frequently Asked Questions

19
Frequently Asked Questions
1. How were you able to raise guidance in this environment?
2. Why is cash flow improving?3. What exposure do you have to Lehman Brothers and
other troubled financial institutions? 4. How weak is Europe really?5. When will you start to benefit from lower steel prices?6. Will you be hurt by American Axle’s entry into the
commercial vehicle market in North America?7. Has Performance Plus already picked all the low-
hanging fruit?

20
FAQ #1: How were you able to raise guidance in this environment?
Markets better than expected
South America Industry capacity constraints less binding than anticipated
Military vehicles Incremental orders for Navistar Defense
Risks unrealized or managed
Europe medium and heavy truck Orders weak, but backlog holding through the period
Steel and other commodities Mill surcharges stabilized; pass-through arrangements worked as intended

21
FAQ #2: Why is cash flow improving?
• Cash flow outlook is improving– Strengthened earnings– Strict inventory control– Management of accounts receivable
• Half of annual management bonus depends on achievement of cash flow plan
22
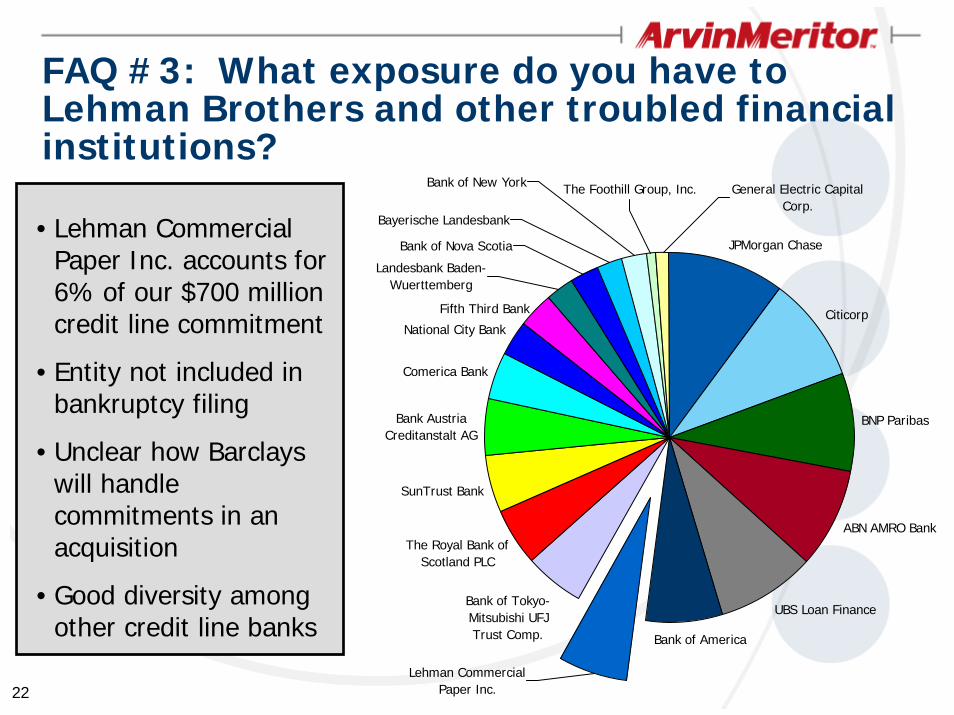
FAQ #3: What exposure do you have to Lehman Brothers and other troubled financial institutions?
JPMorgan Chase
Citicorp
BNP Paribas
UBS Loan Finance
Bank of America
Bank of Tokyo-Mitsubishi UFJ Trust Comp.
The Royal Bank of Scotland PLC
SunTrust Bank
Bank Austria Creditanstalt AG
Comerica Bank
National City Bank
Landesbank Baden-Wuerttemberg
Bayerische Landesbank
Bank of Nova Scotia
Bank of New York General Electric Capital Corp.
The Foothill Group, Inc.
ABN AMRO Bank
Lehman Commercial Paper Inc.
Fifth Third Bank
• Lehman Commercial Paper Inc. accounts for 6% of our $700 million credit line commitment
• Entity not included in bankruptcy filing
• Unclear how Barclays will handle commitments in an acquisition
• Good diversity among other credit line banks

23
FAQ #4: How bad is Europe really?
Light Vehicles
Commercial Vehicles
Bank A -8%
-6%
Bank C -5%
OEM 1 -9%
Bank B -12%
-12%
OEM 2 -5% to -10%
Analyst Estimates of 2009 Production Higher/(Lower) than 2008

24
FAQ #5: When will you start to benefit from lower steel prices?
Manage Supply
Arrangements
Implement Appropriate Surcharges
Timing Differ-ences?
End
Incremental Cost
Reductions
No
Yes
• In fiscal Q3, raw material cost increases net of related pricingreduced pre-tax profits by $9 million
• Surcharges from the mills have been flat during the quarter• Scrap steel prices have come down, which may lead to lower
finished steel prices in future periods• Customer pass-through will come down in parallel with costs

25
FAQ #6: Will you be hurt by American Axle’s entry into the CV market in North America?
• American Axle will be the tier 2 supplier to us for the axle components in question
• We were the incumbent supplier and chose not to quote these parts for the new model program although we will be making other components and assembling finished axles
26
FAQ #7: Has Performance Plus already picked all the low-hanging fruit?• Performance Plus cost reductions expected to fully achieve
2008 target of $75 million savings net of unrecovered material cost increases
• Strong implementation momentum late in the year positions the company well to achieve an additional $75 million in savings in 2009
• To increase confidence in a difficult material cost environment, we have launched a second wave of Performance Plus resources – Wave 2 team located in Europe– Intended to increase idea generation and project
management while Wave 1 ideas are being implemented

27
Appendix

28
North America Class 8 Truck Net New Orders
0
10,000
20,000
30,000
Jan Feb Mar Apr May Jun Jul Aug Sep Oct Nov Dec
2007
Source: ACT Research
Orders better than prior year in 10 of the last 11 months
Net
new
ord
ers
per
mon
th
2008

U.S. Freight Tonnage Seasonally adjusted monthly index, 2000 = 100.0
100
105
110
115
120
125 3 MMA Monthly 10-Year Trend
Jan2006
Apr 2006
Jul 2006
Oct 2006
Jan 2007
Apr2007
Ninth consecutive monthly year-over-year increaseSource: ATA
Jul2007
Oct2007
Jan 2008
Apr 2008
July ’08 Final Index – 115.5Down 0.9% from June 2008Up 3.8% from July 2007
July 2008

30
$200
$300$276
$34
$253
$77
$6
Secured Revolver
$0
$100
$200
$300
$400
$500
$600
$700
2007 2008 2009 2010 2011 2012 2013 2014 2015 2026 2027
Fiscal Year
Convertible
Defeased
Limited Term Debt RefinancingMillions as of June 30, 2008
($666 million
available)
Letters of credit

31
Use of Non-GAAP Financial InformationIn addition to the results reported in accordance with accounting principles generally accepted in the United States (“GAAP”) included throughout this presentation, the Company has provided information regarding income from continuing operations and diluted earnings per share before special items, which are non-GAAP financial measures. These non-GAAP measures are defined as reported income or loss from continuing operations and reported diluted earnings or loss per share from continuing operations plus or minus special items. Other non-GAAP financial measures include “EBITDA” and “free cash flow”. EBITDA before special items is defined as earnings before interest, taxes, depreciation and amortization, and losses on sales of receivables, plus or minus special items. Free cash flow represents net cash provided by operating activities less capital expenditures.
Management believes that the non-GAAP financial measures used in this presentation are useful to both management and investors in their analysis of the Company’s financial position and results of operations. In particular, management believes that free cash flow is useful in analyzing the Company’s ability to service and repay its debt. EBITDA is a meaningful measure of performance commonly used by management, the investment community and banking institutions to analyze operating performance and entity valuation. Further, management uses these non-GAAP measures for planning and forecasting in future periods. The company uses EBITDA as the primary basis for the chief operating decision maker to evaluate the performance of each of the company’s reportable segments.
These non-GAAP measures should not be considered a substitute for the reported results prepared in accordance with GAAP. Free cash flow should be considered substitutes for cash provided by operating activities or other balance sheet or cash flow statement data prepared in accordance with GAAP or as a measure of financial position or liquidity. In addition, the calculation of free cash flow does not reflect cash used to service debt and thus, does not reflect funds available for investment or other discretionary uses. EBITDA should not be considered an alternative to operating income as an indicator of operating performance or to cash flows as a measure of liquidity. These non-GAAP financial measures, as determined and presented by the Company, may not be comparable to related or similarly titled measures reported by other companies.
Set forth on the following slides are reconciliations of these non-GAAP financial measures, if applicable, to the most directly comparable financial measures calculated and presented in accordance with GAAP.
In addition, financial data may be provided on a “trailing twelve month basis,” which equates to the sum of the measure in question for the four most recent quarters.

32
Non-GAAP Financial InformationEBITDA Reconciliation – FY08 Quarters
(in millions) Quarter Ended Quarter Ended Quarter Ended December 31, 2007 March 31, 2008 June 30, 2008
Total EBITDA - Before Special Items $ 82 $ 104 $ 121 Restructuring Costs (10) (5) (4)Rising Sun Costs - - (6)Loss on Sale of Receivables (4) (5) (6) Depreciation and Amortization (32) (36) (38) Interest Expense, Net (27) (20) (19) Benefit (Provision) for Income Taxes (10) (14) 3
Income (Loss) From Continuing Operations (1)$ 24$ 51$

33
Non-GAAP Financial InformationEBITDA Reconciliation – FY07 Quarters
(in millions) Quarter Ended Quarter Ended Quarter Ended Quarter Ended December 31, 2006 March 31, 2007 June 30, 2007 September 30, 2007
Total EBITDA - Before Special Items 72 77 85 49 Restructuring Costs - (37) (24) (10)Fair Value Adjustment - 10 - - Impact of Work Stoppages (2) 6 (2) (14) Loss on Sale of Receivables (2) (1) (3) (3) Depreciation and Amortization (30) (34) (32) (33) Interest Expense, Net (27) (34) (27) (22) Benefit (Provision) for Income Taxes (1) - (1) 10
Income (Loss) From Continuing Operations 10$ (13)$ (4)$ (23)$