deutsche bank michael cohrs€¦ · deutsche bank michael cohrs ... explosive growth in lbo volume...
TRANSCRIPT

Deutsche BankMichael Cohrs
Deutsche Bank German Corporate ConferenceFrankfurt, 20 June 2007
Member of the Group Executive Committee

financialtransparency.
Investor Relations 06/07 · 2
Agenda
2 The Corporate and Investment Bank
1 Deutsche Bank Group

financialtransparency.
Investor Relations 06/07 · 3
The current phase of our strategy
Management Agenda Phase 3
2006 – 2008Leveraging our global platform for accelerated growth
Management Agenda Phase 1 Management Agenda Phase 2
2002 – 2003:Refocusing the business
2004 – 2005:Growth and 25% RoE
Maintain our cost, risk capital and regulatory discipline
Continue to invest in organic growth and ‘bolt-on’ acquisitions
Further grow our ‘stable’ businesses in PCAM and GTB
Build on our competitiveedge in CIB

financialtransparency.
Investor Relations 06/07 · 4
Revenue momentum, combined with cost and risk control ...
Net revenues Noninterest expenses Provision for credit losses
21.3 21.9
25.628.5
2003 2004 2005 2006
19.919.217.517.4
2003 2004 2005 2006
0.30.40.3
1.1
2003 2004 2005 2006
In EUR bn
Note: 2003 – 2005 based on U.S. GAAP; 2006 based on IFRS
10% CAGR 5% CAGR
(72)%

financialtransparency.
Investor Relations 06/07 · 5
65% CAGR6.1
3.52.5
1.4
2003 2004 2005 2006
8.3
6.1
4.0
2.8
2003 2004 2005 2006
… creates considerable operating leverage …In EUR bn
Income before income taxes Net income
Note: 2003 – 2005 based on U.S. GAAP; 2006 based on IFRS
6.1
3.52.5
1.4
2003 2004 2005 2006
45% CAGR
financialtransparency.
Investor Relations 06/07 · 6
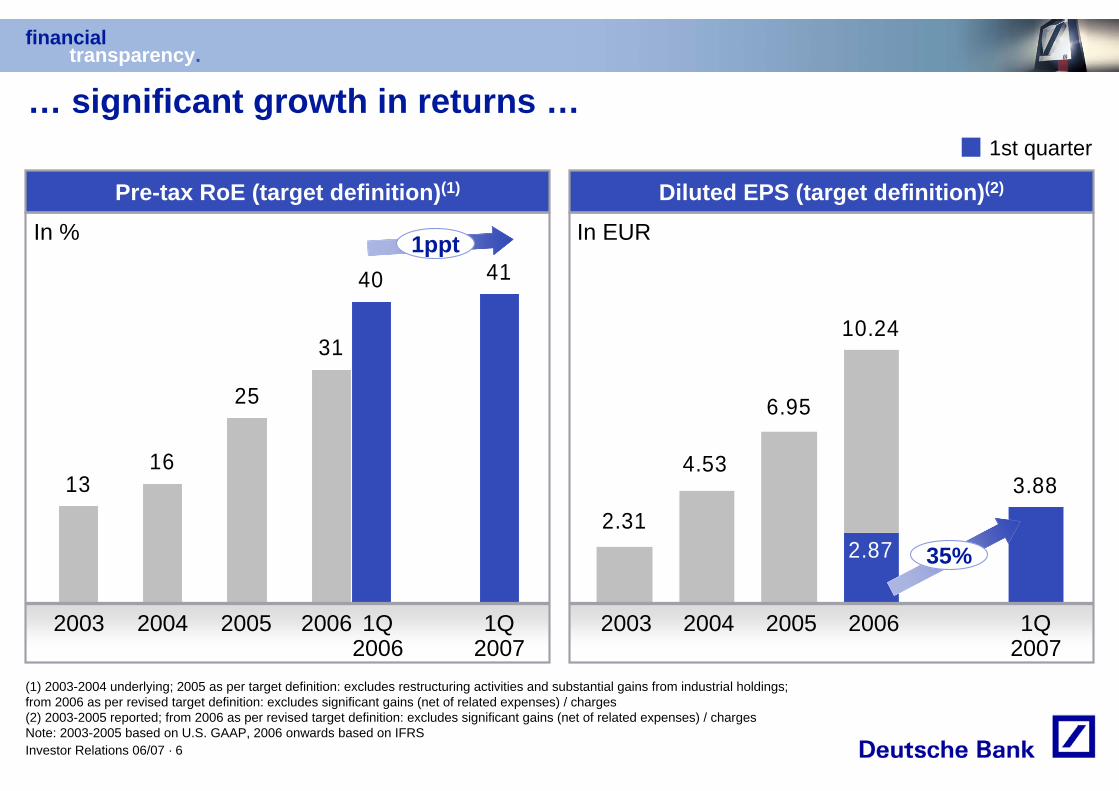
10.24
3.882.31
4.53
6.95
2.87
… significant growth in returns …
Diluted EPS (target definition)(2)Pre-tax RoE (target definition)(1)
In % In EUR
2004 2005 20062003 1Q2007
1316
25
31
4140
2004 2005 20062003 1Q2007
1st quarter
1Q2006
(1) 2003-2004 underlying; 2005 as per target definition: excludes restructuring activities and substantial gains from industrial holdings; from 2006 as per revised target definition: excludes significant gains (net of related expenses) / charges(2) 2003-2005 reported; from 2006 as per revised target definition: excludes significant gains (net of related expenses) / chargesNote: 2003-2005 based on U.S. GAAP, 2006 onwards based on IFRS
1ppt
35%

financialtransparency.
Investor Relations 06/07 · 7
32% CAGR
5.7
12.9
7.2
2002 - 2006
1.30 1.50 1.70
2.50
4.00
Delivery to shareholders
Dividend per share
20062002 2003 2004 2005
In EUR
Cash returned to shareholders
In EUR bn
Share retirements
Dividends

financialtransparency.
Investor Relations 06/07 · 8
Double-digit EPS growth in%
Sustainable profitabilityof 25% pre-tax RoE
Group targets “over-the-cycle”
Vision 2008 and group targets
MaintainingTier 1 ratioof 8 – 9%
MaintainingTier 1 ratioof 8 – 9%
1.3
1.3
(0.5)
5.3
1.0
0.0
8.4
Asset and Wealth Management
Private & Business Clients
Consolidation & Adjustments
Corporate Banking & Securities
Global Transaction Banking
Corporate Investments
Group
Vision 2008
Income before income tax expense*, in EUR bn
6.3
* Target definition

financialtransparency.
Investor Relations 06/07 · 9
Agenda
2 The Corporate and Investment Bank
1 Deutsche Bank Group
financialtransparency.
Investor Relations 06/07 · 10
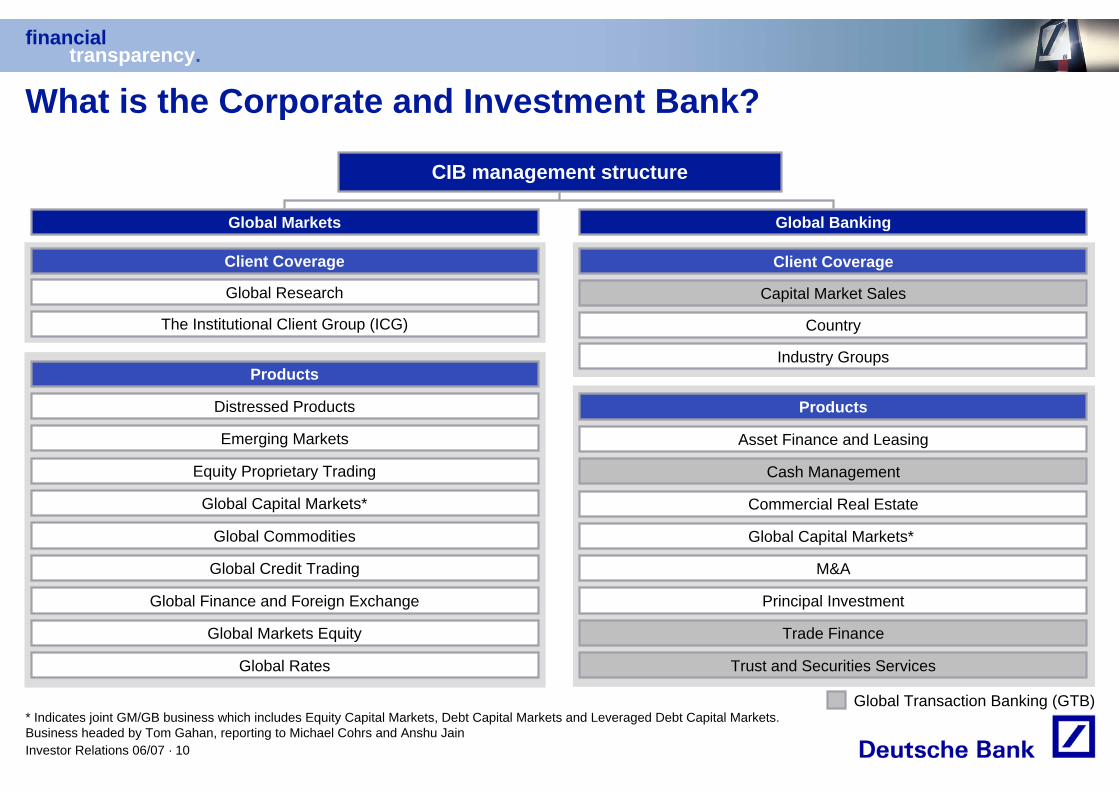
What is the Corporate and Investment Bank?
CIB management structure
M&A
Capital Market Sales
Country
Industry Groups
Global Capital Markets*
Principal Investment
Cash Management
Trade Finance
Asset Finance and Leasing
Trust and Securities Services
Global Markets Global Banking
The Institutional Client Group (ICG)
Global Capital Markets*
Global Research
Global Markets Equity
Global Finance and Foreign Exchange
Global Commodities
Global Rates
Equity Proprietary Trading
Global Credit Trading
Distressed Products
Emerging Markets
Client Coverage
Products
Client Coverage
Products
Commercial Real Estate
Global Transaction Banking (GTB)* Indicates joint GM/GB business which includes Equity Capital Markets, Debt Capital Markets and Leveraged Debt Capital Markets.Business headed by Tom Gahan, reporting to Michael Cohrs and Anshu Jain

financialtransparency.
Investor Relations 06/07 · 11
A leading global investment bank
7.2
5.8
5.04.1 3.9
3.3
5.1
0.80.30.66.76.8 6.7
GS C DB JPM MS MER CS UBS LEH
In EUR
Revenues CIB 1Q2007, in EUR bn
Change vs. 1Q2006
10% 11% 25%18%13% 31% 11% 2% 2%
Loan products
Sales & Trading
Investment banking
Transaction banking
(1) Morgan Stanley comparable segment reflects investment revenues not included in Sales & Trading / Investment banking (2) Diverging fiscal yearNote: Goldman Sachs excl. revenues from Principal Investments; translation into EUR based on average FX rate of respective reporting period; DB CIB total revenues include other revenues of EUR (0.1) bnSource: Company data
(2) (2)(2)
(1)

financialtransparency.
Investor Relations 06/07 · 12
5.9
5.14.4
3.9 3.93.3 3.1 3.1
2.7
1.7
3.43.52.7
2.12.9
1.42.0 1.6
1.3
2.4
1.7 1.1
1.9 1.21.8
1.7
1.0
GS DB MS MER C UBS JPM CS LEH
11% 30% 11%21%16% (1)% 13% (1)% 5%
Debt
Equity
Revenues Sales & Trading 1Q2007, in EUR bn
* Diverging fiscal yearNote: Goldman Sachs and Morgan Stanley excl. revenues from Principal Investments or other investment revenues; translation into EUR based on average FX rate of respective reporting period. Figures may not add up due to rounding differences.Source: Company data
Market leadership in sales and trading …
In EUR
Change vs. 1Q2006

financialtransparency.
Investor Relations 06/07 · 13
... thanks to a well diversified business portfolio
By region By product
By client
Global Markets revenues, 2006
MM & FX
Equity Prop
Prime Brokerage
Commod-ities
Structured Equity
Cash Equity
Rates
EM
Credit Americas
Europe(ex Germany)
Germany
Asia Pacific
Corporates
Banks & Insurers
Money Managers
Government
HedgeFunds

financialtransparency.
Investor Relations 06/07 · 14
Market db
Proprietary risk
Equities PropCredit PropRates PropFX Prop
Market access
Cash EquitiesForeign ExchangeGovernment BondsCorporate BondsMoney Markets
Intellectual capital
Equity DerivativesCredit DerivativesRates DerivativesFX DerivativesCommodity DerivativesCollateralized Debt Obligations Securitized ProductsStructured FinanceDistressed Products
Proprietary risk
Market access
Intellectual capital
Global Markets is superbly positioned for stable growthSales & Trading (debt / equity) revenues
Illustrative
Source: Market estimate by Oliver Wyman, company data

financialtransparency.
Investor Relations 06/07 · 15
Global Markets strategic positioning: Strongest in large, high-growth markets
OverweightIn-lineUnderweight
Prod
ucts
Clie
nts
Reg
ions
Strong competitive position in a significant market
Underweight position and/or significant planned investment
= 100% approximate % of total market Sales & Trading revenues 2006
Structured CreditStructured RatesEquity DerivativesForeign Exchange
International EquitiesPrime Finance
US EquitiesCash CreditCommoditiesCash Rates
Hedge FundsBanksInsurers/Re-insurers
Money managersCorporates
International EquitiesPrime Finance
North AmericaJapan
EuropeCEEMAAsiaLatAm
65%15%20%
60%25%15%
-55% 45%
CommoditiesPrime Finance
Source: Oliver Wyman, DB analysis
financialtransparency.
Investor Relations 06/07 · 16
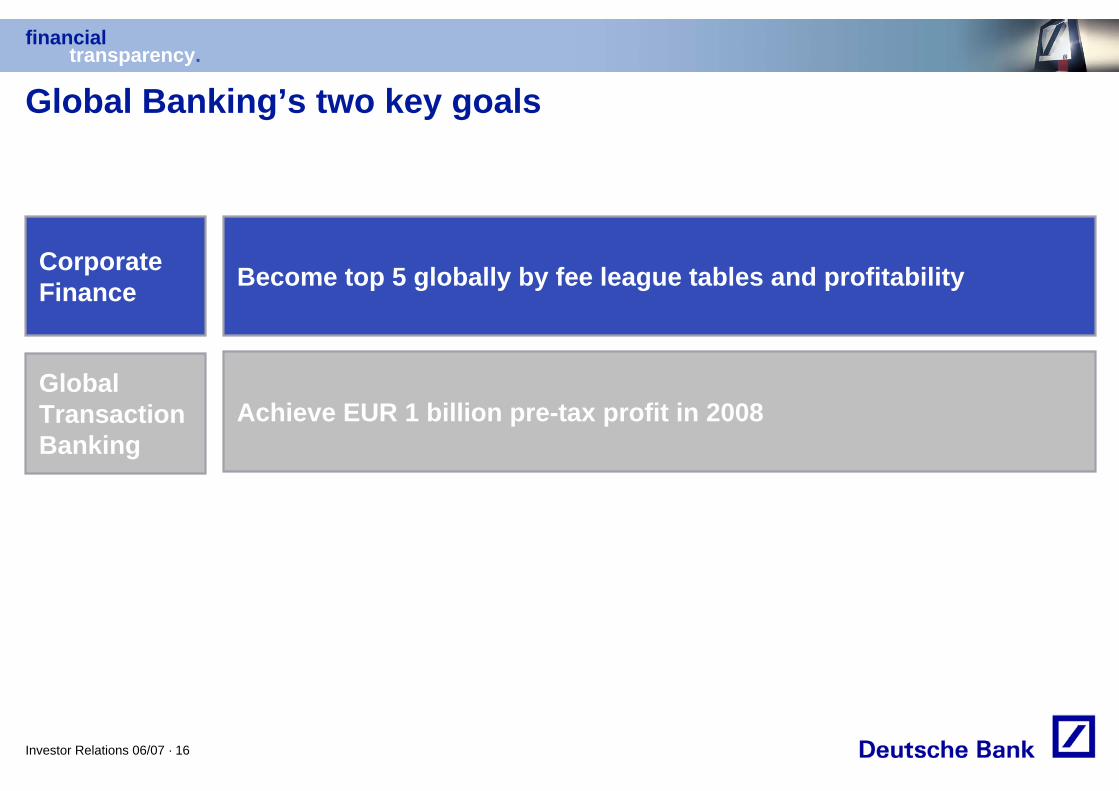
Global Banking’s two key goals
Global Transaction Banking
Achieve EUR 1 billion pre-tax profit in 2008
Corporate Finance Become top 5 globally by fee league tables and profitability

financialtransparency.
Investor Relations 06/07 · 17
8
5
6
10
9
7
4
3
2
1
8
6
1
9
3
4
2
5
4
3
6
1
8
4
5
2
15
Japan
0 1 2 3 4 5 6
JPM
GS
Citi
CS
MS
UBS
DB
ML
Lehman
BofA
Americas Asia Pacific (ex Japan) EMEA
Corporate Finance: a Top 5 position is attainable
1
2
3
4
5
6
7
8
9
10
Rank
7.7
7.1
6.9
5.5
5.4
5.1
5.0
5.0
3.4
3.3
Market share (%)
Corporate Finance fees and regional ranking, 2006
Gap: ± 10%
In USD bn
Source: Dealogic
financialtransparency.
Investor Relations 06/07 · 18
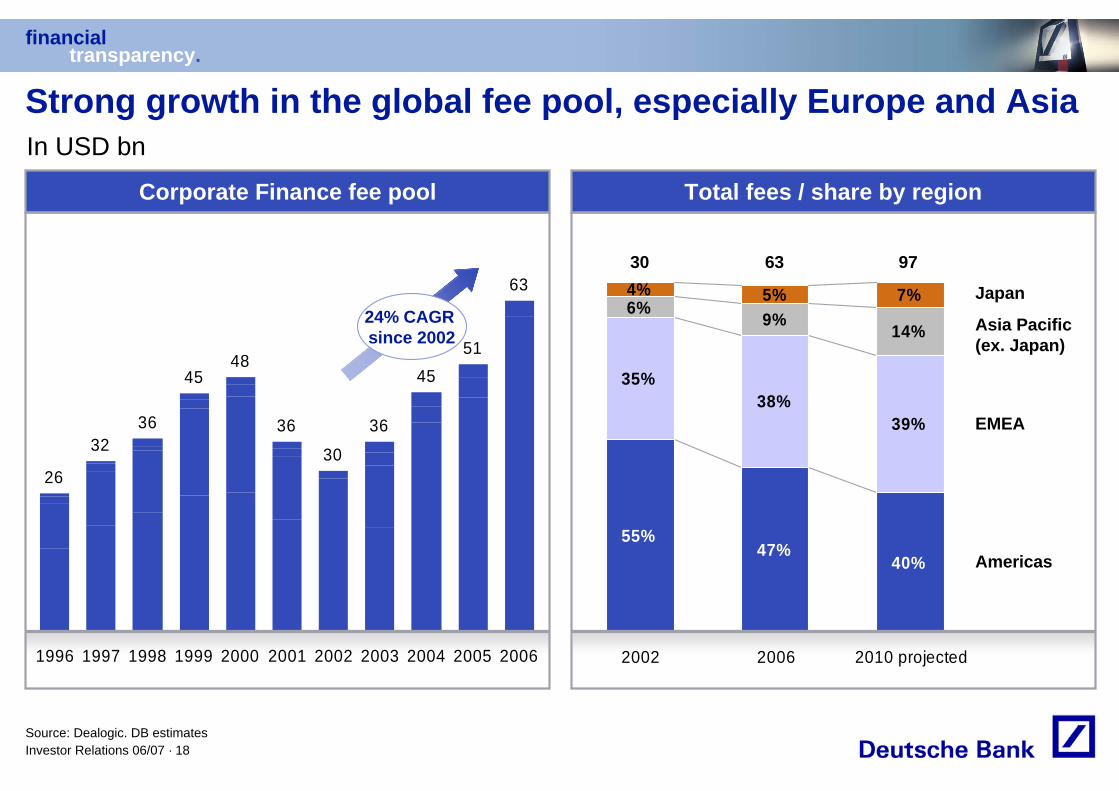
Total fees / share by regionCorporate Finance fee pool
Strong growth in the global fee pool, especially Europe and Asia
26
3236
4548
36
30
36
4551
63
1996 1997 1998 1999 2000 2001 2002 2003 2004 2005 2006
55%47%
40%
35%38%
39%
6% 9% 14%
4% 5% 7%
2002 2006 2010 projected
Americas
EMEA
Asia Pacific (ex. Japan)
Japan
63 97
In USD bn
Source: Dealogic. DB estimates
24% CAGR since 2002
30

financialtransparency.
Investor Relations 06/07 · 19
CAGR23%
Larger deals are driving the M&A market
1,105 1,015
1,944
1,344
2,530
2002 2003 2004 2005 2006
EUR 10 bn+
EUR 5 – 10 bn
EUR 1 – 5 bn
EUR 500 m – 1 bn
<EUR 500 m
81%
(16)%
27%
54%
4%
Growth2006 vs 2005
Deal size
Global M&A announced volumeIn EUR bn
Source: Dealogic. M&A announced volumes

financialtransparency.
Investor Relations 06/07 · 20
Powerful drivers of M&A growth
0
100
200
300
400
500
600
700
2003 2004 2005 2006-1%
1%
3%
5%
7%
9%
11%
13%
15%
17%
FS buyout volume (lhs)% of total M&A volume (rhs)
Rising Financial Sponsor activity
0
50
100
150
200
250
300
2003 2004 2005 2006
Asia
Americas
EMEA
Explosive growth in LBO volume
In USD bn
Announced volume
Source: Dealogic

financialtransparency.
Investor Relations 06/07 · 21
Private Equity purchasing power exceeds $1 trillion
199144
119173
475522
278
432
2001 2002 2003 2004 2005 2006 2007E 2008E
ROW
Europe
Americas
Private Equity funds raised
In USD bn
Source: Private Equity Intelligence

financialtransparency.
Investor Relations 06/07 · 22
Strong competitive position in a significant market
Underweight position and/or significant planned investment
Global Banking strategic positioning
= 100% approximate % of total market
= 100% approximate % of total market
Source: Dealogic, Deloitte Consulting, DB Analysis
OverweightIn-lineUnderweight
Prod
ucts
Clie
nts
Reg
ions
Leverage FinanceCommercial Real EstateGTB – Europe
M&A – EMEAECM – EMEAInvestment Grade BondsGTB – APAC
ECM – AmericasM&A – AmericasGTB – Americas
Financial SponsorsLarge-cap Corporates –EMEAMid-cap Corporates
Large-cap Corporates –AmericasFinancial Institutions
Asia PacificNorth AmericaJapan
Western EuropeCEEMA
40%10%50%
---
10%55% 35%

financialtransparency.
Investor Relations 06/07 · 23
24%CAGR
Deutsche Bank 1Q2007 rank & share
Deutsche Bank is a leading banker to Financial Sponsors
9.510.5
5.6
8.4
2003 2004 2005 2006
Global Financial Sponsors fee pool
7.8%
5.3%
Corporate Financetotal
Financial Sponsors
In EUR bn
#8
#3
Source: Dealogic

financialtransparency.
Investor Relations 06/07 · 24
Corporate Finance – the road to sustainable Top 5
#6 #7
Top 5
0%
1%
2%
3%
4%
5%
6%
2005 2006 Target
Sustainable Grow market share in Americas profitably
Build out emerging markets to capture growth and to mitigate margin erosion
Coverage intensity aligned to new Deutsche Bank client tiering system
Further collaboration between Global Markets and Global Banking
Focus on Global Products
Fee pool market share, in %
Goal Strategy
1
2
3
4
5
Source: Global Banking Business Planning and Development; Dealogic

financialtransparency.
Investor Relations 06/07 · 25
60%
65%
70%
75%
80%
85%
90%
95%
2003 2004 2005 2006 1Q2007
GTB: outstanding progress
BNP Paribas
Citigroup
JPMorgan Chase
Société Générale
Outstanding profit growth Cost efficiency among best in class
181 214
228 254
433
705
2003 2004 2005 2006 1Q2007
CAGR46%
1st quarter
*
18%
Net income before income taxes, in EUR m Cost / income ratio
*
* Excludes gain on sale of Global Securities Services (EUR 583 m) in 2003Note: Deutsche Bank numbers for 2003 to 2005 based on U.S. GAAP, from 2006 onwards based on IFRSSource: Company data

financialtransparency.
Investor Relations 06/07 · 26
Leadership in key products
Product
Euro clearing(1)
USD clearing(2)
Trustee for US Asset & Mortgage Backed Securities(4)
Export LCs Germany(3)
US Debt (all) Trustee(5)
Trade Finance Loans(6)
Rank Market share
1 17%
5 8%
2 22%
1 23%
2 13%
2 7%
(1) Bundesbank: RTGS+/Target (as of December 2006) (2) Clearing House Interbank Payment System (CHIPS), (December 2006)(3) S.W.I.F.T. (December 2006) (4) Asset Backed Alert (FY, 2006) (5) Thomson Financial (3Q, 2006) (6) Dealogic (1 Jan – 30 Sept 2006)

financialtransparency.
Investor Relations 06/07 · 27
705
EUR 1 bn
228* 254
433
2003 2004 2005 2006 Goal 2008
GTB – the road to EUR 1 billion
Goal Strategy
More organic topline growth – focus on Europe
Continued cost discipline
Benefit from restructured Asian business
Build out other emerging markets
Bolt-on acquisitions
More cooperation with Corporate Finance, Global Markets and Private Clients and Asset Management
1
2
3
4
5
6
Income before income taxes, in EUR m
* Excludes gain on sale of Global Securities Services (EUR 583 m)Note: 2003 to 2005 based on U.S. GAAP, from 2006 onwards based on IFRS

financialtransparency.
Investor Relations 06/07 · 28
In summary: Global Banking is well positioned to deliver
Global Transaction Banking
Achieve EUR 1 billion pre-tax profit in 2008
Corporate Finance Become top 5 globally by fee league tables and profitability
Strength in fast-growing regions (Europe, CEEMEA, Non-Japan Asia)Market sweet spots (Financial sponsors, commercial real estate, leverage finance)Significant build in US platform
Strong earnings growth momentumBest-in-class cost efficiencyLeadership in key businesses (Clearing, Trade Finance, ABS Trustee)

financialtransparency.
Investor Relations 06/07 · 29
Cautionary statementsUnless otherwise indicated, the financial information provided herein has been prepared under the International Financial Reporting Standards (IFRS). It may be subject to adjustments based on the preparation of the full set of financial statements for 2007. The segment information is based on IFRS 8: ‘Operating Segments’. IFRS 8, whilst approved by the International Accounting Standards Board (IASB), has yet to be endorsed by the European Union.
This presentation also contains forward-looking statements. Forward-looking statements are statements that are not historical facts; they include statements about our beliefs and expectations and the assumptions underlying them. These statements are based on plans, estimates and projections as they are currently available to the management of Deutsche Bank. Forward-looking statements therefore speak only as of the date they are made, and we undertake no obligation to update publicly any of them in light of new information or future events.
By their very nature, forward-looking statements involve risks and uncertainties. A number of important factors could therefore cause actual results to differ materially from those contained in any forward-looking statement. Such factors include the conditions in the financial markets in Germany, in Europe, in the United States and elsewhere from which we derive a substantial portion of our trading revenues, potential defaults of borrowers or trading counterparties, the implementation of our management agenda, the reliability of our risk management policies, procedures and methods, and other risks referenced in our filings with the U.S. Securities and Exchange Commission. Such factors are described in detail in our SEC Form 20-F of 27 March 2007 on pages 9 through 15 under the heading "Risk Factors." Copies of this document are readily available upon request or can be downloaded from www.deutsche-bank.com/ir.
This presentation contains non-IFRS financial measures. For a reconciliation to directly comparable figures reported under IFRS refer to the 1Q2007 Financial Data Supplement, which is accompanying this presentation and available on our Investor Relations website at www.deutsche-bank.com/ir.