deutsche telekom cmd 2015 - tmus
TRANSCRIPT
DEUTSCHE TELEKOM CAPITAL MARKETS DAY 2015Bonn, February 26/27, 2015
Group STRATEGY Cost and Portfolio Transformation Lead in business Superior Production Model Europe Germany T-Mobile USA Finance
SAFE HARBOR STATEMENT
This presentation contains “forward-looking” statements within the meaning of the U.S. federal securities laws. For those statements, we claim the protectionof the safe harbor for forward-looking statements contained in the Private Securities Litigation Reform Act of 1995. Any statements made herein that are notstatements of historical fact, including statements about T-Mobile US, Inc.'s plans, outlook, beliefs, opinions, projections, guidance, strategy, integration ofMetroPCS, expected network modernization and other advancements, are forward-looking statements. Generally, forward-looking statements may beidentified by words such as “anticipate,” “expect,” “suggests,” “plan,” “project,” “believe,” “intend,” “estimates,” “targets,” “views,” “may,” “will,” “forecast,” andother similar expressions. The forward-looking statements speak only as of the date made, are based on current assumptions and expectations, and involvea number of risks and uncertainties. Important factors that could affect future results and cause those results to differ materially from those expressed in theforward-looking statements include, among others, the following: our ability to compete in the highly competitive U.S. wireless telecommunications industry;adverse conditions in the U.S. and international economies and markets; significant capital commitments and the capital expenditures required to effect ourbusiness plan; our ability to adapt to future changes in technology, enhance existing offerings, and introduce new offerings to address customers' changingdemands; changes in legal and regulatory requirements, including any change or increase in restrictions on our ability to operate our network; our ability tosuccessfully maintain and improve our network, and the possibility of incurring additional costs in doing so; major equipment failures; severe weatherconditions or other force majeure events; and other risks described in our filings with the Securities and Exchange Commission, including those described inour Annual Report on Form 10-K filed with the Securities and Exchange Commission on February 19, 2015. You should not place undue reliance on theseforward-looking statements. We do not undertake to update forward-looking statements, whether as a result of new information, future events or otherwise,except as required by law.
As required by SEC rules, we have provided a reconciliation of the non-GAAP financial measures included in this presentation to the most directlycomparable GAAP measures in materials on our website at http://investor.t-mobile.com.
2
Group STRATEGY Cost and Portfolio Transformation Lead in business Superior Production Model Europe Germany T-Mobile USA Finance
T-MOBILE US
3
Group STRATEGY Cost and Portfolio Transformation Lead in business Superior Production Model Europe Germany T-Mobile USA Finance
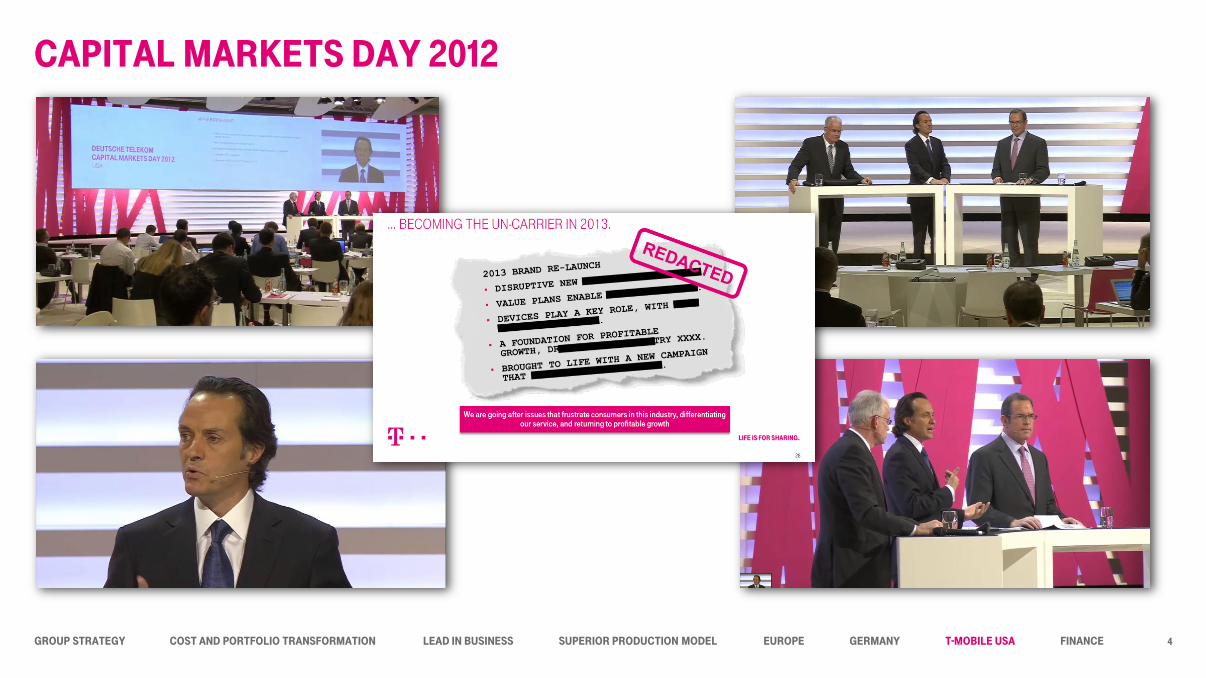
CAPITAL MARKETS DAY 2012
4
Group STRATEGY Cost and Portfolio Transformation Lead in business Superior Production Model Europe Germany T-Mobile USA Finance
KEY MESSAGES
The Un-carrier revolution continues! 2014 was the best customer growth year in T-Mobile US history. 4.0 million branded postpaid phone nets – captured virtually all of industry growth; 55M total customers year-end
We are the leader in prepaid with over 16.3 million customers, adding 1.2 million customers for the full year 2014, again the most in the industry. 55 MetroPCS markets, up from 15
Strong execution of MetroPCS integration, expected almost 2 years ahead of original schedule – Synergies expected to be $9–10 billion NPV, up from original $6–7 billion
Our customer growth translating into strong financial performance. Service revenue growth 9% YoY, Adj. EBITDA 6.0% YoY in 2014. Significant Step-Up in Adj EBITDA in 2015 – approx. 25% YoY increase
We will level the network coverage playing field in 2015 by expanding our blazing fast 4G LTE network to 300M POPs, up from 0 in Q1 2013. Plan on covering more than150 markets with wideband LTE
-carrierUn
5
Group STRATEGY Cost and Portfolio Transformation Lead in business Superior Production Model Europe Germany T-Mobile USA Finance
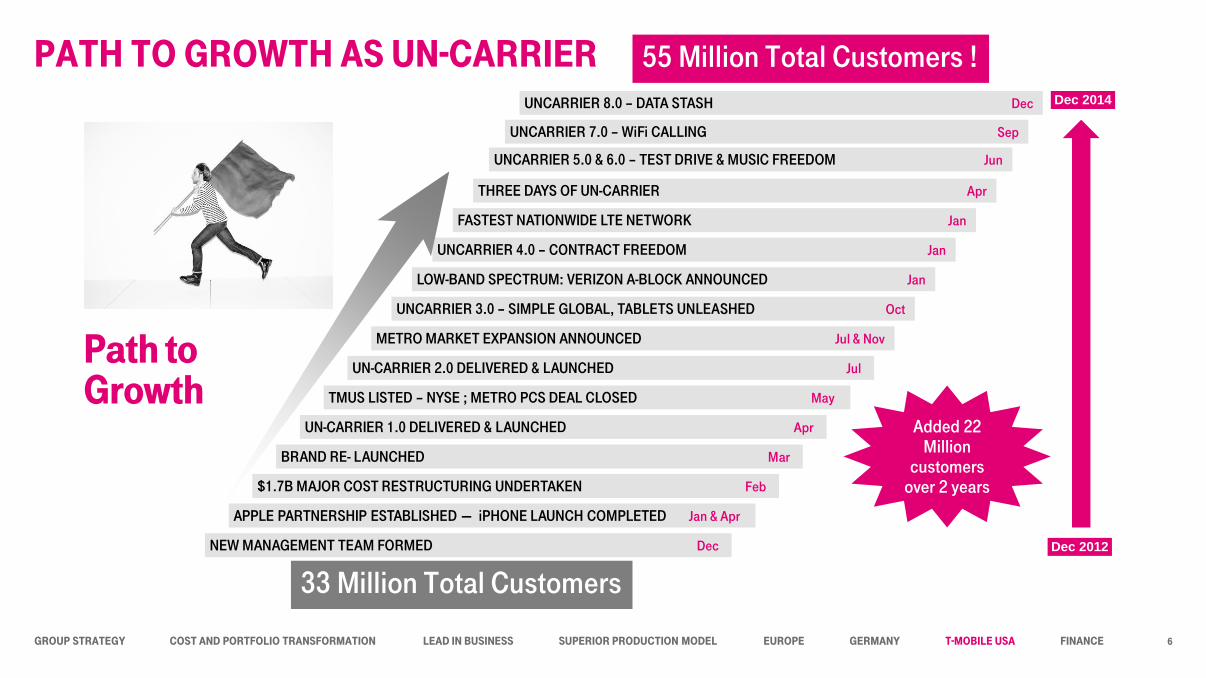
PATH TO GROWTH AS UN-CARRIER
UN-CARRIER 2.0 DELIVERED & LAUNCHED Jul
APPLE PARTNERSHIP ESTABLISHED — iPHONE LAUNCH COMPLETED Jan & Apr
$1.7B MAJOR COST RESTRUCTURING UNDERTAKEN Feb
TMUS LISTED – NYSE ; METRO PCS DEAL CLOSED May
UN-CARRIER 1.0 DELIVERED & LAUNCHED Apr
BRAND RE- LAUNCHED Mar
METRO MARKET EXPANSION ANNOUNCED Jul & Nov
Dec 2014
Path to Growth
Dec 2012
UNCARRIER 3.0 – SIMPLE GLOBAL, TABLETS UNLEASHED Oct
UNCARRIER 4.0 – CONTRACT FREEDOM Jan
FASTEST NATIONWIDE LTE NETWORK Jan
LOW-BAND SPECTRUM: VERIZON A-BLOCK ANNOUNCED Jan
NEW MANAGEMENT TEAM FORMED Dec
THREE DAYS OF UN-CARRIER Apr
UNCARRIER 5.0 & 6.0 – TEST DRIVE & MUSIC FREEDOM Jun
55 Million Total Customers !
UNCARRIER 7.0 – WiFi CALLING Sep
UNCARRIER 8.0 – DATA STASH Dec
33 Million Total Customers
Added 22 Million
customers over 2 years
6
Group STRATEGY Cost and Portfolio Transformation Lead in business Superior Production Model Europe Germany T-Mobile USA Finance
-10%
-5%
0%
5%
10%
15%
1Q13 2Q13 3Q13 4Q13 1Q14 2Q14 3Q14 4Q14
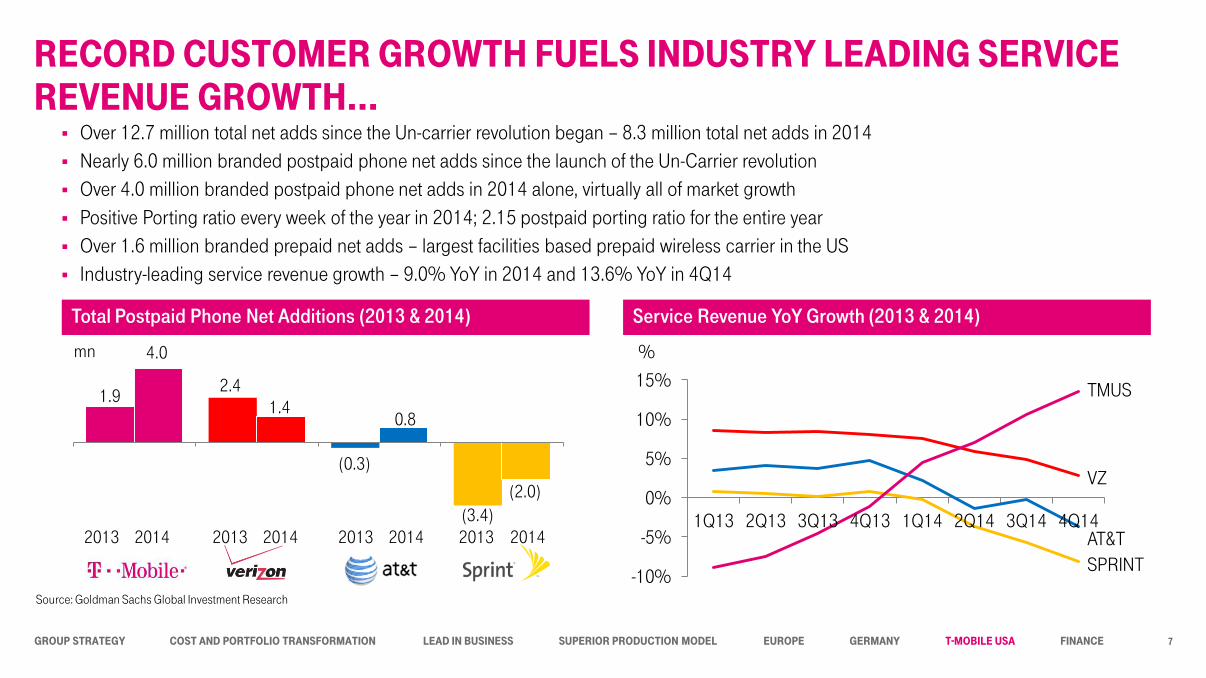
RECORD CUSTOMER GROWTH FUELS INDUSTRY LEADING SERVICE REVENUE GROWTH…
Total Postpaid Phone Net Additions (2013 & 2014)
Over 12.7 million total net adds since the Un-carrier revolution began – 8.3 million total net adds in 2014
Nearly 6.0 million branded postpaid phone net adds since the launch of the Un-Carrier revolution
Over 4.0 million branded postpaid phone net adds in 2014 alone, virtually all of market growth
Positive Porting ratio every week of the year in 2014; 2.15 postpaid porting ratio for the entire year
Over 1.6 million branded prepaid net adds – largest facilities based prepaid wireless carrier in the US
Industry-leading service revenue growth – 9.0% YoY in 2014 and 13.6% YoY in 4Q14
%
Source: Goldman Sachs Global Investment Research
Service Revenue YoY Growth (2013 & 2014)
TMUS
VZ
AT&T
SPRINT
2013 2014 2013 2014 2013 2014 2013 2014
1.9
4.0
2.41.4
(0.3)
0.8
(3.4)
(2.0)
mn
7
Group STRATEGY Cost and Portfolio Transformation Lead in business Superior Production Model Europe Germany T-Mobile USA Finance
Q1 Q2 Q3 Q4 Q1 Q2 Q3 Q4
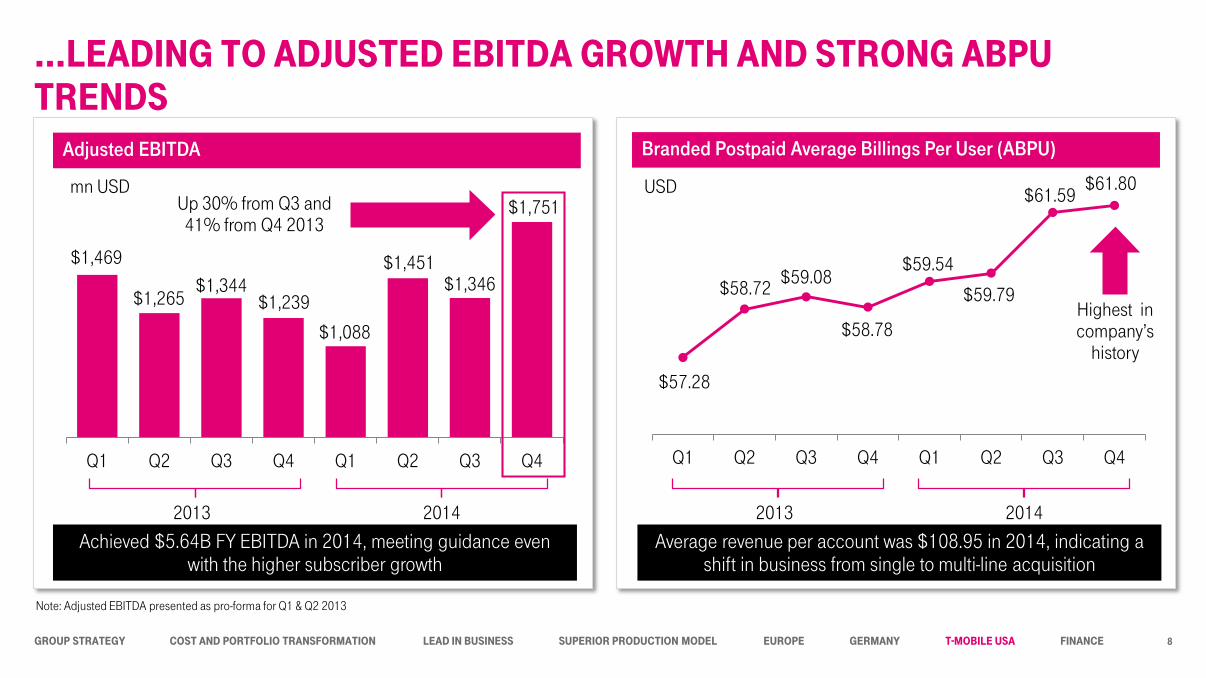
…LEADING TO ADJUSTED EBITDA GROWTH AND STRONG ABPU TRENDS
Branded Postpaid Average Billings Per User (ABPU)Adjusted EBITDA
$1,265
$1,469
$1,344$1,239
$1,088
$1,451$1,346
$1,751Up 30% from Q3 and 41% from Q4 2013
Q1 Q2 Q3 Q4 Q1 Q2 Q3 Q4
2013
$57.28
$58.72$59.08
$58.78
$59.54
$59.79
$61.59$61.80
Highest incompany’s
history
USDmn USD
2014 2013 2014
Note: Adjusted EBITDA presented as pro-forma for Q1 & Q2 2013
Achieved $5.64B FY EBITDA in 2014, meeting guidance even with the higher subscriber growth
Average revenue per account was $108.95 in 2014, indicating a shift in business from single to multi-line acquisition
8

Group STRATEGY Cost and Portfolio Transformation Lead in business Superior Production Model Europe Germany T-Mobile USA Finance
Strategy 2015–2016
9
Group STRATEGY Cost and Portfolio Transformation Lead in business Superior Production Model Europe Germany T-Mobile USA Finance
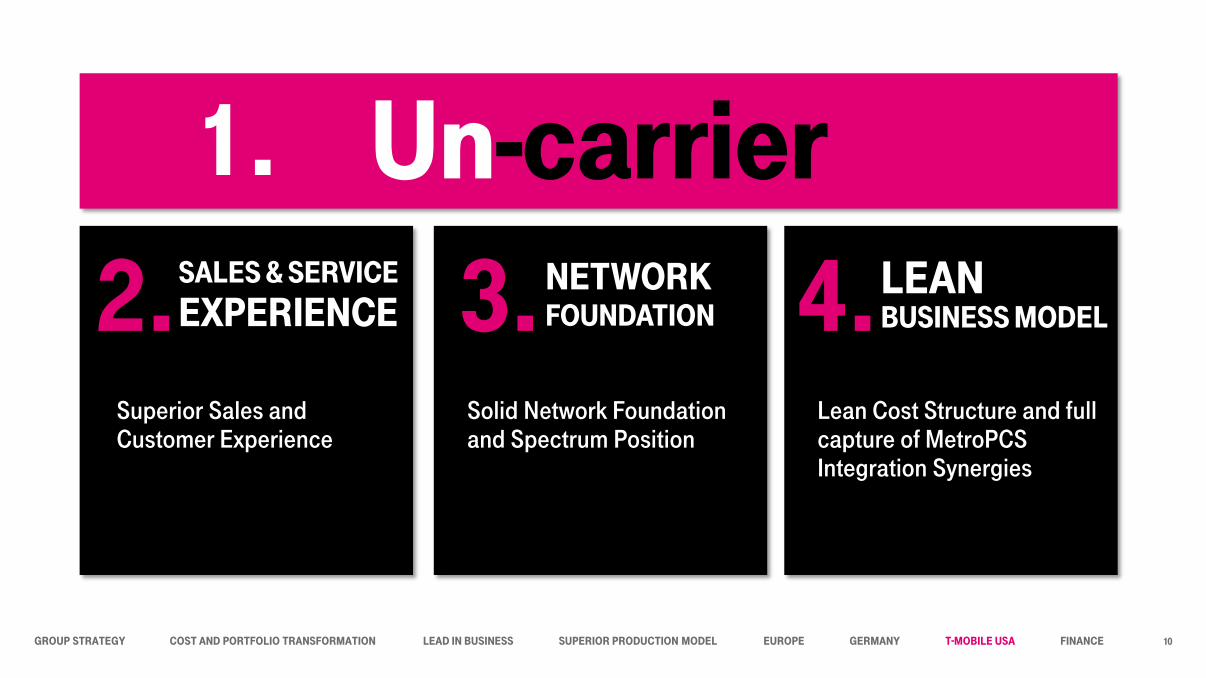
Un-carrier
Solid Network Foundation and Spectrum Position
Superior Sales and Customer Experience
Lean Cost Structure and full capture of MetroPCSIntegration Synergies
NETWORKFOUNDATION
SALES & SERVICE
EXPERIENCELEAN BUSINESS MODEL2. 3. 4.
1.
10
Group STRATEGY Cost and Portfolio Transformation Lead in business Superior Production Model Europe Germany T-Mobile USA Finance
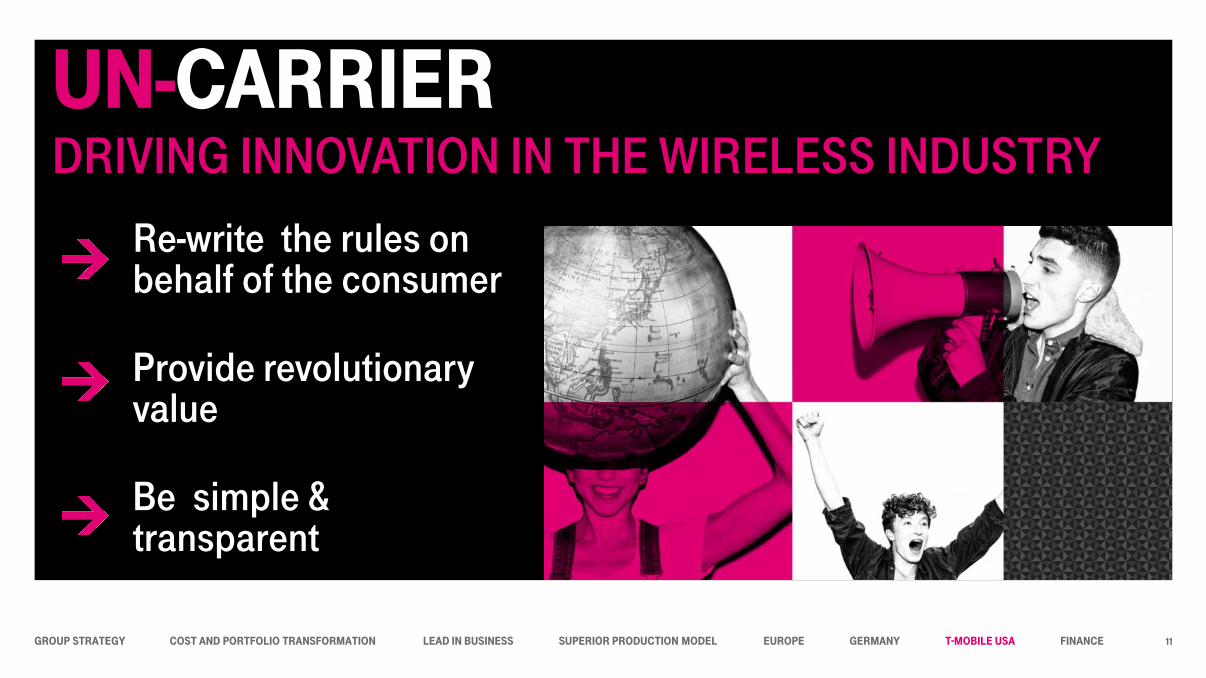
UN-CARRIERDRIVING INNOVATION IN THE WIRELESS INDUSTRY
Re-write the rules on behalf of the consumer
Provide revolutionary value
Be simple & transparent
11
Group STRATEGY Cost and Portfolio Transformation Lead in business Superior Production Model Europe Germany T-Mobile USA Finance
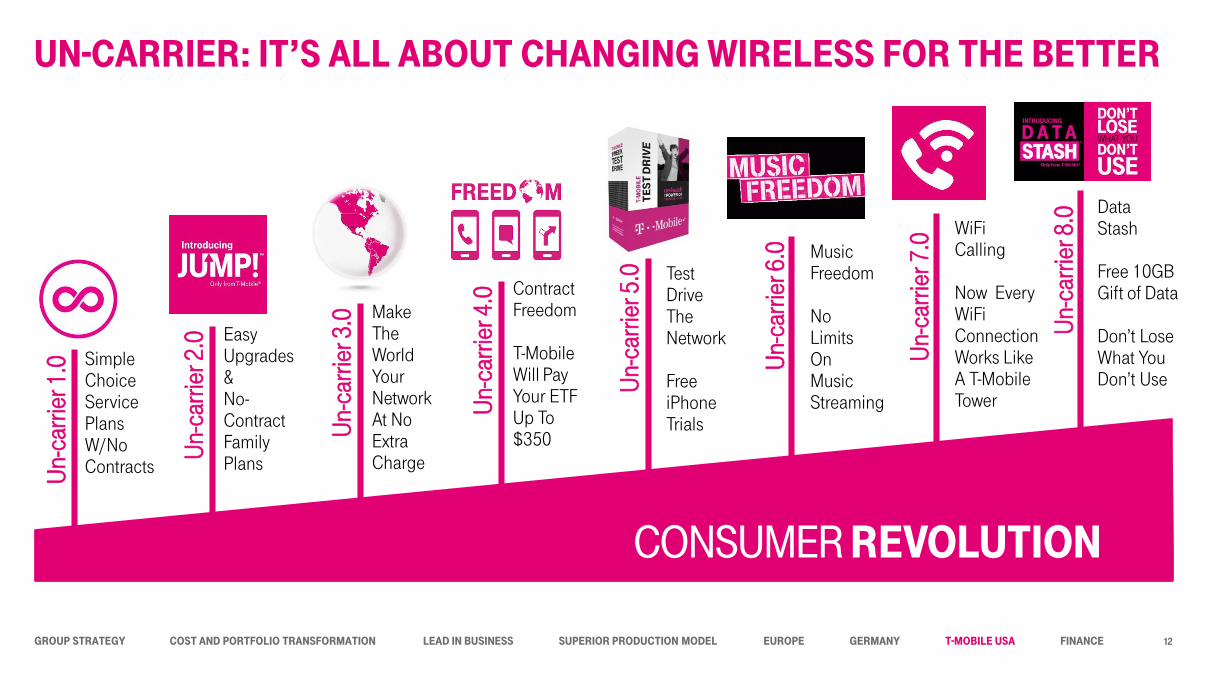
UN-CARRIER: IT’S ALL ABOUT CHANGING WIRELESS FOR THE BETTERU
n-ca
rrie
r 1.0
Un-
carr
ier 2
.0
Un-
carr
ier 3
.0
Un-
carr
ier 4
.0
Un-
carr
ier 5
.0
Un-
carr
ier 6
.0
Un-
carr
ier 7
.0
Un-
carr
ier 8
.0
CONSUMER REVOLUTION
SimpleChoiceServicePlansW/NoContracts
Easy Upgrades&No-ContractFamilyPlans
MakeTheWorldYourNetworkAt NoExtraCharge
ContractFreedom
T-MobileWill PayYour ETFUp To$350
TestDriveThe Network
FreeiPhoneTrials
Music Freedom
NoLimitsOn MusicStreaming
WiFiCalling
Now EveryWiFiConnectionWorks LikeA T-MobileTower
DataStash
Free 10GBGift of Data
Don’t LoseWhat YouDon’t Use
12
Group STRATEGY Cost and Portfolio Transformation Lead in business Superior Production Model Europe Germany T-Mobile USA Finance
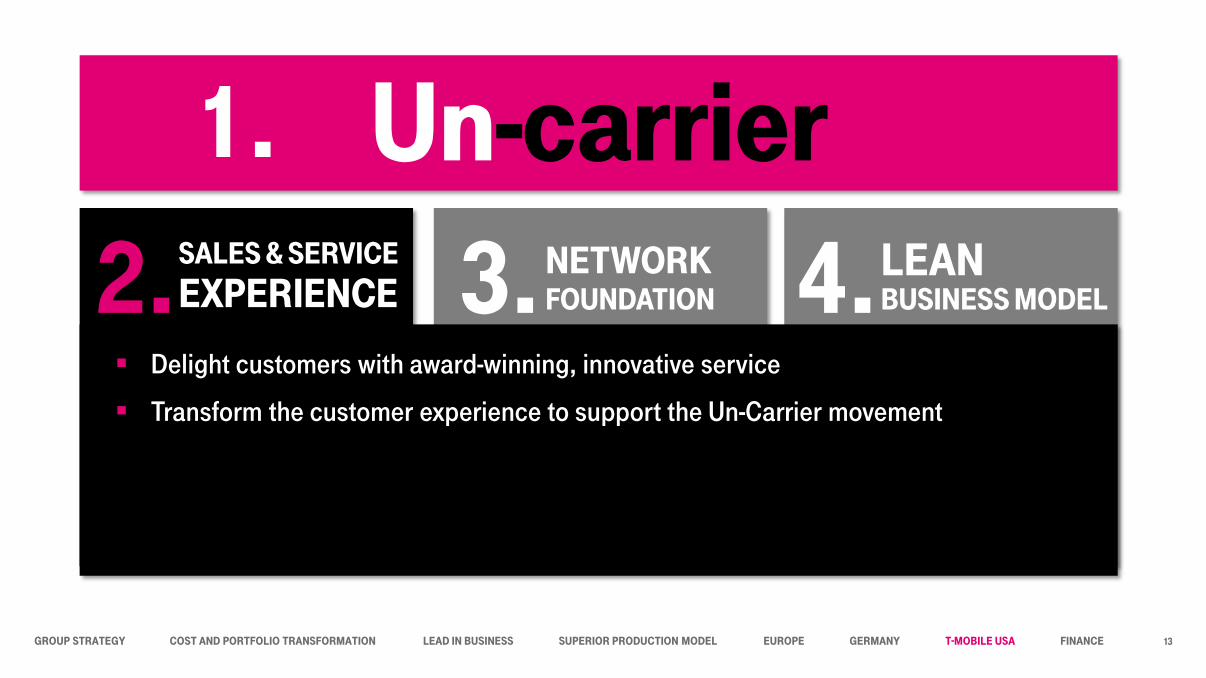
Un-carrierLEAN BUSINESS MODEL4.
1.
Delight customers with award-winning, innovative service
Transform the customer experience to support the Un-Carrier movement
NETWORKFOUNDATION
SALES & SERVICE
EXPERIENCE2. 3.
13
Group STRATEGY Cost and Portfolio Transformation Lead in business Superior Production Model Europe Germany T-Mobile USA Finance
Un-carrierLEAN BUSINESS MODEL4.
1.
Level the competitive playing field from a coverage perspective
Provide fast speed despite explosive data usage growth, by leveraging robust position in mid-band
Achieve results while keeping costs under control
Continue leadership in network innovation (e.g. VoLTE, WiFi calling, LAA)
NETWORKFOUNDATION
SALES & SERVICE
EXPERIENCE2. 3.
14
Group STRATEGY Cost and Portfolio Transformation Lead in business Superior Production Model Europe Germany T-Mobile USA Finance
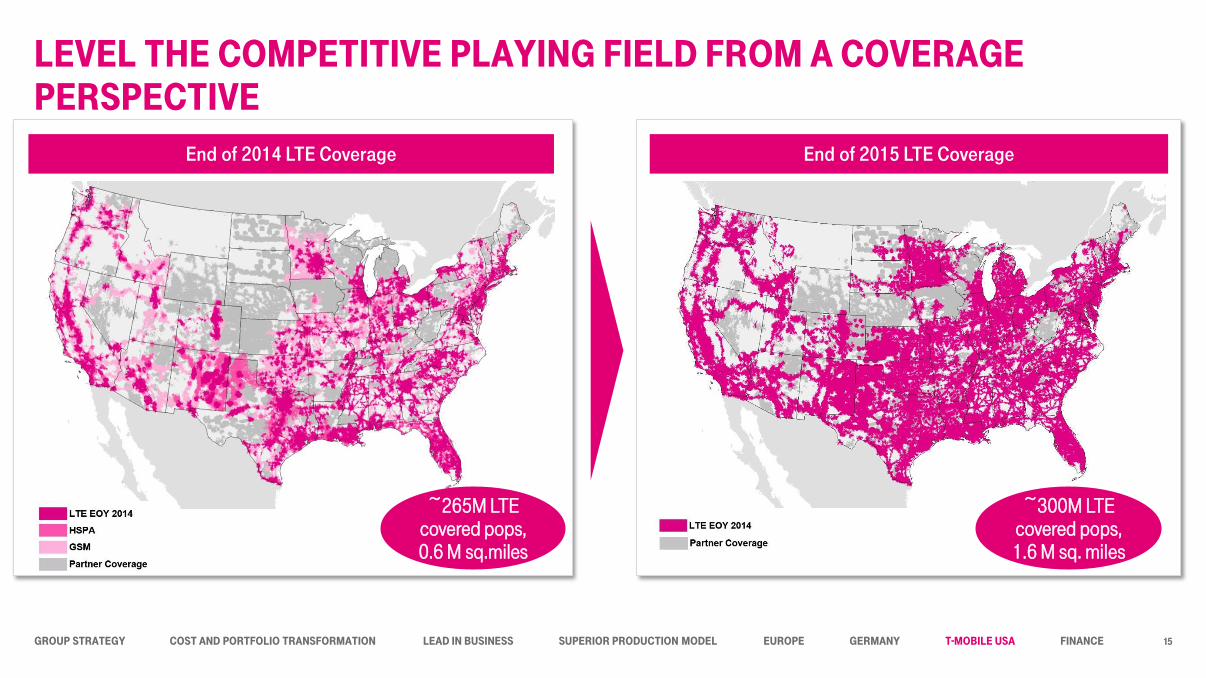
LEVEL THE COMPETITIVE PLAYING FIELD FROM A COVERAGE PERSPECTIVE
End of 2014 LTE Coverage End of 2015 LTE Coverage
~265M LTE covered pops, 0.6 M sq.miles
~300M LTE covered pops, 1.6 M sq. miles
15
Group STRATEGY Cost and Portfolio Transformation Lead in business Superior Production Model Europe Germany T-Mobile USA Finance
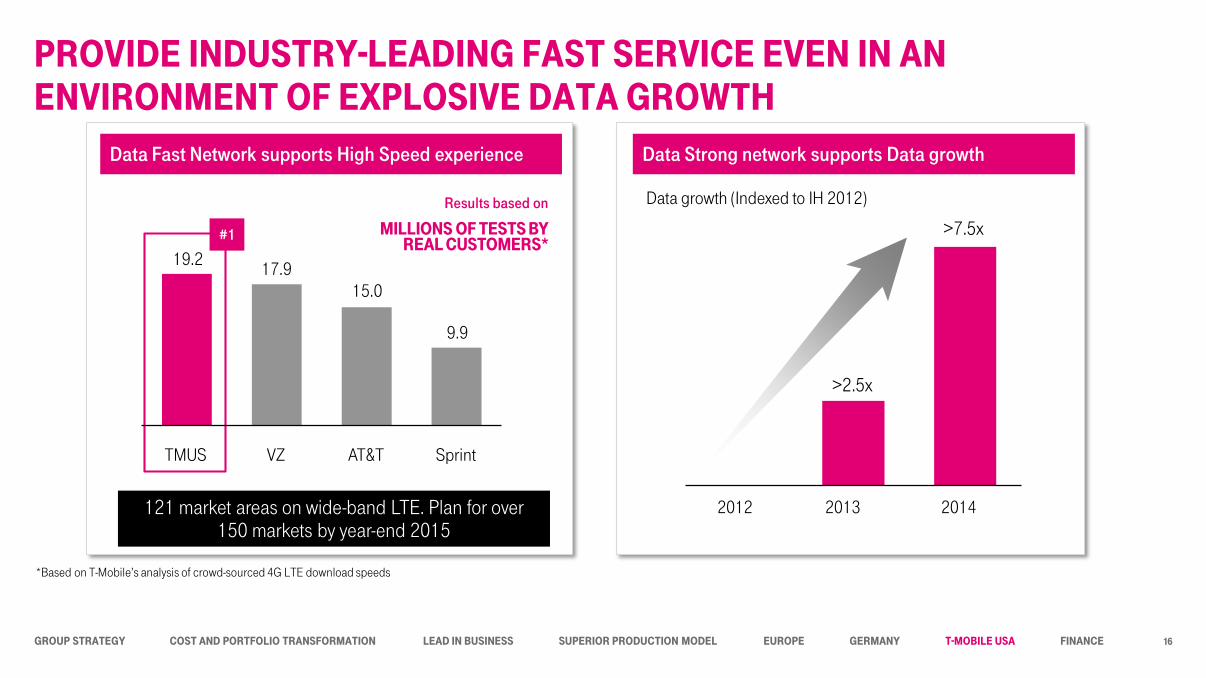
PROVIDE INDUSTRY-LEADING FAST SERVICE EVEN IN AN ENVIRONMENT OF EXPLOSIVE DATA GROWTH
#1
Data Strong network supports Data growthData Fast Network supports High Speed experience
>2.5x
>7.5x
19.217.9
15.0
9.9
VZ AT&T SprintTMUS
Data growth (Indexed to IH 2012)
2012 2013 2014
Results based on
MILLIONS OF TESTS BY REAL CUSTOMERS*
121 market areas on wide-band LTE. Plan for over 150 markets by year-end 2015
*Based on T-Mobile’s analysis of crowd-sourced 4G LTE download speeds
16
Group STRATEGY Cost and Portfolio Transformation Lead in business Superior Production Model Europe Germany T-Mobile USA Finance
T-Mobile AT&T Verizon Sprint
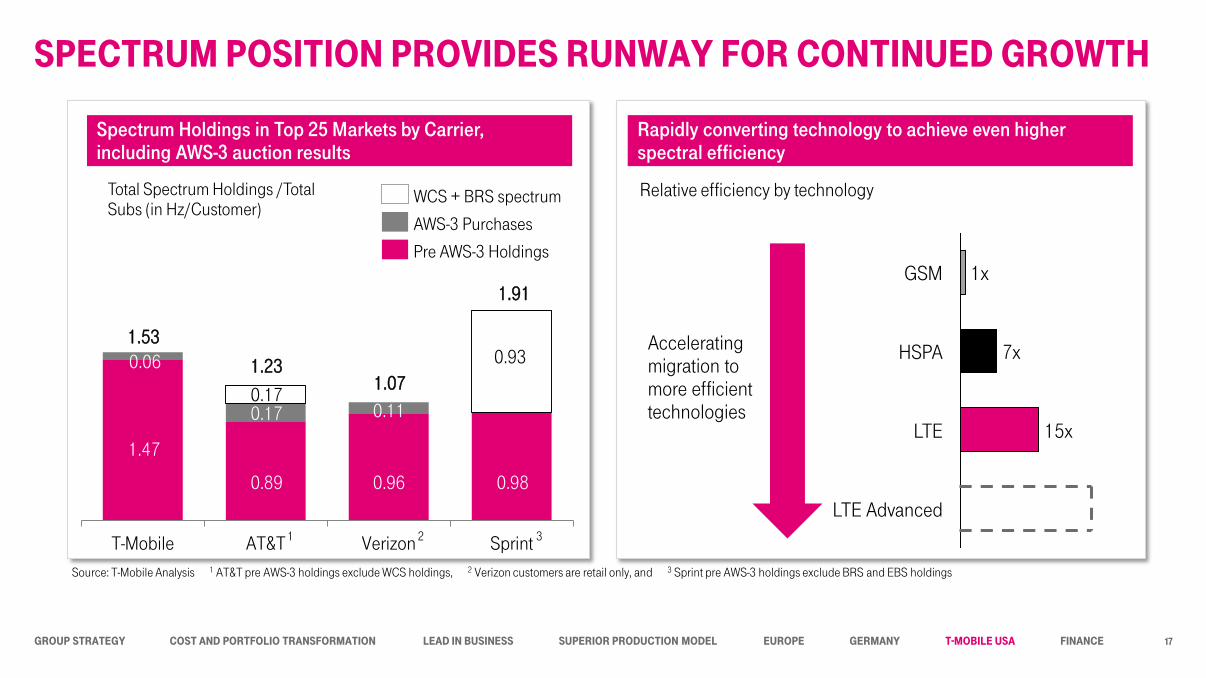
SPECTRUM POSITION PROVIDES RUNWAY FOR CONTINUED GROWTH
Spectrum Holdings in Top 25 Markets by Carrier, including AWS-3 auction results
1
Total Spectrum Holdings /Total Subs (in Hz/Customer)
Rapidly converting technology to achieve even higher spectral efficiency
LTE Advanced
LTE 15x
HSPA 7x
GSM 1x
Accelerating migration to more efficient technologies
Pre AWS-3 Holdings
WCS + BRS spectrum
AWS-3 Purchases
Relative efficiency by technology
1.47
0.89 0.96 0.98
1.53
1.231.07
1.91
0.06
0.17 0.110.17
0.93
2 3
Source: T-Mobile Analysis 1 AT&T pre AWS-3 holdings exclude WCS holdings, 2 Verizon customers are retail only, and 3 Sprint pre AWS-3 holdings exclude BRS and EBS holdings
17
Group STRATEGY Cost and Portfolio Transformation Lead in business Superior Production Model Europe Germany T-Mobile USA Finance
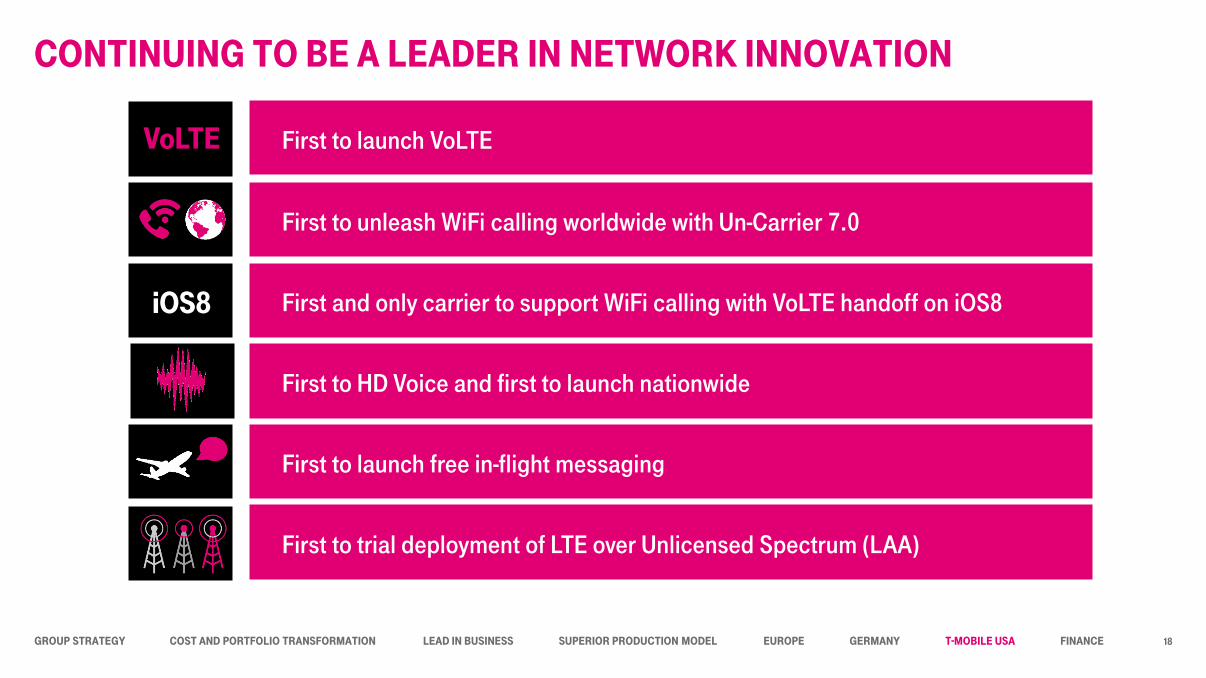
CONTINUING TO BE A LEADER IN NETWORK INNOVATION
First to trial deployment of LTE over Unlicensed Spectrum (LAA)
First to launch VoLTEVoLTE
First and only carrier to support WiFi calling with VoLTE handoff on iOS8iOS8
First to unleash WiFi calling worldwide with Un-Carrier 7.0
First to launch free in-flight messaging
First to HD Voice and first to launch nationwide
18
Group STRATEGY Cost and Portfolio Transformation Lead in business Superior Production Model Europe Germany T-Mobile USA Finance
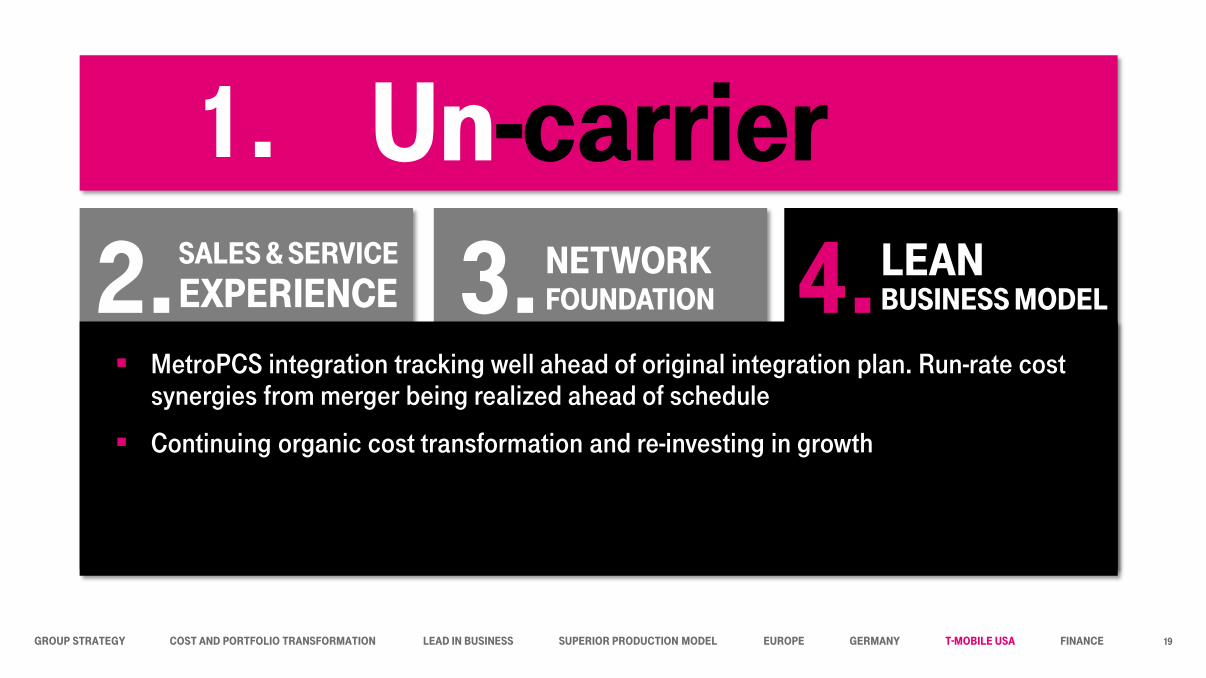
Un-carrierLEAN BUSINESS MODEL4.
1.
MetroPCS integration tracking well ahead of original integration plan. Run-rate cost synergies from merger being realized ahead of schedule
Continuing organic cost transformation and re-investing in growth
NETWORKFOUNDATION
SALES & SERVICE
EXPERIENCE2. 3.
19
Group STRATEGY Cost and Portfolio Transformation Lead in business Superior Production Model Europe Germany T-Mobile USA Finance
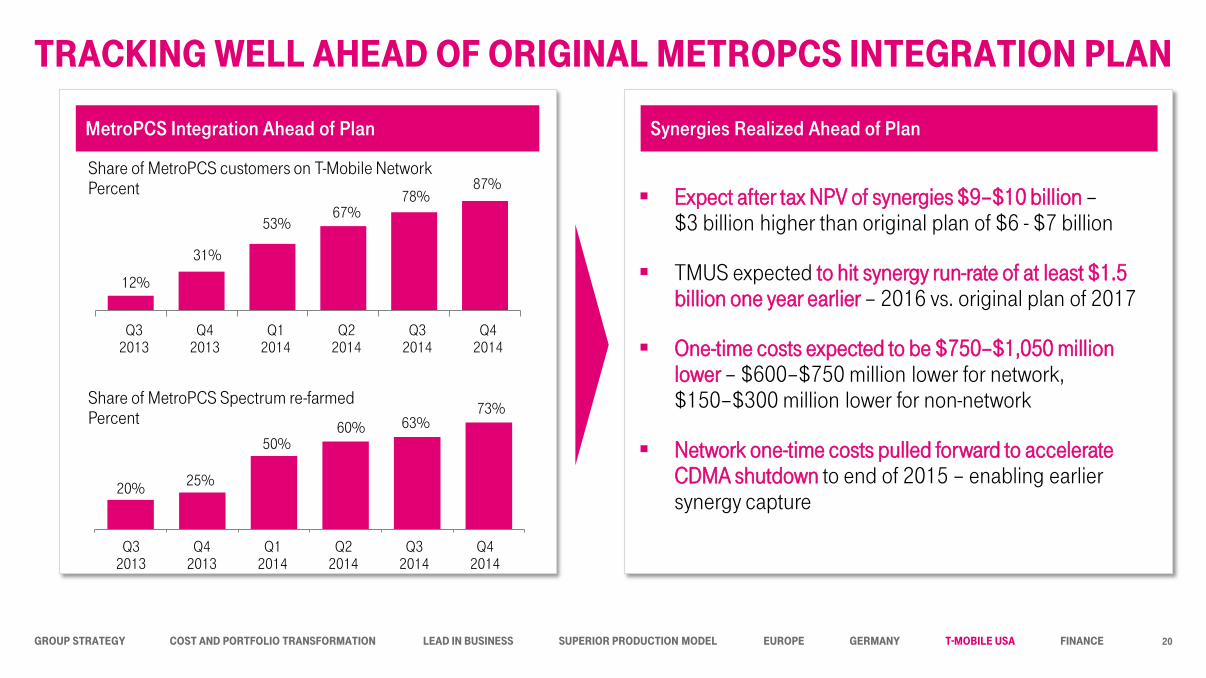
TRACKING WELL AHEAD OF ORIGINAL METROPCS INTEGRATION PLAN
Expect after tax NPV of synergies $9–$10 billion –$3 billion higher than original plan of $6 - $7 billion
TMUS expected to hit synergy run-rate of at least $1.5 billion one year earlier – 2016 vs. original plan of 2017
One-time costs expected to be $750–$1,050 million lower – $600–$750 million lower for network, $150–$300 million lower for non-network
Network one-time costs pulled forward to accelerate CDMA shutdown to end of 2015 – enabling earlier synergy capture
MetroPCS Integration Ahead of Plan Synergies Realized Ahead of Plan
Q32013
Q42013
Q12014
Q22014
Q32014
Q42014
12%
31%
53%67%
78%87%
Share of MetroPCS customers on T-Mobile NetworkPercent
Share of MetroPCS Spectrum re-farmedPercent
Q32013
Q42013
Q12014
Q22014
Q32014
Q42014
20%25%
50%60% 63%
73%
20
Group STRATEGY Cost and Portfolio Transformation Lead in business Superior Production Model Europe Germany T-Mobile USA Finance
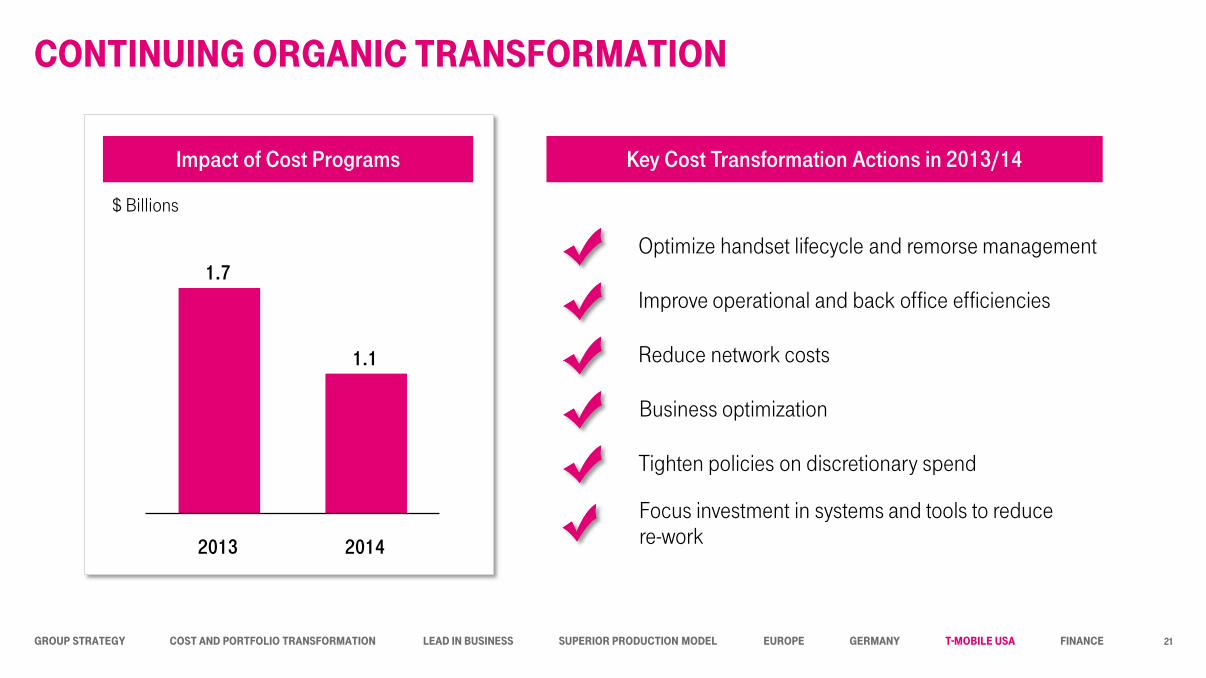
CONTINUING ORGANIC TRANSFORMATION
1.7
1.1
2013 2014
$ Billions
Key Cost Transformation Actions in 2013/14
Optimize handset lifecycle and remorse management
Reduce network costs
Improve operational and back office efficiencies
Tighten policies on discretionary spend
Focus investment in systems and tools to reduce re-work
Business optimization
Impact of Cost Programs
21

Group STRATEGY Cost and Portfolio Transformation Lead in business Superior Production Model Europe Germany T-Mobile USA Finance
2015 Guidance
22
Group STRATEGY Cost and Portfolio Transformation Lead in business Superior Production Model Europe Germany T-Mobile USA Finance
2014 2015
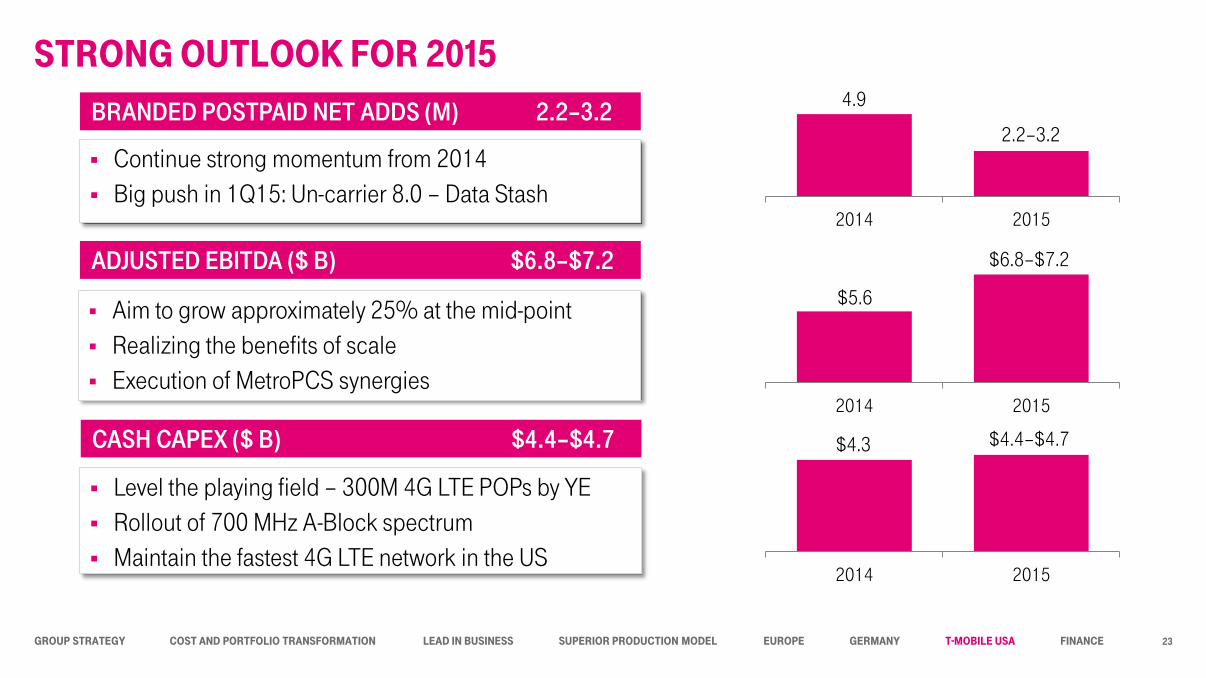
STRONG OUTLOOK FOR 2015
BRANDED POSTPAID NET ADDS (M) 2.2–3.2
Continue strong momentum from 2014
Big push in 1Q15: Un-carrier 8.0 – Data Stash
Aim to grow approximately 25% at the mid-point
Realizing the benefits of scale
Execution of MetroPCS synergies
Level the playing field – 300M 4G LTE POPs by YE
Rollout of 700 MHz A-Block spectrum
Maintain the fastest 4G LTE network in the US
4.9
2.2–3.2
ADJUSTED EBITDA ($ B) $6.8–$7.2
CASH CAPEX ($ B) $4.4–$4.7
2014 2015
$5.6
$6.8–$7.2
2014 2015
$4.3 $4.4–$4.7
23
Group STRATEGY Cost and Portfolio Transformation Lead in business Superior Production Model Europe Germany T-Mobile USA Finance
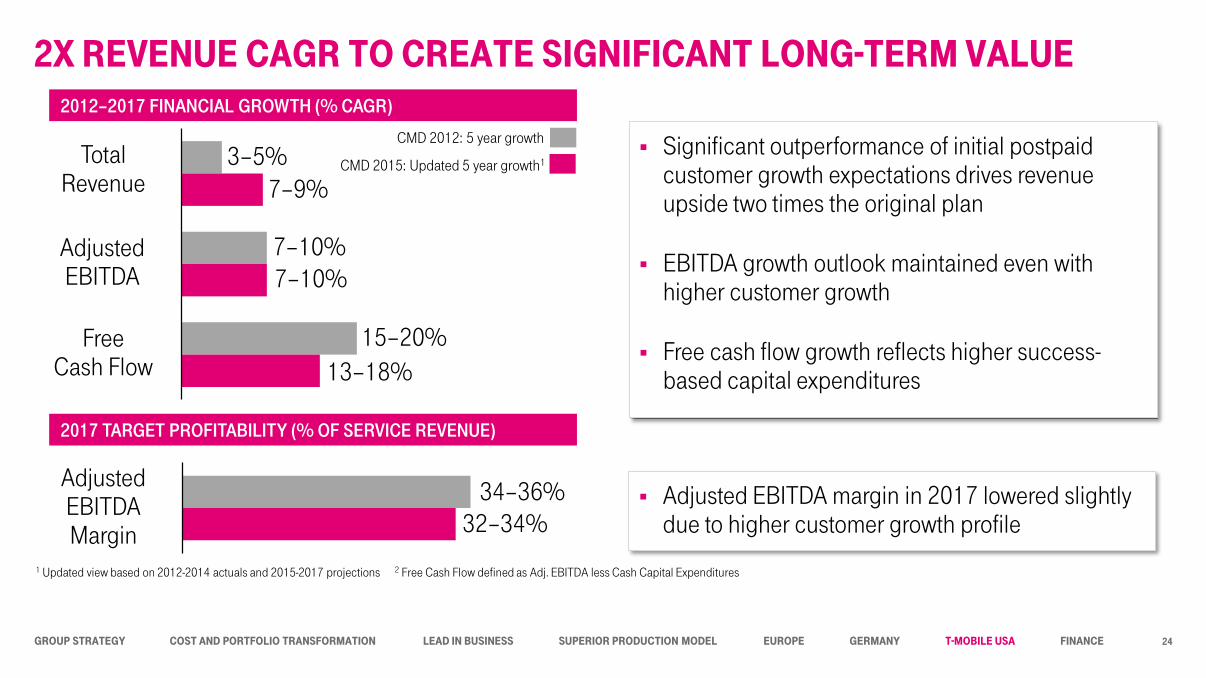
2X REVENUE CAGR TO CREATE SIGNIFICANT LONG-TERM VALUE2012–2017 FINANCIAL GROWTH (% CAGR)
TotalRevenue
AdjustedEBITDA
FreeCash Flow
3–5%7–9%
7–10%7–10%
15–20%
13–18%
2017 TARGET PROFITABILITY (% OF SERVICE REVENUE)
AdjustedEBITDAMargin
34–36%32–34%
CMD 2015: Updated 5 year growth1
CMD 2012: 5 year growth Significant outperformance of initial postpaid
customer growth expectations drives revenue upside two times the original plan
EBITDA growth outlook maintained even with higher customer growth
Free cash flow growth reflects higher success-based capital expenditures
Adjusted EBITDA margin in 2017 lowered slightly due to higher customer growth profile
1 Updated view based on 2012-2014 actuals and 2015-2017 projections 2 Free Cash Flow defined as Adj. EBITDA less Cash Capital Expenditures
24