developing a carbon offset fund for lewisham · pdf filedeveloping a carbon offset fund for...
TRANSCRIPT

Developing a carbon offset fund for Lewisham A report for the London Borough of Lewisham by AECOM
June 2013

Prepared by: Michael Henderson / Matt Turner ......... Checked by: Michael Henderson ............................... Approved by: Miles Attenborough ...............................
Rev No Comments Checked by Approved by
Date
1 Draft final MH MA April 2013 2 Final draft MH MA June 2013
Telephone: +442030092100 Website: www.aecom.com Job No 08/02/2013

Contents
1 Executive Summary ...................................................................................................................... 5
2 Background ................................................................................................................................ 15 2.1 What is a carbon offset fund? ................................................................................................ 15 2.2 Key principles for consideration ............................................................................................ 15 2.3 Developing a locally appropriate solution ............................................................................. 20 2.4 Method statement and limitations ........................................................................................ 20
3 Predicting residual emissions in Lewisham ................................................................................. 25 3.1 Introduction ........................................................................................................................... 25 3.2 Developing growth projects ................................................................................................... 25 3.3 Building performance requirements ...................................................................................... 26 3.4 Future Policy scenarios .......................................................................................................... 32 3.5 Calculating the residual carbon emission required for offsetting ......................................... 33
4 A measures based approach to calculate the cost of carbon ...................................................... 37 4.1 Introduction ........................................................................................................................... 37 4.2 Average capital cost per tonne .............................................................................................. 37 4.3 Total cost per tonne including management assumptions ................................................... 38 4.4 Cost to developers ................................................................................................................. 39 4.5 Testing viability to 2016 ‐ comparison with the cost of using PV .......................................... 41 4.6 Testing viability beyond 2016 ‐ comparison with national benchmark of £46 per tonne .... 42 4.7 Fund structure ........................................................................................................................ 45 4.8 Relationship with ECO Funding .............................................................................................. 46
5 Options Appraisal and conclusions ............................................................................................. 47 5.1 Options appraisal ................................................................................................................... 47 5.2 Testing viability of the increased London Plan requirements ............................................... 48 5.3 Conclusion .............................................................................................................................. 49


Page 5 of 55
Lewisham Council commissioned AECOM to assess the likely costs of offsetting carbon emissions for a range of policy scenarios and for a range of potential offsetting measures. This was to inform the development of a carbon offset strategy that provides practical alternatives to delivering onsite carbon reduction in line with policies set out in the Lewisham Core Strategy (2011). This mirrors the emerging national approach to delivering zero carbon homes which is expected to be promoted in future amendments to Building Regulations. Recognising that it can be difficult to meet carbon reduction targets cost effectively onsite, the proposals allow for a payment to be made into a fund dedicated to achieving proportional carbon savings elsewhere.
The aim of the offset strategy is to help provide a flexible framework for developers to comply with national, London and local carbon reduction requirements whilst maintaining development viability.
Both the London Plan (2011) and the adopted Lewisham Core Strategy (2011) set out carbon reduction targets beyond those required through the current requirements of Part L of the Building Regulations.
The London Plan policy 5.2 requires:
2013‐2016 ‐ A 40% reduction on 2010 Building Regulations target emission rate (for both domestic and non‐domestic)
2016 onwards – as per Building Regulations (zero carbon for domestic. As highlighted below zero carbon has yet to be fully defined in policy)
The London Plan also makes provision for the use of an offset fund, which can be used to offset the remaining emission reductions where developers can demonstrate that they cannot achieve the full carbon reduction targets through onsite measures alone1.
Lewisham’s Core Strategy policy requires compliance with the London Plan targets set out above, as well as standards in relation to the Code for Sustainable Homes and BREEAM:
To April 1 2016 – all new homes to meet Code for Sustainable Homes Level 4, which requires an onsite carbon compliance of 25% reduction in regulated emissions.
From April 1 2016 ‐ all new homes to meet Code for Sustainable Homes Level 6, which requires ‘net zero carbon’. All new non‐domestic buildings to meet BREEAM Excellent which requires onsite carbon compliance of 25% as part of a number of performance requirements
Based on previous Government announcements it is expected that a national zero carbon policy will be introduced for new housing in 2016 and new non‐domestic buildings in 2019. Developers will be required to reduce regulated emissions to zero. As part of this change, buildings will need to meet minimum fabric efficiency standards and a minimum level of carbon savings on site known as “Carbon Compliance” with remaining “residual emissions” offset through allowable solutions or further savings on site beyond the minimum carbon compliance levels. Government has yet to publish its definition of zero
1 GLA proposed to develop guidance relating to the use of offset arrangements to meet the 40% reduction target. This,
however, was not available at the time of writing this report.
1 Executive Summary

Page 6 of 55
carbon but recommendations have been made by Zero Carbon Hub on some parts of the definition. It should be noted therefore that this report has been based on reasonable assumptions based on these recommendations
Section 2 of this report sets out the key considerations in developing an offset fund, providing an analysis of:
The residual carbon emissions requiring offset
The importance of the offset Ratio
Additionality
The different ways an offset fund could deliver carbon saving projects
Measurement and verification of carbon savings
Carbon accounting
The scale of uptake required and fund management costs
Viability
Section 2 also sets out the methodology used within the study. This was based on an understanding of projected growth in the borough and the impact of building performance standards to identify the scale of carbon emissions that might be relevant to a local offset fund.
Section 3 examines the current and future policy environment as summarised in table 1 below to establish three potential future policy scenarios:
Scenario 1 – Proposed Building Regulations only.
Scenario 2 – London Plan / Lewisham Core Strategy to 2016/2019 and proposed Building
Regulations thereafter.
Scenario 3 ‐ Lewisham Planning Policy.

Page 7 of 55
Domestic Non Domestic
Proposed Building Regulations (2013)
Based on CLG, 2012 consultation on changes to the Building Regulations in England (preferred options)
Aggregate 8% reduction over 2010
Proposed Building Regulations (2013)
Based on CLG, 2012 consultation on changes to the Building Regulations in England (preferred options)
Aggregate 20% reduction over 2010 [1]
Code for Sustainable Homes level 4
(Current Lewisham Planning Policy)
25% reduction in regulated emissions onsite over 2010 Building Regulations
(no offset allow)
London Plan Policy from 2013
40% reduction in regulated emissions onsite over 2010 Building Regulations
(offset allowed)
London Plan Policy from 2013
40% reduction in regulated emissions onsite over 2010 Building Regulation
(offset allowed)
Proposed Building Regulations (2016)
Based on Zero Carbon Hub recommendations which have not yet been adopted in policy by Government.
On site carbon compliance set at 25% / 41% / 47% reduction on 2010 Building Regulations for flats / semis and terraces / detached on site
Plus 100% reduction in regulated emissions overall through offsets.
Proposed Building Regulations (2016)
CLG, Zero carbon non‐domestic buildings Phase 3 final report, July 2011 ‐ high scenario[2]
Aggregate 25% reduction in regulated emissions over 2010
BREEAM Excellent (Lewisham Planning Policy)
25% reduction in regulated emissions (no Allowable Solutions)
[1] Other options are proposed, ranging between 8% ‐ 20% aggregate reductions for non‐domestic buildings. The 20% scenario
has been taken as the preferred option. Disaggregated targets have been applied to different building types where these are
given in the consultation stage impact assessment. Aggregate targets are proposed in recognition of the fact that it is harder
to make carbon reductions within certain building types compared to others. [2] The high scenarios have been chosen for non‐domestic buildings in 2016 and 2019 as they align best with the preferred
option in the 2012 Building Regulations consultation; however these may not reflect government preferences, which have not
yet been stated. Although both are proposed to be aggregate targets, i.e. varied across different building types, they have
been presented at a fixed level for all building types due to the uncertainty around the disaggregated levels for different
building types at this stage.

Page 8 of 55
Code for Sustainable Homes level 5
100% reduction in regulated emissions onsite
(no offset allowed)
Building Regulations (2019)
Onsite carbon compliance of 32% reduction on 2010 Building Regulations2.
Plus 100% reduction in regulated emissions overall through offsets.
Code for Sustainable Homes level 6
(Lewisham Planning Policy from 2016)
100% reduction in regulated AND 100% reduction in unregulated emissions (equivalent to 150‐190% reduction in regulated emissions) onsite
(no offset allowed)
BREEAM Outstanding 40% reduction in regulated emissions3
(no offset allowed)
2011
Energy target in BREEAM
Table 1: Summary of current and future carbon reduction targets
The policy scenarios are coupled with the future development proposals for the Borough to predict the likely residual emissions for the Borough, based on the likely performance of different building types.
Table 2 and figure 1 below set out the cumulative residual emissions that must be offset for each of the three policy scenarios described above4.
Scenario
Total residual emissions by 2016 (tCO2)
Total residual emissions 2016 to 2019 (tCO2)
Total residual emissions 2019 to 2026 (tCO2)
Total Carbon Emissions to offset (tCO2)
1. Proposed Building Regulations only
0 4,563 7282 11,846
2. London Plan / Lewisham Core Strategy to 2016/2019 and proposed Building Regulations thereafter
1,133 4,837 7282 13,252
3. Lewisham Planning Policy
1,133 7,242 11,778 21,154
2 Med Scenario taken from ‘Zero Carbon Non‐Domestic Buildings Phase 3 Report’ (CLG 2011) 3 BREEAM New Construction Non‐Domestic Buildings Technical Manual (Bre 2011) 4 Note that these represent the maximum residual emissions requiring offset. If better performance is achieved onsite then
this figure will be reduced. In turn this will reduce potential revenue for offset.

Table 2: Predicted residual carbon
Figure 1 Cumulative annual residual carbon
Section 4 identifies a number of ‘baskets of measures’ each of which is a different way of generating offset fund projects and priorities, these baskets demonstrate a range of energy efficiency measures which could be delivered using money raised through the offset fund route whilst maximising carbon savings and funding which can be leveraged from elsewhere:
Basket 1: All measures, all sectors – with the widest possible range of carbon saving measures
available this scenario will deliver the lowest capital cost per tonne of carbon. However, the scale of
measures requiring delivery is likely to increase management costs and therefore the overall cost
per tonne. Similarly, overcoming issues with State Aid on private properties can restrict uptake of
measures and increase costs. This scenario focuses on the easy to target measures many of which
could be funded through other mechanisms and restricts opportunities to target hard to reach
measures.
Basket 2: Lewisham Homes only – confining the basket to measures available within Lewisham’s
own housing stock. This option reduces issues relating to State Aid funding and will provide wider
social benefits by helping to bring the housing standards up. Management costs are also reduced
because it can link in with existing programmes and, as a corollary, access issues and costs will be
reduced. However, it contains a number of measures that are likely to be delivered by existing and
planned initiatives such as ECO or the Green Deal. It would therefore be difficult to demonstrate
that the funding secured through the offset policy was delivering CO2 savings that would not
otherwise have been realised.
0
5000
10000
15000
20000
25000
13/14 14/15 15/16 16/17 17/18 18/19 19/20 20/21 21/22 22/23 23/24 24/25 25/26
Series1
Series2
Series3
To
nne
s C
O2/
yea
r

Page 10 of 55
Basket 3: ECO top up, all sectors – Lewisham Council are looking to apply for ECO funding. This
basket of measures therefore excludes measures that might be targeted under the ECO funded
scheme to offer genuine additionality.
Basket 4: ECO top up, Lewisham Homes only – As with basket 3, this option excludes measures that
might be delivered through ECO but focuses on complementary measures delivered on Lewisham
Homes properties.
Basket 5: Schools – This basket focuses on improving the efficiency of schools. This option would
reduce competition risk and provide wider social benefits whilst reducing the running cost of council
assets. This option also simplifies the fund management requirements as it focuses on fewer
individual projects.
The availability of different measures within each basket determines the overall cost. The baskets assume that as the most cost effective measures available are exhausted, more expensive measures are then utilised. The availability of measures and their associated capital costs have been supplied by Lewisham Council. Assumptions on the costs of managing and delivering the different baskets have been based on previous experience in Lewisham of delivering carbon saving schemes (low) and from the Green Deal Impact Assessment (high).
Scenario
Average cost per tonne of CO2 saved including management costs
Basket 1: All measures, all
sectors
Basket 2: Lewisham Homes only
Basket 3: ECO ‘top up’ all sectors
Basket 4: : ECO ‘top up’ in Lewisham Homes only
Basket 5: Schools
Low High Low High Low High Low High Low High
1. Proposed Building Regulations only
£10 £15 £45 £68 £90 £136 £91 £138 £60 £91
2. London Plan / Lewisham Core Strategy to 2016/2019 and proposed Building Regulations thereafter
£10 £15 £52 £78 £91 £137 £91 £138 £60 £91
3. Lewisham Planning Policy
£10 £16 £69 £104 £92 £139 £136 £206 £60 £91
Table 3: Average cost per tonne of CO2 saved including management costs
The table below converts the average cost per tonne of carbon into a cost that the developer will be expected to pay to offset annual residual emissions over the assumed 30 year period. This has been done by dividing the estimated average annual cost per tonne of carbon to be offset), by the residual carbon per m2 requiring offset for each development type (for residential properties this has also been illustrated per unit at 67m2). This has then been multiplied by 30 years to establish the total cost of

Page 11 of 55
offsetting the total lifetime residual emissions. It has been assumed the higher management costs are included.
It should also be noted that the cost per tonne of carbon is calculated based on the total cost of measures to offset all the residual emissions over the plan period. However, the residual emissions requiring offsetting change in line with the policy (in 2016 and 2019), as such, the cost to the developer changes at each of these points.
The cost of carbon generated for each basket was also compared with delivering an equivalent saving from installation of Photovoltaics (PV) and with £46per tonne of carbon which has been used as an illustrative figure within work undertaken by the Zero Carbon Hub in looking at the costs of meeting zero carbon policy. The tables below also summarise these different costs.

Page 12 of 55
Table 4: Indicative cost of carbon: Residential – 2013‐2016
Scenario
Basket 1: All measures, all
sectors Cost per m2
Basket 2: Lewisham Homes only Cost per m2
Basket 3: ECO ‘top up’ all sectors
Cost per m2
Basket 4: ECO ‘top up’ in Lewisham Homes only Cost per m2
Basket 5: Schools
Cost per m2
PV Proxy Cost per m2
National Benchmark of £46 per tonneCost per m2
1. Proposed Building Regulations only
N/A N/A N/A N/A N/A N/A N/A
2. London Plan / Lewisham Core Strategy to 2016/2019 and proposed Building Regulations thereafter
£0.99 £5.24 £9.20 £9.28 £6.09 £8.40 £3.09
3. Lewisham Planning Policy £1.05 £6.97 £9.32 £13.81 £6.09 £8.40 £3.09
Table 5: Indicative cost of carbon: Residential – 2016 onwards
Scenario
Basket 1: All measures, all
sectors Cost per m2
Basket 2: Lewisham Homes only Cost per m2
Basket 3: ECO ‘top up’ all sectors
Cost per m2
Basket 4: ECO ‘top up’ in Lewisham Homes only Cost per m2
Basket 5: Schools
Cost per m2
PV Proxy Cost per m2
National Benchmark of £46 per tonneCost per m2
1. Proposed Building Regulations only
£6.10 £28.59 £57.30 £57.83 £38.08 £52.50 19.32
2. London Plan / Lewisham Core Strategy to 2016/2019 and proposed Building Regulations thereafter
£6.22 £32.78 £57.54 £58.01 £38.08 £52.50 19.32
3. Lewisham Planning Policy £11.51 £76.09 £101.75 £150.81 £66.49 £52.50 33.74

Page 13 of 55
Table 6: Indicative cost of carbon: Non‐domestic – 2013‐2019
Scenario
Basket 1: All measures, all
sectors Cost per m2
Basket 2: Lewisham Homes only Cost per m2
Basket 3: ECO ‘top up’ all sectors
Cost per m2
Basket 4: ECO ‘top up’ in Lewisham Homes only Cost per m2
Basket 5: Schools
Cost per m2
PV Proxy Cost per m2
National Benchmark of £46 per tonneCost per m2
1. Proposed Building Regulations only
N/A N/A N/A N/A N/A N/A N/A
2. London Plan / Lewisham Core Strategy to 2016/2019 and proposed Building Regulations thereafter
£1.10 £5.80 £10.19 £10.27 £6.74 £20.86 £7.68
3. Lewisham Planning Policy £1.17 £7.71 £10.31 £15.29 £6.74 £20.86 £7.68
Table 7: Indicative cost of carbon: Non‐domestic – 2019 onwards
Scenario
Basket 1: All measures, all
sectors Cost per m2
Basket 2: Lewisham Homes only Cost per m2
Basket 3: ECO ‘top up’ all sectors
Cost per m2
Basket 4: ECO ‘top up’ in Lewisham Homes only Cost per m2
Basket 5: Schools
Cost per m2
PV Proxy Cost per m2
National Benchmark of £46 per tonneCost per m2
1. Proposed Building Regulations only
£7.55 £35.36 £70.88 £71.53 £47.10 £81.70 £30.08
2. London Plan / Lewisham Core Strategy to 2016/2019 and proposed Building Regulations thereafter
£7.69 £40.55 £71.17 £71.75 £47.10 £81.70 £30.08
3. Lewisham Planning Policy £8.15 £53.90 £72.07 £106.83 £47.10 £81.70 £30.08

Page 14 of 55
In conclusion the study finds that as different funding priorities restrict the suite of measures available within different baskets, the cost associated with each basket changes. The options appraisal highlights there are opportunities and issues with each of the different baskets of measures, but that an offset ratio of one can be delivered. Taking a flexible approach to combining baskets therefore offers the best chance to maximise external funding, offer additionality and address priorities on an ongoing basis. This will enable the rate to remain constant which offers developers certainty around the cost whilst maintaining flexibility about the most appropriate delivery mechanisms. Similarly, as the amount of residual carbon increases, as in policy scenarios 2 and 3, the lower cost measures become exhausted quicker and more expensive measures are needed to achieve the desired savings. This is particularly evident post 2016 where in scenario 2 proposed Building Regulations become more stringent and in scenario 3 where Lewisham’s Core Strategy requires the equivalent of Code for Sustainable Homes Level 6.
Retaining development viability is also critical. Payment into an offset fund should not stifle the deliverability of development. As such, the potential to charge developers is restricted. To 2016, Baskets 1, 2 and 3 appear to be reasonable based on using PV as a proxy for alternative onsite delivery and in relation to previous CIL sensitivity testing. Post 2016 the cost of available offset measures in all baskets other than basket 1 cost more than using PV. However, it should be noted that it becomes less appropriate to use PV as a proxy for comparison beyond 2016 as it is unlikely that there would be sufficient space available to install the sufficient of PV cells to meet the higher reduction targets on site.
The overall management and delivery of an offset fund will also affect the cost and the ability of the fund to achieve the required carbon savings. There are likely to be restrictions on providing public funding within the private sector. This is generally overcome by calling for applications for funding. However the evidence suggests that this has a tendency to increase fund management and marketing costs. Using the baskets of measures to take a flexible approach to balancing risks and opportunities will ensure delivery costs can be minimised and carbon reductions maximised.
It is for these reasons that a cost per residual tonne of carbon of £104 should be used. This would equate to a cost of £6.97per m2 for residential properties and £7.71 per m2 for non‐domestic properties. This figure balances maintaining a flexible approach for developers as to how they choose to meet the carbon reduction targets with a cost that can deliver carbon reduction projects within Lewisham. Post 2016 offset charges will need to be reviewed in light of development viability to maintain the balance going forward.

Page 15 of 55
2.1 What is a carbon offset fund?
Lewisham Council commissioned AECOM to assess the likely costs of offsetting carbon emissions for a range of policy scenarios and for a range of potential offsetting measures. This was to inform the development of a carbon offset strategy that provides practical alternatives to delivering onsite carbon reduction in line with policies set out in the Lewisham Core Strategy (2011). This mirrors the emerging national approach to delivering zero carbon homes which is expected to be promoted in future amendments to Building Regulations. Recognising that it can be difficult to meet carbon reduction targets cost effectively onsite, the proposals allow for a payment to be made into a fund dedicated to achieving proportional carbon savings elsewhere.
2.2 Key principles for consideration
There are a number of factors that will influence the price of carbon. This section provides an overview of the key principles that need to be considered when establishing an offset fund. It has, in part, been informed by the limited number of similar ‘offset’ schemes in more advanced stages of development, including in Milton Keynes, Islington, Croydon and the use of the GLA’s RE:NEW / RE:FIT schemes for offsetting Olympic Games emissions, as well as national carbon reduction programmes such as the Carbon Emissions Reduction Target (CERT) and the Green Deal.
Residual carbon requiring offset
The first question that needs to be addressed is how much carbon needs to be offset from future development in Lewisham? This is influenced by the type, scale and energy performance of future growth. As explained in more detail in section 3 below, assumptions as to the type and scale of growth have been derived from growth projections provided by Lewisham Council. They are based on existing permissions and predicted growth scenarios developed as part of Lewisham’s Core Strategy and the ongoing review of development through the Lewisham Planning Service Annual Monitoring Report.
The energy performance of different building types is regulated by Part L of Building Regulations. As highlighted above; the Government has proposed that future amendments to Building Regulations will require higher levels of carbon reduction to eventually achieve ‘zero carbon’. Further performance targets are set out in planning policy, through Lewisham’s Core Strategy and the London Plan. Each of these targets proposes incremental increases in the levels of carbon reduction or ‘carbon compliance’ to be achieved onsite over time. The policies also make provision for any remaining ‘residual emissions’ that have not been reduced onsite to be mitigated through offsetting arrangements. The level of residual emissions requiring mitigation varies, however, across the different performance targets. Section 3 then provides more detail on the required performance targets and how these are likely to change with future proposals in order to make assumptions as to future policy scenarios. Applying these scenarios to the type and scale of future development will provide an indication of the maximum residual emissions requiring offsetting.
2 Background

Page 16 of 55
Offset Ratio
The price per tonne of carbon that requires offsetting is a factor of the total carbon saving potential of offset measures available and the cost of those measures. The principle of an offset fund is to provide a more cost effective and flexible way of reducing residual emissions than would be possible onsite. Ideally, therefore, any offset fund should achieve at least as much carbon saving as was required onsite: thus giving an offset ratio of one. However, as it becomes more difficult over time to fund lower cost offset measures, more expensive measures will be required to achieve the required residual offset emissions raising the cost per residual tonne of carbon to maintain an offset ratio of one. Alternatively, less carbon can be offset for the same price therefore achieving an offset ratio lower than one. Although maintaining an offset ratio of one has been used in this study as the starting point for determining a price of carbon, there are a number reasons that might restrict the offset measures available (see additionality, uptake required, sector and fund management below) and therefore a viable cost of carbon.
Additionality
It is likely that some carbon reduction measures would occur without offset funding; either due to replacement (i.e. boiler upgrade) or through other available funding designed for carbon reduction such as the Green Deal or ECO. As such, some measures, particularly the most cost effective, are likely to be undertaken anyway. It may therefore be considered more worthwhile for the offset fund to deliver truly additional carbon savings.
Satisfying principles of additionality will however mean fewer cost efficient projects are available, increasing the difficulty of delivering an offset ratio of one. However, as existing programmes are only likely to cover the cost of the cheapest measures, this offset fund could be used to deliver harder to reach savings or more strategic priorities. For example, there is a risk that if a property only has basic efficiency measures installed through existing funding mechanisms such as the Green Deal, it will be harder to regain access to these properties to do additional harder to reach options. This represents a lost opportunity cost. More expensive measures still represent significant carbon reduction opportunities and there may be opportunities to work with existing mechanisms to deliver whole house retrofit5. The London Borough of Lewisham is seeking to leverage additional funding, claiming the carbon for any additionality that this might bring. As such, the Council recognises that in some instances they need to take a flexible approach to achieving an offset ratio of one where there are wider benefits.
Sector
Targeting different sectors will influence the way in which the offset fund is organised and performs:
5 There are accounting issues that affect working with other funding mechanisms. Each funding mechanism has different rules
relating to leveraged funds and who can ‘claim’ the carbon saving within reporting. The only way to ensure that all carbon
savings could be attributed to Lewisham is if an offset fund pays for 100% of the carbon reduction measures. This, therefore,
limits the range of projects available and potentially the offset cost/ratio.

Page 17 of 55
Private sector housing – the scale of carbon saving potential, particularly low cost measures, is greatest within private housing. However, rules on the spending of public money in a way that directly benefits the private sector are likely to restrict the way in which funds are structured. It is important for public allocation of money to demonstrate impartiality. One method of achieving this, that has been used in similar schemes, is to require third party applications for funding that can then be assessed against award criteria. This, however, increases the management costs associated with targeting private housing. Furthermore, the need to undertake marketing to attract applications can exacerbate these additional costs. One way of reducing these costs is to use a third party agent to manage the recruitment of private homes to retrofit. This is similar to the approach used in the GLA’s RE:NEW programme to offset emissions associated with the Olympic Games. In this instance third party agents were responsible for marketing carbon reduction opportunities to a minimum number of households. The average cost for offsetting a tonne of annual residual CO2 emissions over a period of 30 years was £1187 or £39.5 per annum. One of the main concerns with this approach is the risk that not enough homes would respond to marketing by the third party agent and take up measures. As such, consideration is being given to requiring third party agents to achieve a minimum carbon saving, transferring the risk of not attracting enough homes to the third party agent. It should also be recognised that there are several other national incentives targeted at private households.
Public sector housing – the scale of potential carbon saving within public sector housing is still significant and some the problems around funding the private sector identified above, are likely to be reduced if local authority owned properties are specifically targeted. By the nature of the properties being targeted, targeting public sector housing is also likely to support those most at need.
Larger public sector assets (schools, libraries, leisure centres etc) – Although targeting a smaller basket of potential carbon reduction measures, targeting public sector assets will help reduce the overall running costs which can be used to improve service performance. Furthermore, working with a smaller number of projects can help reduce management costs. For example, the measures installed through the GLA Olympic RE:FIT scheme, which focused on school retrofit, cost £785 per tonne over 30 years or £26.6 per annum. As such RE:FIT was more cost effective than RE:NEW.
Commercial properties / SMEs – The commercial sector, and in particular SMEs, are often underrepresented within carbon reduction programmes. Although private sector funding restrictions are likely to have a similar impact as with residential properties, Islington are considering targeting some measures within this sector.
Infrastructure – Again, if commercial partners are involved they may face private sector funding restrictions, however funding infrastructure, such as district heating network extensions can provide significant carbon savings. As such, Islington, for example, are looking at opportunities to use offset funds to extend their district heating network. The capital costs of such interventions are, however, likely to be significant and as such it is unlikely that the offset fund would generate sufficient funds to deliver many projects. It is more likely, therefore, that district heating would be delivered through planning applications.

Page 18 of 55
Verification
The ability to verify the level of carbon saving from specific measures differs. The most straight forward measures have been modelled and there are standard benchmarks that can be assumed, however other measures that might be desirable, such as behavioural change initiatives, are likely to be less easy to define – particularly for limited project management costs. The London Borough of Islington recognises, for instance, that behavioural change is important in reducing carbon emissions. As such, they are proposing to fund some behavioural change projects, but only where they complement installed carbon reduction measures. As Lewisham are looking to have a pragmatic approach to management and verification, this might limit projects to those that have more established and understood carbon reduction factors. This pragmatic approach is designed to keep management costs down which allows more funding to be spent on carbon reduction measures, providing more scope for an offset ratio of one to be met whilst protecting developer viability.
Carbon accounting
One of the major unresolved issues facing emerging Allowable Solutions policy is the proportion of project carbon savings that would be attributed to offset or Allowable Solutions when there are multiple sources of project funding such as CERT, ECO, Green Deal, Feed in Tariff or Renewable Heat Incentive. The funding criteria of each of these sources of funding could potentially restrict complementary additional carbon reduction measures that are likely to be more expensive. However, the additional funding provided by the offset fund might be required to leverage addition funding. As such, there are three emerging approaches to carbon accounting:
Funder takes all – Where additional funding has been leveraged to allow a project to go ahead, then that funding mechanism is attributed with total carbon saving. This approach is taken by Milton Keynes, who see any supplementary contribution from their offset fund to pay for carbon reduction measures as instrumental to the project taking place; as such they claim all the carbon savings.
Total proportional – The collective carbon emissions saving is attributed proportionally relative to the total level of funding.
Measure dependent – Funders are attributed carbon savings relative to the measures they paid for. This method is most likely to impact on the offset ratio as the other funding mechanisms are set up to cover the cost of cheaper initiatives and as such the offset fund is likely to be a top up fund. However, it should be noted there might be lost opportunity costs in not supplying additional funding, such as in total house retrofit i.e. if a household has Green Deal funding to fund the most cost effective carbon saving measures there may be a benefit in offering additional funding for harder to reach carbon saving measures as it may be difficult to get access to the property at a future date.
Scale of uptake required and fund management costs
The types of projects that are suitable to be funded through an offset fund will dictate the management structure. For example, there may be benefits to aligning with existing and established funding structures, or to take everything in house. It will also be sensible to establish an appropriate level of fund
Page 19 of 55
management costs. One of the factors influencing the fund’s complexity and administrative costs is the types of projects targeted for funding. If a fund targets the private sector, issues around State Aid, such as ensuring projects are selected through a fair open competition process, may arise. For example the recent round of London RE:NEW funding which looked to fund efficiency improvement measures in private housing spent an average of £97 on ‘operations and management’ for every £61 spent on the energy efficiency measures6. On the other hand, the ODA RE:FIT programme funding school retrofit spent less than 10% on fund management.
Allied to the above, it is important to consider the scale of uptake of different measures. Logistically, delivering high volumes of low cost but low impact measures might have the lowest capital expenditure, but require significant resources to deliver making the total costs prohibitive. Conversely, management of a single larger project may mean capital costs are higher but with lower overall management costs.
Viability
The National Planning Policy Framework (NPPF) states that “development identified in the plan should not be subject to such a scale of obligations and policy burdens that their ability to be developed viably is threatened.” This means that the costs of any policy requirements likely to be applied to development, when taken alongside other development costs, should in general be at a level that enables development to still be deliverable.
The requirements for development to meet carbon reduction standards are detailed in the local development plan. Lewisham Core Strategy Policy 8 sets out the needs of both residential and non‐residential development in meeting the Code for Sustainable Homes (CfSH) and BREEAM standards respectively, over the plan period until 2026. The Core Strategy requires Code level 4 to be met up until 1st April 2016, which requires a 25% reduction in CO2 emissions against 2010 Building Regulations. Carbon reduction standards are set out in the London Plan and are followed in the Lewisham Core Strategy. As of October 2013 the London Plan moves from requiring a 25% to 40% reduction in CO2
emissions against 2010 Building Regulations. This creates a difference between the two policies and therefore the Code level, which has been assessed within the CIL viability calculations, will be used as the minimum level of CO2 emissions for the purposes of testing costs per tonne of carbon.
In general, overall development viability will influence the potential scale of offset revenue and, therefore, the range of measures that can be funded and the offset ratio achievable. The inclusion of allowable solutions offsite (at a rate that does not exceed the cost of onsite delivery) would provide development with an additional option for delivering cost effective carbon dioxide emission reductions. This would increase the likelihood of applicants being able to meet policy without affecting viability and hence encourage development to come forward.
The London Borough of Lewisham employed Lambert Smith Hampton to test the viability of development in relation to bringing forward a Community Infrastructure Levy (CIL), due to be adopted in April 2014. The Lewisham CIL Economic Viability Study found that on the most part, new development in the borough could afford to pay a CIL of between £70 and £100 per square metre. However, the original
6 Project Summary Report, RE:NEW Demonstration Phase Study (Mayor of London, LDA, London Councils)
http://www.london.gov.uk/sites/default/files/archives/RENEW‐Demonstration‐project‐summary‐report‐Mar2011.pdf

Page 20 of 55
study did not include the increased requirements of the London Plan as described above for residential development. As a result the model has required further testing against the added burden of meeting the increased requirements alongside the development of allowable solutions (see section 4).
It is of note that the increased requirements of the London Plan do not make a difference to the positive effect that including allowable solutions (at a rate that does not exceed the cost of onsite delivery) will have on viability. Ultimately, the focus of the offset fund is to provide a more cost effective way of reducing carbon emissions that does not restrict development at all policy levels.
2.3 Developing a locally appropriate solution
The proposed national Allowable Solutions framework, London Plan and Lewisham Core Strategy offset arrangements should reflect local opportunities, barriers and priorities. As such, the cost should reflect an assessment of the available carbon reduction measures within the borough. Each of these measures can be delivered at a cost per tonne of carbon saved. These measures have been derived from studies supplied by Lewisham Council including data developed by Parity using an adjusted RdSAP methodology; Lewisham Renewables Evidence Base Study (2009) and Lewisham Town Centre AAP ‐ Low Carbon and Decentralised Energy Strategy Recommendations (2010).
As part of this study a workshop was held with officers from Lewisham Council and partners. This workshop highlighted that the primary function of an offset fund should be to drive carbon reduction on site without hampering development – in effect mirroring the national priorities and supporting a flexible approach to reducing carbon. In this regard, the fund should be used to reduce overall carbon savings but seek to deliver wider social benefits where possible, such as targeting those most at risk of fuel poverty or reducing the running cost of public assets. It was acknowledged there might be difficulties in co‐ordinating/leveraging additional funding. Furthermore if the Lewisham Offset fund was required to pay for harder to treat measures it would impact on the offset ratio that could be achieved. The effort put into accounting for this carbon should be proportional to the total investment against the carbon saved. However it was recognised that not all funding arrangements allow this kind of carbon accounting. It was agreed that as long as reporting the carbon was for separate purposes, this would not matter and Lewisham would continue to report based on the proportion of total investment.
2.4 Method statement and limitations
The starting point for establishing a cost of carbon in Lewisham is based on an understanding of how much it would cost to deliver the measures needed to offset the residual emissions resulting from predicted growth in the borough. It should be noted that it has not been within the scope of this study to generate primary data. As such, assumptions used within the study are dependent on the availability of suitable information. Although every effort has been made to ensure that reliable, established and endorsed sources have been used, the nature of this emerging area of interest means that there are inevitably limits. In these instances assumptions have been developed from case study examples, professional experience and agreed by Lewisham Council.

Page 21 of 55
Task 1: Predicting residual emissions in Lewisham (see Section 3)
This task aims to establish an understanding of the type and scale of growth in Lewisham, coupled with an understanding of overall carbon reduction targets and onsite performance requirements:
Stage A: Predict future growth – Time based growth projections have been provided by Lewisham Council. They are based on existing permissions and predicted growth scenarios developed as part of Lewisham’s Core Strategy and the ongoing review of development through the Lewisham Planning Service Annual Monitoring Report.
Stage B: Set building performance standards – Part L of the Building Regulations 2010 sets the current minimum building performance standards. Current planning policy in the adopted London Plan and Lewisham Core Strategy includes incremental carbon saving targets against the 2010 Building Regulations baseline over time. Similarly proposed changes to future iterations of Building Regulations will require an uplift in building performance over time. As the level of onsite carbon compliance and the proportion that can be offset changes over time in addition to the uncertainties over the implementation of future targets, this study has developed three potential policy scenarios:
o Scenario 1 – Proposed Building Regulations only
o Scenario 2 – London Plan / Lewisham Core Strategy to 2016/2019 and proposed
Building Regulations thereafter
o Scenario 3 ‐ Lewisham Planning Policy
Stage C: Model carbon emissions over time – With an understanding of the type and scale of development over time, and assumptions as to the carbon targets and onsite compliance at different points in time, it has been possible to model the residual carbon emissions arising over time for the three scenarios described above.
Task 2: A measures based approach for calculating cost of carbon (see Section 4)
This study has taken a measures based approach to establishing a cost per tonne of carbon. As such, the price per tonne of carbon is generated based on the capital and installation costs of implementing the lowest cost carbon saving measures. As opportunities from the lowest cost measures available are exhausted, the next lowest cost measure is used until an offset ratio of one is achieved7. In this way, a basket of different measures will be used to achieve the carbon savings.
Stage D: Identify measures and carbon saving potential ‐ For the purposes of this study, the range of potential offset measures has focussed on retrofit energy efficiency measures as well as a range of low and zero carbon (LZC) technologies. A complete list of potential offset measures assessed is set out in appendix 1.
7 This study has assumed an uptake rate of 100%. Although in reality this is unlikely to be achievable, particularly for small
scale measures requiring numerous installations. However as the variance in the level of uptake is difficult to predict, an
assumption of 100% uptake has been used as a baseline. Not achieving 100% uptake will effectively increase the cost per
tonne of carbon as other, more expensive, measure would need to be utilised to offset the residual emissions. The basket
approach allows a degree of sensitivity checking in relation to the application of different measures on the cost of carbon.

Page 22 of 55
o Domestic ‐ Evidence for the type, scale and cost of potential measures available within
residential properties in the Borough has been supplied by Lewisham Council, drawn
from data developed by Parity using an adjusted RdSAP methodology. This study has
not independently appraised these assumptions. Data has, however, been adapted to
add in the lifetime of measures – assumed to be 30 years for fabric measures and 15
years for services measures ‐ in order to ascertain lifetime carbon savings. Similarly
measures involving removal/replacement of Secondary Heating systems have been
removed from datasets as replacement would not guarantee carbon savings.
o Non‐domestic assumptions – Measures have, where possible, been compiled through
benchmarking and case study examples. However, due the variance in building types
and occupier behaviour, it is very difficult to get an accurate picture of the impact of
energy performance improvement measures within non‐domestic buildings. As such,
for the purposes of this study it has been agreed to focus on opportunities to retrofit
schools, as these could have the potential to deliver significant carbon savings across a
smaller range of projects and deliver additional community benefits. Furthermore,
information on school performance and carbon saving potential can be extrapolated
from a previous desktop study undertaken for Lewisham Council in relation to REFIT
opportunities in the Borough8.
o LZC opportunities have been derived from Lewisham Renewables Evidence Base Study
(2009) and Lewisham Town Centre AAP ‐ Low Carbon and Decentralised Energy
Strategy Recommendations (2010) and AECOM experience. These are indicative only.
Stage E: Testing different basket options – As described above, there are a number of factors, such as additionality and sector that could provide additional social benefits, be more straight forward to manage or target harder to reach measures that restrict the measures available and therefore impact on the overall capital cost of reaching an offset ratio of one. As such, this study has compared the capital expenditure implications of five baskets of measures:
o Basket 1: All measures, all sectors – with the widest possible range of carbon saving
measures available this scenario will deliver the lowest capital cost per tonne of carbon.
However, the scale of measures requiring delivery is likely to increase management
costs and therefore the overall cost per tonne. Similarly, overcoming issues with State
Aid on private properties can restrict uptake of measures and increase costs. This
scenario focuses on the easy to target measures many of which could be funded
through other mechanisms and restricts opportunities to target hard to reach
measures.
o Basket 2: Lewisham Homes only – confining the basket to measures available within
Lewisham’s own housing stock. This option reduces issues relating to State Aid funding
and will provide wider social benefits by helping to bring the housing standards up.
Management costs are also reduced because it can link in with existing programmes 8 Agreed at meeting with London Borough of Lewisham on 16th April 2013
Page 23 of 55
and, as a corollary, access issues and costs will be reduced. However, it contains a
number of measures that are likely to be delivered by existing and planned initiatives
such as ECO or the Green Deal. It would therefore be difficult to demonstrate that the
funding secured through the offset policy was delivering CO2 savings that would not
otherwise have been realised.
o Basket 3: ECO top up, all sectors – Lewisham Council are looking to apply for ECO
funding. This basket of measures therefore excludes measures that might be targeted
under the ECO funded scheme to offer genuine additionality.
o Basket 4: ECO top up, Lewisham Homes only – As with basket 3, this option excludes
measures that might be delivered through ECO but focuses on complementary
measures delivered on Lewisham Homes properties.
o Basket 5: Schools – This basket focuses on improving the efficiency of schools. This
option would reduce competition risk and provide wider social benefits whilst reducing
the running cost of council assets. This option also simplifies the fund management
requirements as it focuses on fewer individual projects.
Stage F: Establish type, number and cost of measures required to achieve offset ratio of 1 – For each of the measures in each of the baskets described above, the total lifetime carbon saving was derived from information supplied by Lewisham Council based on research undertaken by Parity. This is based on the total number of measures available multiplied by the lifetime carbon saving of that measure. Multiplying this by the capital expenditure for each measure gives a total capex per lifetime carbon saving that could be used to rank each measure. The suite of measures required to deliver an offset ratio of one in the most cost efficient way for each of the policy scenarios described above could then be identified, and the average cost per tonne derived.
Stage G: Review fund management costs– In addition to the capital and installation costs, there will be costs associated with managing the scheme including developing offset projects and verification of carbon savings. As highlighted above, predicting the costs associated with delivering carbon saving measures is complicated and depends on the number of measures delivered, the way the fund is structured and local socio‐economic factors. Consequently, both a low and high estimate of management costs have been applied to the installed capital cost per tonne of carbon. The low estimate equates to a management cost of 12.5% and is comparable to an earlier carbon reduction scheme run within the Borough. The high estimate of 70% of capital costs has been derived from table 2 in the ‘Final Stage Impact Assessment for the Green Deal and Energy Company Obligation’ (2012).
Task 3: Benchmarking and testing viability (see section 5)
Stage H: Comparison with the cost of using PV as a proxy for development viability to 2016 – This stage compares the cost of meeting carbon reduction targets through offset measures with an equivalent saving delivered through PV for the initial period to 2016 ‐ which would

Page 24 of 55
require an additional 15% reduction in emissions9. Although dependent on the availability of space onsite, PV would be the most logical approach to achieving these additional carbon savings if paying into an offset fund was not an option, and therefore represents a sensible proxy for testing viability. Over a longer timeframe with more stringent carbon reduction targets, this proxy becomes less relevant as the type, scale and mix of technologies required to deliver a 100% reduction in regulated emissions (proposed 2016 Building Regulations) or c170% reduction in regulated emissions (equivalent to meeting Code level 6 but offsite) will be more strategic in nature and more complicated to cost.
Stage I: Comparison with a national benchmark of £46 per tonne – The Zero Carbon Homes Impact Assessment (DCLG, 2011) ‘adopts the average discounted abatement cost of non‐traded carbon which is £46 based on current figures from the Department of Energy and Climate Change. This upfront cost incurred is the cumulative value of the carbon emitted from a house in present value terms over 30 years’. This is an illustrative value that is not related to a measures based approach. The Impact Assessment highlights that ‘the Growth Review stated that the onsite requirement [carbon reduction measures] ...will be complemented by cost‐effective options for off‐site carbon reductions, relative to the Government’s pricing of carbon.’ Thus, ‘the cost incurred by developers should not exceed the average cost of alternative abatement measures in the UK’. At the time of the Impact Assessment ‘the average discounted abatement cost of carbon figure for the period of the policy following HM Treasury Green Book guidance [was] £46 per tonne’ in present value terms. Using this figure, it is possible to compare the offset ratio achievable for each of the policy scenarios and baskets of measures.
9 Between 2013 and 2016 the Lewisham Core Strategy requires homes to meet Code for Sustainable Homes level 4, which
includes as a mandatory credit a 25% reduction in carbon emission from Building Regulations 2010 to be achieved onsite. For
this same period the London Plan requires a 40% reduction in carbon emission from Building Regulations 2010 to be achieved
either onsite or offsite. This study takes the Lewisham policy for Code level 4 as the baseline. As such, a further 15% reduction
would be required to meet the London Plan policy.

Page 25 of 55
3.1 Introduction
As highlighted in section 2.2, the cost of carbon is related to the type, scale and carbon saving potential of offset measures available. It is important to first predict how much residual carbon requires offsetting. This is based on the scale and type of future development expected, and the likely energy performance of that development. This section therefore examines the proposed growth in Lewisham to establish the maximum likely residual carbon emissions that growth will generate based on current and proposed performance targets. Given there are a range of policy options and proposed changes to Building Regulations to consider, three policy scenarios have been tested.
3.2 Developing growth projects
The first stage in predicting the likely residual emissions to be offset requires an understanding of the likely growth across the Borough. Growth projections have been provided by Lewisham Council. They are based on existing permissions and predicted growth scenarios developed as part of Lewisham’s Core Strategy and the ongoing review of development through the Lewisham Planning Service Annual Monitoring Report. Table 9 below summarises the projected growth.
Building Type 2010‐2013 2013‐2016 2016‐2019 2019‐2026 Total
C3 (units Flats @67m2))
Residential 1364 3953 11782 17099
A1 (m2) Retail 8216 21457 13077 6682 49432
A2 (m2) Retail 1248 3035 3090 2037 9410
A3 (m2) Restaurant 364 2251 2041 4340 8996
A4 (m2) Bar 286 944 858 0 2088
A5 (m2) Takeaway 143 501 501 0 1145
B1 (m2) Office 4759 47390 7848 8216 68213
B2 (m2) Industrial 0 ‐2345 5818 20363 23836
B8 (m2) Warehouse 16147 4462 0 0 20609
C1 Hotel (m2) Hotel 408 3498 3498 8162 15566
3 Predicting residual emissions in Lewisham

Page 26 of 55
C2 (m2) Residential Care
0 2050 0 0 2050
D1 (m2) Public 14588 12397 5297 667 32949
D2 (m2) Cultural 714 13412 5359 7169 26654
SG (m2) Other 0 335 0 0 335
Table 9: Development projections
Note that for the purposes of this study and in line with viability modelling undertaken for Lewisham Council (LSH, 2012) residential properties have been assumed to be flats with an average area of 67m2. Hotels are taken as 35m2 per room equivalent.
3.3 Building performance requirements
Part L of the Building Regulations (2010) sets out the minimum performance requirements for different buildings, representing the baseline standard from which building performance has been assessed. The Building Regulations focus on ‘regulated’ emissions; the emissions generated from the energy used ‘as‐built performance’ of the building, including heating/cooling, fixed lighting and hot water. It does not cover ‘unregulated’ emissions associated with energy consumed by occupant’s use of appliances such as computers and televisions. As unregulated emissions are heavily influenced by consumer choice and behaviour they are difficult to predict in practice and an assumed amount will be used based upon the Code for Sustainable Homes Technical Appendix 200910 calculation for Level 6 which is 70% of regulated emissions.
London Plan and Lewisham planning policy
Both the London Plan (2011) and the adopted Lewisham Core Strategy (2011) set out carbon reduction targets beyond those required through the current requirements of Part L of the Building Regulations.
The London Plan policy 5.2 requires:
2013‐2016 ‐ A 40% reduction on 2010 Building Regulations target emission rate (for both domestic and non‐domestic)
2016 onwards – as per Building Regulations (zero carbon for domestic. As highlighted below zero carbon has yet to be fully defined in policy)
The London Plan also makes provision for the use of an offset fund, which can be used to offset the remaining emission reductions where developers can demonstrate that they cannot achieve the full carbon reduction targets through onsite measures alone. Paragraph 5.23 of the London Plan highlights that ‘Further guidance on the criteria for off‐site provision, the types of acceptable projects and
10 Note later versions do not include the calculation as the definition of the mandatory ENE 1 credit for Code Level 6 is not
specifically defined in light of uncertainly as to future Building Regulations.

Page 27 of 55
programmes and a London wide funding scheme will be set out for boroughs. This guidance is however not yet available.
Lewisham’s Core Strategy policy requires compliance with the London Plan targets set out above, as well as standards in relation to the Code for Sustainable Homes and BREEAM:
To April 1 2016 – all new homes to meet Code for Sustainable Homes Level 4, which requires an onsite carbon compliance of 25% reduction in regulated emissions.
From April 1 2016 ‐ all new homes to meet Code for Sustainable Homes Level 6, which requires ‘net zero carbon’. However, it should be noted that the 2010 Code for Sustainable Homes Technical Guide states that ‘a definition of a zero carbon home is omitted from this document as it will be defined by future legislation. The requirements of this issue will be updated to align with this legislation once it is set’. As this legislation is yet to be put in place, this study has used the definition of ‘net zero carbon’ set out in Version 2 of the 2009 Code for Sustainable Homes Technical Guide. This requires an onsite carbon compliance of 100% reduction in both regulated and unregulated emissions which approximately equates to around 170% reduction in regulated emissions on site. It is recognised that achieving this level of carbon reduction onsite is very challenging and would not be technically achievable for all developments. As such, this study has tested delivering an equivalent saving offsite rather than requiring all emissions to be mitigated onsite.
All new non‐domestic buildings to meet BREEAM Excellent which requires onsite carbon compliance of 25% as part of a number of performance requirements
Building regulations and the route to Zero Carbon
Following consultation, in July 2007 the Government's Building a Greener Future: Policy Statement11 announced that all new homes should be zero carbon from 2016 with non‐residential buildings following from 2019. The expectation is that this policy will be implemented through changes to Building Regulations.
As of March 2011, the Government defined zero carbon to include the ‘as‐built performance’ of the building, including carbon emissions from heating, fixed lighting and hot water (regulated emissions)12 Unregulated emissions from cooking and ‘plug‐in’ appliances are no longer covered by the policy.
Prior to the introduction of the zero carbon requirements, the following intermediary step changes were proposed to the requirements of Part L of the Building Regulations for dwellings:
2013: 25% reduction in regulated emissions (relative to 2010 levels), corresponding to the carbon reduction requirements of Level 4 of the Code for Sustainable Homes.
2016: ‘Zero carbon’; note however that unlike the 2009 version of Level 6 of the Code for Sustainable homes, this does will not include unregulated emissions13 (see below).
11 Building a Greener Future: policy statement, Communities and Local Government Publications. Department for
Communities and Local Government (DCLG) (2007a) 12 ‘The Plan for Growth’. HM Treasury. March 2011. ISBN 978‐1‐84532‐842‐9

Page 28 of 55
Following further consultation on proposals for Part L 2013, which closed in March 2012, the overall carbon reduction targets were proposed to be 8% rather than 25% lower relative to the 2010 levels. Further information regarding the expected route to achieving these savings was proposed in the consultation documents including;
Fabric Energy Efficiency Standards (FEES) of 39 ‐ 43 kWh/m²/yr for apartments and mid‐
terrace, 46 – 52 kWh/m²/yr for end‐terrace, semi‐detached and attached properties.
There is more emphasis on limiting the heat gains in summer including the need to insulate
circulation pipes for domestic hot water to prevent overheating.
Regulatory energy demand targets for heating and cooling.
Government has yet to confirm the findings from the consultation or to publish the proposed improvements for 2013 Building Regulations which were originally expected to come into force in October 2013.
Despite the expected downgrading of the interim 2013 target, the Government has previously confirmed its commitment to implementing ‘zero carbon’ policy in 2016 for domestic properties and 2019 for non‐domestic properties. However, the way in which ‘zero carbon’ is to be met has yet to be defined. The Zero Carbon Hub, an independent body advising the Government on the development of zero carbon policy highlights that the planned revisions to the Building Regulations Part L and move towards ‘zero carbon policy’ are aimed at providing meaningful steps to significant reductions in carbon emissions, whilst minimising the cost impact on developers. This recognises there are diminishing returns from attempting to mitigate for a building’s carbon emissions on site, and represents a shift away from previous planning based approaches to carbon reduction, such as the Merton Rule that requires minimum onsite renewables. These policies were seen to be negatively impacting upon development viability for limited improvements in carbon reduction performance. The current proposals for ‘zero carbon policy’ include three steps to try and address issues in previous methodologies. Figure 2 summarises the Government’s hierarchy for achieving ‘zero carbon’.
Step 1 ‐ requires a minimum energy efficiency standard such as the proposed FEES to be
achieved through material selection, construction methods, and building layout. This is likely
to account for approximately 20‐25% reduction in carbon emissions.
Step 2 – a minimum level of onsite ‘carbon compliance’ to be reached through a range of
measures including additional energy efficiency and low carbon energy supply. Carbon
compliance levels are yet to be fully defined. The Zero Carbon Hub have recommended to
Government that targets are based on as built performance and have suggested targets
13 It is a common misconception that all aspects of Code levels will be required under the government proposals, but in fact it is just the CO2 targets of the Code that will be applied and are mandatory through Building Regulations (the energy category is one of nine different categories in the Code).

which equate approximately to 25% / 41% / 47% reduction in regulated emissions compared
to 2010 for flats / semis and terraces / detached homes respectively14.
Step 3 – once carbon compliance has been achieved onsite, further CO2 reduction can be
made either on‐site, or by paying a contribution towards approved offsite carbon reduction
measures known as ‘Allowable Solutions’. The Government’s framework for Allowable
Solutions is still being developed, however one option considered by Zero Carbon Hub is that
local planning authorities are required to identify a pipeline of approved Allowable Solutions.
This study will help to identify these measures.
Figure 2: The Government’s hierarchy for achieving ‘zero carbon’ development
Research by the Zero Carbon Hub titled ‘Allowable Solutions for Tomorrow’s Homes’ (July 2011) outlines the latest proposals and recommendations for how Allowable Solutions should be embedded in policy and administered. A key aspect of Allowable Solutions would be for the local planning authority (LPA), such as Lewisham, to collect Allowable Solutions as a financial contribution from developers to mitigate for the residual emissions not reduced onsite. This would provide local councils with the ability to create a policy which could determine how funds can best be used to meet government standards in a way that suits local circumstances. In the absence of local policy, developer contributions would be delivered through a national list of Allowable Solutions projects, the Zero Carbon Hub recommend that LPAs prepare for future Allowable Solutions by developing policies for contribution/collection and identify potential Allowable Solutions projects. By exploring the potential for a local offset fund, this study also helps Lewisham to prepare for the proposed changes to Building Regulations and the introduction of zero carbon policy.
14 Zero Carbon Hub, Carbon Compliance: Setting an Appropriate Limit for Zero Carbon Homes ‐ Findings and
Recommendations, Feb 2011

Page 30 of 55
In lieu of formal guidance from the Government on the details of the proposed changes to Part L of the Building Regulations, zero carbon policy and arrangements for Allowable Solutions, the current recommendations from the Zero Carbon Hub form the basis for predicting residual emission arising.
The table below compares the relative carbon savings for different potential policy positions:
Domestic Non Domestic
Proposed Building Regulations (2013)
Based on CLG, 2012 consultation on changes to the Building Regulations in England (preferred options)
Aggregate 8% reduction over 2010
Proposed Building Regulations (2013)
Based on CLG, 2012 consultation on changes to the Building Regulations in England (preferred options)
Aggregate 20% reduction over 2010 [1]
Code for Sustainable Homes level 4
(Current Lewisham Planning Policy)
25% reduction in regulated emissions onsite over 2010 Building Regulations
(no offset allow)
London Plan Policy from 2013
40% reduction in regulated emissions onsite over 2010 Building Regulations
(offset allowed)
London Plan Policy from 2013
40% reduction in regulated emissions onsite over 2010 Building Regulation
(offset allowed)
[1] Other options are proposed, ranging between 8% ‐ 20% aggregate reductions for non‐domestic buildings. The 20% scenario
has been taken as the preferred option. Disaggregated targets have been applied to different building types where these are
given in the consultation stage impact assessment. Aggregate targets are proposed in recognition of the fact that it is harder
to make carbon reductions within certain building types compared to others.

Page 31 of 55
Proposed Building Regulations (2016)
Based on Zero Carbon Hub recommendations which have not yet been adopted in policy by Government.
On site carbon compliance set at 25% / 41% / 47% reduction on 2010 Building Regulations for flats / semis and terraces / detached on site
Plus 100% reduction in regulated emissions overall through offsets.
Proposed Building Regulations (2016)
CLG, Zero carbon non‐domestic buildings Phase 3 final report, July 2011 ‐ high scenario[3]
Aggregate 25% reduction in regulated emissions over 2010
BREEAM Excellent (Lewisham Planning Policy)
25% reduction in regulated emissions (no Allowable Solutions)
Code for Sustainable Homes level 5
100% reduction in regulated emissions onsite
(no offset allowed)
Building Regulations (2019)
Onsite carbon compliance of 32% reduction on 2010 Building Regulations15.
Plus 100% reduction in regulated emissions overall through offsets.
Code for Sustainable Homes level 6
(Lewisham Planning Policy from 2016)
100% reduction in regulated AND 100% reduction in unregulated emissions (equivalent to 150‐190% reduction in regulated emissions) onsite
(no offset allowed)
BREEAM Outstanding 40% reduction in regulated emissions16
(no offset allowed)
2011
Energy target in BREEAM
Table 10: Summary of current and future carbon reduction targets
[3] The high scenarios have been chosen for non‐domestic buildings in 2016 and 2019 as they align best with the preferred
option in the 2012 Building Regulations consultation; however these do not reflect government preferences, which have not
yet been stated. Although both are proposed to be aggregate targets, i.e. varied across different building types, they have
been presented at a fixed level for all building types due to the uncertainty around the disaggregated levels for different
building types at this stage. 15 Med Scenario taken from ‘Zero Carbon Non‐Domestic Buildings Phase 3 Report’ (CLG 2011) 16 BREEAM New Construction Non‐Domestic Buildings Technical Manual (Bre 2011)

Figure 3: the % reduction in CO2 emissions over Building Regulations 2010 by different tarets
3.4 Future Policy scenarios
Presuming the changes to Part L are implemented as recommended by the Zero Carbon Hub, the Building Regulations will set the minimum levels of building performance required. However, up to 2016 the adopted Lewisham Core Strategy and the London Plan require more stringent targets to be met. After this point the London Plan becomes aligned with Building Regulations and Lewisham’s Core Strategy requires further carbon savings from residential properties (Code level 6). This study has modelled three potential policy scenarios:
Scenario 1 – Proposed Building Regulations only.
o This scenario represents the likely minimum performance required through proposed
changes to Building Regulations. As such it does not permit offset through Allowable
Solutions between 2013 and 2016 (residential) and between 2013 and 2019 (non‐
residential). From 2016 and 2019 respectively this scenario assumes that onsite carbon
compliance is met and that the remaining emissions to achieve up to a 100% reduction
in regulated emission will be the residual emissions that require offsetting.
Scenario 2 – London Plan / Lewisham Core Strategy to 2016/2019 and proposed Building
Regulations thereafter.
‐180
‐160
‐140
‐120
‐100
‐80
‐60
‐40
‐20
0
Building Regulations
2010
(Domestic)
Building Regulations
2013
(Domestic)
London Plan 2013
Code for Sustainable Homes Level
4
Building Regulations
2016
(Domestic)
Code for Sustainable Homes Level
5
Code for Sustainable Homes Level
6
% reduction in
CO2emissions over Building Regs 2010
Portion that can been offset
Onsite carbon compliance
% red
uction in
CO2 emissions over Building Regs 2010

Page 33 of 55
o This scenario assumes that for the period up to zero carbon policy coming in (2016
residential, 2019 non‐residential) Lewisham Core Strategy policies of Code for
Sustainable Homes level 4 and BREEAM Excellent are achieved onsite.
o Up to 2016/2019 the London Plan will require additional carbon savings that equal the
difference between the Code for Sustainable Homes Level 4 and BREEAM targets
(Lewisham Core Strategy) and the London Plan target of a 40% reduction in regulated
CO2 emissions. The scenario assumes these additional savings can be made though
offsetting offsite.
o After 2016/2019 the scenario assumes the residual emissions to be offset will be the
difference between the minimum onsite carbon compliance level set by Government
and the 100% reduction in regulated emissions that is expected to be required by
Building Regulations in 2016 /2019.
Scenario 3 ‐ Lewisham Planning Policy.
o This scenario assumes that Lewisham Core Strategy policies of Code for Sustainable
Homes level 4 and BREEAM are achieved onsite. To 2016/2019 respectively for
residential / non‐residential development the scenario assumes the additional carbon
saving to meet the London Plan 40% reduction target will require offsetting. Beyond
2016 Lewisham Core Strategy requires homes to meet Code for Sustainable Homes
Level 6. This is a very challenging target requiring both regulated and unregulated
emissions to be reduced to zero onsite. For many schemes this will not be possible and
the scenario assumes the residual emissions between Code Level 4 and Code Level 6
can be offset17.
3.5 Calculating the residual carbon emission required for offsetting
Key assumptions in predicting emissions:
Domestic
Regulated emissions for a 67sqm flat to CSH4 assumed to be 1 tonne18
2013‐2016: Difference between CSH4 25% and London Plan 40% assumed to be 0.15 tonnes
per unit based on predominantly flats19.
Offset requirement post 2016 for Allowable Solutions equal to 0.014 tonnes CO2 /m2/year
extrapolated across number of units planned and assuming 67m2 flats20.
Offset to CSH6 assumed to be an additional 0.7 tonnes per unit (based on Zero Carbon hub
data)21
17 This would in effect prevent the development from achieving the official Code rating. 18 AECOM assumption 19 AECOM assumption 20 Carbon compliance – what is the appropriate level for 2016’, Zero Carbon Hub, December 2010 21 Based on calculation from Code For Sustainable Homes Technical Appendix May 2009

Page 34 of 55
Non‐domestic
BREEAM Excellent assumes flat 25% reduction relative to Building Regulations 201022
London Plan policy 2013‐2016 assumes 40% flat reduction relative to Building Regulations
201023
Building Regulations 2013/16/19 reductions based on medium regulated emission reduction
requirements scenario24
Benchmark emissions based on AECOM work for Building Regulations 2013
Savings 2013‐2016 based on difference between meeting BREEAM Excellent (25%) and
London Plan (40%)
Savings 2016‐2019 based on difference between meeting BREEAM Excellent (25%) and
London Plan (i.e. stays at 40%)
Savings 2019 based on residual CO2 after meeting Building Regulations 2019
The table and figure below sets out the cumulative annual residual emissions requiring offsetting for each of the three policy scenarios described above25.
Scenario
Total residual emissions by 2016 (tCO2)
Total residual emissions 2016 to 2019 (tCO2)
Total residual emissions 2019 to 2026 (tCO2)
Total Carbon Emissions to offset (tCO2)
1. Proposed Building Regulations only
0 4,563 7282 11,846
2. London Plan / Lewisham Core Strategy to 2016/2019 and proposed Building Regulations thereafter
1,133 4,837 7282 13,252
3. Lewisham Planning Policy
1,133 7,242 11,778 21,154
Table 11: Predicted cumulative annual residual emissions
22 AECOM assumption 23 London Plan, GLA, 2011 24 Zero Carbon for Non‐domestic Buildings Phase 3 Final Report’, CLG, July 2011 25 Note that these represent the maximum residual emissions requiring offset. If better performance is achieved onsite then
this figure will be reduced. In turn this will reduce potential revenue for offset.

Figure 4: Cumulative annual residual carbon
Although the above graph and table represent the total level of residual carbon emissions that needs offsetting, it is also important to understand the yearly projected residual emissions. The annual residual emission profile will relate to the rate of revenue generated through the offset fund. The graph below highlights the predicted annual residual emissions. It highlights the jump in residual emissions associated with the proposed introduction of zero carbon policy in 2016 for residential buildings and peaking in 2019 reflecting the proposed zero carbon policy for non‐domestic buildings. After this point the emissions tail off, reflecting the difficulty in making growth projections so far into the future.
0
5000
10000
15000
20000
25000
13/14 14/15 15/16 16/17 17/18 18/19 19/20 20/21 21/22 22/23 23/24 24/25 25/26
Series1
Series2
Series3
To
nne
s C
O2/
yea
r

Figure 5: Annual residual carbon
0
500
1000
1500
2000
2500
3000
3500
13/14 14/15 15/16 16/17 17/18 18/19 19/20 20/21 21/22 22/23 23/24 24/25 25/26
Option 1
Option 2
Option 3

Page 37 of 55
4 A measures based approach to calculate the cost of carbon
4.1 Introduction
This section explores the costs of maintaining an offset ratio of one using the most cost effective measures (grouped in ‘baskets’ to provide an indicative outline of the types of measures which could be realistically delivered at different price points) to meet the residual emissions targets within the three policy scenarios (set out in section 3.4) and by targeting different sectors (as described in section 2.4):
Basket 1: All measures, all
Basket 2: Lewisham Homes only
Basket 3: ECO top up, all sectors
Basket 4: ECO top up, Lewisham Homes
Basket 5: Schools
Section 4.2 sets out the average capital cost (including installation) per tonne of carbon saved for the measures included in each of the baskets.
Section 4.3 adds an assumed uplift in the average capital cost to take account of fund management costs. It sets out low and high scenarios based on historic evidence.
Section 4.4 converts the cost per tonne of carbon into a cost per m2 based on the residual emissions that require offsetting within each of the scenarios to provide a figure that can be used to estimate the additional cost to developers.
Section 4.5 compares the cost of PV to deliver equivalent savings to 2016 as a proxy for viability.
Section 4.6 compares the cost of delivering the different baskets of measures with a national benchmark of £46 per annual residual tonne of carbon used as an illustrative figure in the Government’s Zero Carbon Homes Impact Assessment of May 201126.
The baskets are a manageable way of showing a range of different ways to generate costs for offsetting carbon within Lewisham which are anchored in the specific opportunities which exist within the borough. In practice of course, opportunities for carbon reduction arise in a more dynamic, less certain way – both in relation to the size and frequency of money which may arise as result of payments into an offset fund, as well as carbon reduction opportunities. The baskets provide confidence that measures can be delivered.
4.2 Average capital cost per tonne
The table below sets out the average cost per tonne of carbon saved for the measures assumed for each of the baskets of measures and for each scenario27. For a summary of the measures included in each basket see appendix 1. For the purposes of this study it is assumed that annual residual emissions would
26 Zero Carbon Homes Impact Assessment. Department of Government and Local communities. May 2011 27 Note that this is expressed in the same units as the illustrative £46/per tonne figure used in Government Zero Carbon policy
impact assessment which is carbon saved in present value terms.

Page 38 of 55
have to be offset for a period of 30 years, this is the assumption used in previous policy announcements and assessments by Government and the Zero Carbon Hub in relation to zero carbon policy.
Average capital cost per tonne of CO2 saved
Scenario
Basket 1: All measures, all
sectors
Basket 2: Lewisham Homes only
Basket 3: ECO ‘top up’ all sectors
Basket 4: : ECO ‘top up’ in Lewisham Homes only
Basket 5: Schools
28
1. Proposed Building Regulations only
£8.55 £40.04 £80.26 £80.99 £53.33
2. London Plan / Lewisham Core Strategy to 2016/2019 and proposed Building Regulations thereafter
£8.71 £45.92 £80.58 £81.24 £53.33
3. Lewisham Planning Policy
£9.23 £61.02 £81.60 £120.96 £53.33
Table 12: Average capital cost per tonne CO2 saved
4.3 Total cost per tonne including management assumptions
A key issue with the costs assumed in all scenarios is that they do not take account of the marketing and management costs associated with delivery of measures. Experience from previous energy efficiency retrofit programmes, in particular those targeted at the private sector is that there are significant promotional costs associated with recruiting projects for measures to be applied to. As described above, estimating the management cost associated with administering the schemes is difficult. For the purposes of this study a range of management cost estimates have been assumed. A low estimate of 12.5% uplift has been based on the management cost associated with previous carbon saving programmes in Lewisham. The high estimate of 70% has been based on the additional cost assumptions developed as part of the Final Stage Impact Assessment for the Green Deal and Energy Company Obligation (2012).
28 This figure is based on data provided by Lewisham Council based on RE:FIT assessments which assumed an average figure of
£1200 for whole school retrofit projects. It also assumes an average measure lifespan of 22.5 years (reflecting 50% of savings
from fabric measures with an assumed lifetime of 30 years and 50% from services measures with an assumed lifetime of 15
years. Furthermore it is assumed that all the required CO2 savings can be achieved from schools.

Page 39 of 55
Scenario
Average cost per tonne of CO2 saved including management costs
Basket 1: All measures, all
sectors
Basket 2: Lewisham Homes only
Basket 3: ECO ‘top up’ all sectors
Basket 4: : ECO ‘top up’ in Lewisham Homes only
Basket 5: Schools
Low High Low High Low High Low High Low High
1. Proposed Building Regulations only
£10 £15 £45 £68 £90 £136 £91 £138 £60 £91
2. London Plan / Lewisham Core Strategy to 2016/2019 and proposed Building Regulations thereafter
£10 £15 £52 £78 £91 £137 £91 £138 £60 £91
3. Lewisham Planning Policy
£10 £16 £69 £104 £92 £139 £136 £206 £60 £91
Table 13: Average cost per tonne of CO2 saved including management costs
4.4 Cost to developers
The table below converts the average cost per tonne of carbon into a cost that the developer will be expected to pay to offset annual residual emissions over the assumed 30 year period.
This has been done by dividing the estimated average annual cost per tonne of carbon to be offset), by the residual carbon per m2 requiring offset for each development type (for residential properties this has also been illustrated per unit at 67m2). This has then been multiplied by 30 years to establish the total cost of offsetting the total lifetime residual emissions – a period of 30 years has been chosen as this is the standard average lifetime assumed for offset measures. It has assumed the higher management costs are included.
It should also be noted that the cost per tonne of carbon is calculated based on the total cost of measures to offset all the residual emissions over the plan period. However, the residual emissions requiring offsetting change in line with the policy (in 2016 and 2019), as such, the cost to the developer changes at each of these points.
Table 14: Indicative cost of carbon: Residential – 2013‐2016

Page 40 of 55
Basket 1: All measures, all
sectors
Basket 2: Lewisham Homes only
Basket 3: ECO ‘top up’ all sectors
Basket 4: ECO ‘top up’ in Lewisham Homes only
Basket 5: Schools
Scenario Cost per m2
Cost per
Unit29
Cost per m2
Cost per Unit
Cost per m2
Cost per Unit
Cost per m2
Cost per Unit
Cost per m2
Cost per Unit
1. Proposed Building Regulations only
N/A N/A N/A N/A N/A N/A N/A N/A N/A N/A
2. London Plan / Lewisham Core Strategy to 2016/2019 and proposed Building Regulations thereafter
£0.99 £66.65 £5.24 £351.26 £9.20 £616.46 £9.28 £621.49 £6.09 £407.97
3. Lewisham Planning Policy
£1.05 £70.63 £6.97 £466.83 £9.32 £624.28 £13.81 £925.31 £6.09 £407.97
Table 15: Indicative cost of carbon: Residential – 2016 onwards
Basket 1: All measures, all
sectors
Basket 2: Lewisham Homes only
Basket 3: ECO ‘top up’ all sectors
Basket 4: : ECO ‘top up’ in Lewisham Homes only
Basket 5: Schools
Scenario Cost per m2
Cost per Unit
Cost per m2
Cost per Unit
Cost per m2
Cost per Unit
Cost per m2
Cost per Unit
Cost per m2
Cost per Unit
1. Proposed Building Regulations only
£6.10 £408.86 £28.59 £1,915.37 £57.30 £3,839.36 £57.83 £3,874.58 £38.08 £2,551.20
2. London Plan / Lewisham Core Strategy to 2016/2019 and proposed Building Regulations thereafter
£6.22 £416.77 £32.78 £2,196.58 £57.54 £3,854.90 £58.01 £3,886.39 £38.08 £2,551.20
3. Lewisham Planning Policy
£11.51 £771.25 £76.09 £5,097.79 £101.75 £6,817.11 £150.81 £10,104.39 £66.49 £4,455.08
Table 16: Indicative cost of carbon: Non‐domestic – 2013‐2019 29 Costs per Unit are based on a 67m2 flat

Page 41 of 55
Scenario Basket 1: All measures, all
sectors (Cost per m2)
Basket 2: Lewisham Homes only (Cost per m2)
Basket 3: ECO ‘top up’ all sectors
(Cost per m2)
Basket 4: : ECO ‘top up’ in Lewisham Homes only (Cost per m2)
Basket 5: Schools
(Cost per m2)
1. Proposed Building Regulations only
N/A N/A N/A N/A N/A
2. London Plan / Lewisham Core Strategy to 2016/2019 and proposed Building Regulations thereafter
£1.10 £5.80 £10.19 £10.27 £6.74
3. Lewisham Planning Policy
£1.17 £7.71 £10.31 £15.29 £6.74
Table 17: Indicative cost of carbon: Non‐domestic – 2019 onwards
Scenario Basket 1: All measures, all
sectors (Cost per m2)
Basket 2: Lewisham Homes only (Cost per m2)
Basket 3: ECO ‘top up’ all sectors
(Cost per m2)
Basket 4: : ECO ‘top up’ in Lewisham Homes only (Cost per m2)
Basket 5: Schools
(Cost per m2)
1. Proposed Building Regulations only
£7.55 £35.36 £70.88 £71.53 £47.10
2. London Plan / Lewisham Core Strategy to 2016/2019 and proposed Building Regulations thereafter
£7.69 £40.55 £71.17 £71.75 £47.10
3. Lewisham Planning Policy
£8.15 £53.90 £72.07 £106.83 £47.10
4.5 Testing viability to 2016 ‐ comparison with the cost of using PV
In the absence of an offset fund, developers would be expected to meet carbon reduction targets on site. For the period from 2013 to 2016 this would equate to an uplift from a 25% reduction in emissions above Building Regulations 2010 (from Lewisham Core Strategy Policy for Code for Sustainable Homes) to a 40% reduction in emissions over Building Regulations 2010 (as required by the London Plan). If the space were available, the most cost effective method of achieving this additional 15% reduction is likely to be through the use of PV. Consequently, the estimated cost of using PV to achieve this saving can be considered a reasonable proxy for the cost of delivering the London Plan policy. As the offset should ideally provide a more cost effective way of reducing carbon than onsite, the cost per tonne of carbon

Page 42 of 55
used within the fund should demonstrate greater carbon savings for an equivalent price than the PV proxy. This approach becomes less robust beyond 2016. This is because as carbon reduction targets ramp up further, the approach to achieving them becomes more complex; most likely requiring strategic infrastructure delivered across several sites.
To estimate the cost of using PV to achieve the additional 15% reduction in carbon, the Standard Assessment Procedure assumed output of 850kWh/kWp has been used along with a 0.8% annual degradation rate and a capital cost of £1,500 per kWp. Based on these assumptions the cost of achieving carbon savings through the use of PV is equivalent to around £3750 per tonne for one year of savings or £125 per tonne of lifetime savings assuming a 30 year life.
Tables 18 to 21 in the next section compare the cost per tonne of offsetting the residual emissions for each policy scenario with the cost of delivering the same saving using PV. They show that PV is generally a fairly expensive option that is considerably more costly than basket 1 (all sectors) and higher than both baskets 2 (Lewisham homes) and 5 (schools). Hovever focusing on measure that are not included in the package of measure available under ECO, results in a higher cost than the onsite PV option.
4.6 Testing viability beyond 2016 ‐ comparison with national benchmark of £46 per tonne
The most recent Government impact assessment for the Zero Carbon Homes policy30 used £46/tonne of residual carbon emissions as an illustrative figure of the cost that developers would need to pay to offset annual residual emissions. It also assumed that developers would be required to offset the emissions for a thirty year period. This cost was based on the Green Book average carbon abatement cost for the 30 year period from 2017 and was used as an illustrative figure as the aim of the policy is to ensure that the cost incurred by developers making payments for Allowable Solutions should not exceed the average cost of alternative abatement measures in the UK26. The actual price cap that would be adopted in policy has yet to be defined by Government. The £46/tonne figure is in present value terms, and assumes, in effect, that this is the cost that the developer would pay upfront on completion of each new dwelling.
The table below compares the notional £46/tonne figure with the cost per tonne of carbon generated using the baskets of measure for different sector and using PV as a proxy. The only basket of measures that falls below this figure is basket 1, which is open to the widest range of offset measures.
30 CLG, Zero Carbon Homes, Impact Assessment, May 2011

Page 43 of 55
Table 18: Indicative cost of carbon: Residential – 2013‐2016
Scenario
Basket 1: All measures, all
sectors Cost per m2
Basket 2: Lewisham Homes only Cost per m2
Basket 3: ECO ‘top up’ all sectors
Cost per m2
Basket 4: ECO ‘top up’ in Lewisham Homes only Cost per m2
Basket 5: Schools
Cost per m2
PV Proxy Cost per m2
National Benchmark of £46 per tonne Cost per m2
1. Proposed Building Regulations only
N/A N/A N/A N/A N/A N/A N/A
2. London Plan / Lewisham Core Strategy to 2016/2019 and proposed Building Regulations thereafter
£0.99 £5.24 £9.20 £9.28 £6.09 £8.40 £3.09
3. Lewisham Planning Policy
£1.05 £6.97 £9.32 £13.81 £6.09 £8.40 £3.09
Table 19: Indicative cost of carbon: Residential – 2016 onwards
Scenario
Basket 1: All measures, all
sectors Cost per m2
Basket 2: Lewisham Homes only Cost per m2
Basket 3: ECO ‘top up’ all sectors
Cost per m2
Basket 4: ECO ‘top up’ in Lewisham Homes only Cost per m2
Basket 5: Schools
Cost per m2
PV Proxy Cost per m2
National Benchmark of £46 per tonne Cost per m2
1. Proposed Building Regulations only
£6.10 £28.59 £57.30 £57.83 £38.08 £52.50 19.32
2. London Plan / Lewisham Core Strategy to 2016/2019 and proposed Building Regulations thereafter
£6.22 £32.78 £57.54 £58.01 £38.08 £52.50 19.32
3. Lewisham Planning Policy
£11.51 £76.09 £101.75 £150.81 £66.49 £52.50 33.74

Page 44 of 55
Table 20: Indicative cost of carbon: Non‐domestic – 2013‐2019
Scenario
Basket 1: All measures, all
sectors Cost per m2
Basket 2: Lewisham Homes only Cost per m2
Basket 3: ECO ‘top up’ all sectors
Cost per m2
Basket 4: ECO ‘top up’ in Lewisham Homes only Cost per m2
Basket 5: Schools
Cost per m2
PV Proxy Cost per m2
National Benchmark of £46 per tonne Cost per m2
1. Proposed Building Regulations only
N/A N/A N/A N/A N/A N/A N/A
2. London Plan / Lewisham Core Strategy to 2016/2019 and proposed Building Regulations thereafter
£1.10 £5.80 £10.19 £10.27 £6.74 £20.86 £7.68
3. Lewisham Planning Policy
£1.17 £7.71 £10.31 £15.29 £6.74 £20.86 £7.68
Table 21: Indicative cost of carbon: Non‐domestic – 2019 onwards
Scenario
Basket 1: All measures, all
sectors Cost per m2
Basket 2: Lewisham Homes only Cost per m2
Basket 3: ECO ‘top up’ all sectors
Cost per m2
Basket 4: ECO ‘top up’ in Lewisham Homes only Cost per m2
Basket 5: Schools
Cost per m2
PV Proxy Cost per m2
National Benchmark of £46 per tonne Cost per m2
1. Proposed Building Regulations only
£7.55 £35.36 £70.88 £71.53 £47.10 £81.70 £30.08
2. London Plan / Lewisham Core Strategy to 2016/2019 and proposed Building Regulations thereafter
£7.69 £40.55 £71.17 £71.75 £47.10 £81.70 £30.08
3. Lewisham Planning Policy
£8.15 £53.90 £72.07 £106.83 £47.10 £81.70 £30.08

Page 45 of 55
4.7 Fund structure
In lieu of any other mechanism that might be brought in as part of zero carbon policy associated with proposed changes to Building Regulations in 2016, the only legal mechanism open to local authorities to charge developers a variable rate is through Section 106 (s106) payments. The Community Infrastructure Levy (CIL), the other mechanism for charging developers, is not appropriate as it applies a fixed tariff that cannot take account of the variable rates of residual carbon emission to be offset. It is expected that s106 funds will be spent within 5 years of payment. Furthermore, after April 2014, s106 funds will no longer be allowed to be pooled. This means each s106 payment for offsetting residual emissions should technically pay for specific offset measures. This is more likely to be demonstrable within a programme of smaller offset measures such as homes retrofit; where a specific number of homes could be attributed to offsetting a particular development’s emissions. This becomes less straight forward when using offset funds to pay for a smaller number of large‐scale carbon reduction measures such as school retrofits or infrastructure installations.
Generating, appraising and verifying projects are likely to have the most significant impacts on fund management. There are three overarching approaches:
Open call – Opening to the widest range of opportunities and reducing State Aid restrictions
would be an open call for carbon reduction projects. This would however require the
development of assessment criteria on which to judge potential projects. For example,
applicants could be asked to demonstrate how they would achieve a particular carbon saving
for a fixed price or might request funding for particular activities. Table 22 below provides an
illustrative assessment proforma and weightings. There is a risk however with this approach
in that sufficient or appropriate projects might not come forward and, as such, Lewisham
Council will have less control over what is funded.
Lewisham Defined Projects – Targeting specific interventions has the greatest level of control
for Lewisham Council. Rules over public money funding the private sector is likely to restrict
working with private entities and there would be a smaller pool of potential projects which,
as highlighted above would raise the overall cost per tonne of carbon or, reduce the offset
ratio achievable within a viable price.
Developer defined – Removing the responsibility for project identification, delivery and
funding from the Council, developers could be conditioned to identify and deliver offset
projects themselves. Again the Council would have less control over the projects coming
forward but equally there would be less risk associated with fund management as this is
passed on to the developer, although there would need to be some form of verification that
developers had delivered the projects required.

Page 46 of 55
Project information required Weighting Rationale
Offset scheme project cost‐effectiveness (£/tCO2) = (A + B) / C
60 Cost per tonne of carbon should be the main factor in any competition of funding. Sub‐weights would favour fewer schemes with higher savings and provide a small incentive to keep admin costs low.
A. Offset Solutions allocation towards project technical implementation costs (£)
(35)
B. Offset Solutions allocation towards project administration overhead (capped at 10%)
(5)
C. Proportionate share of lifetime carbon savings (tCO2) (20)
Overall whole life project cost‐effectiveness (£year/tCO2) = D / E
15 Favours projects with higher overall carbon savings and cost‐effectiveness, taking account of bill savings, and other lifetime costs and income.
D. Discounted net costs (£) including admin (5)
E. Total lifetime carbon savings (tCO2) (10)
Additionality 10 Ensures scheme administrators have some information on which to make judgements about relative additionality of projects. Describe how project increases or brings forward carbon
savings compared to a Business As Usual baseline. (10)
Added value 15 Provides scope to give preference to projects that provide added value.
Additional community benefits, e.g. job creation, skills development
(10)
Good practice & sustainability: describe how the project meets applicable good practice and sustainability guidelines and avoids or appropriately manages adverse environmental impacts.
(5)
Table 22: Example assessment criteria
4.8 Relationship with ECO Funding
For the purposes of this study it was assumed that within baskets 3 and 4 where possible measure could be delivered using ECO funding they were. As such, these measures were excluded from the basket and the cost of carbon was calculated using the remaining measure available. However, it is likely that any proposed application for ECO funding made by Lewisham will result in a shortfall in funding. As such, there is an additional option where this offset fund is used to make up this shortfall. The cost per tonne of carbon therefore becomes a question of carbon accounting. If the carbon savings are attributed proportionally to each funding partner then the cost of carbon is simply related directly to the total cost divided by the total carbon saved. However, this gets more complicated if one or more funding partner (including the beneficiary) claims responsibility for delivering particularly measures, such as the cheapest ones. In this instance the cost of carbon would increase as the range of measure available to fund would be increasingly limited. Furthermore, the auction nature of the ECO brokerage scheme makes it difficult to ascertain real costs as the size of the fund is related to the willingness of the Energy Companies to buy the ‘lots’ of ‘ECO Carbon Saving Obligation’ offered by potential providers. As such creating a dynamic market.

Page 47 of 55
5 Options Appraisal and conclusions
5.1 Options appraisal
The following table provides an overview of the assumed costs, benefits and constraints of each basket of measures in achieving each of the different approaches to developing a cost of carbon:
Basket 1: All measures,
all sectors
Basket 2: Lewisham Homes only
Basket 3: ECO ‘top up’ all sectors
Basket 4: ECO ‘top up’ in Lewisham Homes
only
Basket 5: Schools
Cost
Lowest average capital
costs per residual
tonne
Low average capital
costs per residual
tonne
High average capital
costs per residual
tonne
Highest average capital
costs per residual
tonne
Middle average capital
costs per residual
tonne
PV proxy to 2016 Cheaper than PV Cheaper than PV More expensive than
PV
More expensive than
PV Cheaper than PV
Fund management issues
Restrictions of funding
private sector likely to
increase management
costs
Higher marketing costs
to attract schemes
Likely to increase fund
management costs
Projects within
Lewisham’s control
Needs coordination
alongside ECO funding
application
Needs coordination
alongside ECO funding
application
Projects within
Lewisham’s control
May be issues with
pooling s106 funding
Projects within
Lewisham’s control
Delivery issues
Only targets lowest
cost measures.
Reduces opportunities
for whole home
retrofit
Requires a large
number measures to
Only targets the lowest
cost measures. Less
impact on opportunity
for whole home
retrofit as part of
Council ALMO stock
should be accessible in
Support delivery of
hard to reach
measures
Requires a large
number measures to
be installed
Support delivery of
hard to reach
measures
Requires a large
number measures to
be installed
Small number of
projects within
Lewisham’s control.
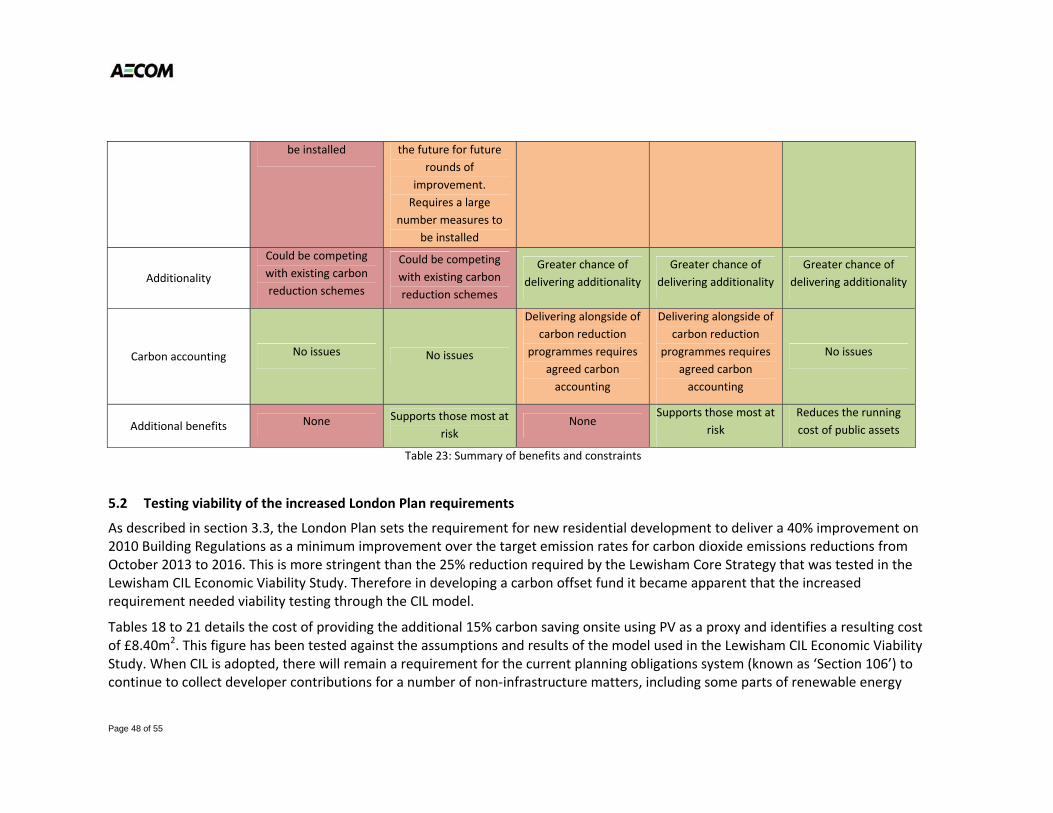
Page 48 of 55
be installed the future for future
rounds of
improvement.
Requires a large
number measures to
be installed
Additionality
Could be competing
with existing carbon
reduction schemes
Could be competing
with existing carbon
reduction schemes
Greater chance of
delivering additionality
Greater chance of
delivering additionality
Greater chance of
delivering additionality
Carbon accounting No issues No issues
Delivering alongside of
carbon reduction
programmes requires
agreed carbon
accounting
Delivering alongside of
carbon reduction
programmes requires
agreed carbon
accounting
No issues
Additional benefits None Supports those most at
risk None
Supports those most at
risk
Reduces the running
cost of public assets
Table 23: Summary of benefits and constraints
5.2 Testing viability of the increased London Plan requirements
As described in section 3.3, the London Plan sets the requirement for new residential development to deliver a 40% improvement on 2010 Building Regulations as a minimum improvement over the target emission rates for carbon dioxide emissions reductions from October 2013 to 2016. This is more stringent than the 25% reduction required by the Lewisham Core Strategy that was tested in the Lewisham CIL Economic Viability Study. Therefore in developing a carbon offset fund it became apparent that the increased requirement needed viability testing through the CIL model.
Tables 18 to 21 details the cost of providing the additional 15% carbon saving onsite using PV as a proxy and identifies a resulting cost of £8.40m2. This figure has been tested against the assumptions and results of the model used in the Lewisham CIL Economic Viability Study. When CIL is adopted, there will remain a requirement for the current planning obligations system (known as ‘Section 106’) to continue to collect developer contributions for a number of non‐infrastructure matters, including some parts of renewable energy

Page 49 of 55
provision. The CIL model includes £14.90 m2 to account for these residual Section 106 costs. Calculations by the London Borough31 of Lewisham show that it is expected that only half of this allowed cost will be required in most cases. The remaining half (£7.45m2) is available to support the £8.40m2 required to deliver the 15% increase in the carbon emissions reduction target without affecting the overall economic viability of development.
5.3 Conclusion
The Lewisham Core Strategy makes provision for developments that cannot meet carbon saving targets onsite to pay into an offset fund. This offset fund will, in turn, be used to deliver carbon savings elsewhere in the borough. To achieve carbon savings using offset measures that are equal to the residual emissions onsite, the cost per residual tonne is related to the cost of potential carbon saving measures available. This study has predicted the residual carbon emissions for three potential future policy and regulatory scenarios, before estimating a range of indicative costs per tonne of carbon to offset these residual emissions.
The indicative costs are based on the availability of different baskets of measures to deliver different funding priorities. As the different funding priorities restrict the suite of measures available within different baskets, the cost associated with each basket changes. The options appraisal highlights there are opportunities and issues with each of the different baskets of measures, but that an offset ratio of one can be delivered. Taking a flexible approach to combining baskets therefore offers the best chance to maximise external funding, offer additionality and address priorities on an ongoing basis. This will enable the rate to remain constant which offers developers certainty around the cost whilst maintaining flexibility about the most appropriate delivery mechanisms.
Similarly, as the amount of residual carbon increases, as in policy scenarios 2 and 3, the lower cost measures become exhausted quicker and more expensive measures are needed to achieve the desired savings. This is particularly evident post 2016 where in scenario 2 proposed Building Regulations become more stringent and in scenario 3 where Lewisham’s Core Strategy requires the equivalent of Code for Sustainable Homes Level 6.
Retaining development viability is also critical. Payment into an offset fund should not stifle the deliverability of development. As such, the potential to charge developers is restricted. To 2016, Baskets 1, 2 and 3 appear to be reasonable based on using PV as a proxy for alternative onsite delivery and in relation to previous CIL sensitivity testing. Post 2016 the cost of available offset measures in all baskets other than basket 1 cost more than using PV. However, it should be noted that it becomes less appropriate to use PV as a proxy for comparison beyond 2016 as it is unlikely that there would be sufficient space available to install the sufficient of PV cells to meet the higher reduction targets on site.
31 Agree with the London Borough of Lewisham at a meeting on 16th April 2013.

Page 50 of 55
The overall management and delivery of an offset fund will also affect the cost and the ability of the fund to achieve the required carbon savings. There are likely to be restrictions on providing public funding within the private sector. This is generally overcome by calling for applications for funding. However the evidence suggests that this has a tendency to increase fund management and marketing costs. Using the baskets of measures to take a flexible approach to balancing risks and opportunities will ensure delivery costs can be minimised and carbon reductions maximised.
It is for these reasons that a cost per residual tonne of carbon of £ £104 should be used. This would equate to a cost of £6.97per m2 for residential properties and £7.71 per m2 for non‐domestic. This figure balances maintaining a flexible approach for developers as to how they choose to meet the carbon reduction targets with a cost that can deliver carbon reduction projects within Lewisham. Post 2016 offset charges will need to be reviewed in light of development viability.

Page 51 of 55
Appendix
Basket 1: All measures, All Buildings
Sector
Measure Number of measures32
Total tonnes CO2 saved by measures per
annum
Lifetime cost/
tonne CO233
Domestic Public Other Add 80mm jacket to uninsulated cylinder 390 296 £2
Domestic Private Add 80mm jacket to uninsulated cylinder 1835 1,392 £2
Domestic Council Add 80mm jacket to uninsulated cylinder 649 492 £2
Domestic Public Other
Replace uninsulated cylinder with 80mm foam cylinder 390 325 £10
Domestic Council Replace uninsulated cylinder with 80mm foam cylinder 649 541 £10
Domestic Private Replace uninsulated cylinder with 80mm foam cylinder 1835 1,530 £10
Domestic Private Insulate loft from 0mm to 300mm 11109 12,826 £10
Domestic Public Other Insulate loft from 0mm to 300mm 2359 2,723 £10
Domestic Council Insulate loft from 0mm to 300mm 1656 1,912 £10
32 These figures represent the theoretical technical potential for numbers of installations in Lewisham’s homes 33 These costs do not allow for marketing and programme management costs

Page 52 of 55
Basket 2: All measures, Lewisham Homes only
Sector
Measure Number of measures34
Total tonnes CO2 saved by measures per
annum
Lifetime cost/
tonne CO235
Domestic Council Add 80mm jacket to uninsulated cylinder 649 492 £2
Domestic Council Replace uninsulated cylinder with 80mm foam cylinder 649 541 £10
Domestic Council Insulate loft from 0mm to 300mm 1656 1,912 £10
Domestic Council Block open chimneys 848 177 £12
Domestic Council Cavity wall insulation to pre 1975 cavity wall 2530 1,833 £14
Domestic Council Insulate loft from 12mm to 300mm 5 4 £15
Domestic Council Replace 12mm jacket cylinder with 80mm foam cylinder 542 229 £20
Domestic Council Cavity wall insulation to 1976‐1982 cavity wall 1400 558 £25
Domestic Council Replace 25mm jacket cylinder with 80mm foam cylinder 654 166 £33
Domestic Council Insulate loft from 50mm to 300mm 1232 361 £34
Domestic Council Add full controls (TRVs, room themostat) from programmer only 332 188 £41
Domestic Council Upgrade to full zone controls (TRVs, room themostat) from single programmer only 10 11 £45
Domestic Council Replace 12mm foam cylinder with 80mm foam cylinder 2193 399 £46
Domestic Council Insulate loft from 75mm to 300mm 358 68 £53
Domestic Council Upgrade to full controls (TRVs, programmer room themostat) from none 189 104 £55
Domestic Council Replace 38mm jacket cylinder with 80mm foam cylinder 164 25 £55
Domestic Council Replace 50mm jacket cylinder with 80mm foam cylinder 153 22 £59
Domestic Council Add hot water tank thermostat 5361 898 £60
Domestic Council Insulate 1900‐1966 stone main walls internally 10 17 £70
Domestic Council Insulate loft from 100mm to 300mm 1002 138 £72
Domestic Council Insulate pre 1975 system built walls internally 1589 1,704 £78
Domestic Council Replace Storage Heaters with A rated combi system, Gas in property 123 353 £81
Domestic Council Insulate pre 1975 solid main walls internally 7871 9,009 £83
Domestic Council Replace electric heaters with A rated combi system, Gas in property 133 356 £87
Domestic Council Single to dual immersion 378 72 £88
Domestic Council Fill and add internal insulation to empty pre 1975 cavity walls 2530 2,322 £98
34 These figures represent the theoretical technical potential for numbers of installations in Lewisham’s homes 35 These costs do not allow for marketing and programme management costs

Page 53 of 55
Basket 3: Limited Measures, All Buildings
Sector
Measure Number of measures36
Total tonnes CO2 saved by measures per
annum
Lifetime cost/
tonne CO237
Domestic Council Insulate 1900‐1966 stone main walls internally 10 17 £70
Domestic Public Other Insulate 1900‐1966 stone main walls internally 9 15 £70
Domestic Private Insulate 1900‐1966 stone main walls internally 42 69 £70
Standalone N/A Deliver a DHN at New Cross 1 1,500 £71
Domestic Council Insulate pre 1975 system built walls internally 1589 1,704 £78
Domestic Private Insulate pre 1975 system built walls internally 1102 1,181 £78
Domestic Public Other Insulate pre 1975 system built walls internally 234 251 £78
Domestic Council Insulate pre 1975 solid main walls internally 7871 9,009 £83
Domestic Private Insulate pre 1975 solid main walls internally 42079 48,165 £83
36 These figures represent the theoretical technical potential for numbers of installations in Lewisham’s homes 37 These costs do not allow for marketing and programme management costs

Page 54 of 55
Basket 4: Constrained measures, Lewisham Homes only
Sector
Measure Number of measures38
Total tonnes CO2 saved by measures per
annum
Lifetime cost/
tonne CO239
Domestic Council Insulate 1900‐1966 stone main walls internally 10 17 £70
Standalone N/A Deliver a DHN at New Cross 1 1,500 £71
Domestic Council Insulate pre 1975 system built walls internally 1589 1,704 £78
Domestic Council Insulate pre 1975 solid main walls internally 7871 9,009 £83
Domestic Council Insulate loft from 150mm to 300mm 859 84 £103
Domestic Council Insulate 1900‐1966 timber frame main walls internally 56 41 £110
Domestic Council Insulate 1900‐1966 stone main walls externally 10 17 £114
Domestic Council Install 2kWp system 1941 1,745 £237
Domestic Council Insulate pre 1975 system built walls externally 1589 1,704 £128
Domestic Council Upgrade community heating to Gas CHP, upgrade controls 1359 1,552 £146
Domestic Council Fill and add internal insulation to empty 1976‐1982 cavity walls 1400 768 £156
Domestic Council Externally insulate exposed floor 1058 362 £162
Domestic Council Upgrade regular E rated gas boiler to combi 2392 1,968 £194
Domestic Council Upgrade regular E rated gas boiler 2392 1,465 £196
38 These figures represent the theoretical technical potential for numbers of installations in Lewisham’s homes 39 These costs do not allow for marketing and programme management costs

Page 55 of 55
Basket 5: Schools
Sector
Measure Number of measures40
Total tonnes CO2 saved by measures per
annum
Lifetime cost/
tonne CO241
Non‐Domestic Council Whole building retrofit ? ? £53
40 These figures represent the theoretical technical potential for numbers of installations in Lewisham’s homes 41 These costs do not allow for marketing and programme management costs