developing a method for determining the mass balance … · developing a method for determining the...
TRANSCRIPT

Developing a Method for Determining the Mass Balance of Selenium and
Tellurium Bioprocessed by a Selenium-Resistant Bacterium Grown in the
Presence of Selenite or Tellurite
__________________
A Thesis
Presented to
The Faculty of the Department of Chemistry
Sam Houston State University
____________________
In Partial Fulfillment
Of the Requirements for the Degree of
Master of Science
____________________
by
Janet Horton Bius
December, 2001

Developing a Method for Determining the Mass Balance of Selenium and
Tellurium Bioprocessed by a Selenium-Resistant Bacterium Grown in the
Presence of Selenite or Tellurite
by
Janet Horton Bius
____________________
Approved:
_____________________________
Thomas G. Chasteen
____________________________
Mary F. Plishker
____________________________
Rick C. White
Approved:
____________________________
Brian Chapman, Dean
College of Arts and Sciences
II
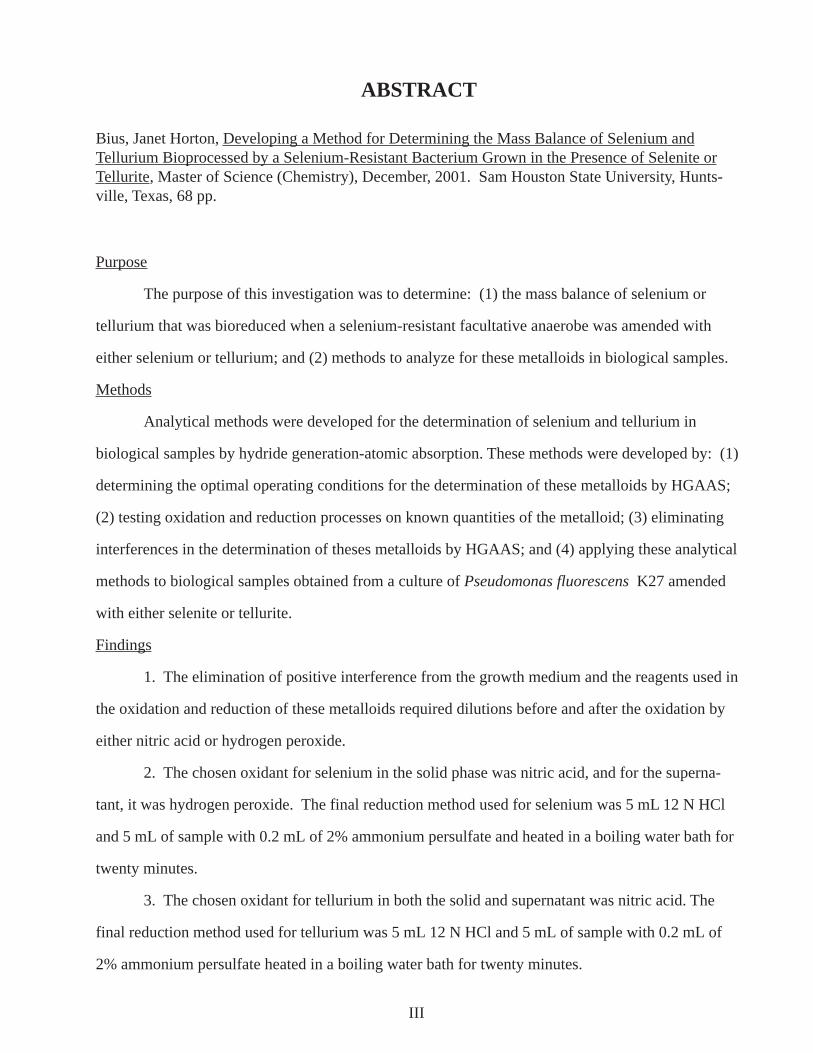
ABSTRACT
Bius, Janet Horton, Developing a Method for Determining the Mass Balance of Selenium andTellurium Bioprocessed by a Selenium-Resistant Bacterium Grown in the Presence of Selenite orTellurite, Master of Science (Chemistry), December, 2001. Sam Houston State University, Hunts-ville, Texas, 68 pp.
Purpose
The purpose of this investigation was to determine: (1) the mass balance of selenium or
tellurium that was bioreduced when a selenium-resistant facultative anaerobe was amended with
either selenium or tellurium; and (2) methods to analyze for these metalloids in biological samples.
Methods
Analytical methods were developed for the determination of selenium and tellurium in
biological samples by hydride generation-atomic absorption. These methods were developed by: (1)
determining the optimal operating conditions for the determination of these metalloids by HGAAS;
(2) testing oxidation and reduction processes on known quantities of the metalloid; (3) eliminating
interferences in the determination of theses metalloids by HGAAS; and (4) applying these analytical
methods to biological samples obtained from a culture of Pseudomonas fluorescens K27 amended
with either selenite or tellurite.
Findings
1. The elimination of positive interference from the growth medium and the reagents used in
the oxidation and reduction of these metalloids required dilutions before and after the oxidation by
either nitric acid or hydrogen peroxide.
2. The chosen oxidant for selenium in the solid phase was nitric acid, and for the superna-
tant, it was hydrogen peroxide. The final reduction method used for selenium was 5 mL 12 N HCl
and 5 mL of sample with 0.2 mL of 2% ammonium persulfate and heated in a boiling water bath for
twenty minutes.
3. The chosen oxidant for tellurium in both the solid and supernatant was nitric acid. The
final reduction method used for tellurium was 5 mL 12 N HCl and 5 mL of sample with 0.2 mL of
2% ammonium persulfate heated in a boiling water bath for twenty minutes.
III
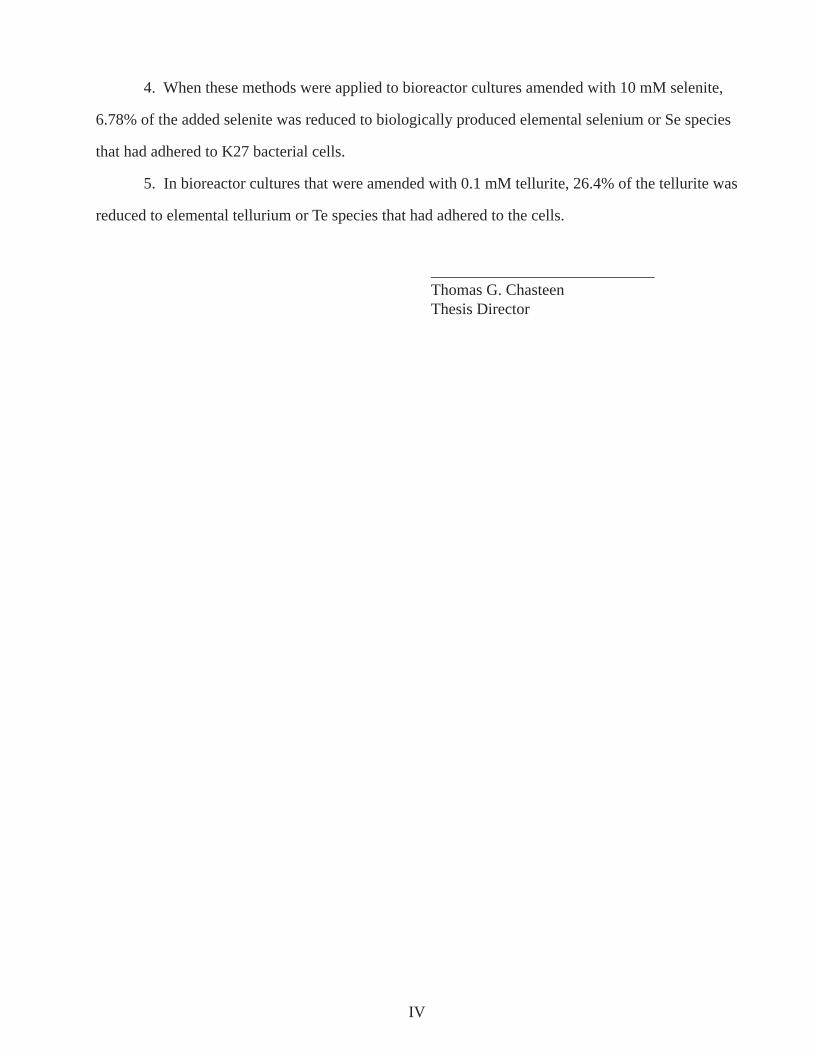
4. When these methods were applied to bioreactor cultures amended with 10 mM selenite,
6.78% of the added selenite was reduced to biologically produced elemental selenium or Se species
that had adhered to K27 bacterial cells.
5. In bioreactor cultures that were amended with 0.1 mM tellurite, 26.4% of the tellurite was
reduced to elemental tellurium or Te species that had adhered to the cells.
____________________________Thomas G. ChasteenThesis Director
IV

ACKNOWLEDGMENTS
A special thanks to Dr. Thomas G. Chasteen, I appreciate his patience while I honed my rusty lab
skills. I have learned many things from him and greatly admire his ability to share his knowledge of
chemistry.
I thank my lab mates: Lynn Erickson, Mehmet Akpolat, Jerry Swearingen, Suminda Hapuarachchi
and Rukma Basnayake. For these guys, no question was too small and no request too big. My life is
much richer for knowing them.
I thank Dr. Mary Lynn DeShazo for the many years of advice and the confidence that she has had in
me.
To Daniel and Will, my wonderful sons, I thank them for supporting my efforts to attend Sam Hous-
ton even when they could not conceive of anyone voluntarily going to school. They were patient
when mom’s mind was full of chemistry and not on what was for dinner.
To Ben, my husband, I thank him for all of his help in achieving a long held goal. I could not have
done it without him.
I dedicate this thesis to my family.
V

TABLE OF CONTENTS
ABSTRACT .............................................................................................................. iii
ACKNOWLEDGEMENTS ......................................................................................... v
TABLE OF CONTENTS............................................................................................. vi
LIST OF TABLES ...................................................................................................... vii
LIST OF FIGURES ..................................................................................................... ix
CHAPTERS
I INTRODUCTION................................................................................. 1
II EXPERIMENTAL ................................................................................ 7
III RESULTS ........................................................................................... 14
IV DISCUSSION AND CONCLUSIONS ............................................... 41
BIBLIOGRAPHY ...................................................................................................... 51
APPENDIX.
Chemical Abstract Service Registry Numbers ................................... 54
VITA ...........................................................................................................................55
VI

LIST OF TABLESTable I Comparison of specific growth rates of non-amended bioreactor cultures .... 15
Table II Comparison of specific growth rate (h-1) of 10 mM Na2SeO
3 amended
bioreactor cultures .......................................................................................... 16
Table III Oxidation methods used to achieve selenate oxyanion to be analyzed by atomic absorption spectrometry................................................................. 18
Table IV Fluid from a 10 mM Na2SeO
3 bioreactor experiment analyzed by
atomic absorption spectrometry for selenium in liquid and solid phase combined ........................................................................................................ 19
Table V Selenium concentration of bubbling tubes .................................................... 20
Table VI Known quantities of dimethyl diselenide oxidized with 30% hydrogen peroxide and determined by AAS................................................................... 21
Table VII Known quantities of dimethyl diselenide oxidized with 30% hydrogen peroxide over several different time spans and analyzed by AAS ................. 22
Table VIII Known quantities of Se(IV) detected by atomic absorption spectrometry ................................................................................................... 22
Table IX Oxidation and reduction methods tested on tellurium amended bioreactor fluid ................................................................................................................. 23
Table X Optimized conditions for the detection of tellurium by hydride generation-atomic absorption spectrometry ................................................... 24
Table XI 0.1 mM Na2TeO
3 bioreactor fluid: Amount of Te left in supernatant vs
amount in solid phase (Te0 or Te on/or in cells) ............................................. 25
Table XII Speciation of tellurium compounds in a 0.1 mM Na2TeO
4·2H
2O
bioreactor experiment ..................................................................................... 28
Table XIII The acid concentrations of sample solutions to determine optimum determination of selenium by HGAAS .......................................................... 29
Table XIV Determination of the linear range of calibration standards for hydride generation-atomic absorption spectrometry and optimum concentration of the reducing solution .................................................................................. 30
Table XV Comparison of 1.5% (w/w) NaBH4 and 0.6% (w/w) NaBH
4 solutions
in the determination of selenium concentration ............................................. 33
VII

Table XVI Testing of calibration standards with background correction on then of ..................................................................................................................... 31
Table XVII Various reduction methods applied to samples to test detection by hydride generation-atomic absorption spectrometry ...................................... 32
Table XVIII Reduction methods tested on a mixture of selenate and selenite ........... 33
Table XIX Testing mixtures of selenate and selenite to detect selenium in Se(IV) ... 34
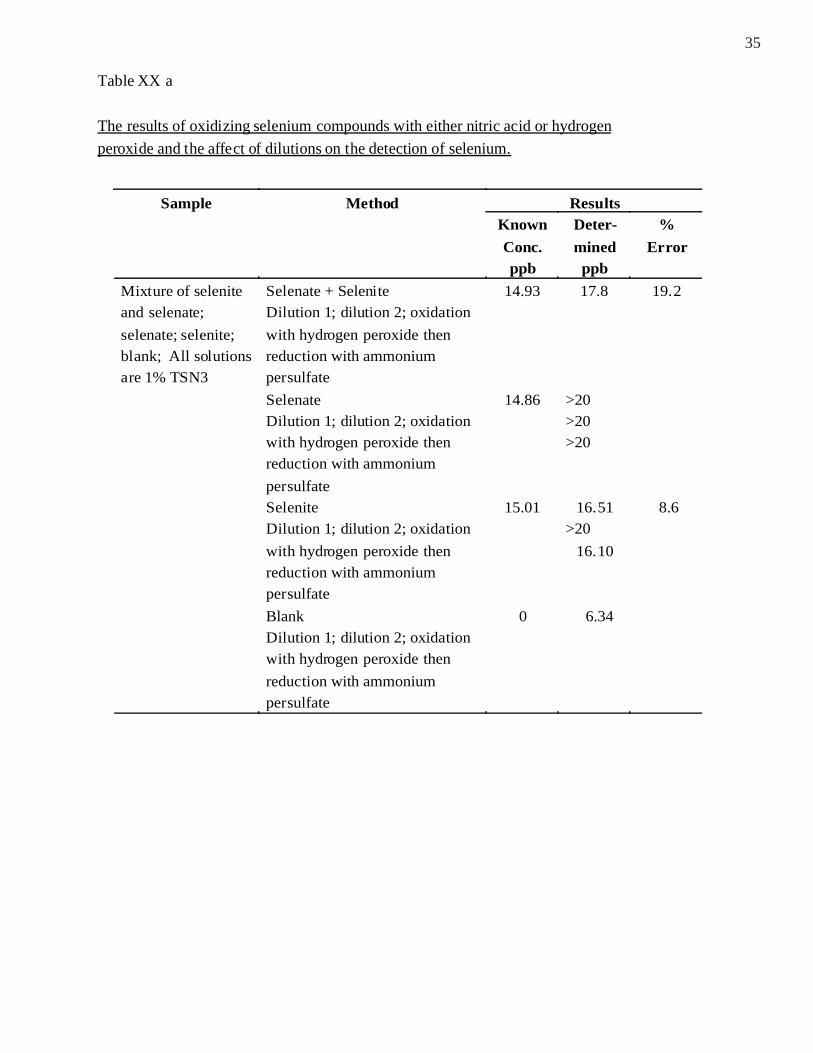
Table XX a The results of oxidizing selenium compounds with either nitric acid or hydrogen peroxide and the affect of dilutions on the detection of selenium.. 35
Table XX b The results of oxidizing selenium compounds with either nitric acid or hydrogen peroxide and the affect of dilutions on the detection of selenium.. 36
Table XX c The results of oxidizing selenium compounds with either nitric acid or hydrogen peroxide and the affect of dilutions on the detection of selenium.. 37
Table XX d The results of oxidizing selenium compounds with either nitric acid or hydrogen peroxide and the affect of dilutions on the detection of selenium.. 38
Table XXI Results of HGAAS determination of selenium from 10 mM Na2SeO
3
amended bioreactor experiments .................................................................... 39
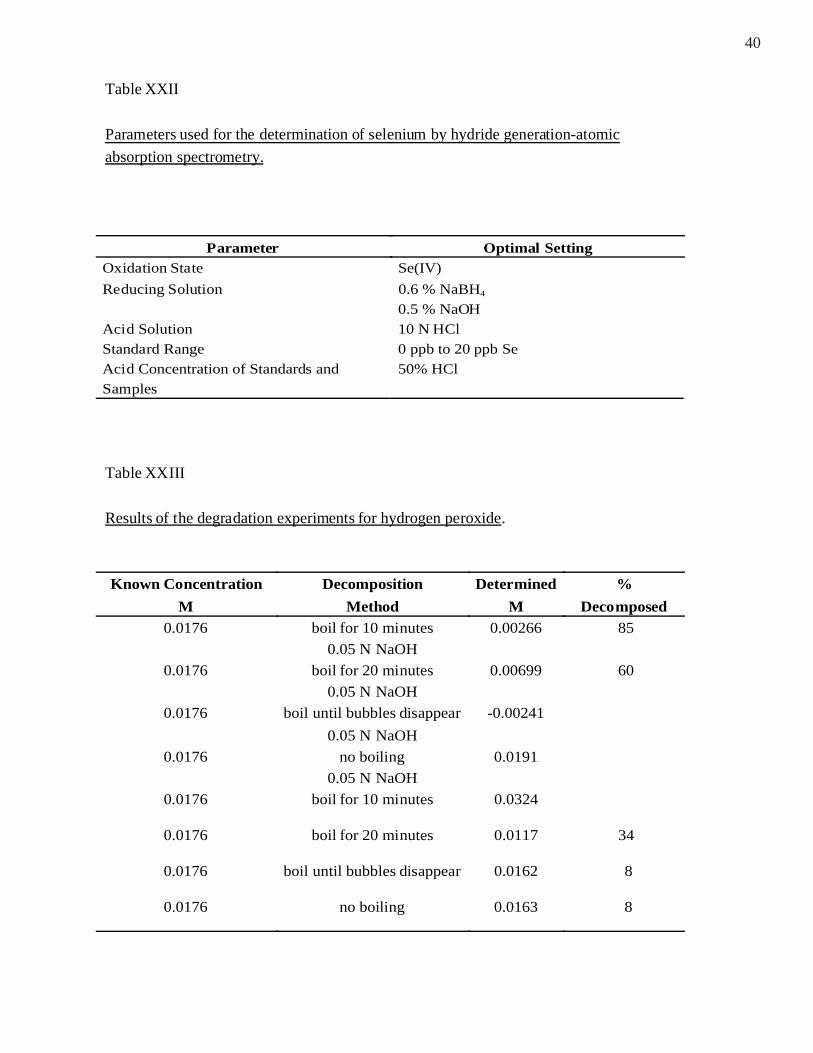
Table XXII Parameters used for the determination of selenium by hydride generation-atomic absorption spectrometry ................................................... 40
Table XXIII Results of the degradation experiments for hydrogen peroxide ............ 40
VIII

LIST OF FIGURESFigure 1. Cell growth vs. time of the K27 bacterium with no amendments added. N
2 means bioreactor purged with nitrogen gas ...................... 14
Figure 2. pH vs. time of control bioreactor experiments ................................ 15
Figure 3. Comparison of the cell growth in Pseudomonas fluorescens K27 amended with 10 mM Na
2SeO
3 vs. time ............................................ 15
Figure 4. pH of a 10 mM Na2SeO
3 amended K27 bioreactor culture vs.
time ..................................................................................................... 17
IX
1
Chapter I
Introduction
The relationship of selenium to the health of human and animal life presents a dichotomy. As
an essential element, selenium has a recommended daily requirement of 70 ug per day. At intake
levels above 350 ug per day, signs of overexposure to selenium begin to appear including garlic
breath (as dimethyl selenide), a metallic taste in the mouth, pallor and/or irritability (Shamberger,
1983).
Selenium probably occurs in small amounts in most soils (Reilly, 1996). The distribution of
selenium in soils is uneven and can range from 0.1 ug/g in soils deficient in selenium and up to 1
mg/g in soils with high concentrations. Soils containing high levels of selenium are called “selenif-
erous”. People living in seleniferous areas in South Dakota in the 1930s exhibited signs of selenium
exposure such as bad teeth and damaged nails. Children living in seleniferous regions in Venezuela
also had symptoms of selenosis, a disease caused by excess dietary selenium. The symptoms that
were present in these Venezuelan children included dermatitis, loose hair and damaged nails. En-
demic selenosis has appeared in seleniferous regions of China. In the 1960s, a disease of unknown
origin was reported in Enshi County, Hubei Province, China. The symptoms of this disease included
hair loss, skin lesions, and brittle, damaged nails that fell off. These villagers ate vegetables and
grains grown in seleniferous soils and these foods contained high concentrations of selenium (Reilly,
1996).
The first report of a disease caused by a deficient daily intake of selenium was in 1935 from
Keshan County, Heilongjiang Province in northeastern China (Reilly, 1996). Symptoms of this
disease included chest pain, vomiting and nausea. Characteristics of this disease, called Keshan
Disease (after the county in which it was first discovered), included cardiac enlargement and conges-
tive heart failure. It mainly affected young people under the age of 15 years and women of child-
bearing age. In this geographical area that includes Keshan County the soils are deficient in sele-
nium (Shamberger, 1983).
Keshan Disease could appear in people within three months of their moving into the Keshan
County area, and people who left the area did not seem to incur any more damage to their heart
2
muscles. Incidents of Keshan disease are almost completely eliminated by treating those at risk with
sodium selenite pills (Maas, 1998) or by adding selenised salt to the their diets. Selenised salt is
prepared by adding 15 mg of sodium selenite to every 1 kg of sodium chloride (Reilly, 1996).
Selenium as an environmental hazard was first recognized at the Kesterson Reservoir in the
San Joaquin Valley in California. The Kesterson Reservoir was the termination point of the 85-mile
long San Luis Drain and consisted of 12 interconnected holding ponds connected in series. The
reservoir was to serve two purposes: as an evaporation basin for agricultural drainage water and as a
managed wetland. From
1972-1978 the Kesterson Reservoir system received agricultural spill water that was relatively low
in dissolved minerals and salts, but by 1981 the Reservoir was receiving subsurface drainage water
high in salinity (Skorupa, 1998). This water contained selenium levels that averaged 300 ug/L.
Deformities and death of migratory waterfowl due to high levels of selenium in the holding ponds
began to appear, and the number of fish species declined to just one, the mosquitofish, Gambusia
affinis (Skorupa, 1998). The high levels of selenium were due to the concentration of salts and
minerals derived from drainage water from irrigated soils weathered from the Cretaceous rocks of
the California Coast Ranges (Parsons, 1987).
Another example of a high levels of selenium found in the environment includes Sweitzer
Lake which is located near Delta, Colorado, an area with natural seleniferous geological formations.
The lake also receives irrigation water and waters used in mining. It is not known whether the high
levels of selenium in the lake are a result of nature or of humans. Water samples taken in the late
1980s showed selenium levels of 10 to 24 ug/L. Water samples tested in 1995 contained 24 ug/L of
selenium. Aquatic fauna and flora also contained high levels of selenium (Skorupa, 1998).
Selenium can exist in water soluble forms such as selenate or selenite. It can form organose-
lenium compounds such as dimethyl selenide, a volatile molecule that has a Henry’s law constant
(Kh) of 0.0879 at 25 °C (Gürleyük, 1996). The elemental, metallic form of selenium is insoluble.
Selenium can exist in several different oxidation states. It can exist as Se(VI) in selenates
(SeO42-), as Se(IV) in selenites (SeO
32-), Se(0) in elemental selenium, and as
(-II) in selenides such as hydrogen selenide (H2Se) or organic selenides (CH
3SeCH
3, CH
3SeSeCH
3).
3
Selenium in the VI oxidation state is considered to be stable under both acidic and alkaline condi-
tions.
Pseudomonas fluorescens K27 is a selenium-resistant bacteria that was isolated from the
Kesterson Reservoir in the San Joaquin Valley of California by Ray Fall at the University of Colo-
rado, Boulder in the 1980s. Pseudomonas fluorescens K27 is a facultative anaerobe that reduces and
methylates selenium under anaerobic conditions (Zhang and Chasteen, 1994). Products of this
reduction include elemental selenium and volatile organoselenium compounds such as dimethyl
diselenide (CH3SeSeCH
3) and dimethyl selenide (CH
3SeCH
3)
When Pseudomonas fluorescens K27 is amended with equivalent molar amounts of sodium
selenate, higher gas phase concentrations (ppbv) of volatile organoselenium compounds are pro-
duced than when it is amended with sodium selenite (Yu, 1996). The reduction of selenite by
Pseudomonas fluorescens K27 produced more elemental selenium than volatile selenium com-
pounds (Chasteen et al., 1990; Yu, 1996). The mechanism of bioreduction for selenium is not
known. Selenium can be used either as an electron acceptor in a detoxification mechanism or possi-
bly as a terminal step in anaerobic respiration by this bacteria as has been determined for Pseudomo-
nas sp. AX (Macy et al., 1989; Rech and Macy, 1992).
The toxicity of selenium depends upon its chemical form. Selenium in the form of Se(IV) is
more toxic to most organisms than selenium in the form of Se(VI). Elemental selenium is not
bioavailable; that is, it is not readily absorbed by most organisms. Yu et al. (1997) reported the
relative toxicity of selenium compounds on Pseudomonas fluorescens K27. Selenate is more toxic
to K27 bacteria than selenite is (using EC50
values: 53 ppm selenate, 412 ppb selenite), but the
bacteria can survive at higher concentrations of selenate (15800 ppm) than of selenite (3950 ppm)
(Yu et al., 1997).
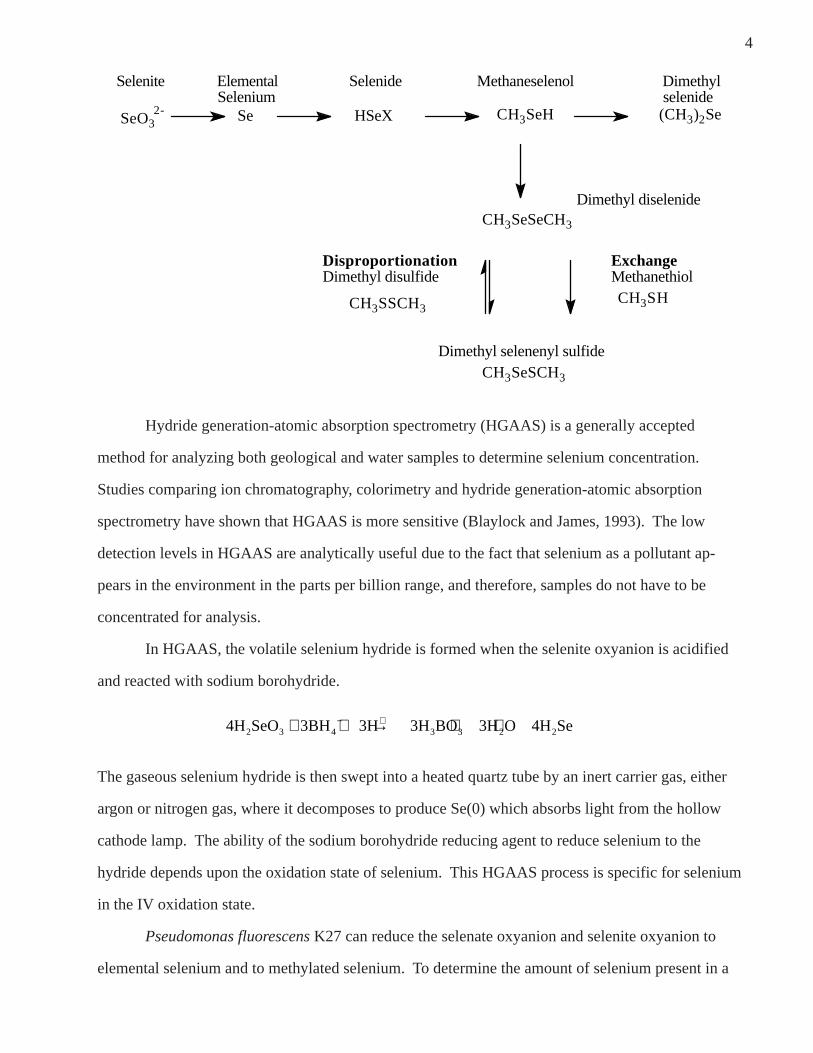
A proposed mechanism of selenium reduction (shown below) that would explain the presence
of elemental selenium and the production of methylated selenium compounds was presented by
Doran (1982) and later modified by Chasteen (1993).
4
SeO32- Se HSeX CH3SeH (CH3)2Se
CH3SeSeCH3
Selenite ElementalSelenium
Selenide Methaneselenol Dimethylselenide
Dimethyl diselenide
CH3SeSCH3
Dimethyl selenenyl sulfide
DisproportionationDimethyl disulfide
CH3SSCH3
ExchangeMethanethiolCH3SH
Hydride generation-atomic absorption spectrometry (HGAAS) is a generally accepted
method for analyzing both geological and water samples to determine selenium concentration.
Studies comparing ion chromatography, colorimetry and hydride generation-atomic absorption
spectrometry have shown that HGAAS is more sensitive (Blaylock and James, 1993). The low
detection levels in HGAAS are analytically useful due to the fact that selenium as a pollutant ap-
pears in the environment in the parts per billion range, and therefore, samples do not have to be
concentrated for analysis.
In HGAAS, the volatile selenium hydride is formed when the selenite oxyanion is acidified
and reacted with sodium borohydride.
The gaseous selenium hydride is then swept into a heated quartz tube by an inert carrier gas, either
argon or nitrogen gas, where it decomposes to produce Se(0) which absorbs light from the hollow
cathode lamp. The ability of the sodium borohydride reducing agent to reduce selenium to the
hydride depends upon the oxidation state of selenium. This HGAAS process is specific for selenium
in the IV oxidation state.
Pseudomonas fluorescens K27 can reduce the selenate oxyanion and selenite oxyanion to
elemental selenium and to methylated selenium. To determine the amount of selenium present in a
4H SeO 3BH 3H 3H BO 3H O 4H Se2 3 4 3 3 2 2+ + → + +− +

5
sample using hydride-generation atomic absorption spectrometry, the selenium in the sample must
be in the IV oxidation state. In this work, methods of oxidation and reduction were employed to
convert each oxidation state of selenium to the IV oxidation state that can be utilized by hydride
generation-atomic absorption spectrometry.
Volatile selenium-containing compounds produced by the K27 bacterium when amended
with a selenium oxyanion have been previously determined in this research group and published (Yu
et al., 1997). The quantity of the amended selenium oxyanion that has been biotransformed has not
been determined. This was one focus of this research.
Methods were developed to determine the amount of selenium added as sodium selenite that
was biotransformed by the K27 bacteria into volatile organoselenium compounds and into elemental
selenium. Variables that affect the oxidation and reduction processes of the selenium compounds in
these methods were investigated. Different oxidizing reagents were tested to determine their ability
to oxidize selenium contained in biological samples. Several methods of reducing selenate to selen-
ite also were investigated. Possible interferences in hydride generation atomic absorption spectrom-
etry were also examined. The concentration of the reducing agent and the pH of the acid solution
used to generate the hydride of selenium were studied.
Tellurium is a member of the chalcogens, which also includes selenium. Tellurium and
selenium have similar chemical properties. Tellurium is used in the semi-conductor industry as a p-
type conductor, in thermoelectric devices, in the production of copper and stainless steel, and in
blasting caps. As more uses for tellurium are developed and it is harvested, purified and used indus-
trially, the possibility of tellurium becoming an environmental pollutant increases.
Tellurium can exist in several oxidation states. The oxidation states are Te(0) as in elemental
tellurium, Te(IV) as in the tellurites, Te(VI) as in the tellurates, and Te(-II) as in the tellurides.
Elemental selenium SeO SeOoxidation4
2 reduction3
2 → →− −
Selenate SeOreduction3
2 → −
Methylated selenium compounds SeO SeOoxidation4
2 reduction3
2 → →− −

6
Pseudomonas fluorescens K27 will reduce tellurium oxyanions to elemental tellurium and to organo-
tellurium compounds (Basnayake et al., 2001).
Methods were developed to determine the amount of tellurium oxyanion (added as sodium
tellurite) reduced by the K27 bacterium. Tellurium must be in the IV oxidation state to be analyzed
by hydride generation-atomic absorption spectrometry. Oxidizing reagents and methods of reduction
were tested in developing this method to determine tellurium by HGAAS.
To determine the mechanism of bioreduction, the fate of selenium or tellurium oxyanions
added to biological samples must be determined. If after amending a K27 bioreactor culture with
selenate and determining by hydride generation-atomic absorption spectrometry that only metallic
(elemental) selenium is present, the mechanism of reduction would have to favor a step that pro-
duces elemental selenium over a step that produces the selenite oxyanion. Before proposing the use
of the K27 bacteria as a possible treatment for selenium-polluted sites, the ability of this bacteria to
reduce and methylate selenium oxyanions must be determined.

7
Chapter II
Experimental
Reagents and Laboratory Products
Reagents obtained from Aldrich Chemicals (Milwaukee, WI USA) included selenium atomic
absorption standard, tellurium atomic absorption standard, sodium borohydride, ammonium
persulfate, sodium selenate, and sodium selenite. Sodium borohydride was obtained from Fisher
Scientific (Houston, TX, USA). Tryptic soy broth was obtained from DIFCO Laboratories (Detroit,
MI USA). Reagents purchased from VWR Scientific (Sugarland, TX USA) included of 30% hydro-
gen peroxide, and sodium hydroxide. Carrier gases such as argon (UHP) and nitrogen (UHP) were
purchased from Conroe Welding (Conroe, TX USA). Materials purchased from VWR Scientific
included the culture tubes and culture tube caps, Nalgene® Disposable Filter Unit with a pore size of
0.20 um and Tygon® tubing. Phenolic culture tube caps were obtained from Fisher Scientific
(Houston, TX, USA).
Bioreactor: Stock Solutions and Growth Media
Growth Media
The growth media, TSN3, used in all bioreactor experiments consisted of aqueous solutions
of 1% (w/v) tryptic soy broth with 0.3% (w/v) potassium nitrate. All growth media were sterilized
by autoclaving at 121 oC for 20 minutes.
Stock Solutions: Selenium
Sodium selenate stock solutions used for amending the batch cultures of K27 were prepared
by dissolving 5.1 g of sodium selenate in 100 mL of deionized water then filtering with a Nalgene
filter unit using a vacuum-pressure pump (Barnant Company Barrington, IL USA) to facilitate the
filtering. Filtering with the Nalgene filter with a 0.2 um pore size produced a sterile solution. When
added to the bioreactor with a total volume of 2.7 L, the concentration of sodium selenate was 10
mM. Sodium selenite stock solutions were prepared by dissolving 4.6 grams of sodium selenite in
100 mL of deionized water and sterile filtering. This resulted in a 10 mM sodium selenite concentra-
tion after addition to the bioreactor.

8
Stock Solutions: Tellurium
Sodium tellurite stock solutions used for amending the batch cultures of K27 were prepared
by dissolving 0.629 grams of sodium tellurite in 100 mL of deionized water. This solution was then
filter-sterilized as described above. When added to the bioreactor for a total volume of 2.7 L this
resulted in a 0.10 mM Na2TeO
3 concentration.
Flame Atomic Absorption Spectrometry
The atomic absorption spectrometry solutions used as calibration standards were prepared by
appropriate dilutions of the commercial selenium atomic absorption standard. This standard contains
1000 ppm selenium as SeO2. Calibrations standards were prepared in the 0 ppm Se to 50 ppm Se
range with 1% HCl (v/v).
Hydride Generation-Atomic Absorption Spectrometry
Calibration Standards: Selenium
The hydride generation-atomic absorption spectrometry calibration standards were prepared
by the appropriate dilutions of the commercial 1000 ppm Se atomic absorption standard and acidi-
fied with HCl. The range of calibration standards varied and ranged from 0 ppb Se to 100 ppb Se. A
range of HCl concentrations from 1%-50% (v/v) was examined to determine the optimal value.
Calibration Standards: Tellurium
Tellurium calibration standards were produced by the appropriate dilutions of the commercial
tellurium atomic absorption standard which contained 1000 ppm Te. Acid concentrations was 50%
(v/v). Standards ranged in concentration from 0 ppb Te to 20 ppb Te.
Reducing Solutions
The reducing agent for all hydride generation-atomic absorption spectrometry was sodium
borohydride stabilized with sodium hydroxide. The concentration of sodium borohydride needed for
optimum production of selenium hydride was a variable tested. The concentrations of sodium
9
borohydride tested ranged from 0.35% NaBH4 to 1.5% NaBH
4. The concentration of sodium hy-
droxide was 0.5% w/w.
Acid Solution for Formation of Selenium Hydride
For the production of selenium hydride by sodium borohydride, the solution must be acidi-
fied. Concentrations of 5 M and 10 M HCl were tested.
Instrumentation
Flame Atomic Absorption Spectrometry
A Varian SpectrAA 220 atomic absorption spectrometer was used for all atomic absorption
spectrometry and hydride generation-atomic absorption spectrometry. Conditions for flame atomic
absorption spectrometry were as follows: lamp current (10 mA), fuel (acetylene), oxidant (air), and
flame stoichiometry (highly reducing), Wavelength was 196.0 nm with a slit width of 1.0 nm.
Hydride Generation-Atomic Absorption Spectrometry
A Varian VGA-77 Vapor Generation accessory was used to produce the volatile metalloidal
hydrides. When the sample intake tube is placed in the sample, the VGA-77 pumps the sample to
the reaction coil where it is acidified and mixed with sodium borohydride pumped from a separate
reservoir. The resulting hydride is then measured by atomic absorption upon decomposition in a
flame-heated optical cell. Carrier gases used were nitrogen and argon with a flow rate of 100 mL/
minute. A Varian Mark V burner was used in conjunction with a fused silica absorption cell. Flow
rates of sodium borohydride and hydrochloric acid were 1.0 mL/min to 1.2 mL/min, and these rates
were checked periodically. Sample flow rate was 7 mL/min to 10 mL/min. The wavelength used for
selenium was 196.0 nm and for tellurium the wavelength was 214.3 nm.
Bioreactor
The bioreactor used for all experimentation was a New Brunswick BioFlow III Batch/Con-
tinuous Fermentor (Edison, NJ USA). The bioreactor is connected to a Digital Celebris model 4100
computer that records information from the bioreactor including dissolved oxygen levels, pH, agita-

10
tion speeds, and temperature. The computer or the bioreactor can control these variables. In all
experimentation the bioreactor controlled the temperature at 30 °C and the agitation speed at 200
rpm. The bioreactor and contents were sterilized in a 716 liter autoclave (Wisconsin Aluminum
Foundry Co., Inc., Manitowoc, WI USA) before any bioreactor runs.
Procedures
Bioreactor
There were several stages for the preparation of a bioreactor experiment:
• Inoculum Preparation. Two days before the start of an experiment, the preparation of the K27
inoculum was started. A 50 mL aliquot of growth medium was prepared and autoclaved
(Tuttnauer USA Co. LTD, NY USA). An isolated culture of Pseudomonas fluorescens K27 was
transferred from an agar plate to the 50 mL aliquot of sterile media. The top of the flask was
double foiled and placed in a water-bath shaker (New Brunswick Scientific Co., Inc., Edison, NJ
USA) where it was shaken vigorously and aerobically at 30 °C for 24 hours. The contents of this
flask were then transferred in a sterile manner to a 200 mL aliquot of sterilized growth media.
This 250 mL aliquot was placed in the water-bath shaker for another
24 hours and incubated aerobically. This was the inoculum for the bioreactor run.
• Preparation of the bioreactor. The bioreactor was disassembled and cleaned with bleach and
detergent before each experiment. The bioreactor was reassembled and filled with 2.35 L of
growth media and autoclaved. After the bioreactor cooled to room temperature, the K27 bacteria
were transferred to it in a sterile manner. Amendments were added in 100 mL aliquots at this
time.
Growth Rate Experiments
After the transfer of the bacteria and amendment, the bioreactor was purged for
5 minutes with nitrogen gas to produce anaerobic conditions. A small liquid sample was obtained
through the bioreactor’s liquid sampling port. This sample was used to measure the optical density
and the pH of the culture. The optical density [Spectronic 20D+ Spectrometer at 526 nm (Stone et

11
al., 1998)] and the pH of the sample (Corning Incorporated Science Products Division, Corning, NY
USA) were determined. Optical density and pH readings were made every hour during lag and log
growth phases until stationary phase was reached; this varied in time from five hours to eight hours.
Headspace gas sampling was done every hour beginning with 0 hours. A gas sample was
removed from the space above the bioreactor liquid by using a 1 mL
gas-tight syringe through a septum-lined gas sampling port. The gas syringe was inserted into the
hot injection port of the gas chromatograph and quickly injected to separate and detect any volatile
selenium compounds.
For experiments where the metalloid mass balance was to be determined, no liquid or gas
samples were taken during the experiment. The bioreactor was prepared in the same manner as in
the growth rate experiments with the addition of gas trapping apparatus connected to the end of the
gas condenser of the bioreactor. The gas trapping apparatus consisted of three bubbling tubes con-
nected in series (A, B & C). Each bubbling tube contained 15 mL of 30% to 3% H2O
2 with a con-
centration of 0.5 N NaOH. Nitrogen gas was purged through the bioreactor and through the bub-
bling tubes at a flow rate of 10 mL/min to 2 mL/min. Even though the flow rate into the bioreactor
was controlled with a needle-nose valve, it was difficult to maintain a systematic, controlled flow
rate. The error in this setting was approximately 52% to 100%.
At the end of 24 hours (bacteria was then in the stationary growth phase), four 25-mL well-
mixed, liquid samples were removed from the bioreactor and transferred to centrifuge tubes. The
bioreactor samples were tcentrifuged at 10000 X g for 20 minutes (Rech, 1992). The supernatant
was decanted, and the supernatant and solid stored at 5 °C until further processing.
Flame Atomic Absorption Spectrometry (FAAS)
The linear range tested for FAAS was 0 ppm to 100 ppm Se. A linear relationship existed
from 0 ppm Se to 50 ppm Se. This range was used for the remainder of FAAS experiments. All
samples and standards contained 1% HCl (v/v). FAAS detects selenium in the VI oxidation state.
Several methods were tested to determine the optimum oxidation methods for detection of selenium.
Known amounts of selenium in differing oxidation states were oxidized to Se(VI) by either boiling

12
in concentrated nitric acid or boiling in hydrogen peroxide.
Nitric acid was added in a 10 mL aliquot to a selenium sample, and the sample was boiled to
dryness. Another 10 mL aliquot of nitric acid was added, and again, the sample boiled to dryness.
The sample was diluted to a concentration within the calibration range.
Hydrogen peroxide was added to a selenium sample. The sample was boiled until fine
bubbles that represent hydrogen peroxide degradation disappeared. The sample was diluted to the
original volume then diluted to a concentration with the calibration range.
Hydride Generation-Atomic Absorption Spectrometry (HGAAS)
Hydride generation-atomic absorption spectrometry detects selenium in ug/L concentrations
(ppb). The calibration range for HGAAS was determined to be 0 ppb to 20 ppb Se. The oxidation
state of selenium must be IV for the formation of the hydride to occur. Processes had to be devel-
oped to find the optimum oxidation and reduction methods for the matrix and bacteria used in these
experiments. Several methods used in HGAAS have been reported(Dedina and Tsalev, 1995; Ameri-
can Public Health Association, 1989; Zhang and Frankenberger, Jr., 1999; Reddy et al., 1995; Terry
et al., 1992; Narasaki and Ikeda, 1984; Martens and Suarez, 1997; Cutter, 1978; Bujdos et al., 2000;
Zhang and Frankenberger, Jr., 2000; Cooke and Bruland, 1987; Zhang et al., 1999; Manning and
Burau, 1995; Diaz et al., 1996; Blaylock and James, 1993; Thompson-Eagle and Frankenberger, Jr.,
1990; Krivan et al., 1985). These methods were first tested with known quantities of selenium and
optimized methods applied to samples retrieved from the bioreactor. Oxidation methods using either
nitric acid or hydrogen peroxide, and variables such as boiling or not boiling, boiling times, etc.,
were tested.
Several reduction methods were examined and applied to known quantities of selenium.
These methods were then tried on selenium obtained from the bioreactor. Again variables such as
length of boiling, capped or uncapped test tubes while boiling, etc. were examined. The sequence of
oxidation, dilutions, and reduction was also a variable. The methods attempted and the variables
tested are listed in the results section.

13
Tellurium
Bioreactor
The preparation of the bioreactor for the tellurium experiments was the same as for the
selenium experiments except that no attempts were made to trap any headspace gases in bubbling
tubes. The condensing unit of the bioreactor was attached to a flask by way of tubing. The flask
contained bleach water to prevent any organotellurium compounds from escaping into the lab envi-
ronment. All these experiments were amended with 0.1 mM sodium tellurite.
Hydride Generation-Atomic Absorption Spectrometry
Hydride generation-atomic absorption spectrometry can be used to detect tellurium in the
range of 0 ppb to 20 ppb. The oxidation state of tellurium must be IV before the tellurium hydride
can be formed. The concentration of the sodium borohydride (reducing solution) was 0.35% stabi-
lized with 0.5% sodium hydroxide. The acid solution used in the formation of the hydride was 6 N
hydrochloric acid. The purge gas was either nitrogen or argon.
Methods of oxidation and reduction were tried on samples with known quantities of tellu-
rium. These processes were then tested on biological samples containing tellurium.

14
Chapter III
Results
Control Pseudomonas fluorescens K27 Experiments
Bioreactor experiments of non-amended (containing no selenium) Pseudomonas fluorescens
K27 were carried out to establish growth rate values, pH ranges, and production of headspace gases.
To determine the mass balance of the selenium added, the amount of selenium produced in the
headspace gases had to be quantified. Nitrogen gas was used to purge the bioreactor, sweeping any
selenium containing headspace gases into the bubbling tubes where these compounds would be
trapped and oxidized to selenate. The effect of purging with nitrogen gas on the growth of un-
amended K27 bacteria was investigated (Figure 1).
The specific growth rates of the control experiments were calculated to determine if purging
with nitrogen gas during the time course of the experiment had an effect on the bacterial growth rate.
Figure 1. Cell growth vs. time of the K27 bacterium with no amendments added.
N2 means bioreactor purged with nitrogen gas.
-1.8
-1.6
-1.4
-1.2
-1
-0.8
-0.6
-0.4
-0.2
-100 0 100 200 300 400 500
Cell Growth vs. TimeLn of Absorbance (4/26/99)Ln of ABsorbance (4/19/00)Ln of Absorbance N2 (2/16/00)
Ln
o
f A
bso
rba
nce
Time (minutes)
15
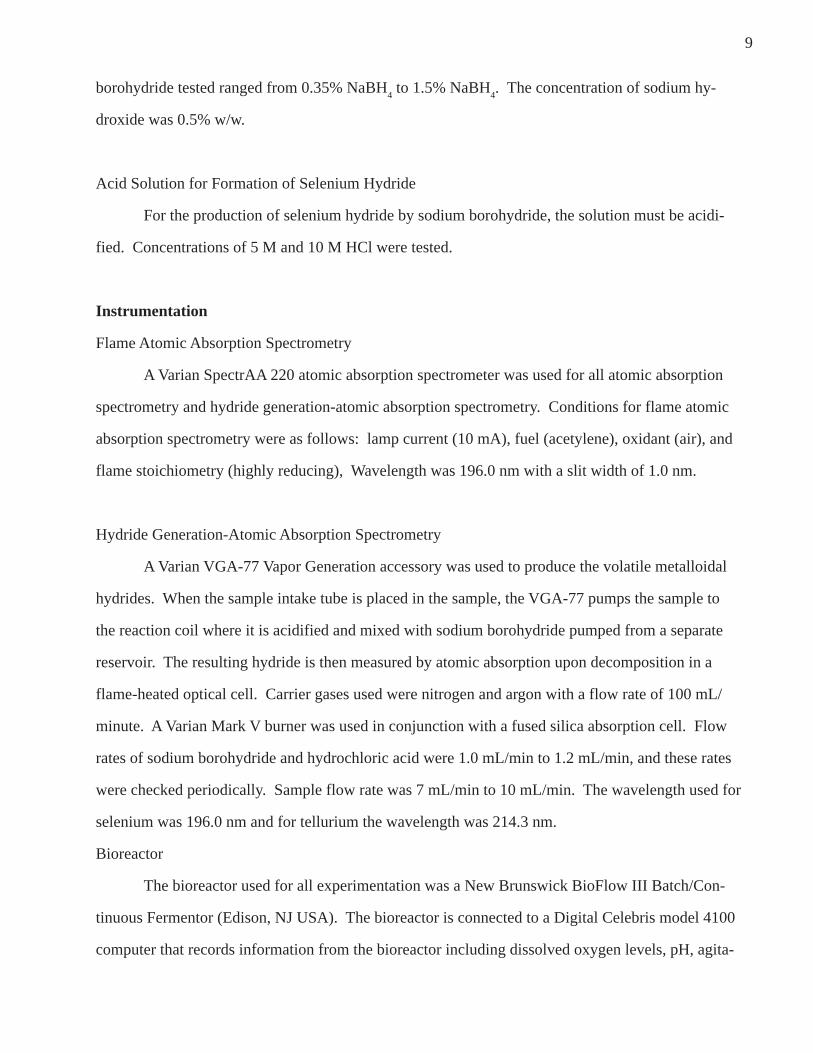
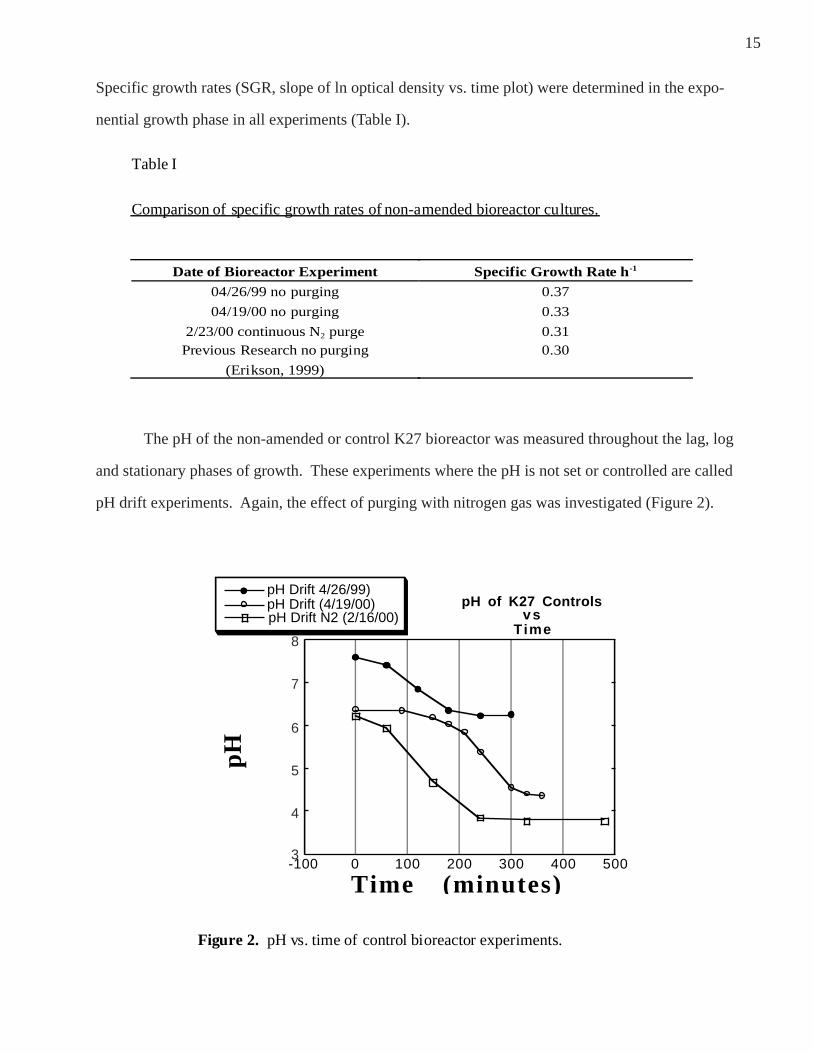
Specific growth rates (SGR, slope of ln optical density vs. time plot) were determined in the expo-
nential growth phase in all experiments (Table I).
The pH of the non-amended or control K27 bioreactor was measured throughout the lag, log
and stationary phases of growth. These experiments where the pH is not set or controlled are called
pH drift experiments. Again, the effect of purging with nitrogen gas was investigated (Figure 2).
Date of Bioreactor Experiment Specific Growth Rate h-1
04/26/99 no purging 0.37
04/19/00 no purging 0.33
2/23/00 continuous N2 purge 0.31Previous Research no purging
(Erikson, 1999)
0.30
Table I
Comparison of specific growth rates of non-amended bioreactor cultures.
3
4
5
6
7
8
-100 0 100 200 300 400 500
pH of K27 Controlsvs
Time
pH Drift 4/26/99)pH Drift (4/19/00)pH Drift N2 (2/16/00)
pH
Time (minutes)
Figure 2. pH vs. time of control bioreactor experiments.

16
Sodium Selenite Amended Pseudomonas fluorescens K27 Experiments
The pH and specific growth rate of Pseudomonas fluorescens K27 amended with a final
concentration of 10 mM Na2SeO
3 were determined for both N
2 purged and non-purged bioreactors.
The specific growth rates are shown in Table II, and the graphs of ln of optical density vs. time are in
Figure 3. The change in the pH in the bioreactor with time is displayed in Figure 4.
Figure 3. Comparison of the cell growth in Pseudomonas fluorescens K27 amended
with 10 mM Na2SeO3 vs. time.
-1.2
-1
-0.8
-0.6
-0.4
-0.2
0
0.2
0.4
-100 0 100 200 300 400 500
Cell Growth of K27 Bacterium Amended
with Selenitevs Time
Ln of Absorbance N2 (10/14/99)Ln of Absorbance N2 (11/10/99)
Ln o
f Abs
orba
nce
Time (minutes)
Table II
Comparison of specific growth rate (h-1) of 10 mM NasSeO3 amended bioreactor
cultures.
Bioreactor Experiment Specific Growth Rate h-1
09/22/99 10 mM Na2SeO3 no purging 0.10
10/14/99 10 mM Na2SeO3 continuous N2purging
0.19
11/10/99 10 mM Na2SeO3 continuous N2
purging
0.34
Previous Research amended but no
purging (Erikson, 1999)
0.19

17
6.8
7
7.2
7.4
7.6
7.8
8
8.2
8.4
-100 0 100 200 300 400 500
pH of Selenite Amended Bioreactor Culture of
K27 Bacterium vs Time
pH Drift N2 (10/14/99)pH Drift N2 (11/10/99)
pH
Tim e (minutes)
Figure 4. pH of a 10 mM Na2SeO3 amended K27 bioreactor culture vs. time.
Atomic Absorption Spectrometry
Varian (1989) states that 1.00 g of selenium metal dissolved in 80 mL of 50% (v/v) nitric acid
diluted to 1 liter produces a selenium standard for atomic absorption spectrometry. The treatment of
selenium metal with nitric acid produces the selenate oxyanion. The optimum working range is 5-
250 ug/mL (ppm) as per Varian.
The standards used for the atomic absorption spectrometry were produced by using a 1000
ppm Se atomic absorption standard in 1% (v/v) HCl. Dilutions were made to produce standards with
the concentration range of 0 ppm to 50 ppm Se with 1% (v/v) of HCl.
Atomic absorption spectrometry with nitric acid as the oxidant has been reported as useful in
the detection of selenium in biological samples (Lortie et al., 1992). Several techniques were used
to increase the accuracy of this detection method (Table III).
Hydrogen peroxide was used in the bubbling tubes of the bioreactor apparatus (Weres et al.,
1989). Hydrogen peroxide oxidizes the organoselenium compounds to Se(VI). Experiments were
performed that tested hydrogen peroxide as the oxidant (Table III). Percentage error was calculated
as 100-[(determined/known)x100].
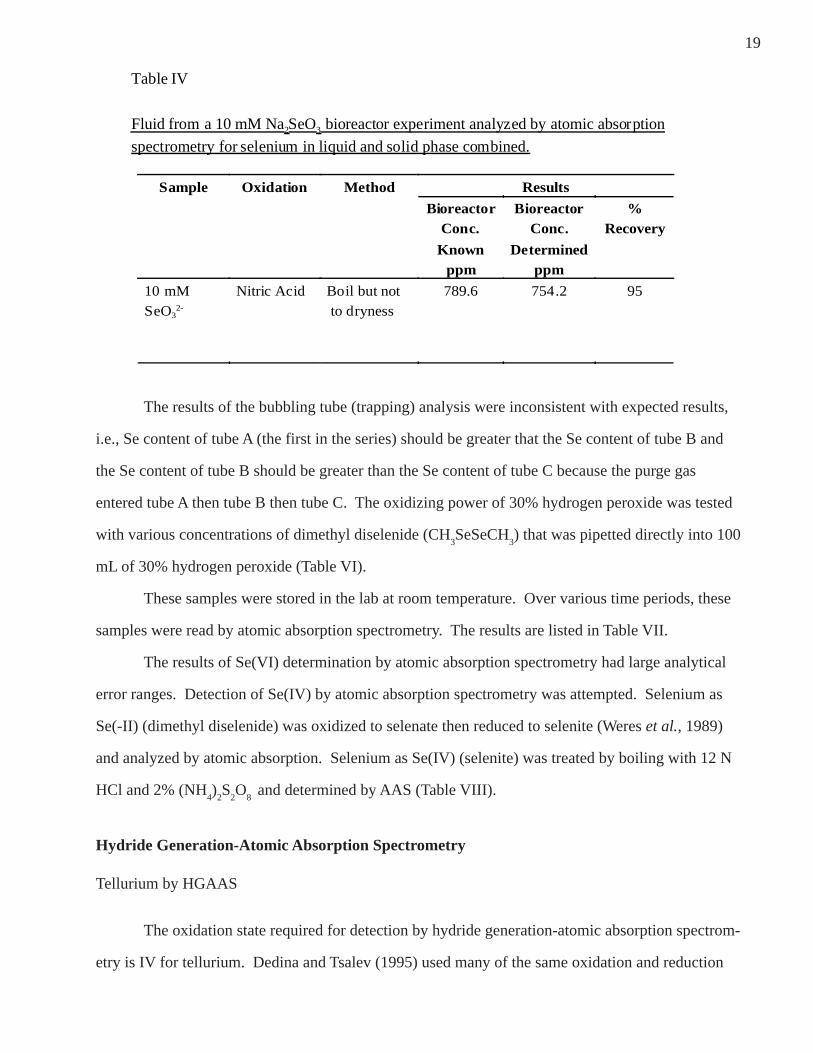
A sample from a bioreactor experiment which was amended to a 10 mM Na2SeO
3 final
concentration was analyzed by atomic absorption spectrometry. The results are listed in Table IV.

18
The amount of selenium detected was total selenium; no quantification of the various oxidation
states of selenium could be attempted because all selenium was oxidized to Se(VI).
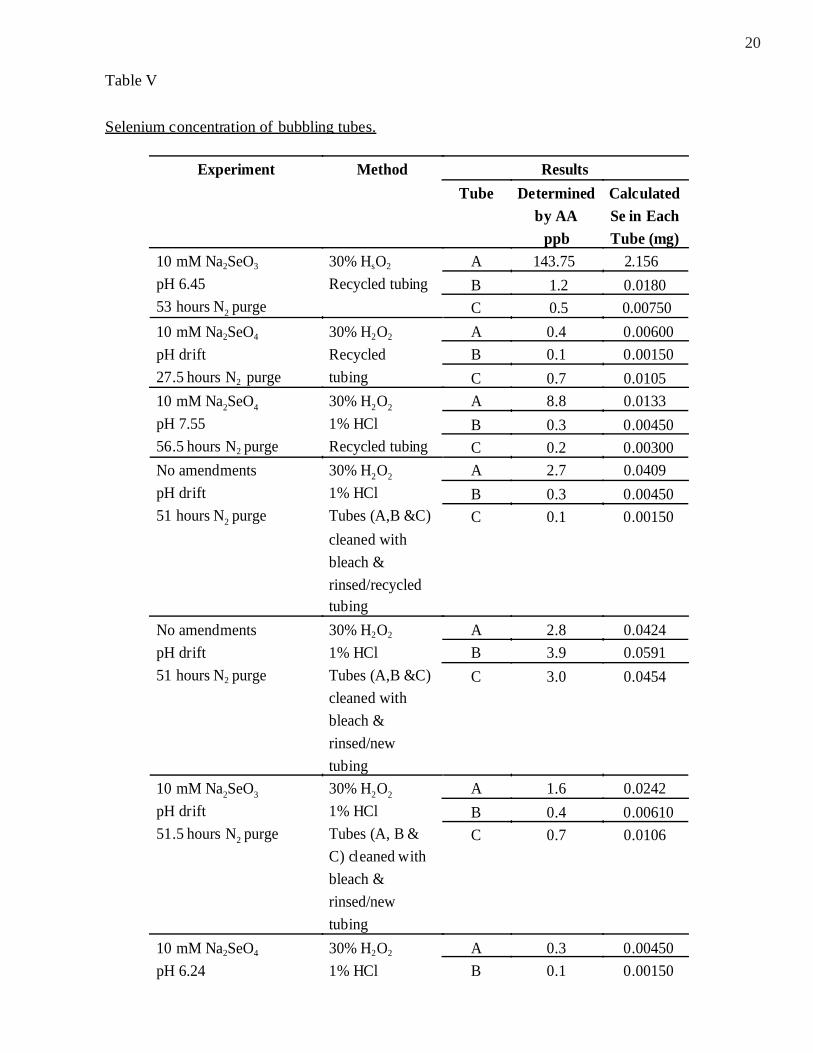
Bubbling tubes were attached by silicon tubing to the end of the condensing unit of the
bioreactor. Headspace gases which include organoselenium compounds were swept into the tubes
by purging the bioreactor with nitrogen gas. The hydrogen peroxide oxidized the organoselenium
compounds to selenate (Zhang and Frankenberger, 2000) which was then detected by atomic absorp-
tion spectrometry. These experimental results are shown in Table V.
Table III
Oxidation methods used to achieve selenate oxyanion to be analyzed by atomicabsorption spectrometry.
ResultsSample Oxidant Method
KnownConc.
ppm
Deter-mined
Conc.ppm
%Error
Se(0) Nitric
Acid
Add 10 mL of nitric acid & boil to
dryness; add 10 mL of nitric acid &boil to dryness then dilutions to
ppm range. Boil uncovered.
25 4.6 82
Se(0) NitricAcid
Add 10 mL of nitric acid & boil todryness; add 10 mL of nitric acid &
boil to dryness then dilutions toppm range. Boil in covered beaker.
25 0.7 97
Se(0) NitricAcid
Boil but not to dryness 30 26.8 11
Se(IV) NitricAcid
Boil but not to dryness 45 33.7 25
Se(VI) NitricAcid
Boil but not to dryness 15 14.1 6
Se(IV) 30%H2O2
Boil until H2O2 bubbles disappear 25 25 0
Se(IV) 15%
H2O2
Boil until H2O2 bubbles disappear 25 27.4 10
Se(IV) 5%
H2O2
boil until H2O2 bubbles disappear 25 28 12
19
The results of the bubbling tube (trapping) analysis were inconsistent with expected results,
i.e., Se content of tube A (the first in the series) should be greater that the Se content of tube B and
the Se content of tube B should be greater than the Se content of tube C because the purge gas
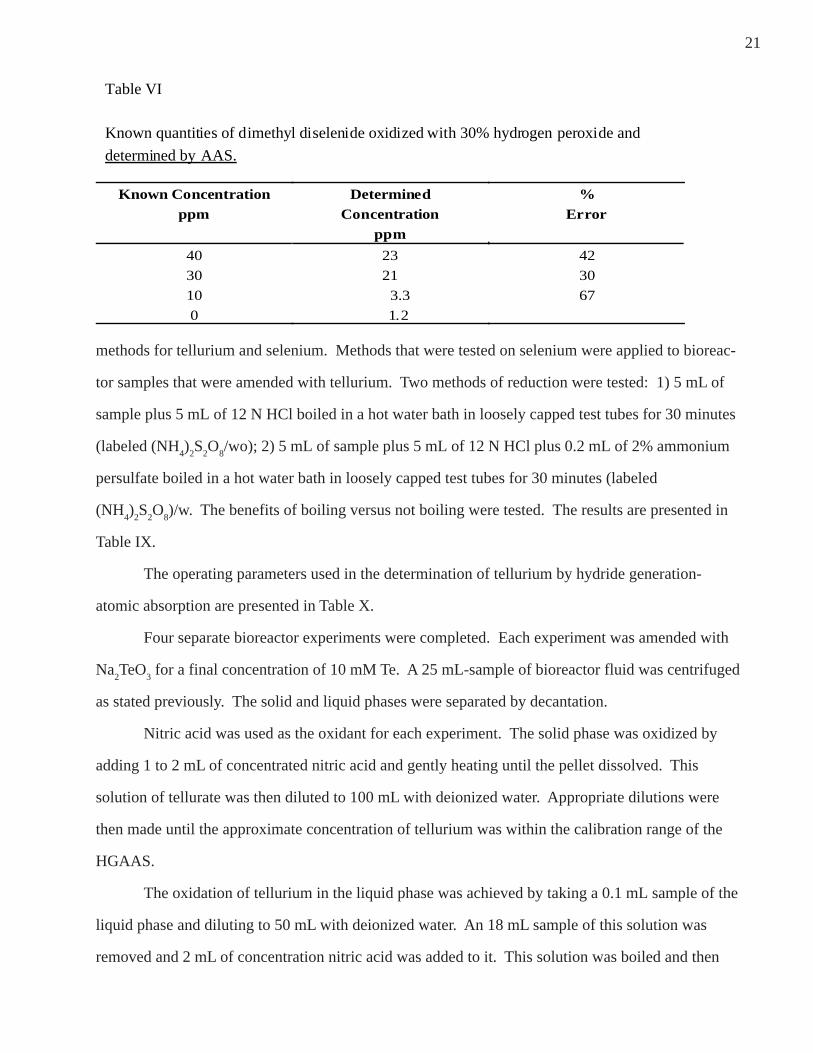
entered tube A then tube B then tube C. The oxidizing power of 30% hydrogen peroxide was tested
with various concentrations of dimethyl diselenide (CH3SeSeCH
3) that was pipetted directly into 100
mL of 30% hydrogen peroxide (Table VI).
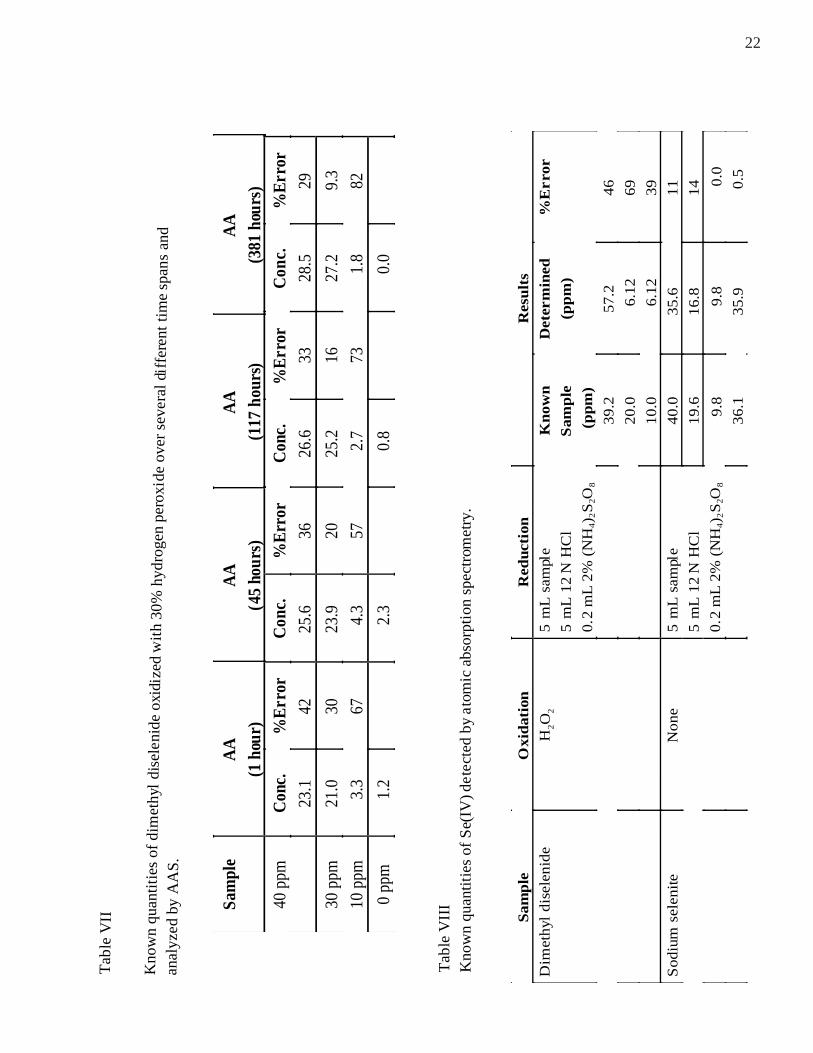
These samples were stored in the lab at room temperature. Over various time periods, these
samples were read by atomic absorption spectrometry. The results are listed in Table VII.
The results of Se(VI) determination by atomic absorption spectrometry had large analytical
error ranges. Detection of Se(IV) by atomic absorption spectrometry was attempted. Selenium as
Se(-II) (dimethyl diselenide) was oxidized to selenate then reduced to selenite (Weres et al., 1989)
and analyzed by atomic absorption. Selenium as Se(IV) (selenite) was treated by boiling with 12 N
HCl and 2% (NH4)
2S
2O
8 and determined by AAS (Table VIII).
Hydride Generation-Atomic Absorption Spectrometry
Tellurium by HGAAS
The oxidation state required for detection by hydride generation-atomic absorption spectrom-
etry is IV for tellurium. Dedina and Tsalev (1995) used many of the same oxidation and reduction
ResultsSample Oxidation Method
BioreactorConc.
Knownppm
BioreactorConc.
Determinedppm
%Recovery
10 mMSeO3
2-
Nitric Acid Boil but not to dryness
789.6 754.2 95
Table IV
Fluid from a 10 mM Na2SeO3 bioreactor experiment analyzed by atomic absorption
spectrometry for selenium in liquid and solid phase combined.
20
ResultsExperiment Method
Tube Determinedby AA
ppb
CalculatedSe in EachTube (mg)
A 143.75 2.156
B 1.2 0.0180
10 mM Na2SeO3
pH 6.45
53 hours N2 purge
30% HsO2
Recycled tubing
C 0.5 0.00750
A 0.4 0.00600
B 0.1 0.00150
10 mM Na2SeO4
pH drift
27.5 hours N2 purge
30% H2O2
Recycled
tubing C 0.7 0.0105
A 8.8 0.0133
B 0.3 0.00450
10 mM Na2SeO4
pH 7.55
56.5 hours N2 purge
30% H2O2
1% HCl
Recycled tubing C 0.2 0.00300
A 2.7 0.0409
B 0.3 0.00450
No amendments
pH drift
51 hours N2 purge
30% H2O2
1% HCl
Tubes (A,B &C)
cleaned with
bleach &
rinsed/recycledtubing
C 0.1 0.00150
A 2.8 0.0424
B 3.9 0.0591
No amendments
pH drift
51 hours N2 purge
30% H2O2
1% HCl
Tubes (A,B &C)
cleaned with
bleach &
rinsed/new
tubing
C 3.0 0.0454
A 1.6 0.0242
B 0.4 0.00610
10 mM Na2SeO3
pH drift
51.5 hours N2 purge
30% H2O2
1% HCl
Tubes (A, B &
C) cleaned with
bleach &
rinsed/new
tubing
C 0.7 0.0106
A 0.3 0.0045010 mM Na2SeO4
pH 6.24
30% H2O2
1% HCl B 0.1 0.00150
Table V
Selenium concentration of bubbling tubes.
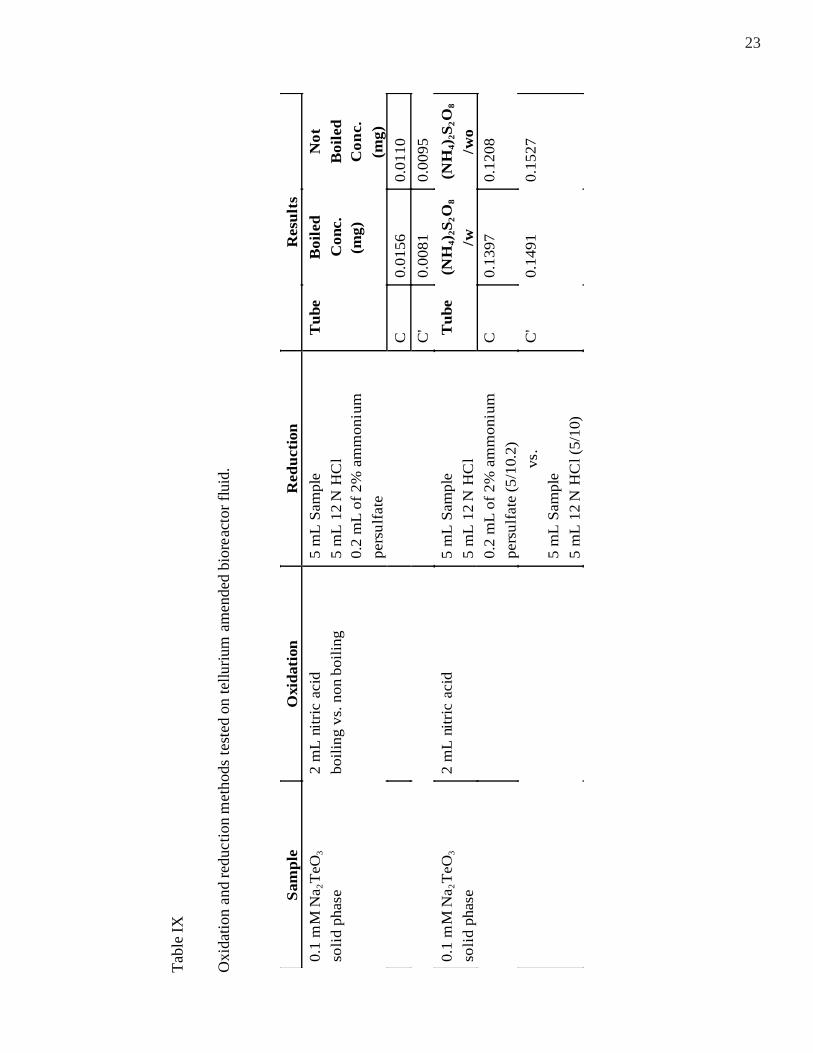
21
methods for tellurium and selenium. Methods that were tested on selenium were applied to bioreac-
tor samples that were amended with tellurium. Two methods of reduction were tested: 1) 5 mL of
sample plus 5 mL of 12 N HCl boiled in a hot water bath in loosely capped test tubes for 30 minutes
(labeled (NH4)
2S
2O
8/wo); 2) 5 mL of sample plus 5 mL of 12 N HCl plus 0.2 mL of 2% ammonium
persulfate boiled in a hot water bath in loosely capped test tubes for 30 minutes (labeled
(NH4)
2S
2O
8)/w. The benefits of boiling versus not boiling were tested. The results are presented in
Table IX.
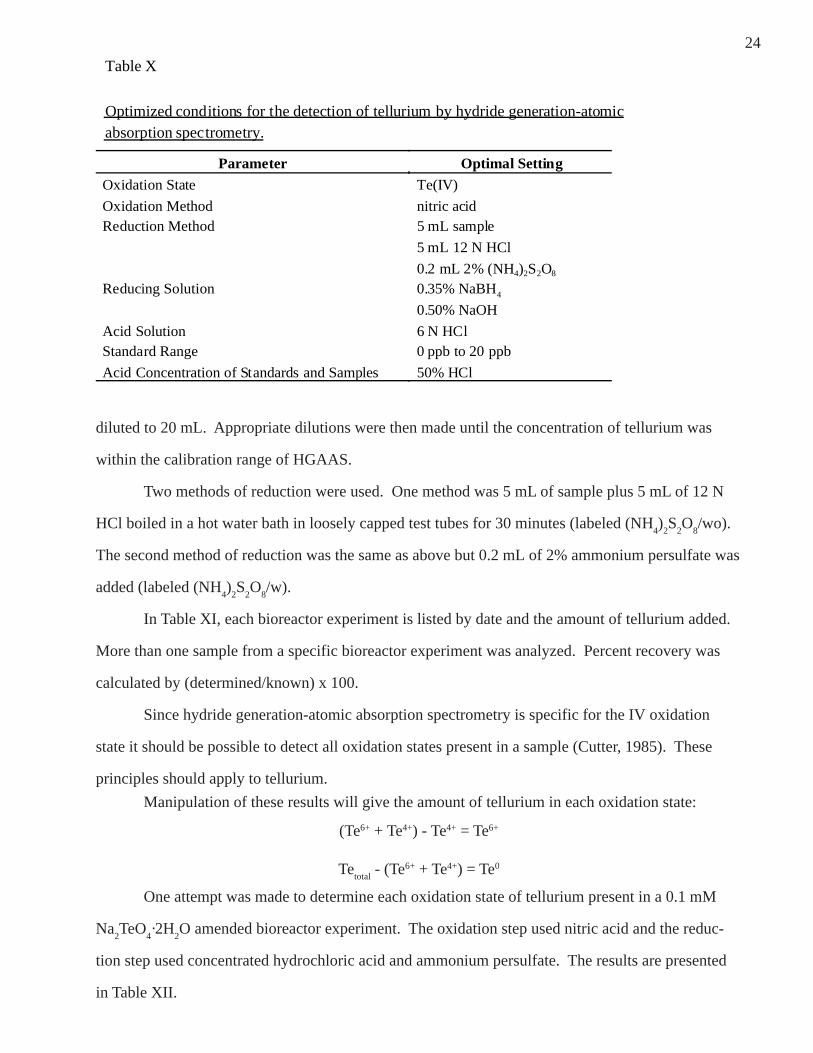
The operating parameters used in the determination of tellurium by hydride generation-
atomic absorption are presented in Table X.
Four separate bioreactor experiments were completed. Each experiment was amended with
Na2TeO
3 for a final concentration of 10 mM Te. A 25 mL-sample of bioreactor fluid was centrifuged
as stated previously. The solid and liquid phases were separated by decantation.
Nitric acid was used as the oxidant for each experiment. The solid phase was oxidized by
adding 1 to 2 mL of concentrated nitric acid and gently heating until the pellet dissolved. This
solution of tellurate was then diluted to 100 mL with deionized water. Appropriate dilutions were
then made until the approximate concentration of tellurium was within the calibration range of the
HGAAS.
The oxidation of tellurium in the liquid phase was achieved by taking a 0.1 mL sample of the
liquid phase and diluting to 50 mL with deionized water. An 18 mL sample of this solution was
removed and 2 mL of concentration nitric acid was added to it. This solution was boiled and then
Table VI
Known quantities of dimethyl diselenide oxidized with 30% hydrogen peroxide and
determined by AAS.
Known Concentrationppm
DeterminedConcentration
ppm
%Error
40 23 42
30 21 30
10 3.3 67
0 1.2
22
Ta
ble
VII
Know
n q
uantit
ies
of d
imeth
yl d
isel
enid
e o
xidi
zed w
ith 3
0%
hyd
rogen p
ero
xide o
ver
seve
ral d
iffe
rent
time s
pan
s and
analy
zed b
y A
AS
.
Sam
ple
AA
(1 h
our)
AA
(45
hour
s)A
A(1
17 h
ours
)A
A(3
81 h
ours
)C
onc.
%E
rror
Con
c.%
Err
orC
onc.
%E
rror
Con
c.%
Err
or40
ppm
23.1
4225
.636
26.6
3328
.529
30 p
pm21
.030
23.9
2025
.216
27.2
9.3
10 p
pm 3
.367
4.3
57 2
.773
1.8
82
0 pp
m 1
.2 2
.3 0
.8 0
.0
Ta
ble
VII
IK
now
n q
uantit
ies
of
Se(
IV) d
ete
cted b
y a
tom
ic a
bso
rptio
n s
pe
ctro
me
try.
Sam
ple
Oxi
datio
nR
ed
uctio
nR
esu
lts
Kno
wn
Sam
ple
(ppm
)
De
term
ine
d
(pp
m)
%E
rror
39
.25
7.2
46
20.0
6
.12
69
Dim
eth
yl d
isele
nid
eH 2O
25
mL
sa
mpl
e
5 m
L 1
2 N
HC
l
0.2
mL 2
% (
NH 4
) 2S
2O8
10.0
6
.12
39
40
.0
3
5.6
11
19
.6
1
6.8
14
9.8
9.8
0.0
So
diu
m s
ele
nite
No
ne
5 m
L s
am
ple
5 m
L 1
2 N
HC
l
0.2
mL 2
% (
NH 4
) 2S
2O8
36
.1
3
5.9
0
.5
23
Ta
ble
IX
Oxi
datio
n a
nd
redu
ctio
n m
eth
ods
test
ed o
n te
lluriu
m a
men
ded
bior
eac
tor
fluid
.
Sam
ple
Oxi
datio
nR
ed
uct
ion
Re
sults
Tu
beB
oile
dC
onc
.(m
g)
No
tB
oile
dC
on
c.(m
g)
C0
.01
56
0.0
11
0
0.1
mM
Na 2
Te
O3
solid
phase
2 m
L n
itric
aci
d
bo
ilin
g v
s. n
on
bo
ilin
g
5 m
L S
am
ple
5 m
L 1
2 N
HC
l0.2
mL
of 2
% a
mm
oniu
m
pe
rsu
lfate
C'
0.0
08
10
.00
95
Tu
be(N
H4)
2S2O
8
/w(N
H4)
2S2O
8
/wo
C0
.13
97
0.1
20
8
0.1
mM
Na 2
Te
O3
solid
phase
2 m
L n
itric
aci
d5
mL
Sa
mp
le
5 m
L 1
2 N
HC
l
0.2
mL
of 2
% a
mm
oniu
m
pe
rsu
lfate
(5
/10.2
)
vs.
5 m
L S
am
ple
5 m
L 1
2 N
HC
l (5
/10)
C'
0.1
49
10
.15
27
24
diluted to 20 mL. Appropriate dilutions were then made until the concentration of tellurium was
within the calibration range of HGAAS.
Two methods of reduction were used. One method was 5 mL of sample plus 5 mL of 12 N
HCl boiled in a hot water bath in loosely capped test tubes for 30 minutes (labeled (NH4)
2S
2O
8/wo).
The second method of reduction was the same as above but 0.2 mL of 2% ammonium persulfate was
added (labeled (NH4)
2S
2O
8/w).
In Table XI, each bioreactor experiment is listed by date and the amount of tellurium added.
More than one sample from a specific bioreactor experiment was analyzed. Percent recovery was
calculated by (determined/known) x 100.
Since hydride generation-atomic absorption spectrometry is specific for the IV oxidation
state it should be possible to detect all oxidation states present in a sample (Cutter, 1985). These
principles should apply to tellurium.
Manipulation of these results will give the amount of tellurium in each oxidation state:
(Te6+ + Te4+) - Te4+ = Te6+
Tetotal
- (Te6+ + Te4+) = Te0
One attempt was made to determine each oxidation state of tellurium present in a 0.1 mM
Na2TeO
4·2H
2O amended bioreactor experiment. The oxidation step used nitric acid and the reduc-
tion step used concentrated hydrochloric acid and ammonium persulfate. The results are presented
in Table XII.
Table X
Optimized conditions for the detection of tellurium by hydride generation-atomicabsorption spectrometry.
Parameter Optimal Setting
Oxidation State Te(IV)
Oxidation Method nitric acidReduction Method 5 mL sample
5 mL 12 N HCl
0.2 mL 2% (NH4)2S2O8
Reducing Solution 0.35% NaBH4
0.50% NaOH
Acid Solution 6 N HClStandard Range 0 ppb to 20 ppb
Acid Concentration of Standards and Samples 50% HCl

25
Selenium by HGAAS
The oxidation state of selenium detected by hydride generation-atomic absorption spectrom-
etry is IV. The linear range of calibration standards, concentration of reducing agent, acid levels of
standards, and oxidation/reduction methods were optimized for this method.
In Table XIII, the acid concentration of the samples was tested for optimum detection of
selenium. The standards were prepared by the appropriate dilutions of the atomic absorption stan-
dard and acidified to 1% (v/v) HCl. The samples were prepared by the appropriate dilutions of the
atomic absorption standard and acidified from 1% (v/v) to 50% (v/v) HCl.
The linear range for the calibration standards was determined by examining two Se ranges, 0
- 25 and 0 - 50 ppb Se. The standards were produced by diluting the atomic absorption standard to
the appropriate concentration and acidifying to 1% (v/v) HCl (Table XIV).
Experiment ResultsTube A Oxidation step includes boiling
Phase Te (mg) % in Phase
Solid 0.0156 17
Liquid 0.0749 83
Total/ 25 mL 0.0906 100
% Error = 71.6 %Recovery = 28.4
Tube A Oxidation step does not include boiling
Phase Te (mg) % in Phase
Solid 0.0110 13
Liquid 0.0749 87
Total/ 25 mL 0.0859 100
% Error = 73 % Recovery = 27
Tube B Oxidation step includes boiling
Phase Te (mg) % in Phase
Solid 0.00806 5
Liquid 0.155 95
Total/25 mL 0.163 100
07/31/00: 0.0598 g Na2TeO3
(0.319 mg/25 mL Te)
72 hours
% Error = 49 % Recovery = 51
Table XI
0.1 mM Na2TeO3 bioreactor fluid: Amount of Te left in supernatant vs. amount insolid phase (Te0 or Te on/or in cells).

26
Experiment Results
Tube B Oxidation step does not include boiling
Phase Te (mg) % in Phase
Solid 0.00949 6
Liquid 0.155 94
Total/25 mL 0.164 100
07/31/01: 0.0598 g Na2TeO3
continued
% Error = 49 % Recovery = 51
Tube A Reduction includes ammonium persulfate
Phase Te (mg) % in Phase
Solid 0.149 37
Liquid 0.236 63
Total/25 mL 0.385 100
% Error = 19 % Recovery = 119
Tube A Reduction without ammonium persulfate
Phase Te (mg) % in phase
Solid 0.121 34
Liquid 0.236 66
Total/25 mL 0.357 100
% Error = 10 % Recovery = 110
Tube B Reduction includes ammonium persulfate
Phase Te (mg) % in Phase
Solid 0.149 39
Liquid 0.236 61
Total/25 mL 0.385 100
% Error = 19 % Recovery = 119
Tube B Reduction without ammonium persulfate
Phase Te (mg) % in Phase
Solid 0.153 39
Liquid 0.236 61
Total/25 mL 0.389 100
08/01/00: 0.0618 g Na2TeO3
(0.324g mg/25 mL)
72 hours
% Error = 20 % Recovery = 120
Tube A
Phase Te (mg) % in Phase
Solid 0.0520 19
Liquid 0.226 81
Total/25 mL 0.278 100
08/08/00: 0.0629 g Na2TeO3
(0.366 mg/25 mL Te)
72 hours
% Error = 24 % Recovery = 76
Table XI continued
0.1 mM Na2TeO3 bioreactor fluid: Amount of Te left in supernatant vs. amount in
solid phase (Te0 or Te on/or in cells).

27
Table XI continued
0.1 mM Na2TeO3 bioreactor fluid: Amount of Te left in supernatant vs amount in solid phase(Te0 or Te on/or in cells).
Experiment Results
Tube A
Phase Te (mg) % in Phase
Solid 0.0552 20
Liquid 0.226 80
Total/25 mL 0.281 100
% Error = 23 % Recovery = 77
Tube B
Phase Te (mg) % in PhaseSolid 0.0483 16
Liquid 0.246 84
Total/25 mL 0.294 100
% Error = 20 % Recovery = 80
Tube B
Phase Te (mg) % in Phase
Solid 0.0514 17
Liquid 0.246 83
Total/25 mL 0.297 100
08/08/00: 0.0629 g Na2TeO3
(0.366 mg/25 mL Te)
72 hours
% Error = 19 % Recovery = 81
Tube A
Phase Te (mg) % in Phase
Solid 0.202 54
Liquid 0.174 46
Total/25 mL 0.376 100
% Error = 4 % Recovery = 104
Tube B
Phase Te (mg) % in Phase
Solid 0.106 26
Liquid 0.307 74
Total/25 mL 0.413 100
08/16/01: 0.0678 g Na2TeO3
(0.3615 mg/25 mL)72 hours
% Error = 14 % Recovery = 114

28
The concentration of reducing agent was determined by testing the same calibration stan-
dards under different concentrations of the sodium borohydride solution (Table XV).
For vapor generation work, Varian (1997), the manufacturer of the instrument, suggested that
using the background correction was not necessary. The standards were used as samples, and they
were tested with the background correction on and then with the background correction off (Table
XVI).
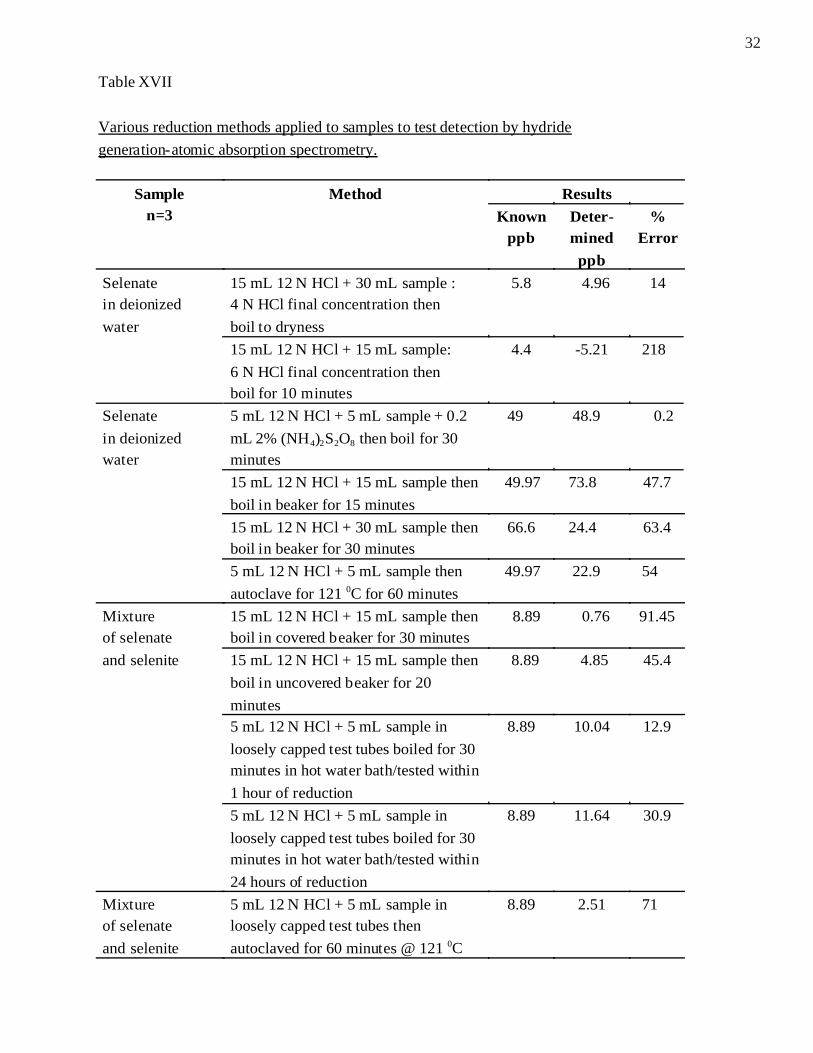
There are several selenium reduction methods reported for use with HGAAS (Standard
Methods for the Examination of Water and Wastewater, 1989; Dedina and Tsalev, 1995). Many of
these methods were tested and the results are presented in Table XVII.
The reduction method that gave the best results was the method that employed
5 mL of sample plus 5 mL of 12 N HCl with 0.2 mL of 2% ammonium persulfate then boiling. This
method was further refined by testing the reducing power in loosely capped tubes versus uncapped
tubes. Also, the time of boiling in regards to reduction was tested (Table XVIII).
The following important question was posed: Do mixtures of selenate and selenite oxyan-
ions interfere with the detection of the selenite oxyanion by HGAAS? Table XIX addresses this
question.
Table XII
Speciation of tellurium compounds in a 0.1 mM Na2TeO4·2H2O bioreactor experiment.
Oxidation State Concentration(ppm)
Percent of EachOxyanionPresent inSample
Tellurite 13.4 59.5
Tellurite + tellurate 15.0
Total tellurium 22.5
Tellurate(tellurite + tellurate - tellurite)
1.61 7.1
Tellurium
(total tellurium - tellurite - tellurate)
7.49 33.3
Tellurium added 13.5
% Recovery 167

29
Pseudomonas fluorescens K27 reduces selenite to elemental selenium and to volatile, orga-
noselenium compounds. HGAAS cannot detect these compounds so methods of oxidation to sel-
enate then reduction to Se(IV) were developed to allow application of HGAAS for these samples.
Nitric acid has been used as an oxidant in atomic absorption (Lortie et al., 1992), in colorimetric
determination (Magin et al., 1960), and in HGAAS (Martens and Suarez, 1997). Hydrogen peroxide
as an oxidant has reported in the literature (Weres et al., 1989; Zhang and Frankenberger, Jr., 2000;
Zhang et al., 1999; Reddy et al., 1995; Terry et al., 1992; Manning and Burau, 1995). Both of these
oxidizing agents were tested and the results are compared in Table XX (a, b, c, and d).
Table XIII
The acid concentrations of sample solutions to determine optimum determination ofselenium by HGAAS.
Test Date Knownppb
%HClv/v
Determinedppb
%Error
25 1 10.8 57
25 10 11.8 53
25 20 12.4 50
25 30 34.0 36
25 40 17.0 32
05/24/00
25 50 15.8 37
50 1 47.2 5.6
40 1 25.1 37
30 1 17.2 43
20 1 12.2 39
10 1 6.1 39
5 1 2.8 44
25 1 19.5 22
25 10 17.5 30
25 20 19.4 22
25 30 19.9 20
25 40 20.5 18
06/01/00
25 50 19.2 23
30
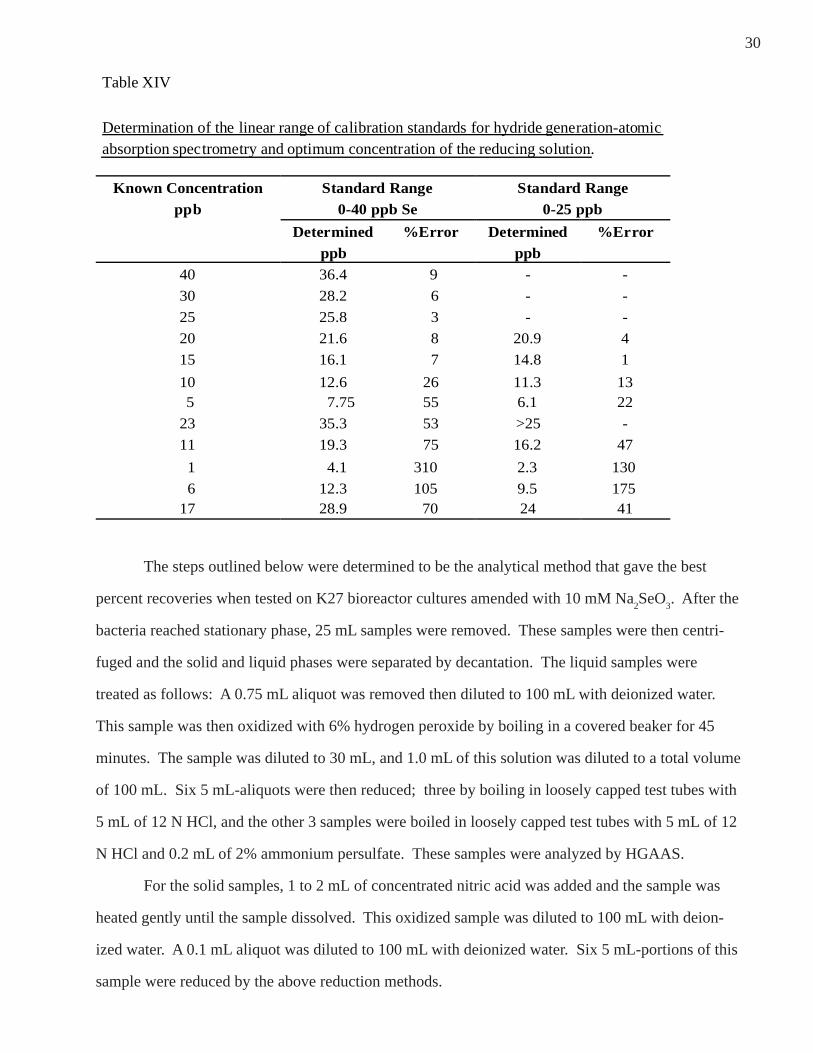
The steps outlined below were determined to be the analytical method that gave the best
percent recoveries when tested on K27 bioreactor cultures amended with 10 mM Na2SeO
3. After the
bacteria reached stationary phase, 25 mL samples were removed. These samples were then centri-
fuged and the solid and liquid phases were separated by decantation. The liquid samples were
treated as follows: A 0.75 mL aliquot was removed then diluted to 100 mL with deionized water.
This sample was then oxidized with 6% hydrogen peroxide by boiling in a covered beaker for 45
minutes. The sample was diluted to 30 mL, and 1.0 mL of this solution was diluted to a total volume
of 100 mL. Six 5 mL-aliquots were then reduced; three by boiling in loosely capped test tubes with
5 mL of 12 N HCl, and the other 3 samples were boiled in loosely capped test tubes with 5 mL of 12
N HCl and 0.2 mL of 2% ammonium persulfate. These samples were analyzed by HGAAS.
For the solid samples, 1 to 2 mL of concentrated nitric acid was added and the sample was
heated gently until the sample dissolved. This oxidized sample was diluted to 100 mL with deion-
ized water. A 0.1 mL aliquot was diluted to 100 mL with deionized water. Six 5 mL-portions of this
sample were reduced by the above reduction methods.
Table XIV
Determination of the linear range of calibration standards for hydride generation-atomicabsorption spectrometry and optimum concentration of the reducing solution.
Standard Range0-40 ppb Se
Standard Range0-25 ppb
Known Concentrationppb
Determinedppb
%Error Determinedppb
%Error
40 36.4 9 - -
30 28.2 6 - -
25 25.8 3 - -
20 21.6 8 20.9 4
15 16.1 7 14.8 1
10 12.6 26 11.3 13 5 7.75 55 6.1 22
23 35.3 53 >25 -
11 19.3 75 16.2 47
1 4.1 310 2.3 130
6 12.3 105 9.5 17517 28.9 70 24 41

31
Results of these optimized methods applied to bioreactor cultures are presented in Table XXI.
Calcium chloride was added to only one of these experiments to evaluate the report (Lueschow and
Mackenthun, 1962) that this would minimize volatilization of selenium during the oxidation step.
The operating conditions for the optimum detection of selenium by HGAAS are presented in
Table XXII.
In experiments where the H2O
2 oxidation of selenium occurred directly before the reduction
step, bubbling of the sample occurred when the hydrochloric acid was added. This indicated that the
hydrogen peroxide degradation was not complete. Mauzanner et al. (2001) described a method to
Table XV
Comparison of 1.5% (w/w) NaBH4 and 0.6% (w/w) NaBH4 solutions in the
determination of selenium concentration.
1.5% Sodium Borohydride 0.6% Sodium BorohydrideKnown
Concentrationppb
Determined
ppb
%
Error
Determined
ppb
%
Error
20 20.3 2 21.6 815 14.8 1 14.9 0.7
10 11.5 15 11.1 11
5 6.5 30 5.7 1411 16.1 46 16.3 48
1 2.5 150 2.1 1106 9.5 58 9.5 58
17 24.2 42 23.9 40
Table XVI
Testing of calibration standards with background correction on then off.
Background Correction On Background Correction OffKnown
Concentrationppb
Determined
ppb
% Error Determined
ppb
% Error
15 19 26.7 14.8 1.310 13 30 9.9 1
5 6.6 32 4.2 16
32
Table XVII
Various reduction methods applied to samples to test detection by hydride
generation-atomic absorption spectrometry.
ResultsSamplen=3
Method
Knownppb
Deter-mined
ppb
%Error
15 mL 12 N HCl + 30 mL sample :4 N HCl final concentration then
boil to dryness
5.8 4.96 14Selenatein deionized
water
15 mL 12 N HCl + 15 mL sample:
6 N HCl final concentration thenboil for 10 minutes
4.4 -5.21 218
5 mL 12 N HCl + 5 mL sample + 0.2
mL 2% (NH4)2S2O8 then boil for 30minutes
49 48.9 0.2
15 mL 12 N HCl + 15 mL sample then
boil in beaker for 15 minutes
49.97 73.8 47.7
15 mL 12 N HCl + 30 mL sample thenboil in beaker for 30 minutes
66.6 24.4 63.4
Selenate
in deionizedwater
5 mL 12 N HCl + 5 mL sample then
autoclave for 121 0C for 60 minutes
49.97 22.9 54
15 mL 12 N HCl + 15 mL sample thenboil in covered beaker for 30 minutes
8.89 0.76 91.45
15 mL 12 N HCl + 15 mL sample then
boil in uncovered beaker for 20
minutes
8.89 4.85 45.4
5 mL 12 N HCl + 5 mL sample in
loosely capped test tubes boiled for 30minutes in hot water bath/tested within
1 hour of reduction
8.89 10.04 12.9
Mixtureof selenate
and selenite
5 mL 12 N HCl + 5 mL sample in
loosely capped test tubes boiled for 30minutes in hot water bath/tested within
24 hours of reduction
8.89 11.64 30.9
Mixtureof selenate
and selenite
5 mL 12 N HCl + 5 mL sample inloosely capped test tubes then
autoclaved for 60 minutes @ 121 0C
8.89 2.51 71

33
determine the concentration of hydrogen peroxide in a sample by using a spectrophotometer The
wavelength used was 240 nm and the extinction coefficient was 43.7 M/cm. Standards and samples
containing various concentrations of hydrogen peroxide were prepared and the absorbance deter-
mined by UV/VIS spectrophotometer (Jasco V-550). The results were deemed not acceptable
because percent errors ranged from -26.08 to 35.29. Each sample and standard was then scanned to
find the optimum wavelength for absorbance. The optimum wavelength for each solution was 258
nm. The solutions and standards were tested again but at wavelength 258 nm.
Fresh standards and eight samples containing 6% hydrogen peroxide were prepared. Four of
the hydrogen peroxide solutions also contained 0.05 N sodium hydroxide, a reagent suggested by
others (Zhang and Frankenberger, 2000; Thompson-Eagle and Frankenberger, Jr., 1990; Weres et al.,
1989; Terry et al., 1992) to cause faster H2O
2 decomposition. The method presented in the literature
Table XVIII
Reduction methods tested on a mixture of selenate and selenite.
ResultsSamplen=3
MethodKnown
Conc.ppb
Deter-
minedppb
%
Error
5 mL 12 N HCl + 5 mL
sample in loosely capped
test tubes boiled:
10 minutes 8.89 12.05 35.5
20 minutes 8.89 10.6 19.6
30 minutes 8.89 11.07 24.6
40 minutes 8.89 9.29 4.49
Mixture of selenate
and selenite
50 minutes 8.89 9.24 3.9
5 mL 12 N HCl + 5 mL
sample in uncapped test
tubes boiled:
10 minutes 8.89 9.1 2.36
20 minutes 8.89 9.4 5.74
30 minutes 8.89 8.89 0.0
40 minutes 8.89 8.53 4.05
Mixture of selenate
and selenite
50 minutes 8.89 9.52 7.1

34
Table XIX
Testing mixtures of selenate and selenite to detect selenium in Se(IV).
ResultsSample
KnownConc. of Selenite
ppb
Determined
ppb
%Error
Mixture of selenate
(1.85 ppb) and
selenite (10 ppb)
n=3
10 10.68 6.8
Mixture of selenate
(1.85 ppb) andselenite (10 ppb)
n=3
10 11.67 16.7
Mixture of selenate
(1.5 ppb) and selenite
(1.56 ppb)n=3
1.56 1.19 23.7
to degrade hydrogen peroxide was to boil the sample until the fine bubbles of hydrogen peroxide
disappear. This method plus boiling for a specific time period were tested and the results are pre-
sented in Table XXIII.
35
Table XX a
The results of oxidizing selenium compounds with either nitric acid or hydrogen
peroxide and the affect of dilutions on the detection of selenium.
ResultsSample MethodKnown
Conc.ppb
Deter-
minedppb
%
Error
Selenate + SeleniteDilution 1; dilution 2; oxidation
with hydrogen peroxide thenreduction with ammoniumpersulfate
14.93 17.8 19.2
>20>20
SelenateDilution 1; dilution 2; oxidationwith hydrogen peroxide thenreduction with ammonium
persulfate
14.86
>20
16.51>20
SeleniteDilution 1; dilution 2; oxidation
with hydrogen peroxide thenreduction with ammoniumpersulfate
15.01
16.10
8.6
Mixture of seleniteand selenate;
selenate; selenite;blank; All solutionsare 1% TSN3
BlankDilution 1; dilution 2; oxidationwith hydrogen peroxide then
reduction with ammoniumpersulfate
0 6.34

36
Table XX b
The results of oxidizing selenium compounds with either nitric acid or hydrogen
peroxide and the effect of dilutions on the detection of selenium.
ResultsSample MethodKnown
Conc.ppb
Deter-
minedppb
%
Error
Selenate + SeleniteDilution 1; dilution 2; oxidation
with hydrogen peroxide thenreduction with ammoniumpersulfate
14.93 17.8 19.2
>20>20
SelenateDilution 1; dilution 2; oxidationwith hydrogen peroxide thenreduction with ammonium
persulfate
14.86
>20
16.51>20
SeleniteDilution 1; dilution 2; oxidation
with hydrogen peroxide thenreduction with ammoniumpersulfate
15.01
16.10
8.6
Mixture of seleniteand selenate;
selenate; selenite;blank; All solutionsare 1% TSN3
BlankDilution 1; dilution 2; oxidationwith hydrogen peroxide then
reduction with ammoniumpersulfate
0 6.34

37
Table XX c
The results of oxidizing selenium compounds with either nitric acid or hydrogen peroxideand the effect of dilutions on the detection of selenium.
ResultsSample Method
KnownConc.ppb
Deter-minedppb
%Error
Selenite in TSN3
Dilute then oxidize withhydrogen peroxide then dilute
then reduction withoutammonium persulfate
14.8 16.45 11
Selenite in TSN3
Dilute then oxidize withhydrogen peroxide then dilute
then reduction with ammoniumpersulfate
14.5 18.97 30.8
TSN3
Dilute then oxidize withhydrogen peroxide then dilute
then reduction withoutammonium persulfate
0 -2.01
Deionized water
Dilute then oxidize withhydrogen peroxide then dilute
then reduction withoutammonium persulfate
0 -1.47
Selenite in TSN3;
blank TSN3,selenite in TSN3;
deionized water
Selenite in TSN3: no oxidation
nor reduction
5.4 6.04 11.8

38
Table XX d
The results of oxidizing selenium compounds with either nitric acid or hydrogen
peroxide and the effect of dil utions on the detection of selenium.
ResultsSample Method
KnownConc.ppb
Deter-minedppb
%Error
Se(0)
Oxidize with hydrogen peroxidethen reduction without
ammonium persulfate
10 15.97 59.7
Selenite + SelenateDilution 1; dilution 2; oxidize
with hydrogen peroxide thenreduction without ammoniumpersulfate
15.04 19.41 29
SeleniteDilution 1; dilution 2; oxidize
with hydrogen peroxide thenreduction without ammoniumpersulfate
15.11 19.81 31
SelenateDilution 1; dilution 2; oxidize
with hydrogen peroxide thenreduction without ammoniumpersulfate
14.97 >20
Se(0); mixture of
selenate + selenite;selenate; selenite;
TSN3
TSN3Oxidation with hydrogen
peroxide then reduction withoutammonium persulfate
0 1.11

39
Table XXI
Results of HGAAS determination of selenium from 10 mM Na2SeO3 amendedbioreactor experiments.
ResultsSample
Phase SeDetermined
grams
%Se
% Recovery
Solid 0.11 7.3
Liquid 1.4 93.3
01/01/012.1 g Se
72 hoursn=6 (both reduction
methods)
Total 1.5 100
72
Solid 0.171 7.2Liquid 2.21 92.8
01/19/012.1 g Se72 hours
n=6 (both reductionmethods)
Total 2.38 100
111.7
Solid 0.117 2.2
Liquid 5.13 97.0
03/26/01
2.1 g Se24 hours
CaCl2 added to solidoxidation
n=6 (both reductionmethods)
Total 5.25 100
250
Solid 0.236 11.4
Liquid 1.834 88.4
05/02/012.1 g Se
24 hours
n=6 (both reductionmethods)
Total 2.07 100
98
Solid 0.141 6.2
Liquid 2.14 93.8
06/04/01
2.1 g Se72 hoursn=6 (both reduction
methods)
Total 2.28 100
108.6
40
Table XXII
Parameters used for the determination of selenium by hydride generation-atomic
absorption spectrometry.
Parameter Optimal SettingOxidation State Se(IV)
Reducing Solution 0.6 % NaBH4
0.5 % NaOH
Acid Solution 10 N HCl
Standard Range 0 ppb to 20 ppb Se
Acid Concentration of Standards and
Samples
50% HCl
Table XXIII
Results of the degradation experiments for hydrogen peroxide.
Known Concentration
M
Decomposition
Method
Determined
M
%
Decomposed0.0176 boil for 10 minutes
0.05 N NaOH
0.00266 85
0.0176 boil for 20 minutes
0.05 N NaOH
0.00699 60
0.0176 boil until bubbles disappear
0.05 N NaOH
-0.00241
0.0176 no boiling
0.05 N NaOH
0.0191
0.0176 boil for 10 minutes 0.0324
0.0176 boil for 20 minutes 0.0117 34
0.0176 boil until bubbles disappear 0.0162 8
0.0176 no boiling 0.0163 8

41
Chapter IV
Discussion and Conclusions
Many attempts were made to duplicate the analytical methods found in the literature. A
method was developed and tested on known quantities of selenium, tried on biological samples
containing selenium, and the % recoveries evaluated. The method was modified and again tested on
known quantities before being tested on a biological sample. Reported operating conditions for
hydride generation-atomic absorption were widely disparate. Each parameter was tested and values
optimized for the HGAAS in our laboratory.
Effects of N2 Purging on Growth of K27 Bacterium
Figures 1, 2, 3, and 4 (pH and growth curves) and Tables I and II (SGR) were presented to
compare N2 purged bioreactor experiments against bioreactor experiments that were not purged.
Both selenium amended and non-amended bioreactor experiments were compared. These experi-
ments were designed to investigate the affect of inert gas purging on the growth of the Pseudomonas
fluorescens K27 bacterium. Since formation and removal of volatile selenium compounds could be
an important detoxification process for this organism, the removal of these volatile gases at higher
rates needed to be investigated. The SGR values and the growth curves values are within the value
range found in other experiments. Purging with N2 does not enhance or inhibit the growth of the
bacteria under the conditions studied.
Non-amended bioreactor cultures have higher SGR values than amended cultures. In Table
II, the experiment carried out on 11/10/99 has a SGR value that is similar to values found with non-
amended bioreactor cultures. This result is questionable because this culture was amended with 10
mM SeO32-. Possible error in this reading could include errors in using the Spectronic 20 (reading or
calibrating errors).
Further testing of the optical density (SGR) of bioreactor experiments was not done because
a change of emphasis towards efforts to determine the mass balance of selenium. Each of these
experiments where the SGR was not determined appeared to follow other experiments in the timing
and appearance of the brick-red color of elemental selenium.

42
Atomic Absorption Determination of Selenium
Detection of selenium by atomic absorption requires that all selenium be oxidized to Se(VI).
Oxidation by either nitric acid or hydrogen peroxide was tested, and the results were compared in
Table III.
Biologically produced elemental selenium is present in biological samples as indicated by the
red color of the precipitate (Doran, 1982). Analysis of selenium in these samples requires dissolu-
tion of the precipitate and oxidation to Se(VI). Oxidation of elemental selenium was attempted by
two methods using nitric acid. One method employed repeated additions of nitric acid and boiling
that solution to dryness. The results of these experiments showed poor % recoveries due to possible
volatilization of selenium (Table III). Better results were obtained when nitric acid was added in one
aliquot and then boiled only to near dryness. This method was tried on several oxyanions of sele-
nium plus elemental selenium. Errors ranged from 6 to 25%. The lowest error was for selenium that
was already in the VI oxidation state. The oxidation of elemental selenium by nitric acid was chosen
due to the lower % error.
Also show in Table III are data related to the treatment of selenium AA standards with vari-
ous strengths of hydrogen peroxide as an oxidant. This method of oxidation gave errors in a range of
0 to 12%. While these results are acceptable analytically, other experiments were performed using
hydrogen peroxide for the oxidation of selenium, and these results differed greatly.
The results from the bubbling tube experiments in which volatile organoselenium compounds
are trapped in hydrogen peroxide and thereby oxidized to Se(VI) are presented in Table V. The
results are inconsistent and not reproducible. The bubbling tubes labeled A, B and C were connected
in series with tube A connected directly to the bioreactor, then tube B connected “down stream” of
tube A, then tube C connected to tube B. The quantity of selenium found in tube A should be the
greatest value if the trapping procedure is effective. Tube B should contain little oxidized selenium
and then tube C would have zero to very little oxidized selenium. Out of seven experiments, only
two gave reasonable results. Selenium was detected in the bubbling tubes of non-amended bioreac-
tor experiments. Contamination of the tubing from previous experiments or the inefficient cleaning
of the bubbling tubes could be the source of the selenium detected by HGAAS. New tubing and
bubbling tubes that had been washed with soap and water then soaked in water containing bleach (a
highly oxidizing hypochlorite solution) and then rinsed in deionized water was tested with a non-
43
amended bioreactor experiment. Analysis by AAS detected selenium present in unexpected tube
order and in non-amended cultures. The H2O
2 that was not destroyed in the decomposition step
could be the cause of the high readings for selenium in this section.
Known quantities of dimethyl diselenide were pipetted directly into 30% H2O
2 and the
concentration of selenium was analyzed by AAS (Table VI). The error range is high. These samples
were left in sealed but not air-tight volumetric flasks and the samples were analyzed by AAS for
selenium at various time periods. The results in Table VII show that as time passed, the error for the
30 ppm and 40 ppm samples decreased. The data in Table VII, work done in HGAAS, and bubbling
tube experiments where Se was detected when none was present, indicate that the increase in accu-
racy could possibly come from the decomposition of hydrogen peroxide. As time passed, the hydro-
gen peroxide decomposed and no longer interfered in the detection of selenium. An alternative
interpretation is that Se oxidation proceeds too slowly and more time is required to oxidize all
trapped volatile selenium compounds.
The data presented in Table VIII were recorded when Se(-II) in the form of dimethyl dis-
elenide was oxidized with hydrogen peroxide and then reduced to Se(IV); the percent error was high
and similar to other results using hydrogen peroxide as the oxidant. Again, the possibility that
hydrogen peroxide was not completely degraded and was causing high percentage errors must be
considered.
It is not clear why the results of the detection of sodium selenite (Table VIII) are so much
better than other results using AAS. Selenium is atomized in AAS in the VI oxidation state, but the
oxidation state of selenium in these experiment is IV.
44
Mass Balance Attempt Using AAS
One attempt was made to find the mass balance of a Se-amended bioreactor experiment using
atomic absorption, and the results are presented in Table IV. Of the amount of selenium added as
Se(IV), 95% of it was detected by atomic absorption
(% recovery = 95%). Since there is no way to determine the different oxidation states produced by
the K27 bacterium in the bioreduction of selenium when using AAS, the use of other instruments for
the detection of selenium was investigated (see page 57).
Determination of Tellurium using Hydride Generation-Atomic Absorption
The results of the tellurium and selenium HGAAS experiments are not presented in chrono-
logical order. Some of the parameters set for the determination of tellurium were first determined
for selenium and then applied to tellurium. The calibration standard range (0-20 ppb) and the acid
content of the calibration standards and samples (50% v/v) were determined for selenium and then
applied to tellurium analysis. The reductant concentration and acid solution concentration were
determined from the operating manual for the Varian AA.
Table IX presents the results of tests that were performed to refine the oxidation and reduc-
tion processes of the solid phase of bioreactor fluid amended with tellurium. The variable tested was
whether boiling the solid phase in nitric acid or not boiling in nitric acid had an effect on the amount
of tellurium detected. Also, the reduction method was tested to see the effect of ammonium
persulfate on the reduction of biological samples. Weres et al. (1989) suggested 6 N HCl as the
reducing agent with 0.2 mL of 2% ammonium persulfate as a viable method for increasing accuracy
of metalloid analysis in biological samples. Neither process was consistently better nor worse than
the other process in detecting tellurium. The method including the oxidation step with nitric acid
(not boiled) was chosen as the preferred method to decrease any chances of volatilization of tellu-
rium (analogous to Se).
Table X gives the optimal operating conditions for the determination of tellurium using
hydride generation-atomic absorption. These parameters were used to determine tellurium in bio-
logical samples.

45
Table XI presents data obtained from four separate bioreactor experiments. For some of the
bioreactor experiments, more than one tube was processed. The average amount of tellurium found
in the solid phase was 26.4% with n=4 and a standard deviation of 14.5. At stationary phase 26.4%
of the tellurium added as water soluble sodium tellurite (IV) had been reduced to Te(0) or had
adhered to the cells in some manner since both cells and elemental tellurium were harvested by the
collection method used (Basnayake et al., 2001).
Table XII gives information on an attempt to speciate the tellurium present at stationary
phase from bacteria amended with 0.1 mM sodium tellurate (VI). Water soluble forms of tellurium
were composed of 59.5% of tellurite (IV) and 7.1% of tellurate for a total of 66.6%. The amount of
tellurium in the solid phase was 33.3%.
Further work in this area would include determining the specific oxyanions present at station-
ary phase, and the concentration of these oxyanions at various time periods during the log phase of
growth using sequential sampling of a live bacterial culture.
Determination of Selenium by Hydride Generation-Atomic Absorption
Each operating condition for the determination of selenium was determined for the analysis
by hydride generation-atomic absorption. Table XIII shows the effect of acid concentration of the
samples and standards. The recovery results for samples and standards containing from 20 to 50%
hydrochloric acid (v/v) were the lowest. The decision to use 50% HCL (v/v) was determined by
these results and from those of the literature. Conditions that were chosen through this optimization
process ultimately led to samples with standard deviations of less than 10%
Table XIV shows the calibration range for the standards. The optimum range was deter-
mined to be 0 - 20 ppb. Although this range is relatively narrow, it is still analytically useful.
Table XV shows the comparison of the concentration of reducing solutions used in HGAAS.
The 0.6% (w/w) sodium borohydride solution produced the results with the lowest errors.
To determine whether the background correction feature of the HGAAS instrument should be
on or off was addressed in experiments presented in Table XVI. The most accurate results were
obtained by turning the background correction feature off.

46
Table XVII is a tabulation of results obtained to determine the best selenium reduc-
tion method from those found in the literature (Standard Methods for the Examination of Water and
Wastewater, 1989). These methods were tested on known quantities of selenium in deionized water.
The method that gave the most accurate results was the reduction method employing 5 mL of sample
plus 5 mL of conc. HCl with 0.2 mL of 2% ammonium persulfate.
Further refinement of this process was investigated and data are reported in Table XVIII.
The most accurate method in this tabulation was boiling the sample for
30 minutes in uncapped tubes; the decision was made not to use the uncapped methods
because of experiments where the water in the boiling water baths contaminated the samples.
Results of testing for Se(IV) in a mixture of Se(IV) and Se(VI) are presented Table XIX. The
results indicate that Se(IV) can be analyzed by HGAAS in the presence of Se(VI).
Two methods of selenium oxidation found in the literature were oxidation with hydrogen
peroxide or with nitric acid. Tables XX a, XX b, XX c, and XX d present the results of Se analyses
when these methods were tested. The impetus behind these experiments was to determine the best
method for oxidation of selenium in samples obtained from the bioreactor that were to be analyzed
by HGAAS. These results are of experiments done over several months and are not presented in
chronological order. In Table XXI a, nitric acid and hydrogen peroxide were tested on sodium
selenite in water. The nitric acid results for the determination for water-soluble selenium were not
acceptable (recoveries > 10%). Nitric acid has been used to digest organic materials containing
selenium (Narasaki and Ikeda, 1984; Bujdos and Kubova, 2000). The decision was made to use
nitric acid on only the solid phase of the bioreactor fluid. Schumb et al. (1955) stated that hydrogen
peroxide slowly oxidizes Se0 to selenium dioxide which reinforces this decision.
Many reports in the literature referred to hydrogen peroxide as an oxidant for water-soluble
forms of selenium and for volatile organoselenium compounds (Weres, 1989; Thompson-Eagle and
Frankenberger, Jr., 1990; Zhang and Frankenberger, Jr., 2000; Reddy et al., 1995; Standard Methods
for the Examination of Water and Wastewater, 1989). This oxidant was tested and the data from
these tests were presented in Tables XX a, XX b, XX c and XX d. The difference between the two
processes in Table XX a, was that in one experiment the hydrogen peroxide was boiled until O2
47
bubbles disappeared versus boiling until dryness. The results for the process where boiling until
dryness was employed are within 10% of the known concentration. The results for boiling until the
oxygen bubbles disappear show an error of 27%. The only difference in these two methods is the
time allowed for the decomposition of the hydrogen peroxide. The significance of these data was
not recognized at the time.
The concentration of selenium added to the bioreactor in a 10 mM amendment experiment is
approximately 789 ppm. Dilutions were made to reduce the selenium concentration to levels within
the calibration range of the HGAAS method (~ 10 ppb range). The timing of these dilutions in
regards to where they appear in the oxidation and reduction steps was investigated in Tables XX a,
XX b, XX c and XX d. The oxidation of various oxyanions of selenium in TSN3 was tested with
hydrogen peroxide and dilutions were made in different steps of the oxidation and reduction process.
In Table XX b, the dilutions occurred at the beginning of the process before oxidation. The
thinking behind this step was that any interferents that might be present in the TSN3 growth media
could be reduced in concentration when diluted. One observation made during these experiments
was that when the HCl was added for the reduction step uncontrolled bubbling occurred. So much
bubbling occurred that some of the sample was lost in several tubes. A possible explanation for the
bubbling could be the following reactions involving undecomposed H2O
2 from the degradation step
(Jones, 1999):
Whatever the source of the bubbles, the recovery of selenium in these experiments was poor.
The calculated or known concentrations of these solutions were within the calibration range but in
several of the tests the determined concentration was over the calibration range. The hydrogen
peroxide may not have degraded completely in the boiling stage and may have interfered positively.
The proposed method for determing that all H2O
2 was degraded was when the O
2 bubbles disap-
peared (Weres et al., 1989, Standard Methods for the Examination of Water and Wastewater, 1989).
These experiments were repeated in XX d and again the results were high.
H O 2Cl 2H Cl 2H O2 2 2 2+ + → +− +
H O Cl 2Cl 2H O2 2 2 2+ → + +− +
48
In Table XX c, 1) dilution before the oxidation step to dilute any possible TSN3 interferents,
then 2) oxidation with hydrogen peroxide, 3) dilution to negate any remaining hydrogen peroxide
and then 4) reduction, was the method tested. This process gave better results as measured by %
error when compared to the analysis of Se(IV) in TSN3 with no oxidation or reduction methods
applied. This series of dilutions was the final method applied to the supernatant of bioreactor experi-
ments that were amended with selenium.
Table XXI gives the results obtained when the fluid from five different bioreactor experi-
ments were analyzed for selenium using the dilution-oxidation-dilution-reduction-analysis method.
For the 10 mM Na2SeO
3 amended bioreactor experiments, 6.78% (n=5 with a standard deviation of
3.14) of the water-soluble selenium was reduced to elemental selenium or adhered to the K27 cells
and was collected in the solid.
Table XXII gives the operating parameters for the determination of selenium. The standard
range and the acid concentration are similar to that of tellurium. The concentration of the reducing
solution and the acid for hydride production are different.
Data in Table XXIII show the investigation of the best process to degrade hydrogen peroxide
after the oxidation step. The best method was to boil for at least 20 minutes with 0.05 N NaOH.
The final method applied to biological samples was to boil the sample for 45 minutes with 0.05 N
NaOH.
Reduction of Possible Interferents in Determining Se by HGAAS
Each step of the determination of selenium was fraught with possible sources of interference.
The following outlines these possible contributing factors and describes steps used to reduce any
possible interferences.
The use of nitric acid could erroneously enhance selenium readings by producing NO or NO2
gases by the oxidation of any organic matter present (Bujdos and Kubova, 2000). The NO3- ion
causes suppression of the selenium signal in concentrations of 4000 ppm (Narasaki and Ikeda, 1984).
These possible intereferents of selenium in the solid phase were reduced by dilutions by a factor of
10000.
49
Humic substances can cause interferences by reacting with sodium borohydride (the reduc-
tant) to produce effervescence which perturbs selenium measurements (Zhang, et al., 1999; Roden
and Tallman, 1982). The first dilution in the analytical process for the supernatant would reduce the
concentration of any humic substances to a value of 0.075% of the sample. Further steps would
dilute this value by a factor of 400 before analysis by HGAAS. For the solid phase, any humic
substances would also be diluted by a factor of 10000.
Hydrogen peroxide is listed as an interferent by Narasaki and Ikeda (1984) in levels of 1400
ppm to 2800 ppm for determination of selenium at 8 ppb and 4 ppb levels respectively. Any produc-
tion of gas besides H2Se during analysis distorts the detection of selenium. Weres et al. (1989)
described the process to degrade hydrogen peroxide as boiling until the fine bubbles of hydrogen
peroxide decomposition are replaced by the ordinary bubbles of boiling. Zhang et al. (1999) re-
ported that several drops of 1 N NaOH added to boiling hydrogen peroxide would aid in the decom-
position of the hydrogen peroxide. The stability of H2O
2 was not expected after reading these de-
scriptions of how to degrade hydrogen peroxide. In the experiments presented in Tables XX a, XX b
and XX d, hydrogen peroxide was used at the oxidant, and the oxidized samples were boiled until
the fine bubbles disappeared. After the research in reported in Table XX was done, the oxidized
samples were boiled for 45 minutes with 0.05 N NaOH present. The final dilution before reduction
was to dilute any remaining H2O
2 to below levels that could interfere with the detection of selenium.
Back oxidation of Se(IV) to Se(VI) can be caused by Cl2 generated in the reduction process
with HCl (Krivan et al.,1985). To address this possibility, samples were analyzed immediately after
the reduction step.
There are many interesting avenues to pursue in research related to the material presented
here. Some have already been mentioned. One avenue I would like to pursue is the bioreduction of
selenium at controlled pH values.

50
Conclusions
• For biological samples containing tellurium, the best recoveries were obtained by oxidation of
both the liquid and solid phases by nitric acid, and reduction by 5 mL of sample and 5 mL of 12
N HCl boiled for twenty minutes.
• Operating parameters for HGAAS determination of tellurium were determined to be 0-20 ppb
calibration standards, samples and standards of 50% HCl (v/v), sodium borohydride concentra-
tion of 0.35% (w/w) stabilized by 0.50% NaOH (w/w), and an acid solution for the production of
the hydride as 6 N HCl.
• For the determination of selenium in biological samples, oxidation of the solid phase by nitric
acid and oxidation of the liquid phase by hydrogen peroxide were determined to be the methods
that gave the best recoveries. The reduction method that was determined to give the best results
was 5 mL of sample and 5 mL of 12 N HCl boiled for twenty minutes.
• Both oxidants and the reducing agent used in this method for HGAAS determination of selenium
can cause erroneous analysis. Steps must be taken to minimize these possible errors. Steps used
in this research were to use dilutions to minimize these interferents, and in the case of interfer-
ence by the reducing agent, analysis was performed within one hour of reducing the samples.
• Operating parameters for the detection of selenium by HGAAS are 0-20 ppb calibration range,
50% HCl (v/v) for samples and standards, sodium borohydride concentration of 0.60% (w/w)
stabilized with 0.050% NaOH (w/w), and acid solution for hydride production 10 N HCl.

51
Bibliography
Basnayake, R. T.; Bius, J. H.; Akpolat, O. M.; Chasteen, T.G. Appl. Organomet. Chem. 2001, 15,499-510.
Blaylock, M. J.; James, B. R. J. Environ. Qual. 1993, 22, 851-857.
Bujodos, M.; Kubova, J.; Stresko, V. Anal. Chim. Acta 2000, 408, 103-109.
Chasteen, T. G. , Silver, G. M., Birks, J. W. , Fall, R. Chroma. 1990, 30, 181-185.
Chasteen, T. G. Appl. Organomet. Chem. 1993, 7, 335-342.
Cooke, T. D.; Bruland, K. W. Environ. Sci. Technol. 1987, 21, 1214-1219.
Cutter, G. A. Anal. Chim. Acta 1978, 98, 59-66.
Cutter, G. A. Anal. Chem. 1985, 57, 2951-2955.
Dedina, K.; Tsalev, D.L. “Hydride Generation Atomic Absorption Spectrometry”; John Wiley &Sons: Chichester, 1995; 308-354; 355-370.
Diaz, J. P.; Navarro, M.; Lopez, H.; Lopex, M. C. Sci. Total Environ. 1996, 186, 213-236.
Doran, J. W. In “Advances in Microbial Ecology”; Marshall, K. C., Ed.; Plenum Press: New York,1982: Vol. 6, Chapter 1.
Eriksen, Jr., L. A., M.S. Thesis, Sam Houston State University, Huntsville, TX, U.S.A., 1999.
Gürlyük, H., M.S. Thesis, Sam Houston State University, Huntsville TX, USA, 1996.
Jones, C. W. “Applications of Hydrogen Peroxide and Derivatives”; The Royal Society of Chemis-try: Cambridge, 1999; 156.
Krivan, V.; Petrick, K.; Welz, B.; Melcher, M. Anal. Chem. 1985, 57, 1703-1706.
Lortie, L.; Gould, W. D.; Rajan, S.; McCready, R. G. L.; Cheng, K. J. Appl. Enviorn. Microbiol.1992, 58, 4042-4044.
Lueschow, L. A., Mackenthun, K. M. J. AWWA 1962, Jun., 746-750.
Maas, J., In “Environmental Chemistry of Selenium”, Engberg, R., Frankenberger, Jr., W., Eds.;Marcel Dekker: New York, 1998: 113-128.
Macy, J. M.; Michel, T. A.; Kirsch, D. G. FEMS Microbiol. Lett. 1989, 61, 195-198.

52
Magin, Jr., G. B.; Thatcher, L. L.; Rettig, S.; Levine, H. J. AWWA. 1960, 52, 1199-1205.
Manning, B. A.; Burau, R. G. Environ. Sci. Technol. 1995, 29, 2639-2646.
Martens, D. A.; Suarez, D. L. Environ. Sci. Technol. 1997, 31, 133-139.
Mauzannar, R.; Miric, S. J.; Wiggins, R. C.; Konat, G. W. Neurochemistry International 2001, 38, 9-15.
Narasaki; H.; Ikeda, M. Anal. Chem. 1984, 56, 2059-2063.
Parsons, J. J., “A Geographer Looks at the San Joaquin Valley”; Departments of Geography, Univer-sity of California at Berkeley; 1987 Carl Sauer Memorial Lecture;keley.edu/ProjectsResources/Publications/Parsons_SauerLect.html http://geography.berkeley.edu/ProjectsResources/Publications/Parsons_SauerLect.html
Rech, S. A.; Macy, J. M. J. Bacteriol. 1992, 174, 7316-7320.
Reddy, K. J.; Zhang, Z.; Blaylock, M. J.; Vance, G. F. Environ. Sci. Technol. 1995, 29, 1754-1759.
Reilly, C. “Selenium in Food and Health”; Blackie Academic & Professional: London, 1996; 5-7;110-114; 117-122.
Roden, D. R.; Tallman, D. E. Anal. Chem. 1982, 54, 307-309.
Schumb, W. C.; Satterfield, C. N.; Wentworth, R. L. “Hydrogen Peroxide”; Reinhold: New York,1955; 400.
Skorupa, J. In “Environmental Chemistry of Selenium”; Engberg, R., Frankenberger, Jr., W., Eds.;Marcel Dekker: New York, 1998: 315-354.
Shamberger, R. J. “Biochemistry of Selenium”; Plenum Press: New York, 1983, 202-204, 252-254.
“Standard Methods for the Examination of Water and Wastewater”, 17th ed., Clesceri, L. S.,Greenberg, A. E., Trussell, R.R., Eds., American Public Health Association, Washington DC, 1989,3-43-53, 3-128-134, 3-137-141.
Stone, A. J.; Van Fleet-Stalder, V.; Chasteen, T. G., 215 Nat. A.C.S. meeting, Dallas TX, March1998; abst. EVNR 46.
Terry, N.; Carlson, C.; Raab, T. K.; Zayed, A. M. J. Environ. Qual. 1992, 21, 341-344.
Thompson-Eagle, E. T.; Frankenberger, Jr., W. T. J. Environ. Qual. 1990, 19, 125-131.
Varian, “Analytical Methods Flame Atomic Absorption Spectrometry”, Publication No 85-100009-00, Varian Australia Pty Ltd, Mulgrave Victoria, Australia, 1989.

53
Varian, Vapor Generation Accessory VGA-77", Publication No. 85 101047 00, Varian Australia PtyLtd, Mulgrave Victoria, Australia, 1997.
Weres, O.; Jaouni, A.; Tsao, L. Appl. Geochem. 1989, 4, 543-563.
Yu, R., M.S. Master Thesis, Sam Houston State University, Huntsville, TX, U.S.A., 1996.
Yu, R.; Coffman, J. P.; Van Fleet-Stalder, V.; Chasteen, T. G. Environ. Toxicol. Chem. 1997, 16 , 140-145.
Zhang, L.; Chasteen, T. G. Appl. Organomet. Chem. 1994, 8, 501-508.
Zhang, Y., Frankenberger, Jr., W. T. Environ. Sci. Technol. 1999, 33, 1652-1656.
Zhang, Y., Frankenberger, Jr., W. T. Environ. Sci. Technol. 2000, 34, 776-783.
Zhang, Y.; Frankenberger, Jr., W. T.; Moore, J. N. Sci. Total Environ. 1999, 229, 183-193.
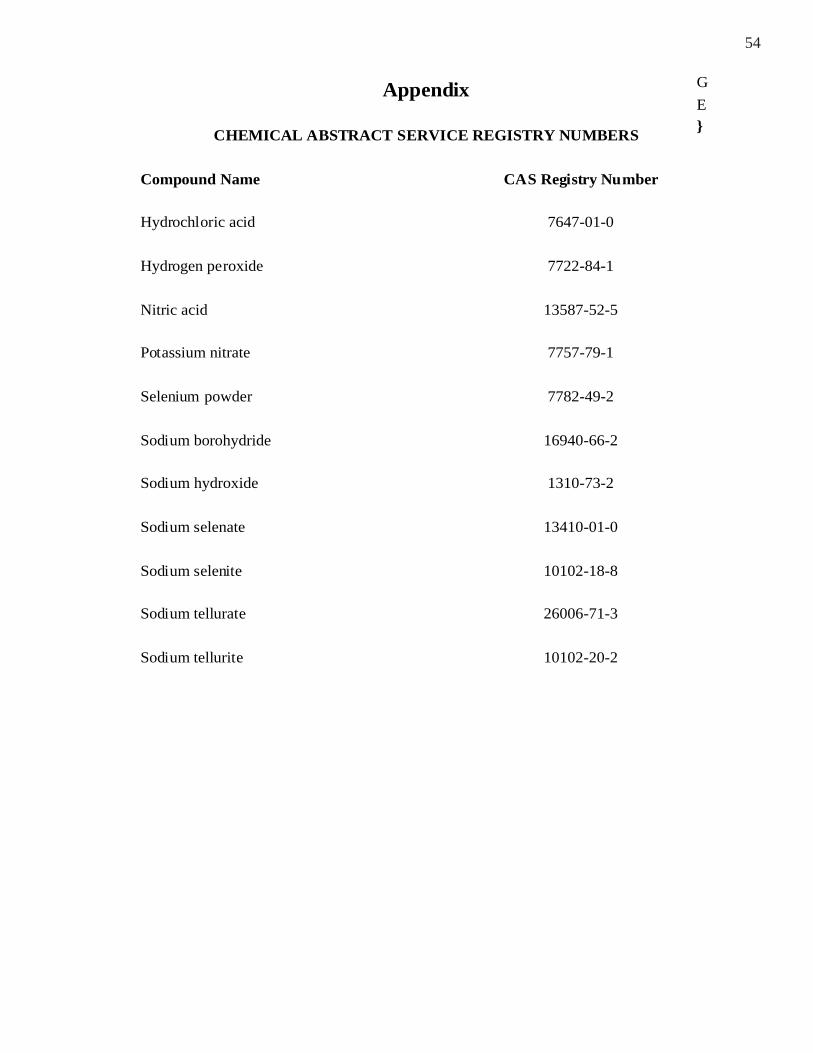
54
G
E}
Appendix
CHEMICAL ABSTRACT SERVICE REGISTRY NUMBERS
Compound Name
Hydrochloric acid
Hydrogen peroxide
Nitric acid
Potassium nitrate
Selenium powder
Sodium borohydride
Sodium hydroxide
Sodium selenate
Sodium selenite
Sodium tellurate
Sodium tellurite
CAS Registry Number
7647-01-0
7722-84-1
13587-52-5
7757-79-1
7782-49-2
16940-66-2
1310-73-2
13410-01-0
10102-18-8
26006-71-3
10102-20-2

55
VITA
Janet Kay Horton Bius was born in Houston, Texas but spent most of her childhood in Pales-
tine, Texas. She graduated from Palestine High School in 1977. She received a Bachelor of Science
in chemistry with a minor in mathematics in August 1981.
In 1985, Mrs. Bius received her State of Texas teaching certificate in science and English.
She taught physical science at Huntsville High from 1985 until 1988 when she left to work in the
business sector.
In January 1999 Mrs. Bius entered the chemistry graduate program at Sam Houston State
University in Huntsville, Texas. She received her Master of Science degree in chemistry in Decem-
ber 2001.