developing a methodology for establishing a stronger … · developing a methodology for...
TRANSCRIPT
New Zealand Fire Service Commission Research Report Number 125 ISBN Number 978-1-877539-72-5 (paperback) ISBN Number 978-1-877539-73-2 (on-line) © Copyright New Zealand Fire Service Commission
In the current fiscal environment, all government agencies are under pressure to demonstrate value for money in their spending and are expected to show a strong ‘line of sight’ between expenditure, outputs and outcomes for the public. We were asked to provide advice on a stronger methodology/framework to monitor performance and establish a stronger line of sight in relation to the public education programmes. This report contains advice to help position the Commission to get more out of its investment in performance information. In particular it aims to help the Commission to gather and integrate the right information to help it make better informed decisions about how and where it invests resources in public education programmes.
Developing a methodology for
establishing a stronger line of sight between
expenditure and outcomes
MartinJenkins
November 2012

Final Report New Zealand Fire Service Commission
Developing a methodology for establishing a stronger line of
sight between expenditure and outcomes
23 November 2012

Commercial In Confidence
Preface This report has been prepared for by Meenakshi Sankar, Richard Tait and Kris Iyer from MartinJenkins (Martin, Jenkins & Associates Limited).
Our goal is to improve the effectiveness and efficiency of the organisations we work with. We do this by providing strategic advice and operational support in the following areas:
• Strategy, Transformation & Performance
• Policy & Economics
• Evaluation & Research.
MartinJenkins was established in 1993 and is 100% New Zealand owned. It is governed by executive directors Doug Martin, Kevin Jenkins, Michael Mills, Nick Davis and Nick Hill, plus independent directors Peter Taylor (Chair) and Sir John Wells.

Commercial In Confidence
Contents 1. Introduction 1
2. Summary of findings and recommendations 4
3. Objectives of a performance framework 9
4. Logic model 12
5. Indicators 17
6. Cost effectiveness analysis 24
7. Measuring prevention 29
8. Supporting decision-making 31
Appendix 1: Current education programmes 36
Appendix 2: Summary of outcomes and measures 39
Appendix 3: Sample dashboard 40
Figures Figure 1: Stages of the social marketing model ..................................................................... 2 Figure 2: Layers of outcomes ............................................................................................... 10 Figure 3: Process effectiveness and outcome effectiveness ................................................ 13 Figure 4: Feasibility of causal attribution .............................................................................. 21

Commercial In Confidence
NZ Fire Service Commission, Developing line of sight report 1
1. Introduction This section of the report sets out the background and context for this assignment, its objectives and the approach used to carry out the assignment.
Context and objective In the current fiscal environment, all government agencies are under pressure to demonstrate value for money in their spending and are expected to show a strong ‘line of sight’ between expenditure, outputs and outcomes for the public.
For a number of years now, the New Zealand Fire Service Commission (the Commission) has invested heavily in research and evaluation in relation to its public education and other activities, in a spirit of continuous improvement, and to identify what works best. The Commission is now seeking to improve the tools it uses to analyse how its investment in public fire safety education programmes contributes to achieving the Commission’s overall fire safety outcomes.
We were asked to provide advice on a stronger methodology/framework to monitor performance and establish a stronger line of sight in relation to the public education programmes. This report contains advice to help position the Commission to get more out of its investment in performance information. In particular it aims to help the Commission to gather and integrate the right information to help it make better informed decisions about how and where it invests resources in public education programmes.
Background The Commission is the Crown’s primary fire risk management and service delivery agency. It is charged with the protection of life and property from the dangers of fire under the Fire Service Act 1975 and the Forest and Rural Fires Act 1977. The Commission delivers a comprehensive range of risk reduction, fire safety public education, emergency response and fire authority co-ordination services to protect New Zealand’s 4.4 million residents and visitors, $238 billion stock of buildings, and 27 million hectares of forest, tussock and grasslands from fire.1 The Commission’s outputs are classified into three output classes:
• fire safety education, prevention and advice
• fire fighting and other emergency service operations
• rural fire leadership and coordination.
1 Statement of Intent 2012/2015

Commercial In Confidence
NZ Fire Service Commission, Developing line of sight report 2
Public education programmes An important aspect of the Commission’s role is to develop and deliver effective public education programmes that promote fire safety. The goal of these programmes2 is to reduce the incidence and negative consequences of fire through fire safety education, prevention and advice.
Over the last thirteen years, the Commission has invested significantly in raising the public’s awareness of the risk of fire with particular emphasis on home fire safety. The Commission delivers fire safety education to urban and rural areas under the umbrella of the National Fire Safety Risk Management Plan.
These education programmes are aimed at the general public as well as at-risk groups. The Commission implements programmes across a range of areas such as FireWise programmes for schools, Fire Awareness Intervention Programme for juvenile firesetters, promoting benefits of residential sprinkler systems, and coordinating a national campaign to promote fire-safe behaviour in rural areas.
The Commission’s social marketing model The social marketing model adopted by the Commission incorporates a series of steps required to achieve sustained behaviour change, as shown in the diagram below.
Figure 1: Stages of the social marketing model
In its Statement of Intent 2012-15, the Commission observed that progress has been made in raising awareness. About half of the population wanted to take fire safety action but did not know what to do. The Commission has responded by changing its focus to target behavioural change. This has been done through "call to action" campaigns that are designed to encourage people to take simple precautionary fire safety actions.
Targeting at-risk groups The Commission uses its research undertaken over several years through its contestable research fund to identify the groups most at-risk from fire and target its education programme design and delivery towards these groups. The at-risk groups listed in the Commission’s most recent Strategic Plan are: Elderly; Low socio-economic groups; Disabled; Rental; Rural; Children; Maori and Pacific.
2 The range of programmes within this Plan is set out in Appendix 1.
Maintaining behavioural change
Changing peoples’ behaviour
Changing peoples’ views
Raising awareness

Commercial In Confidence
NZ Fire Service Commission, Developing line of sight report 3
For example, the Fire Knowledge Survey in 2011 showed a drop in the number of Māori who reported they had at least one working smoke alarm. The Commission has responded by increasing its focus on this issue via Māori television advertising and bilingual resources.
Scope This report proposes a performance monitoring framework to provide a stronger line of sight between expenditures on fire safety education programmes and the outcomes produced.
The performance monitoring framework is intended to serve as a structure for clearly describing the expectations of the programmes, visually depicting a clearer line of sight between outputs and outcomes. The framework is also used to support the use of meaningful indicators to assess performance over time.
Areas for further development that are outside the scope of this assignment are:
• actual evaluations of the fire safety education programmes
• tailoring of the generic performance monitoring framework to suit specific programmes
• further developing indicators in relation to the specific objectives of individual programmes.
Approach The methodology outlined in this report has been developed through the following processes:
• a review of the Commission’s documents including its Statements of Intent, Briefing for the Incoming Ministers report and the New Zealand Fire Service website
• interviews with a small number of key informants, including staff at the New Zealand Fire Service
• a literature review of similar programmes overseas to identify and learn from frameworks used in other jurisdictions
• applying our significant experience in ‘line of sight’ type frameworks in the context of New Zealand’s public sector accountability
• drawing from general evaluation design expertise.
This report synthesises the lessons and insights gained from conversations with Commission staff and combines these with a review of the Commission’s key strategic documents.

Commercial In Confidence
NZ Fire Service Commission, Developing line of sight report 4
2. Summary of findings and recommendations
This section sets out a summary of our findings and recommendations to improve the line of sight in relation to the Commission’s public education programmes.
What is ‘line of sight’? Achieving better line of sight simply means improving the Commission’s understanding of whether public education programmes are achieving their desired results, and the value that these programmes provide.
This understanding will help the Commission to demonstrate internally and externally how its interventions are intended to deliver results and good value, show the results that are being achieved, and re-calibrate its investment in public education programmes over time to keep delivering value.
Developing better line of sight requires:
• a clear understanding of the intended causal relationship between outputs (the interventions) and outcomes
• a better understanding of the relationship between expenditure (costs) and outcomes
• an ability to monitor progress in results over time, to show whether the interventions are having the desired effect.
This in turn requires the Commission to have the following tools in place:
• a logic model that clearly explains the causal link between outputs and outcomes
• suitable indicators of results across the programmes, and linked to the specific objectives of individual programmes
• suitable cost-effectiveness indicators
• a harm avoidance model that focuses on threats that are prevented from flourishing rather than on reducing established harms
• data gathering to support the monitoring of these indicators over time
• a way of analysing and presenting the performance information to draw out the key messages about performance.
This report provides our advice on what the Commission needs to implement to achieve this.
Observations Overall The Commission does not have a comprehensive performance monitoring framework that provides performance over time information in relation to its public education outputs and outcomes.

Commercial In Confidence
NZ Fire Service Commission, Developing line of sight report 5
Logic model The Commission’s model for its public education interventions is clear and orthodox, based on a standard social marketing model. A logic model exists but is not detailed enough to:
• easily communicate the line of sight between interventions and outcomes to staff and stakeholders
• use as a framework for a systematic monitoring approach that spans the public education programmes and links expenditure to outputs to outcomes.
Indicators At this stage, the Commission does not have a comprehensive set of performance and cost effectiveness indicators relating to the public education outputs.
While we believe that each public education intervention has clear and intentional goals and audiences that underpin their design, the specific objectives and targets are not as clearly articulated in the Commission’s Plan as they need to be for all public education programmes. Clear and specific objectives for each programme are a precondition for establishing and using effective performance measures. Each public education programme needs a specific and clear articulation of what it is trying to achieve, with reference to knowledge, attitude or behaviour shifts (with related targets). These objectives need to be clearly connected to the overall logic model for public education programmes.
Data Overall, the Commission is a relatively sophisticated user of information. The Commission invests systematically in research and evaluation to understand what works and what does not. Through this investment, the Commission collects a lot of information about fire-related outcomes, using a variety of survey tools and administrative data.
The ready availability of time series information and well-established data collection mechanisms will simplify the Commission’s adoption of a more focused framework to improve ‘line of sight’.
There is untapped potential for the Commission to use some rich sources of information that are currently not being systematically mined. This includes ‘frontline’ stories about what is working and what is not, to complement the data-driven view that will be provided through systematic monitoring of the right indicators.
Analysis and presentation While the Commission collects a lot of information about programme performance, the information is not always analysed and presented in a way that provides a clear and integrated picture of performance across the public education programmes.
Commercial In Confidence
NZ Fire Service Commission, Developing line of sight report 6
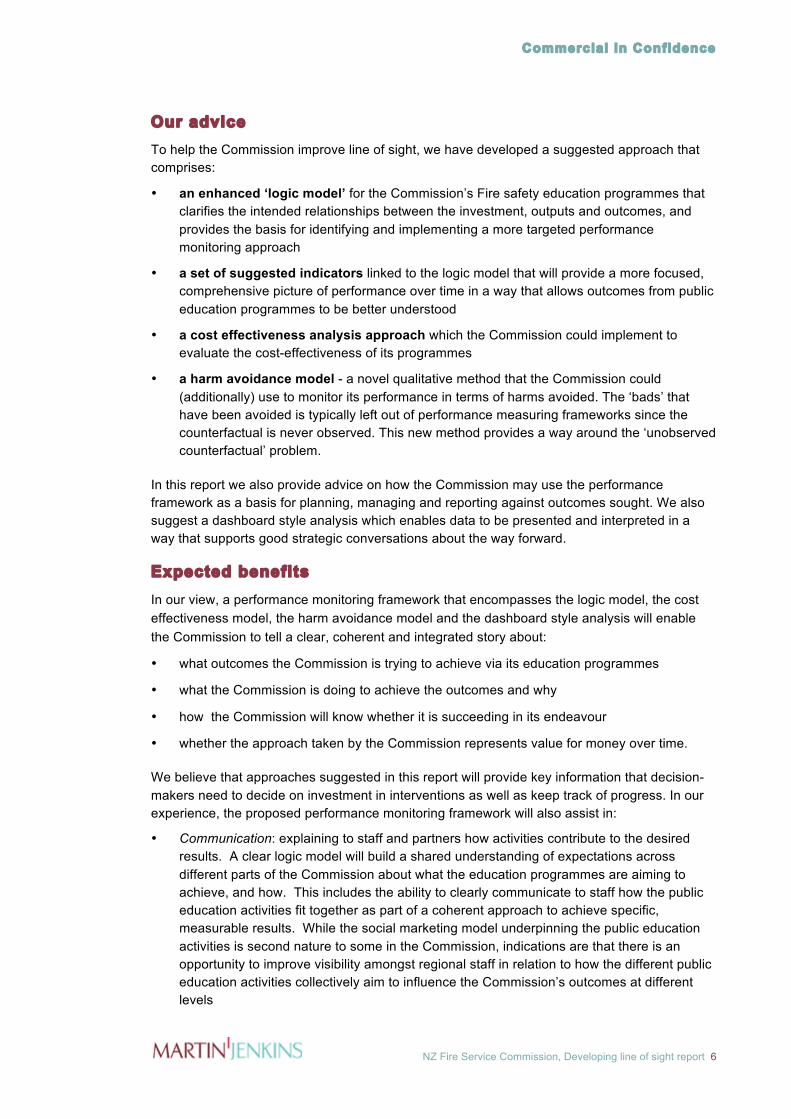
Our advice To help the Commission improve line of sight, we have developed a suggested approach that comprises:
• an enhanced ‘logic model’ for the Commission’s Fire safety education programmes that clarifies the intended relationships between the investment, outputs and outcomes, and provides the basis for identifying and implementing a more targeted performance monitoring approach
• a set of suggested indicators linked to the logic model that will provide a more focused, comprehensive picture of performance over time in a way that allows outcomes from public education programmes to be better understood
• a cost effectiveness analysis approach which the Commission could implement to evaluate the cost-effectiveness of its programmes
• a harm avoidance model - a novel qualitative method that the Commission could (additionally) use to monitor its performance in terms of harms avoided. The ‘bads’ that have been avoided is typically left out of performance measuring frameworks since the counterfactual is never observed. This new method provides a way around the ‘unobserved counterfactual’ problem.
In this report we also provide advice on how the Commission may use the performance framework as a basis for planning, managing and reporting against outcomes sought. We also suggest a dashboard style analysis which enables data to be presented and interpreted in a way that supports good strategic conversations about the way forward.
Expected benefits In our view, a performance monitoring framework that encompasses the logic model, the cost effectiveness model, the harm avoidance model and the dashboard style analysis will enable the Commission to tell a clear, coherent and integrated story about:
• what outcomes the Commission is trying to achieve via its education programmes
• what the Commission is doing to achieve the outcomes and why
• how the Commission will know whether it is succeeding in its endeavour
• whether the approach taken by the Commission represents value for money over time.
We believe that approaches suggested in this report will provide key information that decision-makers need to decide on investment in interventions as well as keep track of progress. In our experience, the proposed performance monitoring framework will also assist in:
• Communication: explaining to staff and partners how activities contribute to the desired results. A clear logic model will build a shared understanding of expectations across different parts of the Commission about what the education programmes are aiming to achieve, and how. This includes the ability to clearly communicate to staff how the public education activities fit together as part of a coherent approach to achieve specific, measurable results. While the social marketing model underpinning the public education activities is second nature to some in the Commission, indications are that there is an opportunity to improve visibility amongst regional staff in relation to how the different public education activities collectively aim to influence the Commission’s outcomes at different levels
Commercial In Confidence
NZ Fire Service Commission, Developing line of sight report 7
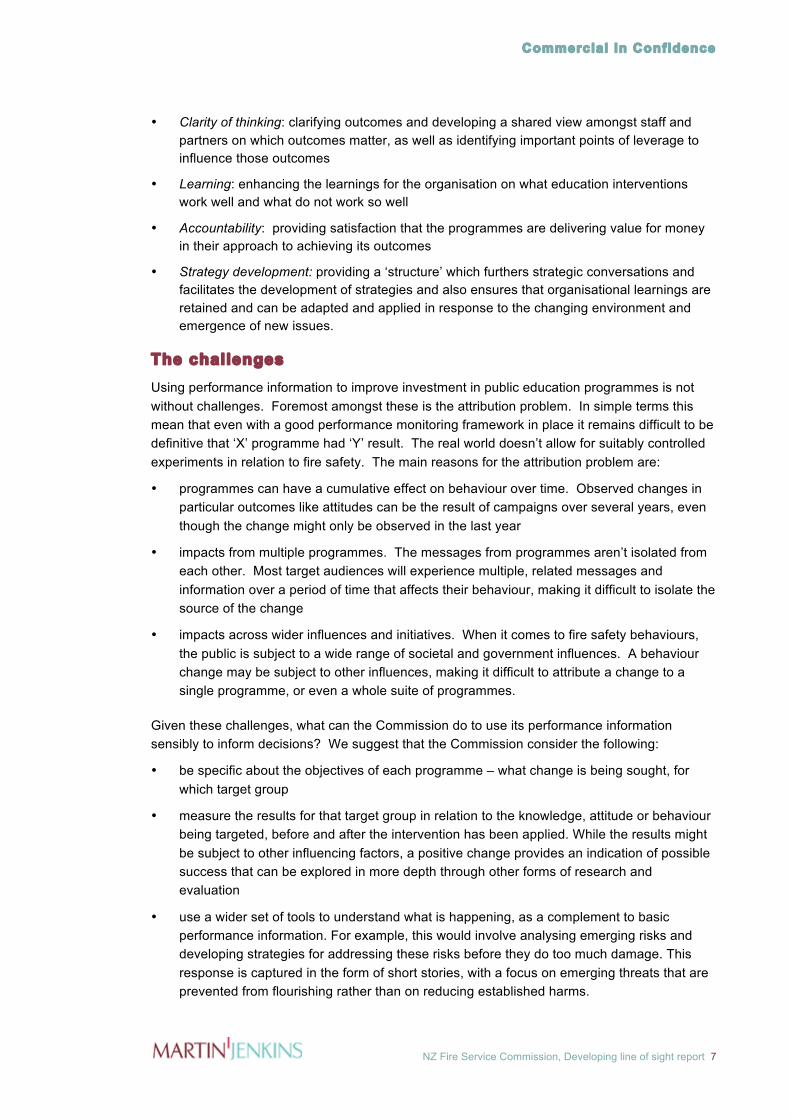
• Clarity of thinking: clarifying outcomes and developing a shared view amongst staff and partners on which outcomes matter, as well as identifying important points of leverage to influence those outcomes
• Learning: enhancing the learnings for the organisation on what education interventions work well and what do not work so well
• Accountability: providing satisfaction that the programmes are delivering value for money in their approach to achieving its outcomes
• Strategy development: providing a ‘structure’ which furthers strategic conversations and facilitates the development of strategies and also ensures that organisational learnings are retained and can be adapted and applied in response to the changing environment and emergence of new issues.
The challenges Using performance information to improve investment in public education programmes is not without challenges. Foremost amongst these is the attribution problem. In simple terms this mean that even with a good performance monitoring framework in place it remains difficult to be definitive that ‘X’ programme had ‘Y’ result. The real world doesn’t allow for suitably controlled experiments in relation to fire safety. The main reasons for the attribution problem are:
• programmes can have a cumulative effect on behaviour over time. Observed changes in particular outcomes like attitudes can be the result of campaigns over several years, even though the change might only be observed in the last year
• impacts from multiple programmes. The messages from programmes aren’t isolated from each other. Most target audiences will experience multiple, related messages and information over a period of time that affects their behaviour, making it difficult to isolate the source of the change
• impacts across wider influences and initiatives. When it comes to fire safety behaviours, the public is subject to a wide range of societal and government influences. A behaviour change may be subject to other influences, making it difficult to attribute a change to a single programme, or even a whole suite of programmes.
Given these challenges, what can the Commission do to use its performance information sensibly to inform decisions? We suggest that the Commission consider the following:
• be specific about the objectives of each programme – what change is being sought, for which target group
• measure the results for that target group in relation to the knowledge, attitude or behaviour being targeted, before and after the intervention has been applied. While the results might be subject to other influencing factors, a positive change provides an indication of possible success that can be explored in more depth through other forms of research and evaluation
• use a wider set of tools to understand what is happening, as a complement to basic performance information. For example, this would involve analysing emerging risks and developing strategies for addressing these risks before they do too much damage. This response is captured in the form of short stories, with a focus on emerging threats that are prevented from flourishing rather than on reducing established harms.

Commercial In Confidence
NZ Fire Service Commission, Developing line of sight report 8
Recommendations We recommend that the Commission take the following steps to improve its ability to understand and communicate its line of sight story in relation to its public education programmes:
1 Adopt a clear logic model: this report proposes a clear logic model for the public education programmes that reflects the social marketing model for intervention, tells the story clearly, and can be used to communicate with staff and stakeholders about how Commission expects its interventions to achieve the desired results.
2 Identify clear, measurable objectives for each programme. We suggest that, prior to confirming the indicator set described in this report, the Commission clearly articulates the specific objectives (including specific target groups and knowledge, attitude and/or behaviour change sought) and targets (where appropriate) for each public education programme.
3 Confirm the indicators: a suite of indicators is proposed, based on existing information sources. We recommend that the Commission add to the indicators further as required to reflect the desired changes from specific programmes.
4 Expand the set of measurement tools used to understand performance: we recommend that the Commission develop and use additional performance measurement tools to support analysis and prioritisation decisions. These include:
a) cost effectiveness analysis, involving developing cost effectiveness indicators linked to the main changes being targeted through public education programmes
b) front line insights into programme performance at regional and area level, using the new business analyst roles to gather and analysis insights
c) the harm avoidance model described in this report.
5 Extend the Fire Knowledge Survey: consider extending the fire knowledge survey sample so that it is capable of supporting area-level performance information.
6 Implement a consolidated dashboard analysis and reporting approach: we recommend that the Commission implement the proposed dashboard approach to analyse and report on implications of performance information. This will provide a clear way of structuring the information required to support decisions about investment. The Commission is already doing aspects of this but we propose a more consolidated approach that will help the Commission to draw insights into performance across the programmes.
7 Leverage the area/regional perspective more actively: use the regional business analyst staff to implement the performance framework at area/regional level.

Commercial In Confidence
NZ Fire Service Commission, Developing line of sight report 9
3. Objectives of a performance framework This section of the report outlines the objectives of a performance framework and articulates its role in informing and refining decision-making.
Purpose of a performance framework Choosing the right mix of interventions and optimising this mix over time relies on having a good framework and process for measuring the effectiveness and efficiency of interventions. A good performance monitoring framework tells a clear, coherent and integrated story about what an organisation, plan or programme is trying to achieve, what it is doing to achieve it, how it will know whether it is succeeding, and whether the approach is cost-effective over time. It should clearly articulate the rationale for an intervention, and provide (through targeted monitoring) the key information that a decision-maker needs to refine the investment in different activities and keep track of progress.
A robust performance monitoring framework:
• enables the organisation to measure, or at least indicate, the effectiveness of its interventions over time, and consider the relationship between results and the cost of the interventions
• defines and measures effectiveness in a way that directly links to desired impacts and outcomes, taking into account any specific objectives that are being pursued
• can be used across a wide range of interventions, including future interventions and the design of future interventions.
The key role of the framework is to provide essential information on the programmes’ performance over time. The information should be in a distilled form to facilitate strategic decisions on the future of the programme(s). Using the framework to monitor performance in this way enables questions to be revealed and examined that relate to programme strategy and planning, including:
• What has been happening over time?
• Why did an observed pattern of results happen?
• Where is performance likely to head over time if we continue the current approach?
• Does the current suite of interventions deliver value for money, when results are considered alongside expenditure on interventions?
• What changes might need to be made to improve or sustain performance over time, and in relation to which target groups?
• What strategic choices or options do we have?

Commercial In Confidence
NZ Fire Service Commission, Developing line of sight report 10
Articulating what a programme or a suite of programmes is intended to accomplish is critical to performance monitoring and reporting. In our experience, we often find that programme intentions are described either in general terms (eg vision, mission of the organisation which describe at a high level the end state sought) or in more specific output terms (eg low level, immediate results expected). Both approaches are less than satisfactory as they don’t shed light on the outcomes ‘in the middle’ between outputs and high level goals.
Figure 2: Layers of outcomes
In Figure 2 above, we illustrate the layers of outcomes that lie in the middle between outputs and the ultimate outcomes. These middle layers of outcomes should be at the centre of performance monitoring, as they represent the level at which the programmes can be expected to have a strong, more direct influence, without the strong influences from other factors that are often at play in relation to high level outcomes (in other words, issues of attribution).
The Commission’s current framework The Commission has developed an overarching outcomes framework that covers all of its outputs. This is represented in the Statement of Intent and Strategic Plan 2012-2017. This framework incorporates the public education outputs and broad intended outcomes resulting from these outputs. However, being pan-organisation in its focus, this framework understandably does not contain sufficient detail about how the education programmes are intended to influence behaviours, and ultimately fire safety outcomes. A more detailed performance monitoring framework tailored to evaluate fire safety community education

Commercial In Confidence
NZ Fire Service Commission, Developing line of sight report 11
programmes is required to support a line of sight story about the value of public education programmes.
The proposed framework When considering performance of a programme or a suite of programmes, we recommend the application of ‘logic models’ and cost effectiveness analysis. We are also suggesting a harm avoidance model, which is relevant to circumstances where good performance implies avoidance of adverse events, which means there is no data.
• the logic model represents a sequence of impacts and outcomes that occur as a result of the programme’s activities – in other words, a diagrammatic representation showing ‘line of sight’. In particular, it shows the mechanisms (or theory of change) by which the interventions seek to change the behaviour that the programmes aim to influence. The logic model is used as a framework for identifying key indicators that can be used to tell a story of the performance of the programmes in terms of their impact on the desired outcomes.
• cost effectiveness analysis is a tool that can be used to track the outcome gains generated per dollar of programme expenditure. It can offer insight on the cost effectiveness of the whole suite of programmes and it can also be used compare the effectiveness of programmes.
• the harm avoidance model is particularly relevant to agencies involved with harm-reduction. The performance monitoring of programmes of such agencies should be measured by the harms the programmes avoided.
• an analytical tool (dashboard style model with accompanying analytical commentary) to interpret and present the results from applying the performance framework.
Commercial In Confidence
NZ Fire Service Commission, Developing line of sight report 12
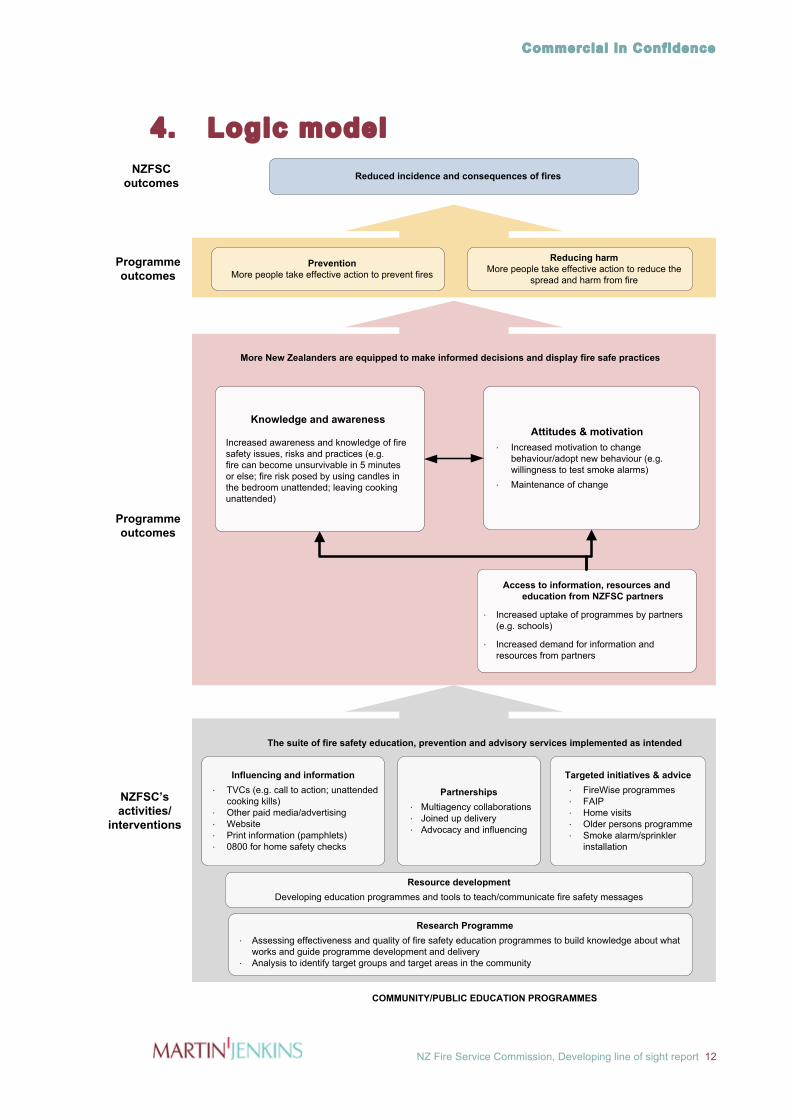
4. Logic model
More New Zealanders are equipped to make informed decisions and display fire safe practices
Knowledge and awareness
Increased awareness and knowledge of fire safety issues, risks and practices (e.g. fire can become unsurvivable in 5 minutes or else; fire risk posed by using candles in the bedroom unattended; leaving cooking unattended)
Attitudes & motivation·∙ Increased motivation to change
behaviour/adopt new behaviour (e.g. willingness to test smoke alarms)
·∙ Maintenance of change
Programme outcomes
NZFSCoutcomes
NZFSC’s activities/
interventions
Reduced incidence and consequences of fires
Partnerships·∙ Multiagency collaborations·∙ Joined up delivery·∙ Advocacy and influencing
Influencing and information ·∙ TVCs (e.g. call to action; unattended
cooking kills)·∙ Other paid media/advertising·∙ Website·∙ Print information (pamphlets)·∙ 0800 for home safety checks
Access to information, resources and education from NZFSC partners
·∙ Increased uptake of programmes by partners (e.g. schools)
·∙ Increased demand for information and resources from partners
Resource development Developing education programmes and tools to teach/communicate fire safety messages
Research Programme·∙ Assessing effectiveness and quality of fire safety education programmes to build knowledge about what
works and guide programme development and delivery·∙ Analysis to identify target groups and target areas in the community
PreventionMore people take effective action to prevent fires
COMMUNITY/PUBLIC EDUCATION PROGRAMMES
Targeted initiatives & advice ·∙ FireWise programmes·∙ FAIP·∙ Home visits·∙ Older persons programme·∙ Smoke alarm/sprinkler
installation
The suite of fire safety education, prevention and advisory services implemented as intended
Reducing harmMore people take effective action to reduce the
spread and harm from fire
Programme outcomes

Commercial In Confidence
NZ Fire Service Commission, Developing line of sight report 13
The different layers of the logic model The proposed performance framework is concerned with performance in relation to ‘results’ – that is, outcomes and not outputs. Figure 3 below distinguishes between process/implementation effectiveness (the efficiency with which inputs are converted into outputs) and outcome effectiveness, which reflects the success of the programmes in achieving the outcomes.
Figure 3: Process effectiveness and outcome effectiveness
Inputs Immediate outcomes OutputsActivities
Process/ Implementation Effectiveness
Ultimateoutcomes
Intermediate outcomes
Outcome Effectiveness
Outputs Outputs are the range of fire safety education activities that the Commission carries out to achieve its outcomes. From a performance monitoring perspective, it is standard practice to assess dimensions such as quality, coverage, timeliness, and cost of these outputs, to determine whether key messages are being conveyed in a relevant and appropriate manner to the target audience.
For the purposes of the framework we have grouped public education outputs into five categories, which are mutually supporting:
• Influencing and information: this cluster of activities includes broad influencing and information campaigns delivered direct to the audience by the Commission (including television advertising campaigns and print information/campaigns). Under this set of activities, the Commission aims to influence a wide audience by ‘pushing’ messages to them
• Targeted initiatives and advice: this set of activities involves the delivery of programmes by trained Fire Service staff to specific target groups. The programmes (eg FireWise, FAIP, home visits) involve direct engagement with the target groups (eg children, elderly, young adults, the disabled), so offer a different, customised approach, compared to the ‘broadcast’ approach described above
• Partnerships: the Commission aims to improve knowledge and attitudes by partnering and working through other organisations. This is a cost-effective way of improving the reach for the Commission’s information and education, and reinforcing the core messages of the Commission’s own direct-to-public activity
• Resource development: the Commission invests in the development of programmes and tools to teach and communicate fire safety messages. The Directory of Fire Risk Management Tools illustrates the range of resources designed for educating the public. While some of these resources are focused on the community as a whole, many are targeted at the at risk, vulnerable groups
Commercial In Confidence
NZ Fire Service Commission, Developing line of sight report 14
• Research programme: the Commission invests in research and evaluation to understand what works, what doesn’t, who should be the focus of effort in the public education programmes, and how to target these groups.
Outcomes Programme level outcomes (Immediate and Intermediate outcomes) These are referred to as ‘impacts’ in the Statement of Intent. This layer describes the intended direct impact of the outputs. Monitoring programme-level outcomes provides a way of tracking direct results of activities over time, both overall and in relation to specific target audiences, as well as different regions.
Monitoring performance at this layer provides a guide to:
• whether the programmes seem to be having the intended effect (eg on awareness, attitudes and behaviours)
• whether the overall level of investment in achieving a specific impact, or influencing a particular target audience, might need to be scaled up or down
• whether the programmes as a suite represent value for money in terms of cost compared to degree of impact.
We note that it is very difficult to disentangle the impact of individual campaigns or programmes on performance results at the level of the whole population, particularly for the higher level outcomes. While this would be ideal to inform investment decisions, in most cases the apportionment of impact across different public education programmes is methodologically challenging. Later in this section we provide further explanation of the nature of the ‘attribution problem’, and potential ways to better understand and deal with attribution. This includes monitoring the change in outcomes for a specific target group or behaviour that is being targeted by a specific programme.
Higher level outcomes This layer includes Commission outcomes and their relationship to broader goals for New Zealand. These outcomes capture the overall changes we expect to see over time when the impacts of the programmes are fully realised.
Commentary on the logic model Education and persuasion are at the heart of the Commission’s fire safety education work. The logic model assumes that the Commission’s outcomes of reduced incidence and consequences of fire will be achieved through willing adoption of good practice by the target groups.
This will only occur when individuals understand what is required of them and why. Given the relative cost of enforcement as an intervention, encouraging individuals to voluntarily change their behaviour underpins most social marketing efforts.

Commercial In Confidence
NZ Fire Service Commission, Developing line of sight report 15
The proposed logic model breaks down the ‘pathway’ to sustained behaviour change into three related, measurable impact categories: knowledge and awareness; attitudes and motivation; access to information, resources and education. These categories reflect the social marketing model that the Commission uses.
Knowledge and awareness Knowledge and awareness are critical foundations for behaviour change because they shape peoples’ attitudes as well as their ability to implement the right behaviours and practices. Audiences need to understand:
• fire risks in relation to their context, including risk factors, causes and consequences
• their personal role in avoiding and mitigating fire risks and consequences
• the practical actions and steps that can help them implement good fire safety practice.
Understanding levels of knowledge and awareness of key risks and practices over time, amongst different target audiences, will provide a good guide to the annual impact of the Commission’s public education activities. This insight will enable the Commission to understand progress, identify gaps in particular knowledge amongst target audiences, and indicate where efforts in this outcome area may be reaching diminishing returns. This enables reallocation of education resources to target audiences or types of message with a potentially higher impact.
Attitudes and motivation An overarching goal of the education programmes is to improve the attitudes and motivation of the public (particular the at-risk groups) in relation to fire safety practices. Attitudes and motivation provide the call to action - no amount of knowledge about fire safety is useful unless people are motivated to do something about it.
In some cases, simply having knowledge of fire safety risks and safe practices is enough for people to take the required action to manage risk effectively. However, there are people for whom knowing the risks is not sufficient to change behaviour. The key here is to modify the attitudes of certain segments of the public, so that they see risk management as important, and as something that they should take personal responsibility for.
Understanding attitudes and motivation over time is therefore critical to the Commission’s understanding about the impact of its education programmes. The relationship between attitudes and actions can be indicated (but not proven) through monitoring. For example, if an increase in positive attitudes correlates with an increase in actions taken to mitigate fire risk, this implies a positive impact of programmes aimed at changing attitudes, which can be tested through more specific research.
Measurement of knowledge and attitudes will also inform understanding of the extent to which an increase in knowledge is translating through to a change in attitudes over time, although being definitive about this would also require targeted research to untangle causes of attitudinal change. One issue is that, unlike acquiring knowledge, a change in attitudes can result from an accumulation of campaigns and influences over a period of time. This means that a change in

Commercial In Confidence
NZ Fire Service Commission, Developing line of sight report 16
attitudes in one year might not be completely attributable to targeted interventions delivered in that year.
Access to information, resources and education The Commission aims to influence knowledge and attitudes directly through programmes and campaigns that provide information and tools directly to the general public, and particular at-risk groups.
But the Commission also aims to improve knowledge and attitudes by partnering and working through other organisations. This is a cost-effective way of improving the reach for the Commission’s information and education, and reinforcing the core messages of the Commission’s own direct-to-public activity.
The Commission aims to work through others (including educational institutions, community groups and other government agencies) to increase:
• availability of information and education on fire safety practices
• uptake of fire safety programmes.
Key partnerships in relation to home fire safety education include:
• Schools and educational institutions
• Community groups (ethnic groups, sporting clubs and churches, Aged Concern, Veterans Affairs, Citizens Advice Bureau, RSA)
• Government agencies (MSD/WINZ)
• Doctors
• Disability organisations
• Corporate partners (Mad Butcher, The Warehouse, Countdown)
• Landlords.

Commercial In Confidence
NZ Fire Service Commission, Developing line of sight report 17
5. Indicators The strategic plan does not currently appear to identify the range of specific indicators of performance relating to public education programmes, in a way that facilitates performance monitoring of education programmes. However, the Commission already gathers a variety of data to monitor performance of its public education activities, particularly through the annual Fire Knowledge Survey, as well as incident and Fire Investigation data. We have used the latest version of the survey to identify specific indicators linked to each of the Programme Outcomes illustrated in the logic model.
Suggested indicators The table below presents a consolidated picture of possible performance over time indicators for the public education programmes. The Survey does not provide suitable indicators in relation to the outcomes relating to access to information, resources and education. In this case we have shown the types of indicators that might be applied, without identifying specific data sources.
Programme outcome Key indicators
High level fire outcomes Reduced incidence and consequences of household fires
• Incidence of household fires • Consequences of household fires (extent of harm) • Causes of household fires (by proportions of total)
Actions to prevent fires and reduce harm
Proportion of households that: • have at least one working smoke alarm (and other smoke alarm related
behaviours) • own other fire safety equipment • have a fire escape plan • conduct activities that carry a fire risk (based on defined list of activities)
Attitudes and motivation • Commitment to fire safe lifestyle (conversion model) • Attitudes to fire safety (measures reaction to a series of statements indicating
attitudes)
Knowledge and awareness Increased knowledge and awareness of fire safety issues, risk and practices
Knowledge of perceived fire danger and actions to prevent fire • Perceived level of fire risk relating to a list of unsafe practices • Awareness of time in which fire becomes unsurvivable
Knowledge of actions to take in case of fire • First actions taken in a serious fire • All actions taken in a serious fire • Awareness of the Fire Service emergency number
Access to information, resources and education
• Number of schools participating in fire safety programme delivery in each region
• Amount of fire safety information distributed through partners annually

Commercial In Confidence
NZ Fire Service Commission, Developing line of sight report 18
Measuring aggregate and targeted performance for each programme outcome The indicator set should show performance over time in relation to:
• the key programme level outcomes (aggregated across the population at national level)
• subsets of the population in relation to the key programme level outcomes (national level and/or regional level, disaggregated into key at-risk or target groups). Data needs to be available in disaggregated form to understand programme level outcomes in relation to specific at-risk parts of the population and/or to understand regional differences. This data would be reported on selectively to indicate the existence of problem areas and progress in relation to these problems
• specific outcomes (eg changing a particular behaviour) being targeted by the Commission’s interventions in relation to specific target groups. This is necessary to better understand the performance of specific programmes in relation to their targeted outcomes and audiences.
Quantitative data From our observation of available data, it seems that data is generally readily availability to support measurement against the programme outcomes. The Commission is a data-rich agency and there is a substantive amount of quantitative data being collected by various parts of the agency for a variety of reasons through a number of channels including, but not limited to:
• The Fire Knowledge Survey
• Communication effectiveness monitor
• SMS activity counts
• FAIP database
• Recidivism rates
• Incident data.
In addition to these channels, there are a number of project level evaluation assignments that are undertaken periodically to determine whether or not expected outcomes are being achieved.
Given the large amount of data that the Commission collects, we believe that a large number of relevant indicators can be constructed using the existing data. However, there may be some gaps in data, and in some cases the data collected (eg through survey questions) may not be completely aligned with the specific indicators of performance.
We note that the Fire Knowledge Survey sample size does not readily support a robust view of performance over time at area level. The Commission may wish to explore the implications of increasing the survey sample to enable the performance framework to support monitoring at area level.

Commercial In Confidence
NZ Fire Service Commission, Developing line of sight report 19
Qualitative data Measurement of public sector programmes is sometimes less about precision and more about increasing decision-makers’ understanding and knowledge about what works. In light of this, it is useful to consider a measurement approach that incorporates softer, qualitative measurement tools to tell a richer story about impact. The programmes implemented by the Commission interact with each other in a variety of ways to generate and contribute to the outcomes. Determining the extent to which individual programmes contributed to aggregate-level outcomes is usually not possible even with well-designed indicators.
In addition to tracking indicators based on quantitative data over time, it is worthwhile to actively engage in discussions to mine alternative data sources3. This entails:
• gathering additional evidence, through specifically designed evaluations or case studies
• expert opinion – gathering opinions of people who are outside of the programme and using their expertise to determine whether the explanation of impact is plausible
• systematically gathering stories about project level outcomes - ie stories of the projects; some may argue that these stories still do not prove a causal connection. But consider a hypothetical scenario wherein over a two to three year period, the Commission collects 15-20 stories of projects, and 12 of them showed significant shifts in their knowledge, understanding and actions as a result of the exposure to the education programmes. Despite the absence of a quantitative causal attribution, it would be reasonable to work under the premise that there might be a causal relationship. The pattern of practice followed will tell a compelling story of an organisation that is data-driven and results oriented
The style and structure of the stories that go with each of the projects should be consistent across the intervention. Each ‘project’ story should be covering the following areas:
– the data and analysis that led to the focus on the issue
– indicators that are likely to provide sense of progress being made with regard to the issue
– description of the intervention implemented
– the outcomes, measured in terms of changes in the indicators
– any decisions resulting from the outcomes achieved
• systematically mining the experiences and observations of fire service staff – most regulatory innovations are bottom-up and arise from the field. Finding a way of connecting the dots between the field and macro level national data will enrich the understanding of performance. It enables staff to question the significance of their observations in the field and focus their efforts in more targeted ways. The relatively new Business Analyst positions at regional level might be a good vehicle for collecting and relaying insights from the field within each region
3 We would like to acknowledge that the Commission currently uses a range of research methods to build a picture of
effectiveness of its interventions. There may be opportunities to fine tune or build on existing efforts to develop a more systematic and consistent approach across the organisation.

Commercial In Confidence
NZ Fire Service Commission, Developing line of sight report 20
Choosing indicators In future, the Commission may need to add or change the indicators it uses so that they reflect changes in strategy, or better knowledge about what information is most likely to be indicative of changing knowledge, attitudes and behaviours towards managing fire risk.
We have set out a possible framework below that might assist the Commission when it makes future decisions about adopting particular indicators.
Attribution issues The Commission’s interventions are intended to collectively produce specific outcomes: reduced incidence of and consequences from fires. Trying to measure the impact of individual interventions, or the entire suite of education interventions, on the Commission’s ultimate fire safety outcomes presents significant challenges relating to attribution. In essence, how much of the observed change in results can be attributed to the Commission’s intervention, compared to other influences?
First, the impact of the suite of education programmes on Commission outcomes can be difficult to disentangle from other factors that can influence these outcomes. While it is possible to measure whether the outcomes are actually occurring, it is not always feasible to empirically link the full change in the outcome back to these interventions.
In practice, attribution is more likely to be feasible at the programme outcome level rather that at the ultimate outcome level.
Investigate how to improve measurement (eg Commitment to fire safe lifestyle)
High identifiability with outcome
Low identifiability with outcome
Easy to measure Difficult to measure
Use the indicator (eg Proportion of households that have at least one working smoke alarm/own other fire safety equipment)
Do not pursue further
(eg Use of flame retardants)
Limited value (eg Amount of fire safety information distributed through partners annually)

Commercial In Confidence
NZ Fire Service Commission, Developing line of sight report 21
Figure 4: Feasibility of causal attribution
Inputs Immediate outcomesOutputsActivities
Process/Implementation EfficiencyOut of scope
Intermediate outcomes
Ultimateoutcomes
Possible Maybe possible
Maybe possible Unlikely
Causal attribution
At the programme outcome levels (eg between a change in attitudes and resulting behaviour change) the Commission may require some targeted evaluative approaches to understand the connection between the interventions, the shifts that are being observed (eg attitude change) and the consequential impact on higher level outcomes (behaviour change).
Example
Observed changes in outcomes can occur due to other government actions or programmes, economic factors and/or other social trends. For instance, smoking inside the house has been a significant fire risk and led to significant number of household fires. In 2010, the Ministry of Health launched a media campaign to encourage the public to ‘take the smoke outside’, with the aim of reducing the impact of second hand smoking. This initiative was driven by an objective that was not related to fire safety, but in fact led to a reduction in the number of residential fires. In this instance ‘success’ can only be partially attributed to specific interventions of the Commission and resulted in part from another government agency pursuing its objectives.
Second, the audiences for the Commission’s fire safety education and messages are likely to be exposed to messages from different Commission programmes over a long period. While it might be possible to attribute short-term knowledge and awareness improvements, and even behaviour change, to a specific campaign, long term sustained behaviour change is likely to be the product of a wide range of influences, including the cumulative impact of different Commission programmes.4 This makes it difficult and costly to assess and attribute the relative long-term impact of individual activities in the suite of programmes on sustained behaviour change, except where a specific intervention is targeting a specific change in relation to a specific target group, in the absence of other programmes that might have an influence on the relevant outcome.
4 This is common in tourism destination marketing, for example, where a preference and intention to visit a particular
destination can be built up over a period of time that extends beyond the immediate campaign, and can be due to the cumulative impact of campaigns over a period of years.

Commercial In Confidence
NZ Fire Service Commission, Developing line of sight report 22
Example
In 2006/07, the Commission was between advertising agencies and as a result there was a six month period when there was no television advertising of fire safety messages. When the next Fire Knowledge survey was undertaken, the findings showed a significant drop in levels of awareness and knowledge of fire safety amongst the public. This ‘experiment’ established a strong causal link between television advertising and public recall and retention of fire safe messages and isolated the specific intervention that led to the outcome. In this instance, it is clear that the lack of advertising did lead to drop in knowledge and awareness. However, without stopping a normally ongoing programme or activity to measure the effect, it is difficult to determine what the impact would be if it was stopped.
The challenge for the Commission is to demonstrate that the investment in public education programmes is making a difference. However we must acknowledge that determining definitively the extent to which a government programme contributes to a particularly outcome is not always possible, even with a carefully designed evaluation study. While these studies can provide strong credible evidence of the programme’s impacts, there is no guarantee. Therefore we need to start talking of reducing the uncertainty in our knowledge about the contribution of the programme. We recommend two broad approaches to deal with attribution issues: contribution analysis and quasi experimental design. The former can be used to evaluate ongoing programmes and the latter can be put in place now to monitor the performance of future programmes.
Contribution Analysis Contribution Analysis 5 involves painting a credible picture about attribution. Under this approach, one would glean as much insight as one can from performance measures and then explore and demonstrate plausible associations – the ultimate test being whether a reasonable person with the knowledge of what has occurred agrees that programme contributed to those outcomes?
The CA approach involves the following steps:
• acknowledge the problem with measurement that is dependent on indicators alone
• present the logic of the programme
• identify and document changes in programme outcomes
• use indicators to tell the story of how the programmes may have contributed to changes on outcomes
• track performance over time, examine is there a correlation between investment in the programme and the documented outcome changes over time
• gather relevant additional evidence including softer, qualitative tools; expert opinion; systematic inquiry into practice by staff across the regions.
• triangulate the evidence
• discuss and discount alternative explanations. 5 Mayne, J. (1999). Addressing Attribution through Contribution Analysis: Using Performance Measures Sensibly.

Commercial In Confidence
NZ Fire Service Commission, Developing line of sight report 23
Quasi-experimental design Using data on outcomes over multiple time periods, before and after the introduction of education programmes, it may be feasible to map the expenditure on the programmes to outcomes and establish a strong line of sight. In this approach, since there is baseline pre-programme data it is possible to filter out most if not all the external effects and alleviate issues of attribution. This approach is not likely to produce reliable evidence for programmes that are already in existence if pre-programme data is not available. Indeed, the model will be less useful even for new programmes whose ex-ante outcomes mimic that of existing programmes. It is possible to modify the programmes over time and track the resulting changes in all relevant factors to determine if the programmes are delivering or not. Or, in addition to measuring the impacts on those who are receiving the programme, the Commission could also measure changes occurring in a similar comparison group that does not receive the programme. The difference in the outcomes across the programme receiving group and the control group enables us to make causal attributions.
This approach is future looking – it is better suited to evaluate programmes that will be introduced in the future. However, the model has to be put in place now if it is to be used in the future to test a range of education programmes to determine whether or not the line of sight from activities to outcomes is credible and clear. In keeping with this principle, all interventions should be required, in the design stage, to demonstrate intervention logic.

Commercial In Confidence
NZ Fire Service Commission, Developing line of sight report 24
6. Cost effectiveness analysis Purpose of cost effectiveness measurement The current fiscal climate has generated pressure to demonstrate value for money in spending and budgetary constraints mean that there is not enough money to fund all possible community education programmes. There is a need to prioritise spending and demonstrate a strong ‘line of sight’ between the programme spending and the identified outcomes. This means that the Commission can’t just invest in the programmes that will lead to the best results – the programmes also need to reflect good value for money. The Commission needs to make deliberate choices among different programme options to maximise value generated per dollar of expenditure on the programmes. Cost effectiveness analysis, a form of economic evaluation, is a tool that the Commission can employ to inform these choices.
A programme is considered cost effective if it is able to produce larger gains measured in terms of outcomes (immediate, intermediate or ultimate) for relatively low costs, compared to alternative options. Cost effectiveness is a relative concept. By informing decisions with a view on cost effectiveness, the Commission can avoid overspending on less effective education programmes and underspending on the more effective ones.
Specifically, the Commission could ask either or both of these questions:
• Is the overall suite of education programmes cost effective?
• What specific programmes (ie interventions) are able to generate better outcomes per unit of cost?
Steps in developing a cost effectiveness framework There are six steps to developing a cost effectiveness framework. These are:
• Define the scope of the cost effectiveness analysis
• Choosing the cost perspective
• Selecting the type of analysis
• Designing the study
• Identifying an effectiveness indicator
• Calculating the cost-effectiveness ratio.
Step 1: Defining the scope Every education programme would have its specific scope – its purposes and boundaries. To ensure that the cost effectiveness ratios are accurately estimated, it would be important for the Commission to document:
• the target population (eg elderly; low socio-economic groups; disabled; children; Maori and Pacific people; general population etc.)
• regional focus of the programme, if any
• programme type (influencing and information; targeted initiatives; partnership based)

Commercial In Confidence
NZ Fire Service Commission, Developing line of sight report 25
• timeframe of the programme and the cost effectiveness analysis
• the nature of the intervention (eg workshops, distribution of information etc)
• the frequency of the intervention (eg number of workshops).
In practice, the scope of the analysis has to be determined through a consultation process with programme managers, ground level staff and the analysts taking up the cost effectiveness modelling work.
Step 2: Choosing the cost perspective Costs may be variously defined such as costs to the Commission, costs to society, or costs to the target audience. There is nothing correct or wrong about any specific cost perspective, only that it is important to acknowledge the cost perspective being considered. For example, a programme that is cost effective to the Commission may not be cost effective if societal costs are considered. Consider a programme that uses volunteers - accounting for the time of the volunteers may render the programme less cost effective if this time is included in the costs.
Step 3: Selecting the type of analysis Depending on what is being evaluated, the Commission could consider a cost minimisation approach or standard cost effectiveness analysis.
When alternative programmes with similar expected outcomes are evaluated, a cost minimisation approach works well. Put simply, the programme with the lower cost is the better one.
However, the Commission may need to evaluate programmes where the expected outcomes are not similar. In these cases, there is a need to compare both costs and outcomes. This needs a method to translate varying programme outcomes into a comparable metric. Alternatively, the Commission might be interested in determining an ultimate return on investment (ROI) from the identified programme in monetary terms. Calculating ROI will involve imputing a monetary value on the outcomes. For example, if ultimate outcomes are considered, ROI calculations will require data on what is the monetary value of ‘lives saved’ or ‘costs avoided’ for each dollar spent on the programme.
Step 4: Designing the study This step specifies how costs and benefits will be measured. Where the cost perspective is narrowly defined as the Commission’s costs, the financial costs of the programme are determined using the accounting information available. If a broader cost perspective is chosen, then imputations of costs will be needed.
Estimating outcomes is likely to be more challenging given the issues of attribution that we have previously discussed. Either the contributory analysis approach of the Quasi-experimental design may form the foundation of mapping outcomes to costs.

Commercial In Confidence
NZ Fire Service Commission, Developing line of sight report 26
Step 5: Identifying indicators of outcomes A programme’s effectiveness can be measured in terms of its outputs, immediate outcomes, intermediate outcomes and ultimate outcomes. Admittedly, immediate and intermediate outcomes are only partial measures of effectiveness but they are less vulnerable to attribution issues compared to ultimate outcomes. Moreover, if the objective is to compare individual programmes within the suite of programmes offered by the Commission, using ultimate outcomes is not feasible since they are common across programmes. Performance in relation to the immediate and intermediate outcomes may be more attributable to specific interventions. It is important to select the right programme outcomes to use as the basis of a cost-effectiveness indicator.
Step 6: Calculating cost effectiveness ratios Once both the costs and the effectiveness of different alternative options have been estimated, a cost effectiveness ratio (CER) can be calculated.
𝐶𝐸𝑅 =𝑃𝑟𝑜𝑔𝑟𝑎𝑚𝑚𝑒 𝐶𝑜𝑠𝑡
𝐴𝑏𝑠𝑜𝑙𝑢𝑡𝑒 𝑂𝑢𝑡𝑐𝑜𝑚𝑒 𝑆𝑐𝑜𝑟𝑒
To assess the optimal level of programme expenditure, one could calculate marginal effectiveness ratio (MCER) over say, two time periods.
𝑀𝐶𝐸𝑅 =𝐶ℎ𝑎𝑛𝑔𝑒 𝑖𝑛 𝑃𝑟𝑜𝑔𝑟𝑎𝑚𝑚𝑒 𝐶𝑜𝑠𝑡
𝐶ℎ𝑎𝑛𝑔𝑒 𝑖𝑛 𝐴𝑏𝑠𝑜𝑙𝑢𝑡𝑒 𝑂𝑢𝑡𝑐𝑜𝑚𝑒 𝑆𝑐𝑜𝑟𝑒
Calculating MCERs are important. If the marginal benefit (outcome change) is decreasing over time relative to cost (as in the example below), it suggests that the programme is seeing diminishing returns. This is an important insight but does not in itself explain why this is happening, or what the best investment decision would be. Does it mean that the programme needs to change its approach to achieve further, more pronounced gains (eg by changing the messaging or the target groups it focuses on), or have all cost-effective gains been made and should the programme be scaled back to a ‘maintenance’ level (ie can investment in the programme be lowered while maintaining the results over time)?
Commercial In Confidence
NZ Fire Service Commission, Developing line of sight report 27
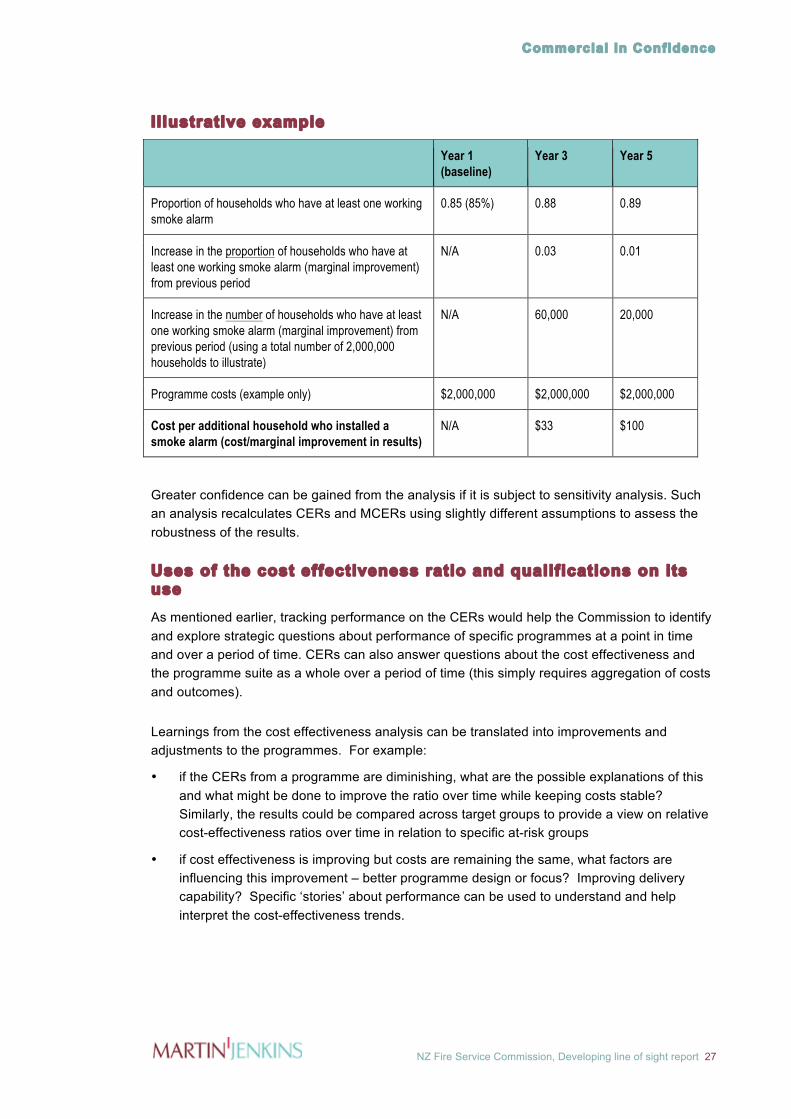
Illustrative example
Year 1 (baseline)
Year 3 Year 5
Proportion of households who have at least one working smoke alarm
0.85 (85%) 0.88 0.89
Increase in the proportion of households who have at least one working smoke alarm (marginal improvement) from previous period
N/A 0.03 0.01
Increase in the number of households who have at least one working smoke alarm (marginal improvement) from previous period (using a total number of 2,000,000 households to illustrate)
N/A 60,000 20,000
Programme costs (example only) $2,000,000 $2,000,000 $2,000,000
Cost per additional household who installed a smoke alarm (cost/marginal improvement in results)
N/A $33 $100
Greater confidence can be gained from the analysis if it is subject to sensitivity analysis. Such an analysis recalculates CERs and MCERs using slightly different assumptions to assess the robustness of the results.
Uses of the cost effectiveness ratio and qualifications on its use As mentioned earlier, tracking performance on the CERs would help the Commission to identify and explore strategic questions about performance of specific programmes at a point in time and over a period of time. CERs can also answer questions about the cost effectiveness and the programme suite as a whole over a period of time (this simply requires aggregation of costs and outcomes).
Learnings from the cost effectiveness analysis can be translated into improvements and adjustments to the programmes. For example:
• if the CERs from a programme are diminishing, what are the possible explanations of this and what might be done to improve the ratio over time while keeping costs stable? Similarly, the results could be compared across target groups to provide a view on relative cost-effectiveness ratios over time in relation to specific at-risk groups
• if cost effectiveness is improving but costs are remaining the same, what factors are influencing this improvement – better programme design or focus? Improving delivery capability? Specific ‘stories’ about performance can be used to understand and help interpret the cost-effectiveness trends.
Commercial In Confidence
NZ Fire Service Commission, Developing line of sight report 28
Caveats and qualifications to consider in using CERs include:
• despite the attribution-alleviating effects of the inter-temporal approach (multiple time periods) involved in cost effectiveness analysis, there may be other factors beyond the programme’s influence that need to be considered when interpreting effectiveness
• a key thing to observe is the trend over time, rather than the ‘number’
• cost effectiveness is not programme effectiveness. The cost effectiveness of an effective programme might be low if the programme costs a lot. Whether any cost–effectiveness ratio is considered high or low depends on the overall budget. If the budget is large, less cost effective interventions may still be desirable if the programme in itself is effective.

Commercial In Confidence
NZ Fire Service Commission, Developing line of sight report 29
7. Measuring prevention Malcolm K. Sparrow in his book The Character of Harms discusses the challenges faced by regulatory agencies in monitoring preventive success, ie getting credit for the fires that did not occur. Demonstrating the value of an agency’s preventive options is hard, as prevention is not measurable and prevention interventions do not produce countable results.
As a result most agencies tend to confuse reductions with preventions and this too is problematic for two reasons: aggregate levels can rise even in the presence of preventive interventions and significant reductions may only be available in the short term. For many types of harm, including fire, the curve flattens out over time – but keeping it suppressed requires long term resource commitment. Some options that are suggested by Sparrow include:
• an approach that focuses on changes in risk levels rather than risk levels themselves. By focusing on identified concentrations or sub-components of the risk and reducing them one by one, the Commission can take higher level goals and represent their success as a series of specific accomplishments, each directed at specific subcomponents of the higher level goals. This involves identifying key problem areas that result from systematic disaggregation of statistical data and the creation of remedies or solutions specially designed to address these problems. We are aware that the Commission undertakes such analysis and the intention here is to support the Commission’s efforts in this regard.
• spotting emerging problems early and suppressing them before they do much damage. Through timely analytic monitoring across a mass of data, the Commission can see emerging patterns more quickly (along the lines of epidemiological monitoring for outbreaks of diseases) without waiting for harms to grow to the levels at which they stand out as failures. We are aware that the Commission currently employs a ‘hot spotting’ approach where spatial mapping is used to identify emerging risks. We believe there is merit in investing in this function as it allows the Commission to be vigilant about emerging risks, enables a speedy response (not waiting till it becomes a problem) and develop strategies to ensure that response is effective. Such monitoring will allow the Commission to detect emerging patterns and risks early and provides it with the opportunity to consider and develop sound strategies.
• Gathering project level stories in a consistent, structured way to enable them to provide insights about outcomes.
Regulatory agencies should not feel obligated to prove causality. They should be content to demonstrate publicly their ability to focus on specific risks, to design and implement creative solutions, and to determine when the risk has abated sufficiently to permit them to move onto other priorities. A substantial collection of problem-solving success stories, accumulated over time, none of them claiming causality, constitutes a compelling public account of intelligent resource allocation and agency effectiveness. (Sparrow)
Stories should cover five parts:
– the data and analysis that drove the focus and attention on the particular problem (eg programmes for the elderly)
– indicators identified by the Commission to determine if outcomes were being achieved
– description of the intervention being implemented

Commercial In Confidence
NZ Fire Service Commission, Developing line of sight report 30
– the impact measured in terms of changed in the indicators which either show the problem was being brought under control or not
– an account of any long-term monitoring put in place to prevent the problem from re-emerging.

Commercial In Confidence
NZ Fire Service Commission, Developing line of sight report 31
8. Supporting decision-making Overview The framework’s main purpose is to inform review and refinement of the fire safety education programmes, by providing information on the programmes’ performance over time. Essentially the framework provides a basis for measuring and interpreting change in outcomes that matter most. Alongside other research and evaluation tools, and intelligence gathering, observed changes can be better understood.
Using the framework to monitor performance provides insight into critical programme strategy and planning questions, including:
• What has been happening over time?
• Why did [an observed pattern of results] happen?
• What changes might need to be made to improve or sustain performance over time?
• What strategic choices or options do we have?
At the heart of understanding programme performance is the relationship between results over time across different outcomes and levels of outcomes in the framework.
The framework does not look at outcomes in isolation; rather it also looks at outcomes in relation to the expenditures. This permits a strong line of sight between expenditures on fire safety education programmes and the outcomes they produce. The analysis of outcomes alongside expenditures enables policy makers to make better decisions about programme investments.
We believe that the framework helps to frame questions and decisions about investment in the targeting and mix of interventions. This is best illustrated by way of example.
Examples
• If performance monitoring reveals that positive fire safety behaviours have plateaued at a high level amongst target audience A, in spite of continued investment by the Commission, then there may be a case for reducing the level of investment in programmes that continue to seek further improvements in behaviour specifically amongst that audience.
• If performance monitoring reveals that fire safety practice has plateaued at a modest level amongst target audience B, in spite of increasing investment in interventions to target this audience, then it raises some important questions to be examined further: are the interventions designed and implemented in the best way to maximise impact on audience B? What other factors may be at play that might be counteracting the Commission’s interventions? Does the Commission have any leverage over these other factors? Is a greater level of investment required? Is a greater level of investment worth the additional cost of interventions in terms of effect on overall fire safety outcomes? Is the investment better made elsewhere?

Commercial In Confidence
NZ Fire Service Commission, Developing line of sight report 32
• If performance monitoring reveals significant ongoing improvements in fire safety practice amongst particular audiences (potentially implying that an approach is working well), would additional investment or expansion of the approach lead to better results faster?
These examples will involve a range of strategic judgements that balance issues of cost, ability to influence, and equity across effort applied to at-risk groups in the community. The judgements are likely to need further information, including from targeted research and evaluation. The key point is that the performance monitoring across the programmes provides vital intelligence that enables decision makers to ask and answer the right questions about performance.
Using the framework at National and Regional levels The Commission has five regional offices and programme delivery is not necessarily identical across regions. To the extent that different regions are pursuing different approaches or targeting different outcomes for different groups, then they will be more concerned with particular results that relate to their areas of focus. This means that Regions and even Areas should be able to use the framework to tell their performance story, based on the ‘numbers’ and enriched by specific narratives about what does and doesn’t appear to be working well in achieving the outcomes.
Strategic questions Using the framework to provide focused performance information should reveal a range of useful insights to guide decisions about investment in fire safety programmes. Set out below are some key questions that can be used as the basis for analysis to better inform decision makers:
1 Targeting:
• are we targeting the right people – to what extent are particular demographic groups lagging behind the general population in the high level and programme-level outcomes?
• are we targeting the right problems – the main causes of household fires, and the behaviours, knowledge and attitudes that are strongly linked to these causes?
What does incident and fire investigation data tell us about the main causes of household fires over time (and the main demographic groups that suffer fires), and to what extent do our public education activities reflect this? What does our monitoring of knowledge, attitudes and behaviours tell us about where our efforts may need to be applied?
2 Impact: do our interventions seem to be having an impact on these groups – are we seeing the rate of improvement in knowledge, attitudes and fire safety behaviours that we expected to see in these groups, based on the interventions we have put in place?
3 Understanding what is shaping change: if we are not seeing the rate of improvement we expected, could this be due to:
• the content of our messages?
• the way the messages are delivered?
• other barriers to change?
• our level of investment?

Commercial In Confidence
NZ Fire Service Commission, Developing line of sight report 33
4 Where is the problem? Is there an observable flow-through of results from knowledge improvements to attitude changes, and from both of these outcomes on to behaviour changes?
• if there is a disconnect, where in the causal chain of outcomes does it seem to be breaking down? (eg increased knowledge may be observed but might not be translating into improved attitudes or into action)
• how can we develop a better understanding of why the causal chain seems to be breaking down at a particular point, using other evaluative tools?
5 Invest or disinvest? where we are observing an ongoing rate of improvement in knowledge, attitudes, or uptake of good fire safety practice amongst target groups, what is the shape of the improvement curve over time, and what does this mean for the level of investment? If we overlay cost effectiveness performance trends onto the results, what does this tell us?
• if we invested more by scaling up the programme or extending its reach, are we likely to accelerate a high rate of return?
• if the results are plateauing, what would be the impact of scaling back our investment to a maintenance level, and what would be a maintenance level that would preserve the gains achieved so far?
Presenting the information – the analytical product
General principles Monitoring frameworks sometimes don’t realise their full potential to add value because the link between the data and the insights generated from that data is missing. Data needs to be interpreted and presented in a way that supports good strategic conversations about the way forward. This includes consideration of:
• performance over time in relation to multiple, related outcomes. Looking at performance across multiple outcomes and over time provides deeper insight into what might be shaping the observed results
• interpretation of result trends in the context of the decisions that need to be made. Where performance frameworks deliver less value than they could, it is often because the key questions and observations have not been interpreted from the data. This translation of information into meaningful strategic performance questions is not difficult, but requires deliberate attention to the analytical ‘product’ that is used by the data gatherers to present information to the decision-makers. This level of interpretation goes beyond describing the key shifts over time, by raising specific questions about investment or type of approach that need to be considered.
We have seen (and sometimes advocated) the use of dashboard or scorecard approaches in different settings. The key benefit is that they can be used to simply and graphically represent important performance over time information on a couple of pages, in a way that enables conclusions about performance to be clearly presented. We suggest that the Commission consider using this kind of approach in relation to its public education activities.

Commercial In Confidence
NZ Fire Service Commission, Developing line of sight report 34
Indicative analytical report content We suggest that an analytical report to support decision-making would be prepared annually, timed around availability of results from the annual Fire Knowledge Survey, which is the source of most of the data in the performance framework described in this report. The purpose of this analysis would not be to present the survey findings. This would be contained in its own report, as it is currently. Instead, it would present:
1 An A3 page dashboard-style analysis that directly shows performance over time in relation to each of the outcome levels in the framework. We suggest that this would focus on the following information.
Contextual information to guide future focus
– causes of household fires: summary of what incident and fire investigation data is telling us about the main causes of household fires, over time. This is designed to ensure that the intervention focus matches the key problem areas as these change over time.
Goals/targets and focus of interventions
– the specific goals and focus of the education programmes for the previous year/s: this would briefly summarise what knowledge/attitudes and behaviours, amongst which target groups, were the focus of the Commission’s education programme in the preceding year/s.
Programme investment
– table showing level of investment in public education and in specific programmes and campaigns over time.
Performance on programme-level outcomes – aggregate level results
– actions to prevent fires and reduce harm: at least one smoke alarm; selected activities done in household (4-5 activities that are known to be particularly significant as causes of household fires, and can be relatively easily mitigated)
– attitudes and motivation: conversion model (aggregate results for past 5 years); attitudes to fire safety (agreement with fire safety statements by year)
– knowledge and awareness: perceived level of fire risk relating to specific activities; first and all actions taken in a serious fire; awareness of time in which fire becomes unsurvivable
– access to information, resources and education: number of schools participating in fire safety programme delivery in each region; amount of fire safety information distributed through partners annually.
Performance on specifically targeted programme-level outcomes – disaggregated results
Summary of performance over time in relation to specific regions or target groups, in relation to knowledge/attitudes/behaviours that were being targeted.

Commercial In Confidence
NZ Fire Service Commission, Developing line of sight report 35
Summary of key points
Summary of the main performance observations and the extent to which these were better/worse than expected.
2 A summary of other intelligence about programme implementation and performance, gathered through periodic conversations at regional level, led by the Business Analysts.
3 A set of strategic questions and conclusions relating to programme performance, based on interpreting the performance information. This would set out the possible implications of observed performance over time for future investment choices, and explain what further information and understanding might need to be built and how (eg through specific research and evaluation) to inform decisions about investment
4 Appended information showing key breakdowns of performance information (at different outcome levels), by region and by target audience.
We would expect this analytical report to be around 5-6 pages long excluding appendices.

Commercial In Confidence
NZ Fire Service Commission, Developing line of sight report 36
Appendix 1: Current education programmes

Commercial In Confidence
NZ Fire Service Commission, Developing line of sight report 37
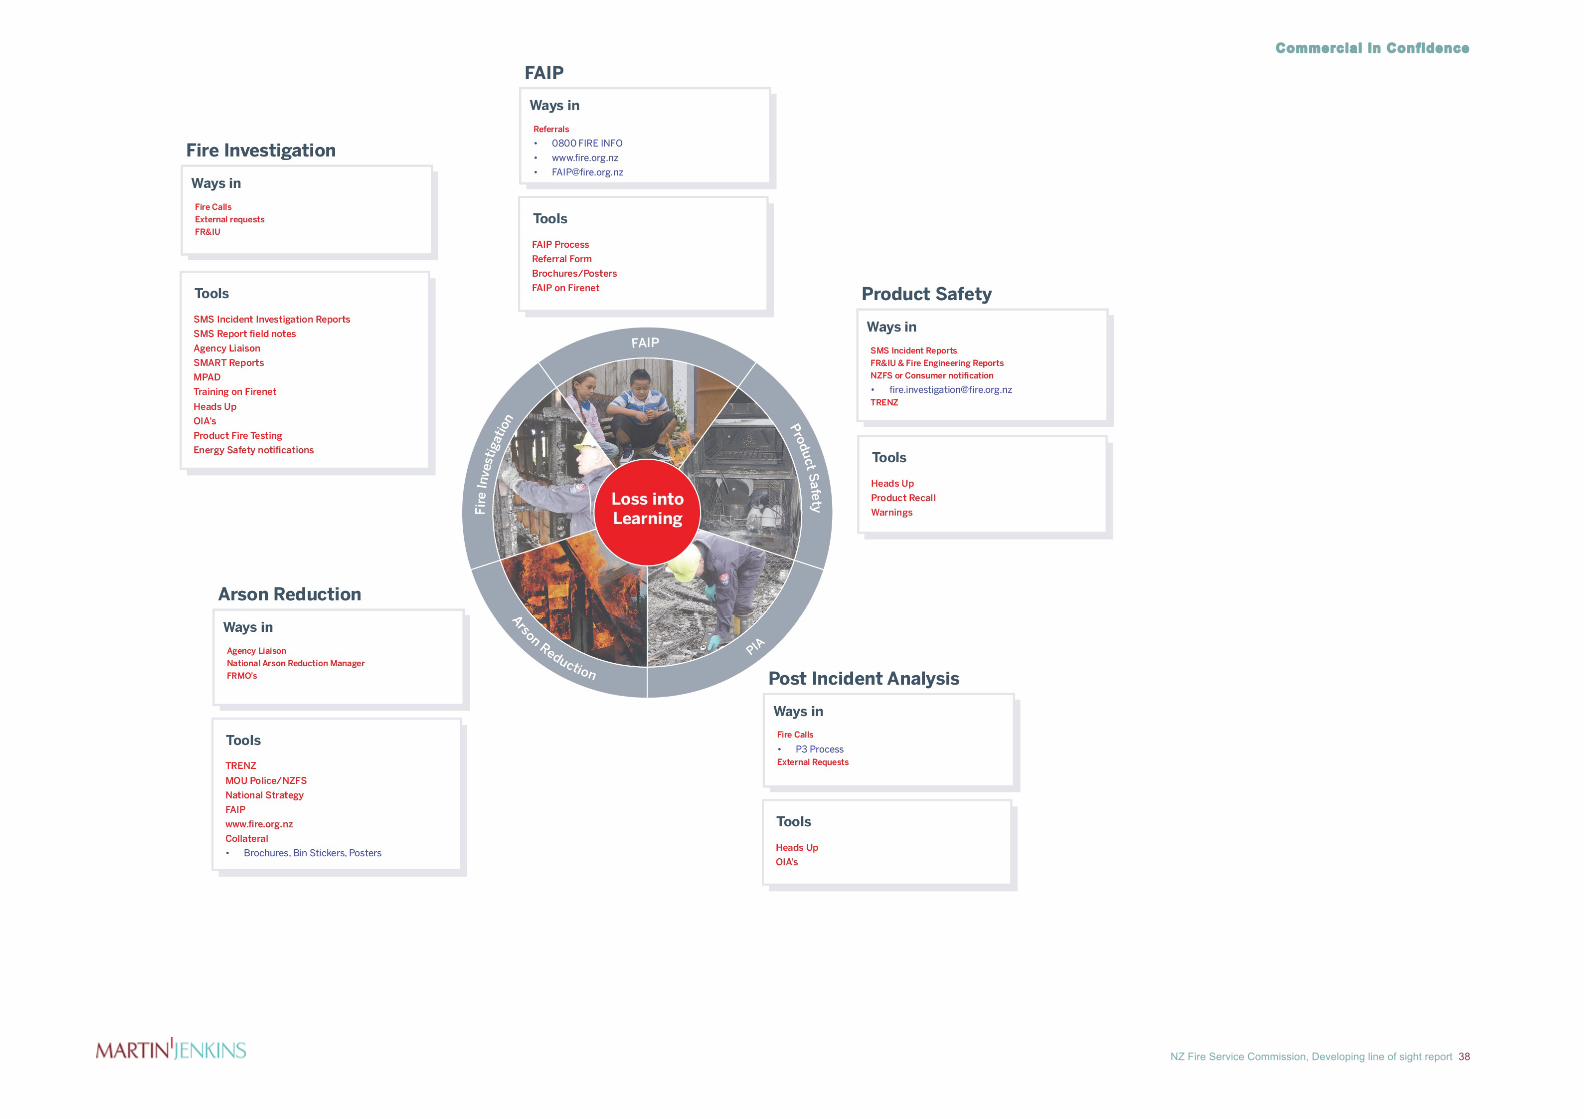
Commercial In Confidence
NZ Fire Service Commission, Developing line of sight report 38
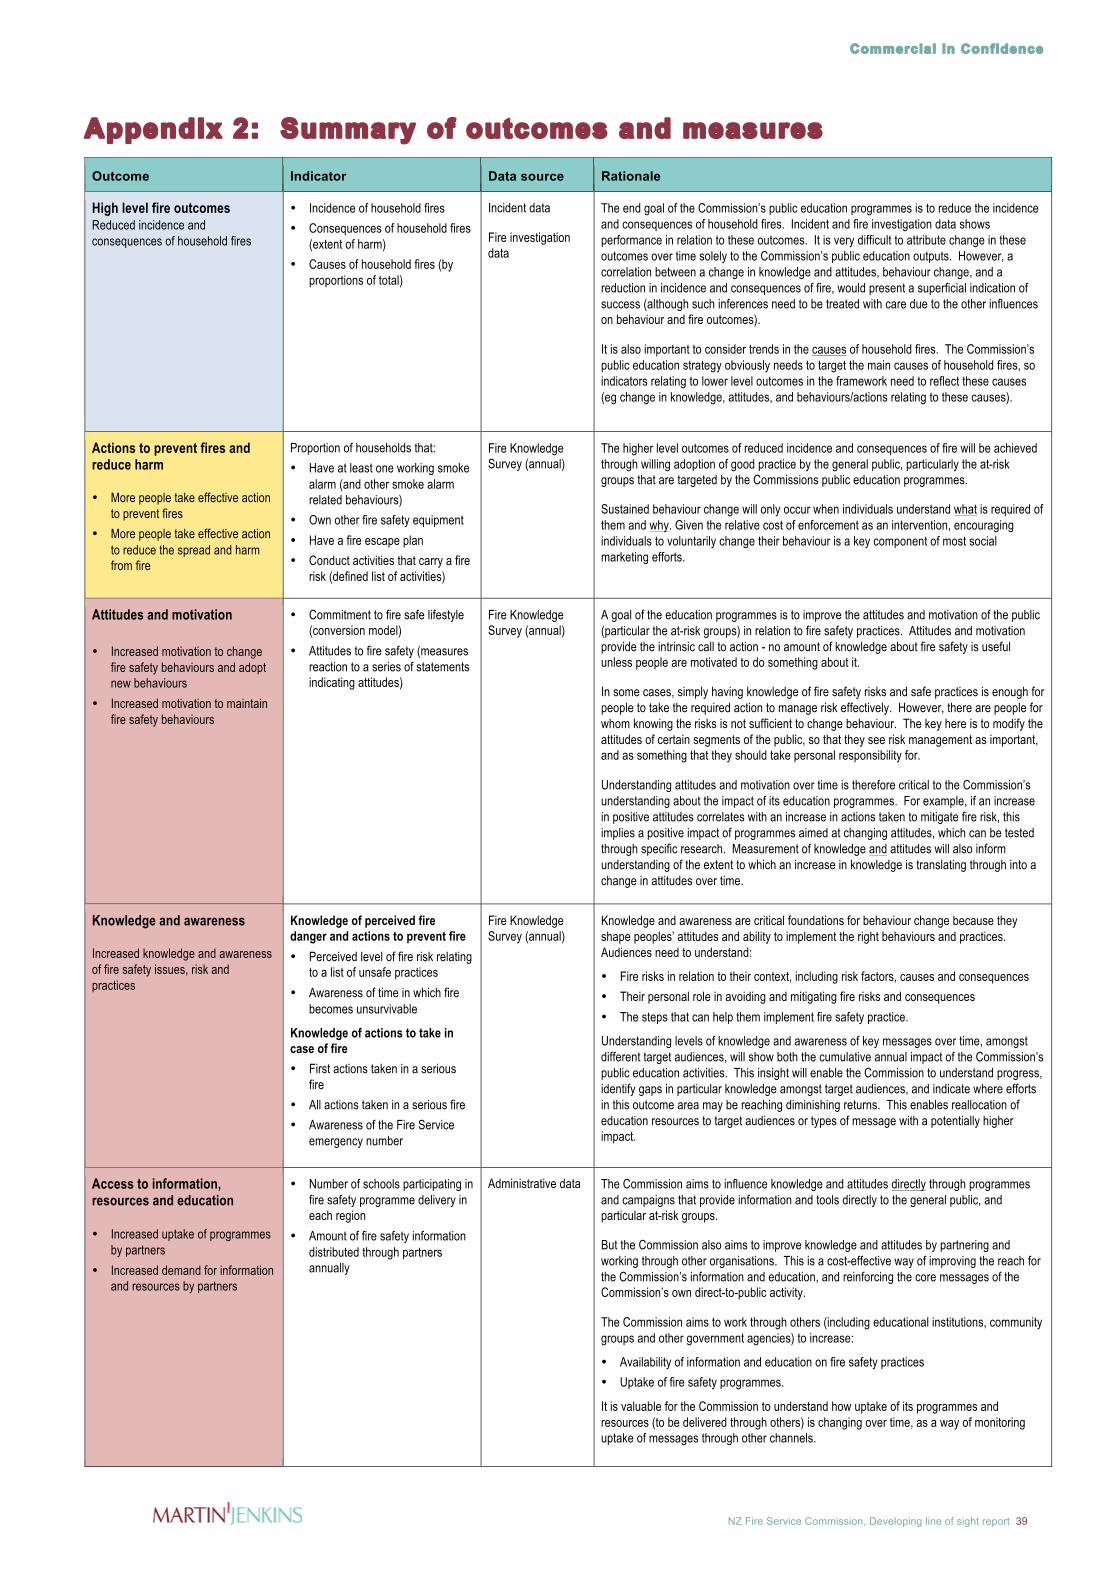
Commercial In Confidence
NZ Fire Service Commission, Developing line of sight report 39
Appendix 2: Summary of outcomes and measures Outcome Indicator Data source Rationale
High level fire outcomes Reduced incidence and consequences of household fires
• Incidence of household fires • Consequences of household fires
(extent of harm) • Causes of household fires (by
proportions of total)
Incident data
Fire investigation data
The end goal of the Commission’s public education programmes is to reduce the incidence and consequences of household fires. Incident and fire investigation data shows performance in relation to these outcomes. It is very difficult to attribute change in these outcomes over time solely to the Commission’s public education outputs. However, a correlation between a change in knowledge and attitudes, behaviour change, and a reduction in incidence and consequences of fire, would present a superficial indication of success (although such inferences need to be treated with care due to the other influences on behaviour and fire outcomes).
It is also important to consider trends in the causes of household fires. The Commission’s public education strategy obviously needs to target the main causes of household fires, so indicators relating to lower level outcomes in the framework need to reflect these causes (eg change in knowledge, attitudes, and behaviours/actions relating to these causes).
Actions to prevent fires and reduce harm • More people take effective action
to prevent fires • More people take effective action
to reduce the spread and harm from fire
Proportion of households that: • Have at least one working smoke
alarm (and other smoke alarm related behaviours)
• Own other fire safety equipment • Have a fire escape plan • Conduct activities that carry a fire
risk (defined list of activities)
Fire Knowledge Survey (annual)
The higher level outcomes of reduced incidence and consequences of fire will be achieved through willing adoption of good practice by the general public, particularly the at-risk groups that are targeted by the Commissions public education programmes.
Sustained behaviour change will only occur when individuals understand what is required of them and why. Given the relative cost of enforcement as an intervention, encouraging individuals to voluntarily change their behaviour is a key component of most social marketing efforts.
Attitudes and motivation • Increased motivation to change
fire safety behaviours and adopt new behaviours
• Increased motivation to maintain fire safety behaviours
• Commitment to fire safe lifestyle (conversion model)
• Attitudes to fire safety (measures reaction to a series of statements indicating attitudes)
Fire Knowledge Survey (annual)
A goal of the education programmes is to improve the attitudes and motivation of the public (particular the at-risk groups) in relation to fire safety practices. Attitudes and motivation provide the intrinsic call to action - no amount of knowledge about fire safety is useful unless people are motivated to do something about it.
In some cases, simply having knowledge of fire safety risks and safe practices is enough for people to take the required action to manage risk effectively. However, there are people for whom knowing the risks is not sufficient to change behaviour. The key here is to modify the attitudes of certain segments of the public, so that they see risk management as important, and as something that they should take personal responsibility for.
Understanding attitudes and motivation over time is therefore critical to the Commission’s understanding about the impact of its education programmes. For example, if an increase in positive attitudes correlates with an increase in actions taken to mitigate fire risk, this implies a positive impact of programmes aimed at changing attitudes, which can be tested through specific research. Measurement of knowledge and attitudes will also inform understanding of the extent to which an increase in knowledge is translating through into a change in attitudes over time.
Knowledge and awareness Increased knowledge and awareness of fire safety issues, risk and practices
Knowledge of perceived fire danger and actions to prevent fire • Perceived level of fire risk relating
to a list of unsafe practices • Awareness of time in which fire
becomes unsurvivable
Knowledge of actions to take in case of fire • First actions taken in a serious
fire • All actions taken in a serious fire • Awareness of the Fire Service
emergency number
Fire Knowledge Survey (annual)
Knowledge and awareness are critical foundations for behaviour change because they shape peoples’ attitudes and ability to implement the right behaviours and practices. Audiences need to understand:
• Fire risks in relation to their context, including risk factors, causes and consequences • Their personal role in avoiding and mitigating fire risks and consequences • The steps that can help them implement fire safety practice.
Understanding levels of knowledge and awareness of key messages over time, amongst different target audiences, will show both the cumulative annual impact of the Commission’s public education activities. This insight will enable the Commission to understand progress, identify gaps in particular knowledge amongst target audiences, and indicate where efforts in this outcome area may be reaching diminishing returns. This enables reallocation of education resources to target audiences or types of message with a potentially higher impact.
Access to information, resources and education • Increased uptake of programmes
by partners • Increased demand for information
and resources by partners
• Number of schools participating in fire safety programme delivery in each region
• Amount of fire safety information distributed through partners annually
Administrative data The Commission aims to influence knowledge and attitudes directly through programmes and campaigns that provide information and tools directly to the general public, and particular at-risk groups.
But the Commission also aims to improve knowledge and attitudes by partnering and working through other organisations. This is a cost-effective way of improving the reach for the Commission’s information and education, and reinforcing the core messages of the Commission’s own direct-to-public activity.
The Commission aims to work through others (including educational institutions, community groups and other government agencies) to increase:
• Availability of information and education on fire safety practices • Uptake of fire safety programmes.
It is valuable for the Commission to understand how uptake of its programmes and resources (to be delivered through others) is changing over time, as a way of monitoring uptake of messages through other channels.

Commercial In Confidence
NZ Fire Service Commission, Developing line of sight report 40
Appendix 3: Sample dashboard
Interventions
Key areas of focus for 2011/2012 Programme expenditure over time
Observations on performance Key questions
Fatalities/injuries from household fires (over time)
High level outcomes
Incidence of household fires (over time)
Main causes of household fires (over time)

Commercial In Confidence
NZ Fire Service Commission, Developing line of sight report 41
Attitudes and motivation
30%
6%
28% 33%
3% 1%
Committed Vulnerable Available Ambivalent Weakly Unavailable
Strongly Unavailable
3. Commitment to Fire Safe Lifestyle This would be modified to show change in each category over 7me (5 year period)
87%
86%
48%
43%
31%
23%
21%
7%
82%
81%
51%
48%
35%
23%
26%
9%
87%
81%
58%
47%
37%
27%
27%
8%
90%
85%
57%
44%
43%
27%
23%
6%
93%
85%
60%
43%
39%
28%
19%
5%
94%
87%
60%
44%
41%
28%
21%
6%
I consider I am very safetyconscious when it comes to the
risk of fire
I believe I am doing everythingpossible to prevent the risk of
fire in my household
If I had a fire at my property, Ithink the Fire Service wouldarrive in time to save my life
Taking risks with fire is part ofhuman nature
A serious house fire is notsomething that is likely tohappen in my household
Most causes of serioushousehold fires are beyond the
householder's control
The perceived cost of smokealarms has made me think twice
about installing one
As long as children have beentaught not to play with lighters ormatches it is okay to leave them
within their reach
2006 2007 2008 2009 2010 2011
Knowledge and awareness
13%18%
13%18% 14% 16%
37%33%
37%38% 42% 39%
40% 36% 41% 33% 34% 36%
7%8%
6% 8% 6% 7%3% 6% 3% 3% 4% 3%
2006 2007 2008 2009 2010 2011
Don't know
More than 5 minutes
3-5 minutes
1-2 minutes
Less than 1 minute
92%
88%
84%
86%
82%
82%
71%
68%
72%
68%
67%
61%
50%
54%
41%
89%
86%
84%
85%
79%
88%
69%
66%
70%
65%
68%
64%
53%
54%
47%
89%
86%
85%
82%
80%
80%
74%
72%
73%
63%
65%
61%
54%
59%
45%
89%
90%
89%
87%
80%
81%
73%
74%
73%
72%
65%
64%
56%
58%
47%
89%
88%
88%
84%
83%
78%
75%
73%
73%
68%
64%
59%
54%
52%
45%
93%
92%
92%
86%
86%
83%
76%
80%
78%
72%
65%
65%
61%
59%
50%
Use candles and leave them in the room with no one there
Children have access to matches/lighters
Leaving cooking/frying unattended
Leaving clothes close to open fire
Leaving clothing close to or on heater
Open flame heating without guard
Drink more than a moderate amount of alcohol while smoking
Drink more than a moderate amount of alcohol while cooking
Multiple plugs in the same socket
Leaving electric heater on overnight
Use candles not power for lighting
Burn rubbish and consumables
Smoke cigarettes inside the house
Store or use flammable or combustible materials inhouse/section
Cook with grease, fat or oils
2006 2007 2008 2009 2010 2011
4. Attitudes to fire safety
5. Time in which fire becomes unsurvivable
6. Perceived fire risks (linked to desired behaviour change)
Behaviour change (linked to main causes identified above)
85% 87% 88% 90% 89% 90%
2006 2007 2008 2009 2010 2011
1. At least one smoke alarm
2. Activities done in household [Table]