developing a model comprehensive statewide needs...
TRANSCRIPT

Developing a Model Comprehensive Statewide Needs Assessment With Corresponding Training Materials
For State VR Agency Staff and SRC Members:
The VR Needs Assessment Guide
Submitted to: Rehabilitation Services Administration
Janette Shell, COR
Submitted by: InfoUse
2560 9th Street, Suite 320 Berkeley, CA 94710
November 30, 2009
This document was produced under U.S. Department of Education Contract No. ED04CO0106 with InfoUse. Janette Shell served as the contracting officer’s technical representative. The views expressed herein do not necessarily represent the positions or policies of the Department of Education. No official
endorsement by the U.S. Department of Education of any product, commodity, service or enterprise mentioned in this publication is intended or should be inferred.


Table of Contents
EXECUTIVE SUMMARY ..................................................................................................1
THE VR NEEDS ASSESSMENT GUIDE .........................................................................5 INTRODUCTION .....................................................................................................................5
Exhibit .1 Rehabilitation Act Needs Assessment Requirements Section 101(a)(15) ......................................................................................................................5
How to Use the Guide .......................................................................................................7
PART I – THE MODEL CSNA ...........................................................................................9 OVERVIEW OF THE MODEL CSNA ........................................................................................9
The Information Goals of the CSNA ................................................................................9 Exhibit .2 CSNA Information Goals from the Rehabilitation Act ....................................9 Developing a Model CSNA Technique - Background ...................................................10 Defining Need .................................................................................................................12 Model CSNA Principles..................................................................................................12 Outreach ..........................................................................................................................13 Dissemination..................................................................................................................13
SIX STEPS TO ASSESSING AND ADDRESSING VR NEEDS .....................................................14 Exhibit .3 Six Steps to Assessing and Using VR Needs: An Information Strategy .......14
SEVEN INFORMATION STRATEGIES .....................................................................................19 Exhibit .4 Information Strategies in the Model CSNA ...................................................20 Exhibit .5 Strengths and Limitations of Data Sources ....................................................28 Exhibit .6 Outline of Attachment 4.11(a) .......................................................................31 Exhibit .7 Example Summary Outline of CSNA Methods, Results, Gaps, and
Implications for State Plan ...........................................................................................32
PART II – IMPLEMENTING THE MODEL CSNA .....................................................35 STEP 1: DEFINING AND ESTABLISHING CSNA GOALS ..........................................................35
1.1 Establish the team .....................................................................................................35 1.2 Review existing data .................................................................................................37 1.3 Defining a list of goals for the CSNA .......................................................................37 Exhibit 1.1 Potential community partners .......................................................................40 Exhibit 1.2 Data sources .................................................................................................43 Exhibit 1.3 Example state data from American Factfinder .............................................45 Exhibit 1.4 Example table comparing minority populations from ACS state
disability data and state VR agency data .....................................................................57 Exhibit 1.5 Example list of agencies/organizations with potential information .............58
STEP 2: DEVELOPING CSNA PLAN FOR INFORMATION AND DISSEMINATION .......................59 2.1 Developing the CSNA work plan, timeline, and resource estimate .........................59 2.2 Developing the specific plan for dissemination .......................................................60 Exhibit 2.1 Information Strategies in the Model CSNA .................................................62
i

Exhibit 2.2 Skills and Costs ............................................................................................63 Exhibit 2.3 Example Personloading ................................................................................64 Exhibit 2.4a Time Line (One-Year Cycle Example) ......................................................64 Exhibit 2.4b Time Line (Three-Year Cycle Example) ...................................................64
STEP 3: GATHERING THE INFORMATION ..............................................................................65 3.1 Obtain Secondary data .............................................................................................65 3.2 Survey VR counselors ..............................................................................................67 3.3 Survey VR consumers ...............................................................................................68 3.4 Focus groups .............................................................................................................69 3.5 Guide to implementing key informant interviews ....................................................72 3.6 Community hearings .................................................................................................73 Exhibit 3.1 Data Resources to Retrieve ..........................................................................75 Exhibit 3.2 Form for Capturing Data from Reports ........................................................80 Exhibit 3.3 Example VR Counselor questionnaire ........................................................81 Exhibit 3.4 Example VR consumer questions ................................................................84 Exhibit 3.5 Matrix of Key Interviewee Expertise and Tracking .....................................86 Exhibit 3.6 Key informant interview discussion guide ...................................................87
STEP 4. ANALYZING THE RESULTS AND DEVELOPING FINDINGS ..........................................89 4.1 Review available survey and administrative data and tables ...................................89 4.2 Analyze study survey data ........................................................................................90 4.3 Review and analyze literature including state reports ..............................................90 4.4 Analyze results from focus groups, hearings, and other stakeholder comments ......91 4.5 Combine findings from different sources to inform information goals ....................92 Exhibit 4.1 Template for available statistical table and data resources ........................102 Exhibit 4.2 Template for content analysis of reports and materials..............................103 Exhibit 4.3 Example template for summarizing needs and barriers (Step 4) ...............104
STEP 5. DEVELOP THE CONCLUSIONS: POTENTIAL ACTION STRATEGIES ............................105 5.1 Establish process for reviewing the results by information goal and across all
the questions, and develop recommended goals, priorities or strategies ...................105 Exhibit 5.1 Applying Potential Action Strategies to Expressed Needs Example ........107
STEP 6. INFORMING STATE PLAN, GOALS, PRIORITIES, AND STRATEGIES ............................109 6.1 Establish process for developing recommendations: approach, criteria .................109 6.2 Decision-making: applying criteria and developing recommendations ..................109 6.3 Publish State plan attachment 4.11(a) .....................................................................110 6.4 Disseminate Needs Assessment ..............................................................................110 Exhibit 6.1 Applying criteria to potential strategies ....................................................112 Exhibit 6.2 Checklist .....................................................................................................113
BIBLIOGRAPHY...................................................................................................................... I
ii

Table of Contents of Appendices (in a separate volume)
APPENDIX A: DISABILITY POPULATION STATISTICS ....................................................... A-1 American Community Survey (ACS) ............................................................................. A-1 Examples of available ACS state and sub-state data ...................................................... A-3 Current Population Survey (CPS) ................................................................................. A-14 Behavioral Risk Factor Surveillance Survey (BRFSS) Brief Description .................... A-15 How to Use the BRFSS ................................................................................................. A-16 Examples of BRFSS Disability Questions .................................................................... A-17
APPENDIX B: DISABILITY POPULATION ESTIMATES ........................................................B-1 Estimating Subpopulations of Disabilities .......................................................................B-6
APPENDIX C: PROJECTIONS OF STATE POPULATION AND LABOR AND ECONOMIC FORECASTS..................................................................................................... C-1
Population Projections .....................................................................................................C-1 Examples of Population Projection Data Available for All States ..................................C-1 Examples of Recent Population Projections Available for Some States .........................C-3 Employment and labor force forecasts .............................................................................C-4 Examples of Available Data ............................................................................................C-5 Other Sources of Data on Labor and Economic Projections ...........................................C-6
APPENDIX D: VR AGENCY DATA ..................................................................................... D-1 VR program data examples and required state reports ................................................... D-1 VR Counselors and staff stakeholder surveys and interviews ........................................ D-7
APPENDIX E: STATE-LEVEL DATA FROM NATIONAL PROGRAMS ....................................E-1 Individuals with Disabilities Education Act (IDEA) ....................................................... E-1 IDEA Data Examples ....................................................................................................... E-2 Section 504 Data .............................................................................................................. E-6 Section 504 Data Example ............................................................................................... E-7 Social Security Data ......................................................................................................... E-7 Social Security Data Examples ........................................................................................ E-9 Workforce Investment Act (WIA) Data ......................................................................... E-12
APPENDIX F: STATE AND SUB-STATE REPORTS AND OTHER MATERIALS ....................... F-1 State and Sub-state Reports and Other Materials............................................................. F-1
APPENDIX G: INPUT FROM STAKEHOLDERS .................................................................... G-1 Surveys ............................................................................................................................ G-1 Focus Groups .................................................................................................................. G-3 Key Informant Interviews ............................................................................................... G-5 Community hearings ....................................................................................................... G-6
APPENDIX H: MINORITIES AND UNSERVED OR UNDERSERVED GROUPS ........................ H-1 Examples of Potentially Unserved or Underserved Groups ........................................... H-2
APPENDIX I – LITERATURE REVIEW................................................................................... I-1 Conclusions ....................................................................................................................... I-4
APPENDIX J – REVIEWS OF STATE NEEDS ASSESSMENTS ................................................. J-1
iii


Model Comprehensive Statewide Needs Assessment (CSNA) Guide Executive Summary
A model Comprehensive Statewide Needs Assessment (CSNA) will assist state vocational rehabilitation (VR) agencies and state rehabilitation councils (SRCs) in jointly conducting needs assessments. The CSNA is designed to satisfy requirements in the Rehabilitation Act of 1973, as amended, and produce useful and timely information. The requirements, at a minimum, must be addressed in attachment 4.11(a) of the Title I State Plan and its Title VI, Part B supplement.
Rehabilitation Act Needs Assessment Requirements Section 101(a)(15)
(15) Annual state goals and reports of progress (A) Assessments and estimates The State plan shall-- (i) include the results of a comprehensive, statewide assessment, jointly conducted by the designated State unit and the State Rehabilitation Council (if the State has such a Council) every 3 years, describing the rehabilitation needs of individuals with disabilities residing within the State, particularly the vocational rehabilitation services needs of-- (I) individuals with the most significant disabilities, including their need for supported employment services; (II) individuals with disabilities who are minorities and individuals with disabilities who have been unserved or underserved by the vocational rehabilitation program carried out under this title; and (III) individuals with disabilities served through other components of the statewide workforce investment system (other than the vocational rehabilitation program), as identified by such individuals and personnel assisting such individuals through the components; (ii) include an assessment of the need to establish, develop, or improve community rehabilitation programs within the State; and (iii) provide that the State shall submit to the Commissioner a report containing information regarding updates to the assessments, for any year in which the State updates the assessments.
Cost-effective, easy to implement, and adaptable to state variation, the model CSNA includes a common structure and basic design, while allowing for flexibility and adaptation to local needs.
1

The CSNA is an opportunity for combining existing information and new information to inform the State Plan. The model CSNA addresses the following information goals. Additional agency-specific information goals may be added.
• What are the rehabilitation needs of individuals with disabilities, particularly the vocational rehabilitation services needs of:
• individuals with most significant disabilities, including their need for supported employment services?
• minorities?
• individuals with disabilities who have been unserved or underserved by VR?
• individuals with disabilities served through other components of the statewide workforce investment system?
• What is the need to establish, develop, or improve community rehabilitation programs within the state?
The model CSNA process includes six steps:
1. Defining and establishing CSNA goals
2. Developing CSNA plan for information and dissemination
3. Gathering the information
4. Analyzing the results and developing findings
5. Developing the conclusions: Potential action strategies
6. Informing state plan goals, priorities, and strategies
Because no one information source will provide comprehensive information, seven information strategies are part of the design:
• use of existing disability population statistics including the American Community Survey (ACS);
• disability population estimates from available data;
• population projections and economic forecasts from federal and state data;
• existing VR agency data, studies and experience;
• state level statistics from other federal programs;
• state and local data and reports; and
• stakeholder input: Surveys, focus groups, interviews, and hearings
2

Development of the CSNA followed the following principles.
• Develop a VR/SRC/Community partnership to carry out the CSNA.
• Build on the experience of previous State Plans and CSNAs.
• Involve the community.
• Use data to focus the study goals.
• Design a feasible and reasonable project.
• Use a multi-disciplinary needs assessment team.
• Rely on more than numeric data for the CSNA.
• Think about dissemination early.
• Take advantage of existing knowledge in the agency.
• Use a wide range of methods and participants.
• View the CSNA is a balance of art and science.
• Combine quantitative and qualitative results.
• Use past successes and mistakes in developing options for state plan strategies.
• Develop a menu of alternatives.
• Build state plan goals and strategies on results of CSNA steps documented in state plan attachment 4.11(a).
• Note some recommended actions can happen now, some may need more study.
The Guide for implementing the CSNA process provides examples and templates for carrying out the six steps of the model CSNA. Part I of the Guide describes the model CSNA. Part II covers implementing the model CSNA including a description of each step of the model CSNA. The required state plan Attachment 4.11(a) is a summary of the results obtained through the CSNA.
3

Attachment 4.11(a) Required Information in Attachment 4.11(a) to the Title I state plan and its title VI B supplement includes:
I. the results of the CSNA describing the rehabilitation needs of individuals with disabilities residing within the state, particularly the vocational rehabilitation services needs of:
a. individuals with the most significant disabilities, including their need for supported employment;
b. individuals with disabilities who are minorities;
c. individuals with disabilities who have been unserved and underserved by the VR program; and
d. individuals with disabilities served through other components of the statewide workforce investment system (other than the VR program), as identified by such individuals and personnel assisting such individuals through the components.
II. an assessment of the need to:
a. establish community rehabilitation programs (CRPs);
b. develop CRPs; or
c. improve CRPs within the state.
The Guide includes Appendices with further detail on the information strategies and methods proposed, including specific data elements, data sources, and example tables.
4
Guide to Assessing VR Needs
The VR Needs Assessment Guide
Introduction
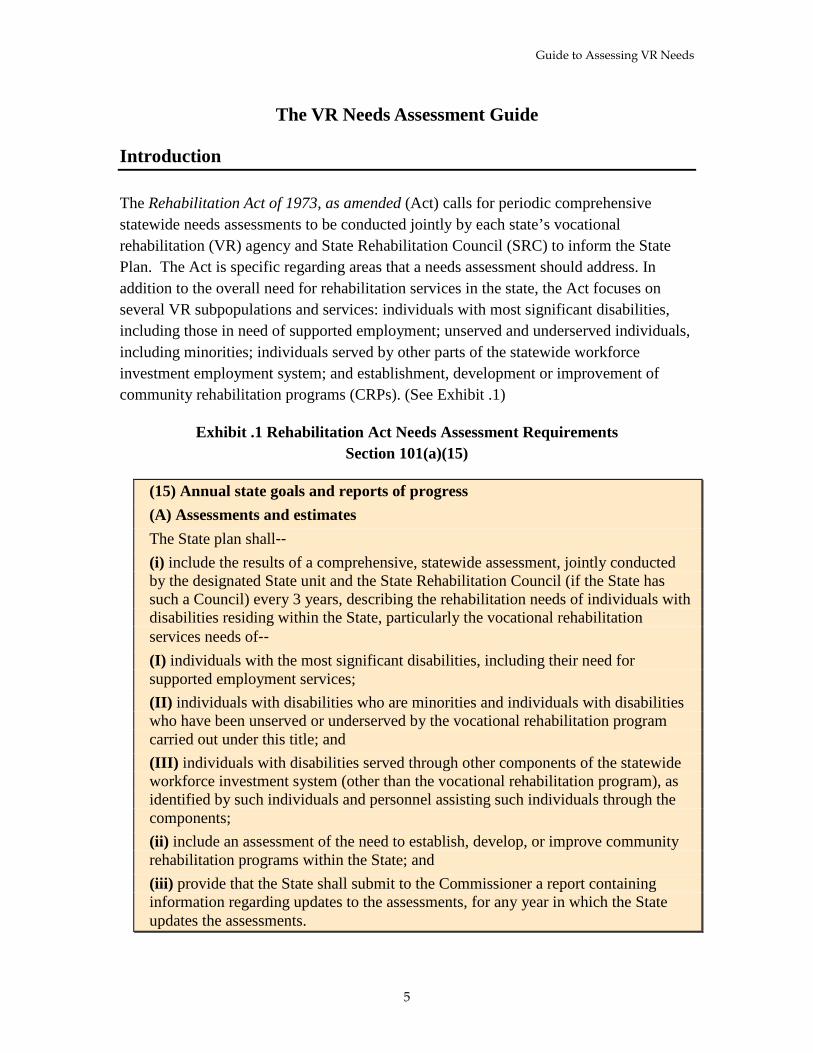
The Rehabilitation Act of 1973, as amended (Act) calls for periodic comprehensive statewide needs assessments to be conducted jointly by each state’s vocational rehabilitation (VR) agency and State Rehabilitation Council (SRC) to inform the State Plan. The Act is specific regarding areas that a needs assessment should address. In addition to the overall need for rehabilitation services in the state, the Act focuses on several VR subpopulations and services: individuals with most significant disabilities, including those in need of supported employment; unserved and underserved individuals, including minorities; individuals served by other parts of the statewide workforce investment employment system; and establishment, development or improvement of community rehabilitation programs (CRPs). (See Exhibit .1)
Exhibit .1 Rehabilitation Act Needs Assessment Requirements Section 101(a)(15)
(15) Annual state goals and reports of progress (A) Assessments and estimates The State plan shall-- (i) include the results of a comprehensive, statewide assessment, jointly conducted by the designated State unit and the State Rehabilitation Council (if the State has such a Council) every 3 years, describing the rehabilitation needs of individuals with disabilities residing within the State, particularly the vocational rehabilitation services needs of-- (I) individuals with the most significant disabilities, including their need for supported employment services; (II) individuals with disabilities who are minorities and individuals with disabilities who have been unserved or underserved by the vocational rehabilitation program carried out under this title; and (III) individuals with disabilities served through other components of the statewide workforce investment system (other than the vocational rehabilitation program), as identified by such individuals and personnel assisting such individuals through the components; (ii) include an assessment of the need to establish, develop, or improve community rehabilitation programs within the State; and (iii) provide that the State shall submit to the Commissioner a report containing information regarding updates to the assessments, for any year in which the State updates the assessments.
5

Introduction
While these requirements are specific, there is no model or guidance available to assist state agencies. A Model VR Comprehensive Statewide Needs Assessment (CSNA) that addresses these questions faces a number of technical challenges. For instance, there is no source that can identify all the individuals who do not currently use services but may need them. There are many technical resources and studies that may be useful but which require specialized knowledge and research. The Rehabilitation Services Administration (RSA) recognizes the difficulties that state agencies experience in producing useful needs assessments, noting that existing VR needs assessments have not yielded sufficient data to formulate goals and priorities in the state plans, that many do not address all the required elements, and that even those that do address requirements “still fail to yield sufficient information on the rehabilitation needs of their populations to be maximally useful” (Rehabilitation Services Administration, 2007e). RSA has identified the need for technical assistance in planning and conducting the assessments and in applying the results to the development of State Plans, including need for a model CSNA.
The model CSNA described in these pages is provided to assist state agencies in conducting the assessments, with an approach that satisfies the Act’s requirements and produces useful and timely information. Designed to be standardized, cost-effective, easy to implement, and adaptable to state variation in population and circumstance, the model CSNA includes a common structure and basic information elements, while allowing for flexibility and adaptation to local needs. The model CSNA also includes suggestions for outreach and dissemination throughout the assessment process.
The model CSNA is intended to inform the seven requirements specified in the Act for the CSNA and its relationship to the development of the State Plan. The State Plan is to include the results of the CSNA (1) as well as: 2) annual estimates of the number of individuals eligible for services in the state, the number of individuals who will receive services, and the cost of the services; 3) goals and priorities based on the CSNA, performance on Section 106 standards and indicators, and other information on operation and effectiveness of the program including SRC reports and monitoring findings; and 4) service and outcome goals and time within which these goals may be achieved for individuals in each priority category within the order for those states using an order of selection (OOS). The CSNA provides information for the development of the State Plan, recommending goals for the upcoming planning period.
The model CSNA and this Guide do not contain new requirements for the CSNA.
This document builds on the review of needs assessment literature and of current VR needs assessment reports and describes the implications of the findings for a model CSNA. An overview of the model CSNA follows, including the relationship of the Act requirements to information resources, how need is defined, how outreach and
6

Guide to Assessing VR Needs
dissemination are important to a needs assessment, and an introduction to the six steps of the model CSNA. A description of the information sources, including their strengths and limitations, concludes the introduction to this Guide. Detailed descriptions of each step follow complete with products to be created, detail on how to achieve each product with the steps, examples, and other exhibits that provide more guidance. A bibliography concludes the document.
Technical appendices include detailed information on the information strategies and methods proposed, including specific data elements, data sources, and example tables. Appendix I is the Literature Review on needs assessment and how it informs the CSNA. Appendix J is the report on review of nine needs assessments conducted by VR state agencies.
How to Use the Guide
The model CSNA provides a framework for conducting a statewide study that addresses the information requirements in the Act in a comprehensive and inclusive way. This model CSNA is a “shell” of an agency-specific design and information strategy, allowing for flexibility in how each agency carries out the CSNA.
The Guide provides more information on the implementation of the model CSNA steps that will result in attachment 4.11(a) of the state plan and recommendations to the goals, priorities, and strategies of the state plan. It also contains resources and references that support development of informed needs assessments and state plan recommendations. The Guide includes how to expand and tailor the CSNA to state-specific needs, instructions for carrying out the six steps in the model CSNA process, and related example resources such as templates, checklists, and example questionnaires.
The Guide is not intended as a substitute for texts on needs assessment methodology or applied social science, and assumes involvement of individuals with a range of skills in carrying out the study.
To use the Guide, first review Part I - the model CSNA for an understanding of the process and intended results. Then follow the implementation instructions in Part II of the Guide, including:
• the activities and products;
• descriptions of approach;
• relevant examples; and
• resources.
7

Introduction
The step number being discussed is located in the upper right corner of the page for easy reference.
An outline of the required State Plan Attachment 4.11 (a), is shown in Exhibit .6. In addition, an example of a summary of CSNA methods, results gaps, and implications for the state plan is offered in Exhibit .7. The summary may be especially useful as a deliverable for state agencies issuing a contract for conducting the CSNA.
This Guide has been approved by RSA and the project Panel of Experts (POE). The Guide describes the most basic approach to the CSNA. State agencies should tailor the CSNA to the needs of the state agency.
A PowerPoint training is available from RSA on how to use the Guide to:
• understand and implement the six steps;
• follow the Guide to create the State Plan Attachment 4.11 (a); and
• inform the state plan.
The report describing the development of the model CSNA supporting the Guide is also available from RSA.
8

Guide to Assessing VR Needs
Part I – The Model CSNA
In this part, the model CSNA is discussed. Included in this part are the information goals of the CSNA, how needs are defined, the use of outreach and dissemination to strengthen the CSNA, the six steps to assessing the and addressing VR Needs (including brief descriptions of the steps), the information strategies of the model CSNA (including strengths and limitations of data sources), an outline of the required Attachment 4.11(a) and an example summary of CSNA methods, results, gaps, and implications for the state plan.
Overview of the Model CSNA
The Information Goals of the CSNA
The VR program’s purpose is defined in the Act, and the CSNA addresses need, in particular, for several groups identified in the Act: minorities, unserved and underserved, and people with most significant disabilities, including their need for supported employment services. In addition to specifying the groups of individuals with disabilities that are of particular interest in the development of the State Plan, the Act has also specified two other areas of interest: the needs of the individuals with disabilities who are using other parts of the workforce investment system and the need to establish, expand or improve community rehabilitation programs (CRPs).
Exhibit .2 CSNA Information Goals from the Rehabilitation Act
1. What are the rehabilitation needs of individuals with disabilities, particularly the vocational rehabilitation services needs of individuals with most significant disabilities, including their need for supported employment services?
2. What are the vocational rehabilitation services needs of minorities?
3. What are the vocational rehabilitation services needs of individuals with disabilities who have been unserved or underserved by the vocational rehabilitation program?
4. What are the vocational rehabilitation services needs of individuals with disabilities served through other components of the statewide workforce investment system?
5. What is the need to establish, develop, or improve community rehabilitation programs within the state?
To be comprehensive, the CSNA findings should address all requirements. The assessment is not limited to federal requirements; additional VR service needs, such as an
9

Overview of Model
emerging disability group, or needs resulting from changes in the state population may be included.
Developing a Model CSNA Technique - Background
The development of this model for the VR CSNA builds on prior work in many related services that is reflected in the growing literature on needs assessment methods. Development work on the model CSNA included review of a number of useful references on needs assessment, including one work that is specific to VR. Four texts served as useful sources for development of this model CSNA. Fernando I. Soriano’s book, Conducting Needs assessments: A Multidisciplinary Approach (Soriano, 1995), covers basic issues involving what is a needs assessment, how are they constructed and their components. James Altschuld and Belle Witkin have two texts that are of key importance to this document, Planning and Conducting Needs assessment: A Practical Guide (Witkin & Altschuld, 1995) that reviews basic steps for conducting a needs assessment and From Needs Assessment to Action (Altschuld, & Witkin, 2000) that covers how the needs assessment serves as a basis for a plan of action. In Needs Assessment: A Creative and Practical Guide for Social Scientists, a volume of papers regarding needs assessment, Reviere, Berkowitz, Carter, and Ferguson (1996a) presents papers on understanding and developing needs assessment, case studies, and dissemination and future strategies. In addition, Rehabilitation Needs Assessment for Vocational Rehabilitation Agencies from The Region V Study Group provides significant detail on needs assessments as they relate specifically to VR agencies (Region V Study Group, 1991a, 1991b). These texts are excellent sources of more detailed information than will be covered in this Guide.
For the purposes of this Guide, we have used the following definitions.
• Needs Assessment: a systematic and ongoing process of providing usable and useful information about the needs of the target population – to those who can and will utilize it to make judgments about policy and programs.
• “Needs”: A gap – between the real and ideal conditions – that is both acknowledged by community values and potentially amenable to change.
(Reviere, Berkowitz, Carter, & Ferguson, 1996b)
Needs assessments should be useable and useful to program management. They should identify the gaps in existing services that can be reduced through policies and programs. Needs assessments should also combine methods for the use of existing information and the collection of new information to address defined information goals or information goals. Any one method will have strengths and weaknesses, and there is no one “best”
10

Guide to Assessing VR Needs
combination of methods. Stakeholder involvement is important to inform the needs assessment and planning process, to provide opportunity for input and buy-in, to assure the relevance of the data collection and the results, and to satisfy programmatic requirements. Needs assessment literature findings can be found in Appendix I.
Review of Current Needs Assessments
To date, state VR agencies and SRCs have addressed the needs assessment requirements in the Act through different methods and designs. A review of current practice was completed and is useful in understanding the variety of approaches to the CSNA and to learn from them. State agencies were invited to submit needs assessment materials as part of the development of this model CSNA. Several agencies shared documents; in addition, a few state agencies include the needs assessment reports on their Web sites.
The nine studies reviewed spanned a period from 2004 to 2008 and represent a range of approaches to conducting needs assessments (See Appendix J). No specified topic from the Act was addressed explicitly or systematically by all of these nine studies. Furthermore, only one of the nine studies explicitly addressed all topics and conditions required by the Act. Several others were somewhat consistent with the content requirements, addressing at least four of the identified topics. By focusing primarily on people already being served, some state agencies are missing the sources that would help to identify needs that are not being met or individuals who are unserved or underserved by the system.
Implications of the Findings for Development of the Model CSNA
The literature describes a systematic process for collecting information – based on goals and study questions – that leads to a prioritization of resources for forward planning. The CSNA is an opportunity for using existing information and new information to help focus the State Plan. State VR agencies and SRCs have taken a variety of approaches to completing the assessments, often focusing more on internal information and consumers and less on information about unmet needs or underserved and unserved populations. Information requirements regarding community rehabilitation programs or about other parts of the workforce investment system often are not included in the studies.
The model CSNA in the following pages is intended to provide the basis for more consistent and responsive assessments. By following principles established in the needs assessment field – making best use of a range of information sources, involving key stakeholders, targeting findings to actions in the State Plan – VR agencies and SRCs can improve the studies.
11

Overview of Model
Defining Need
The term “need” has generally been defined, for purposes of needs assessment, as “a gap – between the real and ideal conditions – that is both acknowledged by community values and potentially amenable to change.” (Reviere, Berkowitz, Carter, and Ferguson, 1996b.) While this general term provides an overview of the spirit of needs assessment in general, the model CSNA defines “need” in specific ways in addressing the requirements as defined for these studies.
The model CSNA assumes the following.
• The “demand” for VR services comes from those individuals with disabilities who are unemployed or underemployed and may be eligible for, and interested in, VR services at any time. This group cannot be identified in existing population statistics, but a useful proxy may be individuals in this age group who are not employed but in the labor force – meaning those looking for work and available to work (this excludes individuals who are employed and those who are not in the labor force, that is, not available for work.).
• Existing population statistics can be used to help identify individuals in need of VR services in the state. Differences between the composition of the VR population (gender, ethnicity, disability) and the state population may identify access issues relating to unserved or underserved populations.
• Because of recognized limits in the available data, “need” for VR services will not be measured with precision; however, the combined methods may be used to identify areas for consideration in terms of goals and strategies, and will indicate the nature and extent of need.
• Comparing estimated need for VR services with existing internal and external service capacity will identify gaps and barriers that can be addressed in the State Plan.
The “real” conditions are the VR services the agency currently provides and the “ideal” conditions are estimated current demand for VR services given the population size and type.
Model CSNA Principles
• Develop a VR/SRC/Community partnership to carry out the CSNA.
• Build on the experience of previous State Plans and CSNAs.
• Involve the community.
• Use data to focus the study goals.
• Design a feasible and reasonable project.
12

Guide to Assessing VR Needs
• Use a multi-disciplinary needs assessment team.
• Rely on more than numeric data for the CSNA.
• Think about dissemination early.
• Take advantage of existing knowledge in the agency.
• Use a wide range of methods and participants.
• View the CSNA is a balance of art and science.
• Combine quantitative and qualitative results.
• Use past successes and mistakes in developing options for state plan strategies.
• Develop a menu of alternatives.
• Build state plan goals and strategies on results of CSNA steps documented in state plan attachment 4.11(a).
• Note some recommended actions can happen now, some may need more study.
The model CSNA requires several types of skills from staff and/or contractors conducting the work including project management, study design, planning and budgeting, data and literature search, survey design and administration, focus group facilitation, phone interviewing, quantitative and qualitative analysis, action strategy development, and report writing. The amount of time and staff effort needed will vary with the resources and abilities available within each state agency and SRC.
Outreach
A needs assessment is more than an information-gathering process. Along with providing information to generate the State Plan, it also is an opportunity to reach out to other organizations and agencies to assure broad input in the needs assessment process and establish long-term connections. For example, connections can be made to state disability councils or state commissions; service providers; organizations focused on parents of people with disabilities, minorities, or employment issues; or specific employers who had successes and/or challenges in placing VR consumers.
Dissemination
The model CSNA emphasizes the importance of providing information about process and results, and includes development of a plan for dissemination. Dissemination is an opportunity to feed back to those who have participated in the process and to strengthen information exchange with others in the community. Methods for dissemination may include traditional paper products but also the agency Web sites and perhaps experimenting with social networking and other emerging communication methods.
13

Overview of Model
Six Steps to Assessing and Addressing VR Needs
The model suggests six steps that provide a framework for the CSNA.
1. Defining and establishing CSNA goals
2. Developing CSNA plan for information and dissemination
3. Gathering the information
4. Analyzing the results and developing findings
5. Developing the conclusions: Potential action strategies
6. Informing state plan goals, priorities, and strategies
Exhibit .3 Six Steps to Assessing and Using VR Needs: An Information Strategy
6
Inform State Plan Goals, Priorities and Strategies
5
Develop Conclusions
‘’ 4 Analyze Results
3 Gather Information
2 Plan for Information
1 Establish CSNA Goals
14

Guide to Assessing VR Needs
Step 1: Defining and Establishing CSNA Goals
The goals should be identified at the start of the process so that the assessment can be planned with each goal in mind. A brief review of readily available existing information and VR knowledge will provide a useful background for the study and for identifying any specific VR service needs to study. This includes reviewing available disability data tables, gathering relevant state and local agency reports, including previous needs assessments and State Plans, evidence-based practices, and input from VR and the SRC. The goal-setting process also is an opportunity to reach out to other organizations and agencies to assure broad input.
The information will provide background on the nature of the potential VR population within the state, the population that is currently being served, and the VR services currently received by those in the VR and WIA systems, as well as identifying other agencies, organizations, and individuals who are resources for information collection later on. Potential unserved or underserved people with disabilities that are relevant with this review may be identified in this process. Examples of groups that may be identified include (but are not limited to):
People with… People with disabilities who are…
• mental illness, chronic or serious; • poor/low-income people;
• traumatic or acquired brain injury; • veterans;
• developmental disabilities, including intellectual disabilities;
• older, including the aging workforce;
• autism spectrum disorders; • living in rural areas;
• deaf-blindness; • limited in education;
• deafness, or other hearing impairments;
• victims of crime or; domestic violence
• spinal cord injury; • inner city residents;
• blindness, or other visual impairments;
• members of other disadvantaged social groups;
• degenerative conditions; • former prisoners;
• HIV/AIDS; • students in transition; and
• dual diagnosis; and • current or past VR consumers with additional VR needs. • other “low incidence” disabilities.
15

Overview of Model
Tables and summaries of relevant report findings can be assembled as a briefing book for use as a reference in establishing study goals. Individuals responsible for establishing the study goals can refer to these findings to identify and prioritize the overall research goals, to identify unserved and underserved groups in the state, to identify specific subpopulations of those with most significant disabilities in the state who need VR services, and to develop any other state specific goals.
The Step 1 product will be a list of goals for the CSNA, along with a draft state profile and the participation of the VR agency staff, SRC members, and the community.
Step 2: Developing CSNA Plan for Information and Dissemination
Needs assessments are applied social science research. There are a variety of methods, both quantitative and qualitative, that have been used historically to conduct needs assessments. Combining several information strategies, taking advantage of the strengths of each while compensating for gaps and weaknesses in each method can provide the best picture of the needs.
A mix of methods and information sources can address the information goals. Step 2 of the model CSNA will result in a plan for collecting information, analyzing findings, disseminating results, and informing the state plan. The plan includes identifying specific data, sources, and methods; planning for stakeholder involvement; data analysis; costs and timeline; and staffing or technical assistance needs.
Step 3: Gathering the Information
Because no one information source will provide comprehensive information, seven information strategies are part of the CSNA design:
• use of existing disability population statistics, including the American Community Survey (ACS)
• disability population estimates from available data
• population projections and economic forecasts from federal and state data
• existing VR agency data, studies and experience
• state level statistics from other federal programs
• state and local data and reports
• stakeholder input: VR counselor and consumer surveys, focus groups, key informant interviews, and community hearings
16

Guide to Assessing VR Needs
In most cases, these strategies take advantage of information collected by the VR agency, the SRC, and others and are available for use. That allows a cost-effective approach with a concentration of new information collection – surveys, focus groups, interviews, hearings, etc. – to fill the gaps in available information. Together these sources will provide a comprehensive view of state rehabilitation needs.
Each of the seven information strategies offers advantages and includes some shortcomings. Exhibit .4 shows the relationship of each of the identified information strategies (columns) with the rehabilitation needs to be assessed (rows), followed by summaries of each strategy. Each information source has strengths and limitations to its use in the model CSNA; Exhibit .5 shows those strengths and limitations of the data sources. Technical information, including specific statistics and approaches, are included in corresponding detailed Appendix sections. It should be noted that these suggested information strategies suggest a basic framework, not a limitation. There may be many additional resources available in the state that can be added to the lists provided here.
The Step 3 product will be the information collection results for each information strategy, along with a description of information collection process including stakeholder involvement, and a feedback loop for stakeholder input.
Step 4: Analyzing the Results and Developing Findings
Once all the data has been collected, it will be analyzed and organized to inform the pre-defined information goals and to identify new areas for consideration.
Existing data tables from national and state data sets can be reviewed and organized using a review template. Tables of data can be constructed if existing national and state data tables do not provide data in a manner needed for the needs assessment. Survey data from VR counselors and consumers can be analyzed and statistical tables prepared. State reports and relevant literature can be summarized using a template and organized. Focus group input, key informant interviews, and community hearings can be qualitatively analyzed by an iterative review and analysis process that results in information tagged by topics.
Finally, the findings from the individual sources are combined by information goal and topics.
Step 5: Developing the Conclusions: Potential Action Strategies
The purpose of Step 5 is to develop the conclusions from the work, which entails generating alternatives for goals, strategies, and actions. Using the participation of VR managers and SRC members, potential action strategies can be generated for each need
17

Overview of Model
expressed in findings of Step 4. The product will be a list of alternatives by information goal and need.
Step 6: Informing State Plan Goals, Priorities, and Strategies
The purpose of the needs assessment is to inform state agency policy, particularly the State Plan. Step 6 is the preparation of results that will inform the State Plan process.
The method in Step 6 is group process where the conclusions are considered as a whole and question by question. Given the resource constraints in the VR system, conclusions will be prioritized, using criteria identified for the assessment, such as urgency, degree of need, significance of disability, equity, and efficiency.
The product of Step 6 will be recommendations from the CSNA for State Plan goals, priorities, and strategies.
18

Guide to Assessing VR Needs
Seven Information Strategies
The CSNA addresses rehabilitation needs in the state, including those with significant disabilities, those in need of supported employment, those who are unserved and underserved including minorities, those served through other parts of the statewide workforce system, and the need to establish, develop, or improve CRPs. Unfortunately, state population statistics do not include these specific categories, and alone cannot answer the CSNA questions. But there are many additional information sources that, together, can provide the planning information for VR.
The proposed model CSNA includes seven information strategies. In most cases, these strategies take advantage of information collected by the VR agency and others and are available for use. That allows a cost-effective approach with a concentration of new information collection – surveys, focus groups, interviews, hearings etc. – to fill the gaps in available information. Together these sources will provide a comprehensive view of state rehabilitation needs.
Each of the seven information strategies offers advantages and includes some shortcomings. Technical information including specific statistics and approaches are included in corresponding detailed Appendix sections. It should be noted that these suggested information strategies suggest a basic framework, not a limitation. There may be many additional resources available in the state that can be added to the lists provided here.
Exhibit .4 shows the relationship of each of the identified information sources (columns) with the rehabilitation needs to be assessed (rows). In the pages following the exhibit, each information strategy is summarized. Each information source has strengths and limitations to its use in the model CSNA; Exhibit .5 shows those strengths and limitations of the data sources.
19

Overview of Model
Exhibit .4 Information Strategies in the Model CSNA
1 2 3 4 5 6 7
Popu
latio
n st
atis
tics
Popu
latio
n es
timat
es
Popu
latio
n pr
ojec
tions
&
econ
omic
fore
cast
s
VR
age
ncy
data
&
info
rmat
ion
reso
urce
s
Stat
e le
vel d
ata
from
fe
dera
l sou
rces
Stat
e/lo
cal d
ata
&
repo
rts
Stak
ehol
der
inpu
t:
focu
s gro
ups,
surv
eys,
inte
rvie
ws,
hear
ings
Rehabilitation needs of individuals with
disabilities x x x x x x x
Needs of individuals with most significant
disabilities x x x x x x
Need for supported employment x x x x x
Needs of minorities x x x x x x x
Needs of individuals other than minority who are unserved or
underserved
x x x x x x
Needs of individuals served through other
parts of statewide workforce
investment system
x x x x
Need to establish, develop or improve
CRPs x x x
20

Guide to Assessing VR Needs
1: Disability Population Statistics
American Community Survey (ACS). To the extent that existing surveys contain relevant information, they reduce or eliminate the costs of designing new surveys and collecting new data. The American Community Survey (ACS) from the Bureau of the Census is an annual sample survey of social, economic, housing and demographic characteristics, including disability, which provides estimates at the national, state, and local levels. The ACS includes some disability questions along with other census characteristics such as ethnicity, education level, language spoken at home, poverty status, employment status (especially “unemployed”) and median earnings. ACS information is readily available for states and substate areas on the American FactFinder Web site1 and in many published reports including annual disability status reports focusing on employment.
However, the ACS disability measures are very broad, supporting estimates of the prevalence of physical, sensory, and mental disability and the numbers of individuals reporting disability-related limitations to working, going outside the home, or doing self-care. (Note that in 2008 the survey replaced the question on sensory disability with separate questions on visual and hearing disability and deletes the question on work limitation. From the 2008 data forward, the ACS will offer estimates of those with visual disabilities and those with hearing disabilities in a state.) While there is no measure of “significant disability” in the ACS, limiting its use in answering the specific requirements related to those with significant disabilities, there are questions about people needing assistance within the home or going outside, which may serve as an indicator of “significance.” Another current limitation is that because the disability questions have been refined since the 2000 census, the population base has been changed in 2006 to include people in group quarters. The Census Bureau classifies all people not living in households as living in group quarters. There are two types of group quarters: institutional (for example, correctional facilities, nursing homes, and mental hospitals) and noninstitutional (for example, college dormitories, military barracks, group homes, missions, and shelters). Also, the ACS is best used for annual estimates; any interpretation of trends is discouraged or should be done with caution, especially since additional question changes are planned.
Current Population Survey (CPS). In 2008, the Current Population Survey (CPS), a joint project of the U.S. Bureau of the Census and the Bureau of Labor Statistics, began using the ACS disability questions. The CPS is the primary source of information on the labor force characteristics of the U.S. population. The CPS is used to compute the federal government’s official monthly statistics on total employment and unemployment, and
1 (http://www.factfinder.census.gov)
21

Overview of Model
contributes to the Employment Situation report, a Primary Federal Economic Indicator. The use of the ACS questions in the CPS will offer the potential to estimate employment, unemployment, earnings, and hours of work (among other measures) for those who have a disability. Published CPS data focus on those ages 16 and over. CPS data provide estimates for the nation as a whole and serve as part of model-based estimates for individual states and other geographic areas.
Behavioral Risk Factor Surveillance Survey (BRFSS). One potential strategy for conducting a state population survey is to add questions to the state’s Behavioral Risk Factor Surveillance Survey (BRFSS) conducted in state health departments. Appendix A contains more detailed information, including sources for the data and a list of available predesigned ACS tables and an example of disability questions used in one state BRFSS (Oregon).
2: Disability Population State Estimates
While available survey information does not provide state or substate level measures of specific disabilities or significance of disability, estimating techniques can be used to bridge some of the gap between available information and VR planning needs. Briefly, there are two types of estimating approaches to be considered.
A commonly used approach – applying a measure from a national study that looked at more measures of disability to state or local state population statistics – has been used by several national disability organizations to estimate populations such as intellectual disability or blindness. Surveys such as the Survey of Income and Program Participation (SIPP) can be used with ACS or census information to estimate subpopulations for the state. This is a tool that is useful in estimating unserved and underserved disability groups.
A more technical approach uses Multivariate Statistical Analysis to construct an estimation model to estimate disability. More detail and example results of these two estimation methods are included in Appendix B.
3: Population Projections and Economic Forecasts
Population projections provide information about expected population changes in the state, including overall population trends and changes within age groups of interest to VR. These projections are estimates of the population at future dates, based on assumptions about future births, deaths, and international and domestic migration. Current Census Bureau projections by state include age and sex projections from Census 2000 to 2030, in five-year increments. Population projections from the US Census Bureau that include racial and ethnic minorities by state are available but are not as
22

Guide to Assessing VR Needs
current as they are based on the 1990 Census. Many states have more recent projections on racial and ethnic minorities that are based on Census 2000.
These projections do not include disability measures, but with an assumption that existing disability rates will be maintained over the projection period general population projections will be a useful source for VR forward planning.
The Bureau of Labor Statistics (BLS) provides detailed 10-year projections at the national level on occupational outlook. A related Web site uses BLS and state data to provide occupational employment projections by state. That Web site currently has projections from 2006 to 2016 for each state and Washington, D.C. These projections, by occupational category and occupation, include numeric employment change, percent employment change, and average annual openings. These data provide information about which kinds of jobs are projected to be most available in the state.
In addition to these data that are available for all states, individual state departments of labor and economic development have used BLS and other data to produce state-level reports on employment outlook and labor force growth. Appendix C includes projection methods and information resources.
4: VR Agency Data and Information
The focus in the CSNA is on individuals in need of services and includes strategies for identifying the individuals who are not in the system. But there also is a great contribution that can be made in the CSNA process by using VR’s own information resources effectively. Existing VR agency data are cost effective, timely, and efficient sources of data that may be used alone and in conjunction with other data sources to address questions. Agency data used for the RSA-911 contains extensive information on VR consumers. Data include disability and other demographic characteristics of the consumer, pre- and post-descriptors of status, types of services received and their costs, and the nature of the closure, such as reason, type, and characteristics of employment status. For example, agency data used for the RSA-911 system may be used to examine the services used by individuals with different disabilities, education, and employment goals. Also, comparison to determine whether people currently served by VR are representative of the racial and ethnic minority distribution of people with disabilities within the state helps answer questions about the needs of individuals with disabilities who are minorities and are unserved or underserved.
In the case of information on CRPs, use of any available data reports such as data provided by CRPs may provide state-level and substate-level data on location, cost, and results. Furthermore, agency RSA-911 data includes CRP-related information on source of referral, services provided and source, and extended employment outcomes.
23

Overview of Model
In addition to using available program data, the model CSNA relies on program knowledge not recorded in electronic records but available from the VR counselors. Appendix D includes detail on VR agency data for the CSNA.
5: State Level Data from Federal Sources
A number of national programs collect and disseminate administrative state-level data about program recipients with disabilities that are relevant to the VR comprehensive needs assessment. These data will be uniform from state to state. In particular, Individuals with Disabilities Education Act (IDEA) statistics on transition-age youth in special education, section 504 data on students with disabilities who are receiving 504 services, Social Security data on people receiving Social Security disability benefits, and Workforce Investment Act (WIA) data on people with disabilities participating in other parts of the workforce system provide information about rehabilitation needs in a state.
IDEA data provide information about the specific disabilities of transition-age students, including disabilities that are considered significant in the VR system and may be most significant depending on the individual state’s criteria (e.g., deaf-blind, multiple disabilities, traumatic brain injury). In addition, the IDEA data make it possible to look at the graduation and dropout rates by disability for students 14 years and over that help in identifying disability groups of transition-age youth with particular needs. The IDEA data also include graduation and dropout patterns by racial and ethnic minority groups. Graduation rates of minority groups with disabilities may be compared with graduation rates for other minority or majority groups within the state as well as to other states and the entire U.S. These data help to estimate the anticipated need for transition services in the coming years.
Section 504 data from the Office for Civil Rights of the U.S. Department of Education provide an overall picture of the size of the population of children and youth in schools that were not eligible for IDEA services but did receive Section 504 services because of their disabilities. Published data on the total number of "Section 504 only" students are not disaggregated by age, by transition status, nor by specific disability. But state-level departments of education may be able to assist in disaggregating the data by age to give a more accurate estimate of the transition-age group with Section 504 disabilities.
Social Security provides information about the rehabilitation needs of people with significant disabilities in the state2. Social Security data include the total number of
2 People who are receiving Social Security disability benefits are considered to have significant disabilities and to be eligible for VR services, provided they intend to achieve an employment outcome (Hager, 2004). However, states vary in their criteria about whether people who receive Social Security disability benefits are considered to have a “most significant disability.”
24

Guide to Assessing VR Needs
people and disabled workers receiving Social Security benefits. Additional tables show breakdowns by age group. Social Security data provide information about the (very small) numbers of Social Security recipients who return to work.
Workforce Investment System Data. VR operates in the context of the state workforce investment system. The public employment system for people with disabilities includes VR and also the other options available in the several components of the Workforce Investment Act (WIA). The U.S. Department of Labor’s Employment and Training Administration (DOLETA) gathers data through a grantee reporting system for WIA grantees called the Workforce Investment Act Service Record Data (WIASRD). It covers the following programs: the Workforce Investment Act Information Management System (OMB No. 1205-0420), the Labor Exchange Reporting System (OMB No. 1205-0240) for programs administered under the Wagner-Peyser Act and the Veterans Employment and Training Service, the Trade Adjustment Assistance Program (OMB No. 1205-0392), the National Farmworker Jobs Program (OMB No.1205-0425), and the Indian and Native American Program (OMB No. 1205-0422) (U.S. Department of Labor 2007b). Data collected include disability, demographic characteristics of the consumer, program activities and services, employment and job retention data, wage data, and education and skill attainment data. However, unlike VR’s detailed description of disability in the RSA-911, the WIASRD information only identifies individuals as having a disability or not and does not have any information on the disability condition or significance of disability and, thus, cannot be compared to VR information. Also these data may not capture all users of employment services.
Coordination with state Employment Security Agencies may result in obtaining additional tables that reveal county- or regional- level data to answer questions about rehabilitation need at a more local level, as well as results of WIA customer satisfaction surveys and other WIA data that may not be included in the WIASRD.
Appendix E has details on state- level data from national programs.
6: State/Local Data & Reports
The model CSNA takes advantage of resources from other related agencies and organizations to learn about specific disability populations and to identify needs. A systematic effort to identify and collect related studies and reports will be a cost-effective way to be comprehensive in a statewide effort. Sources include organizations focusing on the needs of individuals with significant disabilities and from administrative agencies who serve individuals with disabilities. This effort will not only provide useful population and service information but also will assure that the CSNA takes the resources, information and findings from throughout the state into account in identifying
25

Overview of Model
rehabilitation needs. This includes studies and results from Medicaid Infrastructure Grants (MIGs); organizations serving individuals with intellectual disabilities, mental illness, traumatic brain injury, and other conditions; and consumer advocacy organizations. Appendix F provides detail on state and substate reports and other materials.
7: Stakeholder Input – Surveys, Focus Groups, Interviews, Hearings
The final information strategy involves collection of study-specific information from individuals throughout the state, using several well-known information collection methods. These methods include surveys, focus groups, key informant interviews, and hearings designed to address questions tied directly to the requirements of the CSNA. These varied methods can provide many opportunities for stakeholder participation in the study, will help fill information gaps, and provide a rich picture of rehabilitation need. This is the area where new information collection, specifically for the CSNA, is concentrated. Important participants include: current and former VR consumers, individuals who have not used VR but may be eligible, VR counselors and supervisors, CRP staff, One-Stop staff, representatives of minorities and other groups that have been identified as unserved or underserved, and business.
Surveys. A survey of unserved and underserved individuals to identify unmet needs for rehabilitation services generally is not usually feasible because there is no way to identify the individuals who should receive the survey3. On the other hand, surveys are ideal for obtaining information from VR counselors and consumers. If routine surveys are not already in place as part of the agency’s Quality Assurance (QA) or program management, adding questions regarding service needs and gaps would support the CSNA. Otherwise, one-time or ongoing surveys are recommended.
Focus groups were developed as a marketing tool and have become a popular tool for needs assessments. Focus groups provide a method for convening small groups to talk about specific issues and offer an opportunity to work with other organizations in arranging and hosting the groups. The model CSNA includes suggestions for a variety of focus groups including the following: people with disabilities; employers; joint group with disability navigators/One-Stop staff/VR counselors; and service provider/CRPs.
Key informant interviews. These are in-depth open-ended interviews with selected knowledgeable people in the state. Key informants can cover all required topics in the model CSNA. This approach provides expert opinion and the advantage of involving the
3 It may be feasible to add VR or employment need questions to state surveys such as the Behavioral Risk Factor Surveillance System (BRFSS) and in fact some states have already done so. Other sampling frames, such as disability registries, also may make surveys feasible.
26

Guide to Assessing VR Needs
individuals in the state with the most knowledge of the issues and is also a good opportunity to involve leaders in related agencies and services.
Hearings and community meetings are the most open-ended of the approaches; individuals can elect to participate and comment on areas of the needs assessment. The State Plan process itself has hearings that may be used as input into the needs assessment; other disability organizations may hold hearings that also will be relevant.
Appendix G provides detail on surveys, focus groups, interviews, and hearings.
27

Overview of Model
Exhibit .5 Strengths and Limitations of Data Sources
No one data source can provide all the needed information for a CSNA. Furthermore, most of the data sources do not provide precise data for a CSNA. Each information strategy has sources with strengths and limitations for use in the CSNA. Therefore, information from all sources needs to be taken together to maximize their strengths and minimize their limitations. More detail on the sources can be found in the Appendices.
Source Strengths Limitations
Population Statistics (Appendix A) American Community Survey (ACS)
Source of standardized state disability data. 2008 data (available 2009) will include visual and hearing disabilities. Source of substate data.
Broad definition of disability categories; no specific conditions other than visual and hearing disabilities (available in 2009).
Current Population Survey (CPS)
Ease of use; will use same disability categories as ACS.
Broad definition of disability categories; no specific conditions other than visual and hearing disabilities (available in 2009).
Survey of Income and Program Participation (SIPP)
Defines disability by function; contains measure of severity.
No state estimates; does not use the same disability categories as RSA-911.
Behavioral Risk Factor Surveillance Survey (BRFSS)
Representative sample of state disability population, opportunity to add specific questions relevant to CSNA.
Cost to include questions in survey; lead time for inclusion of new questions; may be limit on number of questions allowed.
State Population Estimates (Appendix B) Apply SIPP rates to state data
Ease of use; can produce state estimates.
Assumes relationships will not vary by state.
Multivariate analysis to estimate disability
Combines the strengths of ACS and SIPP; good for blindness measure.
Disability categories limited to categories measured in the SIPP and population measured in ACS.
Projections (Appendix C) Census projections Vision of future size and
ethnic/racial composition of state's population.
No projection by disability.
BLS labor /economic forecasts
Projections of occupations needed in state's future.
Measure of all jobs, not a focus on jobs that are specifically for VR clients.
28

Guide to Assessing VR Needs
Source Strengths Limitations
VR agency data (Appendix D)
Agency data Describes characteristics, service experience, costs, and outcomes of consumers of VR.
Only includes people in the VR system.
Federal program data at the state level (Appendix E)
IDEA Data on many youth with disabilities in transition; by disability types.
No measure of VR eligibility or potential use.
504 Data on some children and youth with disabilities in transition (receiving 504 services).
No measure of VR eligibility or potential use, no disability or age categories in published data.
WIA – agency data used for WIASRD
Standardized data on those being served in other parts of the workforce investment system can be cross-tabbed by disability.
Unclear of the impact of this information to need for VR services.
Wagner-Peyser and Veteran’s Employment – agency data used for ETA 9002 and VETS 200
State data on persons with disabilities using One-Stop career centers.
Limited service information.
Social Security Identification of SSI/DI population that is relevant to VR population.
VR participation not included.
State and sub-state reports (Appendix F)
Specific to state and/or to disability in state; informs information goals; already available.
Developed for other purposes; not likely to be comprehensive; reliability will vary; may be one-time studies.
29

Overview of Model
Stakeholder input (Appendix G)
VR counselor and consumer surveys
Ideal for input from large numbers of respondents; specific answers to questions.
May be difficult to get good response rate from consumers.
Statewide population surveys
Statewide estimates of population and need; may benefit from other statewide surveys (e.g., BRFSS).
For most states, no sampling frame of state disability population; very costly unless a state survey is already in place.
Focus groups Involves stakeholders. Not representative; takes time to organize, run, and interpret.
Key informants Input from knowledgeable people; in-depth answers; involves experts in process.
Not representative of all issues or opinions.
Hearings Gives an open opportunity to provide input; may be able to take advantage of other hearings held.
Not representative.
30

Guide to Assessing VR Needs
Exhibit .6 Outline of Attachment 4.11(a)
Attachment 4.11(a) Required Information in Attachment 4.11(a) to the Title I state plan and its title VI B supplement includes:
I. the results of the CSNA describing the rehabilitation needs of individuals with disabilities residing within the state, particularly the vocational rehabilitation services needs of:
a. individuals with the most significant disabilities, including their need for supported employment;
b. individuals with disabilities who are minorities;
c. individuals with disabilities who have been unserved and underserved by the VR program; and
d. individuals with disabilities served through other components of the statewide workforce investment system (other than the VR program), as identified by such individuals and personnel assisting such individuals through the components.
II. an assessment of the need to:
a. establish community rehabilitation programs (CRPs);
b. develop CRPs; or
c. improve CRPs within the state.
31
Overview of Model
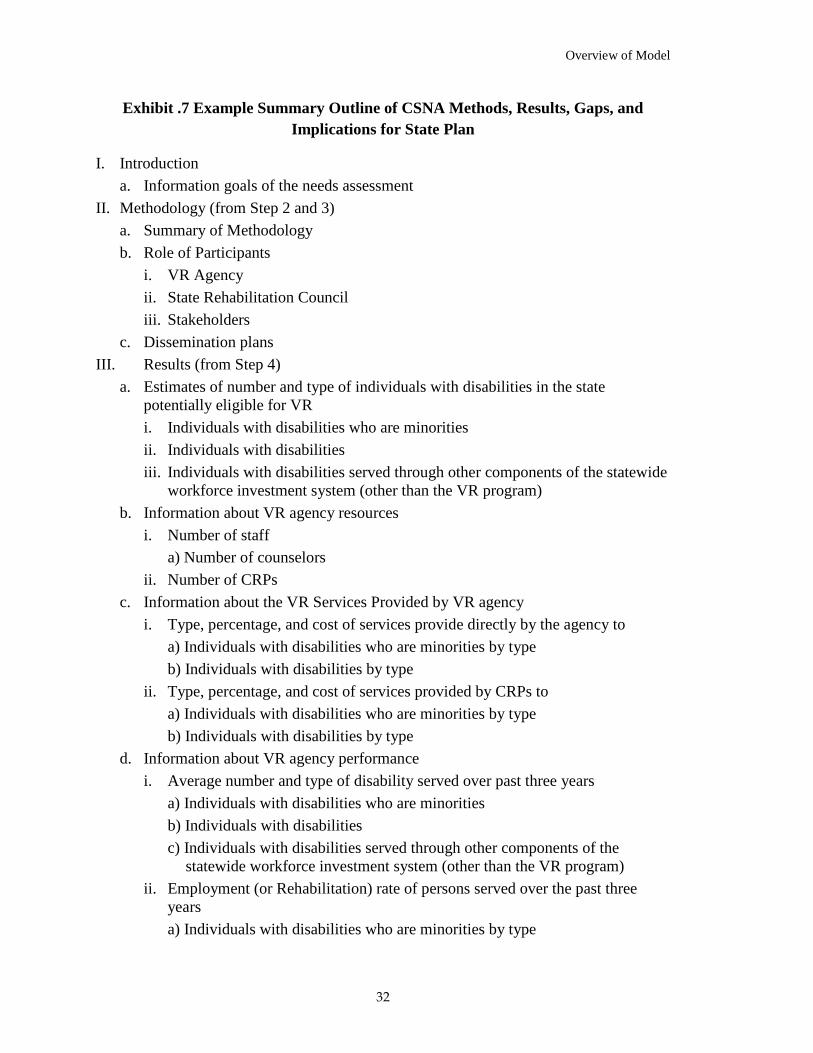
Exhibit .7 Example Summary Outline of CSNA Methods, Results, Gaps, and Implications for State Plan
I. Introduction a. Information goals of the needs assessment
II. Methodology (from Step 2 and 3) a. Summary of Methodology b. Role of Participants
i. VR Agency ii. State Rehabilitation Council iii. Stakeholders
c. Dissemination plans III. Results (from Step 4)
a. Estimates of number and type of individuals with disabilities in the state potentially eligible for VR i. Individuals with disabilities who are minorities ii. Individuals with disabilities iii. Individuals with disabilities served through other components of the statewide
workforce investment system (other than the VR program) b. Information about VR agency resources
i. Number of staff a) Number of counselors
ii. Number of CRPs c. Information about the VR Services Provided by VR agency
i. Type, percentage, and cost of services provide directly by the agency to a) Individuals with disabilities who are minorities by type b) Individuals with disabilities by type
ii. Type, percentage, and cost of services provided by CRPs to a) Individuals with disabilities who are minorities by type b) Individuals with disabilities by type
d. Information about VR agency performance i. Average number and type of disability served over past three years
a) Individuals with disabilities who are minorities b) Individuals with disabilities c) Individuals with disabilities served through other components of the
statewide workforce investment system (other than the VR program) ii. Employment (or Rehabilitation) rate of persons served over the past three
years a) Individuals with disabilities who are minorities by type
32

Guide to Assessing VR Needs
b) Individuals with disabilities by type c) Individuals with disabilities served through other components of the
statewide workforce investment system (other than the VR programs e. Vocational rehabilitation services needs of
i. Individuals with most significant disability, including their need for supported employment
ii. Individuals with disabilities who are minorities iii. Individuals with disabilities who have been unserved and underserved by the
VR program iv. Individuals with disabilities served through other components of the statewide
workforce investment system (other than the VR program), as identified by such individuals and personnel assisting such individuals through the components.
f. Community rehabilitation programs (CRPs) within the state i. Need to establish CRPs ii. Need to develop CRPs iii. Need to improve CRPs
IV. Gaps between service needs and current services provided (from Step 4 and 5) to a. Individuals with disabilities who are minorities b. Individuals with disabilities c. Individuals with disabilities served through other components of the statewide
workforce investment system (other than the VR programs V. Implications for the State Plan (from Step 6)
a. Goals and priorities to be included or modified in the plan based on results of CSNA
b. Strategies to implement goals and priorities
33

Overview of Model
(THIS PAGE LEFT INTENTIONALLY BLANK)
34

1
Part II – Implementing the Model CSNA
In this part, the steps of the model CSNA are described. Exhibits with examples or further details are provided at the conclusion of each step.
Step 1: Defining and establishing CSNA goals
The model’s first step is to define and establish the goals for the CSNA. At the end of Step 1, the following products should be completed.
Task Product
Step 1: Defining and establishing CSNA goals
1.1 Establish the team
1.2 Review data Draft state profile: disability population, employment trends, VR agency service and outcome information, and other relevant information
1.3 Define goals for the CSNA List of goals for the CSNA
1.1 Establish the team
The first activity is to establish roles and responsibilities for those to be involved in the needs assessment process. The purpose is to establish the responsible entity for the conduct and oversight of the CSNA. Two possible approaches are 1) to establish a coordinating committee or 2) to assign the CSNA to an individual or small group. The successful CSNA is a result of a partnership between the VR agency, the SRC, and the community.
Establish VR agency representatives and roles for the CSNA by determining who at the agency will be responsible, what structure is going to be used to oversee the CSNA, and who at the agency will be involved. In considering who to involve, Step 2, Exhibit 2.2 provides detail on the types of skills and experience needed throughout the CSNA. The structure for how decisions are made (e.g., made by one person, made by coordinating committee) needs to be considered at the very start.
Establish SRC representatives and roles in CSNA. The regulations call for a “statewide needs assessment, jointly conducted by the designated State unit and the State Rehabilitation Council” (34 CFR 361.29(c)(2)). The SRC can provide important input and relevance to the CSNA throughout the process, including the following examples:
35

Define Goals
• identifying topics of particular interest and identifying specific unserved or underserved populations;
• identifying key informants and focus group participants and reviewing the information plan and instruments;
• hosting focus groups, recruiting key informants, conducting hearings, and providing communications and promotion of the needs assessment process;
• developing consumer satisfaction survey;
• developing CRP and employer questions;
• developing and reviewing information from other sources, reviewing qualitative information, and identifying themes;
• developing, reviewing, and discussing findings and conclusions;
• disseminating results and conclusions to community groups and participants in the needs assessment;
• developing, reviewing, and discussing recommendations for the State Plan; and
• disseminating State Plan to community groups and participants in the needs assessment.
The responsibilities should be established as early in the needs assessment process as possible and updated as needed.
Establish community participation. Building community participation at the outset can assure better and more relevant results, improved community relations, and eventual support for the State Plan. Early community participation also will establish lines of communication that will aid in the dissemination of the products of the CSNA. Exhibit 1.1 provides a list of example state and local organizations, both governmental and nonprofit, to consider as part of a community outreach team.
Being creative in outreach and networking. As community partners are contacted, it will be important to establish clear methods for the exchange of information and input. In addition to the use of existing hearings and public meetings, this can be an opportunity for creative use of media to let the community partners and the public know the CSNA is underway and that the agency is interested in receiving comments and information related to the goals of the needs study. Some examples include:
• public service announcements on radio, local television, and local cable channels;
• VR agency Web site;
36

1
• SRC Web site; and
• new media options such as: Facebook fan pages, Twitter, and other social networking venues.
1.2 Review existing data
Review national data on the disability population, employment trends, VR service and outcome information, and other relevant information. To understand how to approach the required information goals, as well as to help define possible additional state information goals, conduct a review of easily retrieved, available knowledge and information.
The pre-identified disability tables and reports shown in Exhibit 1.2 are easy to acquire and review, allowing for rapid development of a working knowledge base and general summary. Examples of available pre-existing American Community Survey (ACS) tables are shown in Exhibit 1.3 (R1802 – State ranking table on disability, S1801 – Disability characteristics for California, and S1802 – Selected economic characteristics for the civilian noninstitutionalized population by disability status for California).
Additional statistical materials about which a state’s CSNA team is aware should be included as well. Existing data in the RSA-911, RSA-113, RSA-2, and other data the state agency has on hand may be useful for brief examination of issues or trends (e.g., populations served or cases closed, types of services provided, costs for services). As information is reviewed, significant trends and gaps should be noted as topics for further analysis.
Develop a briefing book of background materials (a State Profile). Tables and summaries can be collected in a briefing book for use as reference in establishing study goals. The information will provide background on the nature of the potential VR population within the state and the population that currently is being served, and the VR services currently received by those in the VR and WIA systems, as well as identifying other agencies, organizations, and individuals who are resources for information collection later on. Exhibit 1.4 has an example of one method to present state data and VR data for minority populations.
1.3 Defining a list of goals for the CSNA
Review the model CSNA, and this Guide document, to get an overview of the work ahead and also the intended products.
37

Define Goals
The information goals of the CSNA are defined in the Act and regulations. To be comprehensive, the CSNA findings should address all information goals. The goals should be identified at the start of the process, so that the assessment can be planned with each goal in mind. The information goals defined in the Act (reframed here in the form of questions) are:
1. What are the rehabilitation needs of individuals with disabilities, particularly the vocational rehabilitation services needs of individuals with most significant disabilities, including their need for supported employment services?
2. What are the vocational rehabilitation services needs of minorities?
3. What are the vocational rehabilitation services needs of individuals with disabilities who have been unserved or underserved by the vocational rehabilitation program?
4. What are the vocational rehabilitation services needs of individuals with disabilities served through other components of the statewide workforce investment system?
5. What is the need to establish, develop, or improve community rehabilitation programs within the state?
The assessment is not limited to federal requirements, however. Additional VR service needs may be included. The flexibility of the model CSNA allows for the assessment of state-specific issues that become apparent during the review of existing information, including:
• emerging disability groups; • unserved and underserved populations; • identified service gaps; • changes in state population; and • research results on special needs of disability groups within state or nation.
Often the magnitude or scope of service gaps, the recent manifestation of an emerging group, or the presence of obviously underserved population segments will be apparent from existing information. For example, Wyoming Division of Vocational Rehabilitation included a focus on traumatic brain injury (TBI) after the agency found a Centers for Disease Control (CDC) study that showed that Wyoming had the highest brain injury mortality rate in the nation, almost 1.7 times higher than the national average (Wyoming Division of Vocational Rehabilitation, 2007). Incorporating the firsthand knowledge of VR and SRC staff members is also important in identifying new needs that may not yet be showing up in published data.
38

1
Summarize issues identified in prior CSNA and State Plan processes and other VR or SRC reports. Learning from the past is a very important step in the needs assessment planning process. Noting issues identified in prior CSNA and State Plans and in other VR or SRC reports can isolate long-standing unmet needs or underserved populations. This review also can show improvement over time. Note what has changed, how and why things are different, and if the variation is an improvement. The result should be a summary of issues previously identified.
Obtain input from VR and SRC staff about goals. Review staff surveys or other inputs received in the last year to compile lists of topics that have been raised by staff. This is not new data collection, but rather a look back at input already received. Furthermore, anecdotal information from VR and SRC staff members, analysts, and program managers can yield very helpful information about program goals.
Identify agencies, organizations, and individuals with relevant information about VR service needs in the state and local communities. A list of federal and state organizations likely to have relevant information is listed in Exhibit 1.5. Also, ask community partners (or review list on Exhibit 1.1) for additional information. Conversations with these organizations about any findings or issues they have related to VR will be of use in understanding the needs of state disability populations. In particular, include state disability councils or state commissions; service providers; organizations focused on parents of people with disabilities, minorities, or employment issues; or specific employers who had successes and/or challenges in placing VR consumers. This is only a partial list. More ideas should be generated in conjunction with SRC input. Another advantage to this effort is the opportunity to include these organizations in the further tasks in the CSNA, namely networking with the community.
Convene a brainstorming meeting of VR and SRC decision makers to prioritize any state-identified goals, to identify unserved and underserved groups in the state, and to identify specific subpopulations of those with most significant disabilities in the state who need VR services. Hold a brainstorming meeting of the appropriate VR and SRC staff to establish the list of CSNA information goals. Individuals responsible for establishing the goals can refer to the briefing book to identify unserved and underserved groups in the state, to identify specific subpopulations of those with most significant disabilities in the state who need VR services, and to develop any possible state-specific goals. This is the time to determine whether this information suggests adding one or two goals to the CSNA.
39

Define Goals
Exhibit 1.1 Potential community partners
State, county and local agencies that serve people with disabilities including departments, divisions, boards, councils or authorities:
Aging and disability services Example 1: San Mateo County (California) Commission on Disabilities: <http://www.co.sanmateo.ca.us/smc/department/cod/home/0,2151,65129_59681145,00.html> Example 2: Indiana Governor’s Council for People with Disabilities: <http://www.state.in.us/gpcpd/>
Developmental services or developmental disabilities Example: Michigan Developmental Disability Council: <http://www.michigan.gov/mdch/1,1607,7-132-2941_4868_4897-14614--,00.html>
Education and/or special education Example: State of Alaska Governor’s Council on Disabilities and Special Education: <http://hss.state.ak.us/gcdse/>
Housing Example: Maine State Housing Authority: <http://www.mainehousing.org/ABOUTFairHousing.aspx>
Mental health Example: North Carolina Division of Mental Health, Developmental Disabilities and Substance Abuse Services: <http://www.ncdhhs.gov/mhddsas/>
Mental retardation/Intellectual disabilities Example: Kentucky Cabinet for Health and Family Services, Department for Mental Health, Developmental Disabilities and Addiction Services: <http://www.mhmr.ky.gov/kdmhmrs/default.asp>
Personal Assistance Services (PAS), Attendant Services, In-home Supportive Services
Example: Texas Association for Home Care Personal Assistance Services: <http://www.tahc.org/displaycommon.cfm?an=1&subarticlenbr=7>
Public health Example: Wisconsin Public Health Council: <http://publichealthcouncil.dhs.wi.gov/>
40
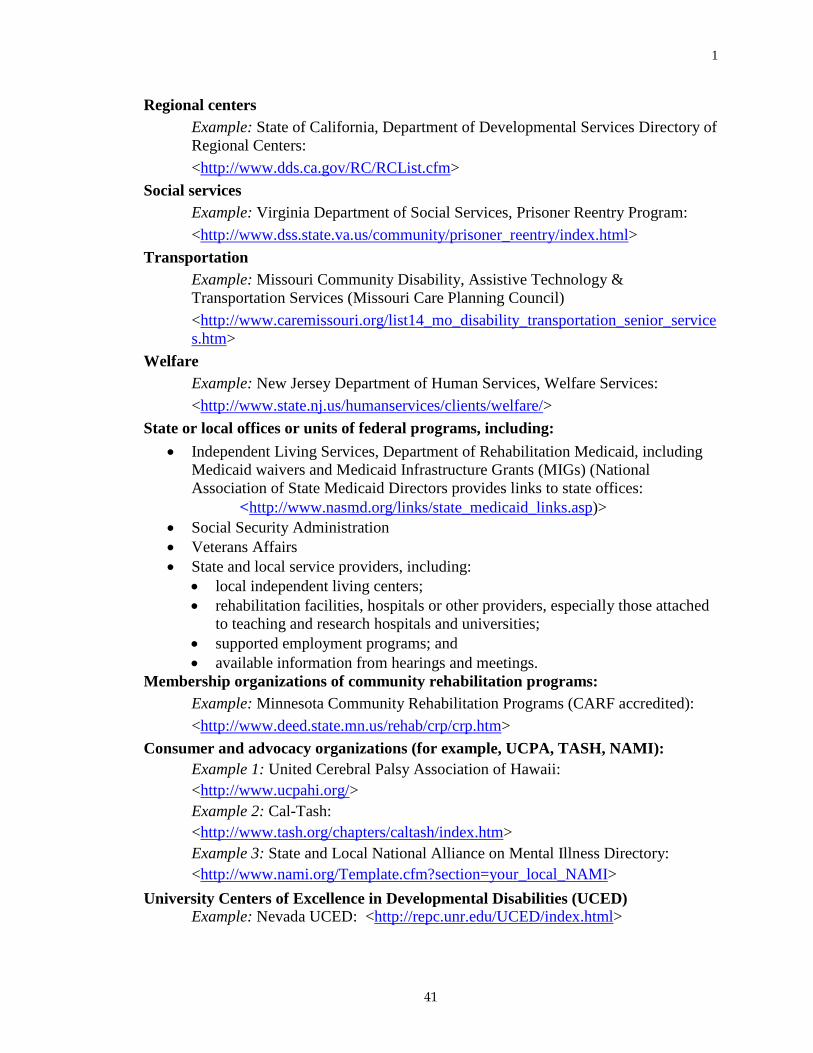
1
Regional centers Example: State of California, Department of Developmental Services Directory of Regional Centers: <http://www.dds.ca.gov/RC/RCList.cfm>
Social services Example: Virginia Department of Social Services, Prisoner Reentry Program: <http://www.dss.state.va.us/community/prisoner_reentry/index.html>
Transportation Example: Missouri Community Disability, Assistive Technology & Transportation Services (Missouri Care Planning Council) <http://www.caremissouri.org/list14_mo_disability_transportation_senior_services.htm>
Welfare Example: New Jersey Department of Human Services, Welfare Services: <http://www.state.nj.us/humanservices/clients/welfare/>
State or local offices or units of federal programs, including: • Independent Living Services, Department of Rehabilitation Medicaid, including
Medicaid waivers and Medicaid Infrastructure Grants (MIGs) (National Association of State Medicaid Directors provides links to state offices:
<http://www.nasmd.org/links/state_medicaid_links.asp)> • Social Security Administration • Veterans Affairs • State and local service providers, including:
• local independent living centers; • rehabilitation facilities, hospitals or other providers, especially those attached
to teaching and research hospitals and universities; • supported employment programs; and • available information from hearings and meetings.
Membership organizations of community rehabilitation programs: Example: Minnesota Community Rehabilitation Programs (CARF accredited): <http://www.deed.state.mn.us/rehab/crp/crp.htm>
Consumer and advocacy organizations (for example, UCPA, TASH, NAMI): Example 1: United Cerebral Palsy Association of Hawaii: <http://www.ucpahi.org/> Example 2: Cal-Tash: <http://www.tash.org/chapters/caltash/index.htm> Example 3: State and Local National Alliance on Mental Illness Directory: <http://www.nami.org/Template.cfm?section=your_local_NAMI>
University Centers of Excellence in Developmental Disabilities (UCED) Example: Nevada UCED: <http://repc.unr.edu/UCED/index.html>
41

Define Goals
Rehabilitation Research and Training Centers Example: Rehabilitation Research and Training Center on Workplace Supports and Job Retention at Virginia Commonwealth University: <http://www.worksupport.com/>
42

1
Exhibit 1.2 Data sources
Data Source Description Web Address American Community Survey (ACS) <http://factfinder.census.gov>
Table R1802 Disability ranking table <http://factfinder.census.gov/servlet/GRTTable?_bm=y&-_box_head_nbr=R1802&-ds_name=ACS_2007_1YR_G00_&-_lang=en&-format=US-30&-CONTEXT=grt>
Table S1801 Disability characteristics <http://factfinder.census.gov/servlet/STTable?_bm=y&-qr_name=ACS_2007_1YR_G00_S1801&-geo_id=01000US&-ds_name=ACS_2007_1YR_G00_&-state=st&-_lang=en&-format=> (US 2007 Table – change geography for state)
Table S1802 Selected characteristics for civilian non-institutionalized population by disability status
<http://factfinder.census.gov/servlet/STTable?_bm=y&-geo_id=01000US&-qr_name=ACS_2007_1YR_G00_S1802&-ds_name=ACS_2007_1YR_G00_&-_lang=en&-redoLog=false&-state=st&-format=&-CONTEXT=st> (US 2007 Table – change geography for state)
Tables C18020 and versions
A-I
Noninstitutionalized people with a disability and not employed, age 6-64, by race and ethnicity, by state
<http://factfinder.census.gov/servlet/DTGeoSearchByListServlet?ds_name=ACS_2007_1YR_G00_&state=dt&mt_name=ACS_2007_1YR_G2000_C18020&_lang=en&_ts=266419110891> (Insert state in geography)
Table S1601 Languages spoken at home; Speak English less than “very well”; languages other than English
<http://factfinder.census.gov/servlet/STTable?_bm=y&-geo_id=01000US&-qr_name=ACS_2007_1YR_G00_S1601&-ds_name=ACS_2007_1YR_G00_&-_lang=en&-redoLog=false&-state=st&-format=&-CONTEXT=st> (US 2007 Table – change geography for state)
43

Define Goals
Data Source Description Web Address Cornell Disability Statistics Center 2007 Disability Status Reports
<http://www.ilr.cornell.edu/edi/DisabilityStatistics/>
Disability Planning Data
Substate and state estimates of disability from the ACS; People in the labor force, not working
<http://www.disabilityplanningdata.com>
Current Population Survey (CPS) <http://www.census.gov/cps/> Employment status of civilian noninstitutional
population by sex, age, and disability status. <http://www.bls.gov/cps/cpsdisability.htm>
Current Population Reports Household Economics Studies P70-117 (Americans with Disabilities: 2005) and P70-73 (Americans with Disabilities: 1997
<http://www.census.gov/prod/www/abs/p70.html>
Bureau of Census Projections <http://www.census.gov/population/www/projections/index.html>
Summary Table B-1
Projected population by state showing projected population changes 2000-2030 by 5-year increments
<http://www.census.gov/population/www/projections/projectionsagesex.html>
State projections of ethnicity as available Bureau of Labor Statistics (BLS) <http://www.bls.gov/> Short- and long-term occupational projections
by state. <http://www.projectionscentral.com>
Unemployment rates by state, current and historical.
<http://data.bls.gov/map/servlet/map.servlet.MapToolServlet?survey=la>
Unemployment rates by county, current and historical.
<http://data.bls.gov/map/servlet/map.servlet.MapToolServlet?survey=la&map=county&seasonal=u>
44

1
Exhibit 1.3 Example state data from American Factfinder
United States and States R1802. Percent of People 21 to 64 Years Old With a Disability Universe: Civilian Noninstitutionalized Population 21 to 64 years Data Set: 2007 American Community Survey 1-Year Estimates Survey: American Community Survey, Puerto Rico Community Survey NOTE. For information on confidentiality protection, sampling error, nonsampling error, and definitions, see Survey Methodology. Rank State Percent Margin of Error 1 West Virginia 22.5 +/-0.7 2 Mississippi 20.0 +/-0.6 3 Kentucky 19.8 +/-0.5 4 Alabama 19.1 +/-0.5 4 Arkansas 19.1 +/-0.5 6 Oklahoma 17.4 +/-0.4 7 Maine 17.3 +/-0.6 8 Tennessee 16.8 +/-0.3 9 Louisiana 16.3 +/-0.4 10 South Carolina 15.4 +/-0.4 11 Missouri 15.3 +/-0.3 12 Alaska 14.7 +/-0.8 12 North Carolina 14.7 +/-0.3 14 Michigan 14.4 +/-0.2 14 New Mexico 14.4 +/-0.6 16 Ohio 14.2 +/-0.2 17 Oregon 14.1 +/-0.4 17 Washington 14.1 +/-0.3 19 Montana 14.0 +/-0.8 20 Rhode Island 13.9 +/-0.7 21 Vermont 13.8 +/-0.9 22 Pennsylvania 13.7 +/-0.2 23 Indiana 13.6 +/-0.3 23 Wyoming 13.6 +/-1.1 United States 12.8 +/-0.1 25 Georgia 12.8 +/-0.3 26 Idaho 12.6 +/-0.6 27 Delaware 12.3 +/-0.9 27 Kansas 12.3 +/-0.4 29 Florida 12.2 +/-0.2 29 Iowa 12.2 +/-0.4 29 Texas 12.2 +/-0.1 32 Arizona 12.1 +/-0.3 33 South Dakota 11.9 +/-0.6 34 District of Columbia 11.8 +/-0.9
45

Define Goals
Rank State Percent Margin of Error 35 Massachusetts 11.6 +/-0.3 35 Nebraska 11.6 +/-0.4 35 New York 11.6 +/-0.1 38 New Hampshire 11.5 +/-0.6 38 Wisconsin 11.5 +/-0.3 40 Virginia 11.3 +/-0.3 41 Nevada 11.2 +/-0.5 42 Maryland 11.0 +/-0.3 43 California 10.8 +/-0.1 44 Colorado 10.6 +/-0.3 45 Hawaii 10.5 +/-0.7 45 Utah 10.5 +/-0.4 47 Connecticut 10.4 +/-0.3 47 Illinois 10.4 +/-0.2 49 Minnesota 10.3 +/-0.2 50 North Dakota 10.1 +/-0.6 51 New Jersey 9.4 +/-0.2 Puerto Rico 24.4 +/-0.5
Source: U.S. Census Bureau, 2007 American Community Survey
Data are based on a sample and are subject to sampling variability. The degree of uncertainty for an estimate arising from sampling variability is represented through the use of a margin of error. The value shown here is the 90 percent margin of error. The margin of error can be interpreted roughly as providing a 90 percent probability that the interval defined by the estimate minus the margin of error and the estimate plus the margin of error (the lower and upper confidence bounds) contains the true value. In addition to sampling variability, the ACS estimates are subject to nonsampling error (for a discussion of nonsampling variability, see Accuracy of the Data). The effect of nonsampling error is not represented in these tables.
Notes:
While the 2007 American Community Survey (ACS) data generally reflect the December 2006 Office of Management and Budget (OMB) definitions of metropolitan and micropolitan statistical areas; in certain instances the names, codes, and boundaries of the principal cities shown in ACS tables may differ from the OMB definitions due to differences in the effective dates of the geographic entities. The 2007 Puerto Rico Community Survey (PRCS) data generally reflect the December 2005 Office of Management and Budget (OMB) definitions of metropolitan and micropolitan statistical areas; in certain instances the names, codes, and boundaries of the principal cities shown in PRCS tables may differ from the OMB definitions due to differences in the effective dates of the geographic entities.
Estimates of urban and rural population, housing units, and characteristics reflect boundaries of urban areas defined based on Census 2000 data. Boundaries for urban areas have not been updated since Census 2000. As a result, data for urban and rural areas from the ACS do not necessarily reflect the results of ongoing urbanization.
Explanation of Symbols:
1. An '**' entry in the margin of error column indicates that either no sample observations or too few sample observations were available to compute a standard error and thus the margin of error. A statistical test is not appropriate.
2. An '-' entry in the estimate column indicates that either no sample observations or too few sample observations were available to compute an estimate, or a ratio of medians cannot be calculated because one or both of the median estimates falls in the lowest interval or upper interval of an open-ended distribution.
46

1
3. An '-' following a median estimate means the median falls in the lowest interval of an open-ended distribution.
4. An '+' following a median estimate means the median falls in the upper interval of an open-ended distribution.
5. An '***' entry in the margin of error column indicates that the median falls in the lowest interval or upper interval of an open-ended distribution. A statistical test is not appropriate.
6. An '*****' entry in the margin of error column indicates that the estimate is controlled. A statistical test for sampling variability is not appropriate.
7. An 'N' entry in the estimate and margin of error columns indicates that data for this geographic area cannot be displayed because the number of sample cases is too small.
8. An '(X)' means that the estimate is not applicable or not available. Selected migration, earnings, and income data are not available for certain geographic areas due to problems with group quarters data collection and imputation. See Errata Note #44 for details.
Source: Downloaded July 22, 2007 from http://factfinder.census.gov/servlet/GRTTable?_bm=y&-_box_head_nbr=R1802&-ds_name=ACS_2007_1YR_G00_&-_lang=en&-format=US-30&-CONTEXT=grt
47

Define Goals
California S1801. Disability Characteristics Data Set: 2007 American Community Survey 1-Year Estimates Survey: American Community Survey NOTE. For information on confidentiality protection, sampling error, nonsampling error, and definitions, see Survey Methodology.
Subject Total Margin of
Error Male Margin of
Error Female Margin of
Error Population 5 years and over 33,321,461 +/-5,847 16,476,743 +/-7,960 16,844,718 +/-5,704 Without any disability 87.2% +/-0.1 88.0% +/-0.1 86.4% +/-0.1
With one type of disability 5.6% +/-0.1 5.6% +/-0.1 5.6% +/-0.1
With two or more types of disabilities 7.2% +/-0.1 6.4% +/-0.1 8.0% +/-0.1
Population 5 to 15 years 5,611,263 +/-9,418 2,876,584 +/-6,958 2,734,679 +/-6,775 With any disability 4.5% +/-0.1 5.6% +/-0.2 3.3% +/-0.2 With a sensory disability 0.9% +/-0.1 1.0% +/-0.1 0.9% +/-0.1
With a physical disability 1.0% +/-0.1 1.1% +/-0.1 0.9% +/-0.1
With a mental disability 3.5% +/-0.1 4.6% +/-0.2 2.4% +/-0.1 With a self-care disability 0.9% +/-0.1 1.0% +/-0.1 0.7% +/-0.1
Population 16 to 64 years 23,813,857 +/-10,948 11,929,485 +/-10,150 11,884,372 +/-7,561 With any disability 10.2% +/-0.1 10.0% +/-0.2 10.4% +/-0.1 With a sensory disability 2.2% +/-0.1 2.5% +/-0.1 1.9% +/-0.1
With a physical disability 5.9% +/-0.1 5.4% +/-0.1 6.4% +/-0.1
With a mental disability 4.0% +/-0.1 4.0% +/-0.1 4.0% +/-0.1 With a self-care disability 1.8% +/-0.1 1.6% +/-0.1 2.0% +/-0.1
With a go-outside-home disability 2.7% +/-0.1 2.4% +/-0.1 3.0% +/-0.1
With an employment disability 5.9% +/-0.1 5.7% +/-0.1 6.1% +/-0.1
Population 65 years and over 3,896,341 +/-4,037 1,670,674 +/-3,427 2,225,667 +/-3,483
With any disability 40.6% +/-0.4 36.9% +/-0.5 43.3% +/-0.5 With a sensory disability 16.1% +/-0.3 16.8% +/-0.5 15.6% +/-0.4
With a physical disability 31.1% +/-0.4 26.9% +/-0.5 34.3% +/-0.5
With a mental disability 13.7% +/-0.3 12.0% +/-0.4 15.0% +/-0.4 With a self-care disability 11.7% +/-0.3 8.9% +/-0.4 13.8% +/-0.4 With a go-outside-home disability 19.2% +/-0.3 13.9% +/-0.4 23.2% +/-0.4
EMPLOYMENT STATUS Population 16 to 64 years 23,813,857 +/-10,948 11,929,485 +/-10,150 11,884,372 +/-7,561 With any disability 2,433,477 +/-27,803 1,193,627 +/-18,965 1,239,850 +/-16,660 Employed 35.6% +/-0.6 38.6% +/-0.8 32.6% +/-0.7 With a sensory disability 516,541 +/-13,513 292,756 +/-9,684 223,785 +/-7,751
Employed 43.2% +/-1.4 47.9% +/-1.7 37.0% +/-1.6
With a physical disability 1,406,063 +/-18,402 647,990 +/-13,222 758,073 +/-13,456 Employed 31.9% +/-0.7 34.1% +/-1.2 30.0% +/-0.9
48

1
Subject Total Margin of
Error Male Margin of
Error Female Margin of
Error With a mental disability 962,122 +/-21,393 481,793 +/-13,039 480,329 +/-12,660 Employed 25.7% +/-0.8 27.8% +/-1.1 23.5% +/-1.0 With a self-care disability 431,012 +/-12,109 195,618 +/-7,514 235,394 +/-8,520
Employed 16.3% +/-1.0 17.6% +/-1.3 15.3% +/-1.5
With a go-outside-home disability 647,789 +/-15,010 288,947 +/-9,229 358,842 +/-10,458
Employed 15.8% +/-0.8 17.1% +/-1.3 14.8% +/-1.0
With an employment disability 1,402,053 +/-19,433 675,731 +/-13,295 726,322 +/-12,621
Employed 17.4% +/-0.6 18.4% +/-0.9 16.4% +/-0.7 No disability 21,380,380 +/-27,164 10,735,858 +/-18,065 10,644,522 +/-17,672
Employed 72.1% +/-0.2 79.3% +/-0.2 64.9% +/-0.3
POVERTY STATUS Population 5 years and over for whom a poverty status is determined
33,077,163 +/-8,479 16,363,056 +/-8,670 16,714,107 +/-7,445
With any disability 4,253,321 +/-33,297 1,963,997 +/-22,608 2,289,324 +/-22,263 Below poverty level 17.3% +/-0.3 16.2% +/-0.5 18.3% +/-0.4
With a sensory disability 1,195,648 +/-15,648 600,814 +/-10,823 594,834 +/-11,245
Below poverty level 15.2% +/-0.6 12.9% +/-0.8 17.4% +/-0.9 With a physical disability 2,673,372 +/-23,048 1,127,942 +/-16,520 1,545,430 +/-17,544
Below poverty level 16.5% +/-0.5 15.5% +/-0.6 17.3% +/-0.5
With a mental disability 1,683,865 +/-27,385 809,788 +/-15,025 874,077 +/-17,009 Below poverty level 21.7% +/-0.6 20.5% +/-0.9 22.8% +/-0.8 With a self-care disability 935,335 +/-17,662 373,168 +/-10,631 562,167 +/-11,938
Below poverty level 19.0% +/-0.8 19.1% +/-1.3 19.0% +/-1.0 No disability 28,823,842 +/-33,456 14,399,059 +/-22,937 14,424,783 +/-22,737 Below poverty level 11.1% +/-0.2 10.0% +/-0.2 12.3% +/-0.2
Population 16 years and over for whom a poverty status is determined
27,561,062 +/-10,125 13,534,933 +/-9,932 14,026,129 +/-8,394
With a go-outside-home disability 1,396,759 +/-20,360 520,856 +/-10,217 875,903 +/-15,925
Below poverty level 18.0% +/-0.6 17.5% +/-1.1 18.3% +/-0.7
Population 16 to 64 years for whom a poverty status is determined
23,664,721 +/-10,948 11,864,259 +/-10,122 11,800,462 +/-8,513
With an employment disability 1,400,984 +/-19,455 675,294 +/-13,328 725,690 +/-12,612 Below poverty level 24.7% +/-0.7 23.8% +/-1.0 25.5% +/-0.8
PERCENT IMPUTED With any disability 4.1% (X) (X) (X) (X) (X) With a sensory disability 2.7% (X) (X) (X) (X) (X)
With a physical disability 3.1% (X) (X) (X) (X) (X)
With a mental disability 2.5% (X) (X) (X) (X) (X) With a self-care disability 2.5% (X) (X) (X) (X) (X)
49

Define Goals
Subject Total Margin of
Error Male Margin of
Error Female Margin of
Error With a go-outside-home disability 2.5% (X) (X) (X) (X) (X)
With an employment disability 2.6% (X) (X) (X) (X) (X) Source: U.S. Census Bureau, 2007 American Community Survey
Data are based on a sample and are subject to sampling variability. The degree of uncertainty for an estimate arising from sampling variability is represented through the use of a margin of error. The value shown here is the 90 percent margin of error. The margin of error can be interpreted roughly as providing a 90 percent probability that the interval defined by the estimate minus the margin of error and the estimate plus the margin of error (the lower and upper confidence bounds) contains the true value. In addition to sampling variability, the ACS estimates are subject to nonsampling error (for a discussion of nonsampling variability, see Accuracy of the Data). The effect of nonsampling error is not represented in these tables.
Notes:
While the 2007 American Community Survey (ACS) data generally reflect the December 2006 Office of Management and Budget (OMB) definitions of metropolitan and micropolitan statistical areas; in certain instances the names, codes, and boundaries of the principal cities shown in ACS tables may differ from the OMB definitions due to differences in the effective dates of the geographic entities. The 2007 Puerto Rico Community Survey (PRCS) data generally reflect the December 2005 Office of Management and Budget (OMB) definitions of metropolitan and micropolitan statistical areas; in certain instances the names, codes, and boundaries of the principal cities shown in PRCS tables may differ from the OMB definitions due to differences in the effective dates of the geographic entities.
Estimates of urban and rural population, housing units, and characteristics reflect boundaries of urban areas defined based on Census 2000 data. Boundaries for urban areas have not been updated since Census 2000. As a result, data for urban and rural areas from the ACS do not necessarily reflect the results of ongoing urbanization.
Explanation of Symbols:
1. An '**' entry in the margin of error column indicates that either no sample observations or too few sample observations were available to compute a standard error and thus the margin of error. A statistical test is not appropriate.
2. An '-' entry in the estimate column indicates that either no sample observations or too few sample observations were available to compute an estimate, or a ratio of medians cannot be calculated because one or both of the median estimates falls in the lowest interval or upper interval of an open-ended distribution.
3. An '-' following a median estimate means the median falls in the lowest interval of an open-ended distribution.
4. An '+' following a median estimate means the median falls in the upper interval of an open-ended distribution.
5. An '***' entry in the margin of error column indicates that the median falls in the lowest interval or upper interval of an open-ended distribution. A statistical test is not appropriate.
6. An '*****' entry in the margin of error column indicates that the estimate is controlled. A statistical test for sampling variability is not appropriate.
7. An 'N' entry in the estimate and margin of error columns indicates that data for this geographic area cannot be displayed because the number of sample cases is too small.
8. An '(X)' means that the estimate is not applicable or not available. Selected migration, earnings, and income data are not available for certain geographic areas due to problems with group quarters data collection and imputation. See Errata Note #44 for details.
Source: Downloaded July 22, 2007 from http://factfinder.census.gov/servlet/STTable?_bm=y&-state=st&-context=st&-qr_name=ACS_2007_1YR_G00_S1801&-ds_name=ACS_2007_1YR_G00_&-tree_id=307&-redoLog=true&-_caller=geoselect&-geo_id=04000US06&-format=&-_lang=en
50

1
California S1802. Selected Economic Characteristics for the Civilian Noninstitutionalized Population By Disability Status Data Set: 2007 American Community Survey 1-Year Estimates Survey: American Community Survey NOTE. For information on confidentiality protection, sampling error, nonsampling error, and definitions, see Survey Methodology.
Subject
Total Civilian Noninstitutionalized
Population Margin of
Error With a
Disability Margin of
Error No
Disability Margin of
Error Population Age 16 and Over 27,710,198 +/-10,125 4,015,041 +/-33,579 23,695,157 +/-32,215
EMPLOYMENT STATUS Employed 60.8% +/-0.2 24.0% +/-0.4 67.1% +/-0.1 Not in Labor Force 34.8% +/-0.2 72.4% +/-0.4 28.5% +/-0.1 Employed Population Age 16 and Over 16,857,400 +/-43,253 962,499 +/-18,160 15,894,901 +/-41,285
CLASS OF WORKER Private for-profit wage and salary workers 70.9% +/-0.2 63.5% +/-0.9 71.3% +/-0.2
Employee of private company workers 67.6% +/-0.2 60.5% +/-0.9 68.0% +/-0.2
Self-employed in own incorporated business workers
3.3% +/-0.1 3.0% +/-0.3 3.3% +/-0.1
Private not-for-profit wage and salary workers 5.9% +/-0.1 7.2% +/-0.4 5.8% +/-0.1
Local government workers 8.4% +/-0.1 9.8% +/-0.5 8.3% +/-0.1
State government workers 3.7% +/-0.1 4.7% +/-0.4 3.7% +/-0.1 Federal government workers 2.0% +/-0.1 2.6% +/-0.2 2.0% +/-0.1
Self-employed in own not incorporated business workers
8.9% +/-0.1 11.8% +/-0.6 8.7% +/-0.1
Unpaid family workers 0.2% +/-0.1 0.4% +/-0.1 0.2% +/-0.1 OCCUPATION Management, professional, and related occupations
35.5% +/-0.2 29.1% +/-0.7 35.8% +/-0.2
Service occupations 17.1% +/-0.1 21.9% +/-0.7 16.8% +/-0.2 Sales and office occupations 25.6% +/-0.2 26.8% +/-0.6 25.5% +/-0.2
Farming, fishing, and forestry occupations 1.4% +/-0.1 1.2% +/-0.2 1.5% +/-0.1
Construction, extraction, maintenance, and repair occupations
9.2% +/-0.1 8.9% +/-0.5 9.2% +/-0.2
51

Define Goals
Subject
Total Civilian Noninstitutionalized
Population Margin of
Error With a
Disability Margin of
Error No
Disability Margin of
Error Production, transportation, and material moving occupations
11.2% +/-0.1 12.1% +/-0.5 11.2% +/-0.1
INDUSTRY Agriculture, forestry, fishing and hunting, and mining
2.0% +/-0.1 1.9% +/-0.2 2.1% +/-0.1
Construction 7.9% +/-0.1 6.8% +/-0.4 7.9% +/-0.2 Manufacturing 10.4% +/-0.2 8.6% +/-0.5 10.5% +/-0.2 Wholesale trade 3.4% +/-0.1 3.0% +/-0.3 3.5% +/-0.1 Retail trade 11.0% +/-0.2 11.6% +/-0.6 11.0% +/-0.2 Transportation and warehousing, and utilities 4.8% +/-0.1 5.1% +/-0.4 4.8% +/-0.1
Information 3.1% +/-0.1 2.5% +/-0.3 3.2% +/-0.1 Finance and insurance, and real estate and rental and leasing
7.4% +/-0.1 6.6% +/-0.5 7.5% +/-0.1
Professional, scientific, and management, and administrative and waste management services
12.2% +/-0.1 11.7% +/-0.6 12.2% +/-0.2
Educational services, and health care and social assistance
19.0% +/-0.1 22.0% +/-0.8 18.8% +/-0.2
Arts, entertainment, and recreation, and accommodation and food services
9.2% +/-0.1 9.0% +/-0.5 9.2% +/-0.1
Other services (except public administration) 5.1% +/-0.1 6.2% +/-0.4 5.1% +/-0.1
Public administration 4.5% +/-0.1 5.0% +/-0.4 4.4% +/-0.1 COMMUTING TO WORK Workers Age 16 and Over 16,286,258 +/-42,944 870,844 +/-17,803 15,415,414 +/-41,164
Car, truck, or van - drove alone 73.3% +/-0.2 66.7% +/-0.9 73.7% +/-0.2
Car, truck, or van - carpooled 11.9% +/-0.2 12.9% +/-0.7 11.8% +/-0.2
Public transportation (excluding taxicab) 5.2% +/-0.1 6.9% +/-0.5 5.1% +/-0.1
Walked 2.7% +/-0.1 3.2% +/-0.4 2.7% +/-0.1 Taxicab, motorcycle, bicycle, or other means 2.2% +/-0.1 2.8% +/-0.3 2.2% +/-0.1
Worked at home 4.7% +/-0.1 7.5% +/-0.4 4.6% +/-0.1
52

1
Subject
Total Civilian Noninstitutionalized
Population Margin of
Error With a
Disability Margin of
Error No
Disability Margin of
Error EDUCATIONAL ATTAINMENT Population Age 25 and Over 22,912,237 +/-8,170 3,756,295 +/-30,430 19,155,942 +/-30,850
Less than high school graduate 19.5% +/-0.2 29.7% +/-0.4 17.6% +/-0.2
High school graduate (includes equivalency) 22.9% +/-0.2 27.3% +/-0.3 22.1% +/-0.2
Some college or associate's degree 27.7% +/-0.2 27.2% +/-0.4 27.8% +/-0.2
Bachelor's degree or higher 29.8% +/-0.2 15.9% +/-0.3 32.6% +/-0.2
EARNINGS IN PAST 12 MONTHS (IN 2007 INFLATION ADJUSTED DOLLARS) Population Age 16 and over with earnings 19,046,364 +/-40,276 1,235,423 +/-20,539 17,810,941 +/-37,483
$1 to $9,999 or loss 17.8% +/-0.2 29.5% +/-0.7 17.0% +/-0.2 $10,000 to $14,999 8.6% +/-0.1 10.2% +/-0.5 8.5% +/-0.1 $15,000 to $24,999 16.1% +/-0.2 16.0% +/-0.6 16.1% +/-0.2 $25,000 to $34,999 12.6% +/-0.1 11.5% +/-0.4 12.7% +/-0.2 $35,000 to $49,999 14.2% +/-0.1 12.3% +/-0.5 14.3% +/-0.1 $50,000 to $74,999 14.8% +/-0.2 11.4% +/-0.5 15.0% +/-0.2 $75,000 or more 16.0% +/-0.1 9.1% +/-0.5 16.5% +/-0.1 Median Earnings 30,788 +/-92 21,111 +/-398 31,277 +/-94 POVERTY STATUS IN THE PAST 12 MONTHS Population Age 16 and over for whom poverty status is determined
27,561,062 +/-10,125 4,007,692 +/-33,282 23,553,370 +/-31,972
Below 100 percent of the poverty level 10.9% +/-0.1 17.0% +/-0.3 9.9% +/-0.1
100 to 149 percent of the poverty level 8.9% +/-0.1 14.8% +/-0.3 7.9% +/-0.1
At or above 150 percent of the poverty level 80.2% +/-0.2 68.2% +/-0.4 82.2% +/-0.2
Source: U.S. Census Bureau, 2007 American Community Survey
Data are based on a sample and are subject to sampling variability. The degree of uncertainty for an estimate arising from sampling variability is represented through the use of a margin of error. The value shown here is the 90 percent margin of error. The margin of error can be interpreted roughly as providing a 90 percent probability that the interval defined by the estimate minus the margin of error and the estimate plus the margin of error (the lower and upper confidence bounds) contains the true value. In addition to sampling variability, the ACS estimates are subject to nonsampling error (for a discussion of nonsampling variability, see Accuracy of the Data). The effect of nonsampling error is not represented in these tables.
Notes:
Occupation codes are 4-digit codes and are based on Standard Occupational Classification 2000.
Industry codes are 4-digit codes and are based on the North American Industry Classification System 2002. However, the Industry categories adhere to the guidelines issued in Clarification Memorandum No. 2,
53

Define Goals
"NAICS Alternate Aggregation Structure for Use By U.S. Statistical Agencies," issued by the Office of Management and Budget.
While the 2007 American Community Survey (ACS) data generally reflect the December 2006 Office of Management and Budget (OMB) definitions of metropolitan and micropolitan statistical areas; in certain instances the names, codes, and boundaries of the principal cities shown in ACS tables may differ from the OMB definitions due to differences in the effective dates of the geographic entities. The 2007 Puerto Rico Community Survey (PRCS) data generally reflect the December 2005 Office of Management and Budget (OMB) definitions of metropolitan and micropolitan statistical areas; in certain instances the names, codes, and boundaries of the principal cities shown in PRCS tables may differ from the OMB definitions due to differences in the effective dates of the geographic entities.
Estimates of urban and rural population, housing units, and characteristics reflect boundaries of urban areas defined based on Census 2000 data. Boundaries for urban areas have not been updated since Census 2000. As a result, data for urban and rural areas from the ACS do not necessarily reflect the results of ongoing urbanization.
Explanation of Symbols:
1. An '**' entry in the margin of error column indicates that either no sample observations or too few sample observations were available to compute a standard error and thus the margin of error. A statistical test is not appropriate.
2. An '-' entry in the estimate column indicates that either no sample observations or too few sample observations were available to compute an estimate, or a ratio of medians cannot be calculated because one or both of the median estimates falls in the lowest interval or upper interval of an open-ended distribution.
3. An '-' following a median estimate means the median falls in the lowest interval of an open-ended distribution.
4. An '+' following a median estimate means the median falls in the upper interval of an open-ended distribution.
5. An '***' entry in the margin of error column indicates that the median falls in the lowest interval or upper interval of an open-ended distribution. A statistical test is not appropriate.
6. An '*****' entry in the margin of error column indicates that the estimate is controlled. A statistical test for sampling variability is not appropriate.
7. An 'N' entry in the estimate and margin of error columns indicates that data for this geographic area cannot be displayed because the number of sample cases is too small.
8. An '(X)' means that the estimate is not applicable or not available. Selected migration, earnings, and income data are not available for certain geographic areas due to problems with group quarters data collection and imputation. See Errata Note #44 for details.
Source: Downloaded July 22, 2007 from http://factfinder.census.gov/servlet/STTable?_bm=y&-state=st&-context=st&-qr_name=ACS_2007_1YR_G00_S1802&-ds_name=ACS_2007_1YR_G00_&-CONTEXT=st&-tree_id=307&-redoLog=false&-geo_id=04000US06&-format=&-_lang=en
54

1
California S1601. Language Spoken at Home Data Set: 2007 American Community Survey 1-Year Estimates Survey: American Community Survey NOTE. For information on confidentiality protection, sampling error, nonsampling error, and definitions, see Survey Methodology.
Subject Total Margin of
Error
Percent of specified language speakers
Speak English
"very well" Margin of
Error
Speak English less than "very
well" Margin of
Error Population 5 years and over 33,891,325 +/-3,050 80.0% +/-0.1 20.0% +/-0.1 Speak only English 57.4% +/-0.2 (X) (X) (X) (X) Speak a language other than English 42.6% +/-0.2 53.2% +/-0.3 46.8% +/-0.3
Spanish or Spanish Creole 28.5% +/-0.1 51.4% +/-0.4 48.6% +/-0.4 Other Indo-European languages 4.2% +/-0.1 67.1% +/-0.9 32.9% +/-0.9
Asian and Pacific Island languages 9.1% +/-0.1 50.8% +/-0.5 49.2% +/-0.5
Other languages 0.8% +/-0.1 69.6% +/-2.0 30.4% +/-2.0 SPEAK A LANGUAGE OTHER THAN ENGLISH Spanish or Spanish Creole 9,664,383 +/-41,745 51.4% +/-0.4 48.6% +/-0.4 5-17 years 2,378,787 +/-19,423 75.0% +/-0.6 25.0% +/-0.6 18-64 years 6,677,625 +/-29,916 44.4% +/-0.4 55.6% +/-0.4 65 years and over 607,971 +/-6,667 35.4% +/-1.3 64.6% +/-1.3 Other Indo-European languages 1,426,198 +/-26,839 67.1% +/-0.9 32.9% +/-0.9
5-17 years 179,613 +/-7,653 84.4% +/-1.9 15.6% +/-1.9 18-64 years 994,079 +/-21,139 69.3% +/-0.9 30.7% +/-0.9 65 years and over 252,506 +/-8,530 46.2% +/-1.8 53.8% +/-1.8 Asian and Pacific Island languages 3,067,533 +/-25,728 50.8% +/-0.5 49.2% +/-0.5
5-17 years 392,824 +/-11,537 72.3% +/-1.4 27.7% +/-1.4 18-64 years 2,243,229 +/-18,092 52.0% +/-0.7 48.0% +/-0.7 65 years and over 431,480 +/-5,614 25.1% +/-1.1 74.9% +/-1.1 Other languages 283,537 +/-16,329 69.6% +/-2.0 30.4% +/-2.0 5-17 years 47,487 +/-6,476 86.6% +/-3.5 13.4% +/-3.5 18-64 years 206,771 +/-11,114 69.5% +/-2.1 30.5% +/-2.1 65 years and over 29,279 +/-3,386 42.2% +/-5.2 57.8% +/-5.2 PERCENT IMPUTED Language status 2.3% (X) (X) (X) (X) (X) Language status (speak a language other than English) 2.1% (X) (X) (X) (X) (X)
Ability to speak English 2.8% (X) (X) (X) (X) (X)
Source: U.S. Census Bureau, 2007 American Community Survey
55

Define Goals
Data are based on a sample and are subject to sampling variability. The degree of uncertainty for an estimate arising from sampling variability is represented through the use of a margin of error. The value shown here is the 90 percent margin of error. The margin of error can be interpreted roughly as providing a 90 percent probability that the interval defined by the estimate minus the margin of error and the estimate plus the margin of error (the lower and upper confidence bounds) contains the true value. In addition to sampling variability, the ACS estimates are subject to nonsampling error (for a discussion of nonsampling variability, see Accuracy of the Data). The effect of nonsampling error is not represented in these tables.
Notes:
While the 2007 American Community Survey (ACS) data generally reflect the December 2006 Office of Management and Budget (OMB) definitions of metropolitan and micropolitan statistical areas; in certain instances the names, codes, and boundaries of the principal cities shown in ACS tables may differ from the OMB definitions due to differences in the effective dates of the geographic entities. The 2007 Puerto Rico Community Survey (PRCS) data generally reflect the December 2005 Office of Management and Budget (OMB) definitions of metropolitan and micropolitan statistical areas; in certain instances the names, codes, and boundaries of the principal cities shown in PRCS tables may differ from the OMB definitions due to differences in the effective dates of the geographic entities.
Estimates of urban and rural population, housing units, and characteristics reflect boundaries of urban areas defined based on Census 2000 data. Boundaries for urban areas have not been updated since Census 2000. As a result, data for urban and rural areas from the ACS do not necessarily reflect the results of ongoing urbanization.
Explanation of Symbols:
1. An '**' entry in the margin of error column indicates that either no sample observations or too few sample observations were available to compute a standard error and thus the margin of error. A statistical test is not appropriate.
2. An '-' entry in the estimate column indicates that either no sample observations or too few sample observations were available to compute an estimate, or a ratio of medians cannot be calculated because one or both of the median estimates falls in the lowest interval or upper interval of an open-ended distribution.
3. An '-' following a median estimate means the median falls in the lowest interval of an open-ended distribution.
4. An '+' following a median estimate means the median falls in the upper interval of an open-ended distribution.
5. An '***' entry in the margin of error column indicates that the median falls in the lowest interval or upper interval of an open-ended distribution. A statistical test is not appropriate.
6. An '*****' entry in the margin of error column indicates that the estimate is controlled. A statistical test for sampling variability is not appropriate.
7. An 'N' entry in the estimate and margin of error columns indicates that data for this geographic area cannot be displayed because the number of sample cases is too small.
8. An '(X)' means that the estimate is not applicable or not available. Selected migration, earnings, and income data are not available for certain geographic areas due to problems with group quarters data collection and imputation. See Errata Note #44 for details.
Source: Downloaded July 22, 2007 from http://factfinder.census.gov/servlet/STTable?_bm=y&-state=st&-context=st&-qr_name=ACS_2007_1YR_G00_S1601&-ds_name=ACS_2007_1YR_G00_&-CONTEXT=st&-tree_id=307&-redoLog=false&-geo_id=04000US06&-format=&-_lang=en
56

1
Exhibit 1.4 Example table comparing minority populations from ACS state disability data and state VR agency data
State’s ACS 2007
Percentage of people with a disability and not
employed Current VR consumers
FY2007
Total (16 – 64 years) 103,720 100.0% 9,025 100.0%
Race (16 years – 64 years)
White 63,477 61.2% 5,081 56.3%
African American 11,409 11.0% 957 10.6%
Asian/Pacific Islander 8,920 8.6% 1,056 11.7%
American Indian/Alaska Native
1,763 1.7% 171 1.9%
Some other race(s) 14,106 13.6% 1,354 15.0%
Two or more races 4,045 3.9% 406 4.5%
Hispanic 29,975 28.9% 2,915 32.3% Source: Developed from ACS Tables C18020 – versions A through I and state agency VR caseload data NOTE: Actual data in table are for example purposes only.
57

Define Goals
Exhibit 1.5 Example list of agencies/organizations with potential information
Federal/National
• Centers for Disease Control
• Membership organizations of community rehabilitation programs
• Consumer and advocacy organizations (e.g., UCPA, TASH, NAMI)
• National Core Indicators
State
• Developmental Disabilities Councils 5-year strategic State Plan
• State Departments of Mental Health state-specific information about the population with severe mental illness
• State Department of Intellectual (or Developmental) Disabilities
• State Traumatic Brain Injury (TBI) offices or registries information about the prevalence of TBI
• Workforce Investment Board state-level reports
• State Departments of Health and Human Services
• State Departments of Economic Development
• State Departments of Labor
58

2
Step 2: Developing CSNA plan for information and dissemination
The objective of Step 2 is to generate a plan with an approach, time, and costs for performing all steps of the CSNA, including dissemination. At the end of Step 2, the following products should be completed.
Task Product
Step 2: Developing CSNA plan for information and dissemination
2.1 Develop work plan, timeline, and resources
The CSNA work plan, timeline, and resource estimate
2.2 Develop the dissemination plan The plan for dissemination of the CSNA process and results
2.1 Developing the CSNA work plan, timeline, and resource estimate
Using the information goals defined in Step 1, develop the plan to conduct the needs assessment. This includes identifying the specific information needed - both quantitative and qualitative. The plan will also cover the data analysis, conclusions, and informing the State Plan steps (Steps 3-6). Accompanying the plan, staffing needs will be identified along with any need for external expertise, and the overall cost estimating.
Exhibit 2.1 shows the relationship of information goals to information collection strategies. Use Exhibit 2.1 as a guide to design information collection methods that will make up the comprehensive statewide needs assessment approach.
For example, Exhibit 2.1 contains an “x” in the box for Needs of Minorities and Population Projections. This indicates a review of population projection data for minorities is suggested and, therefore, should be included in the planning. Similarly, an “x” in the box for Needs of Individuals Other Than Minorities Who are Unserved or Underserved and Stakeholder Input suggests the need for data collection from stakeholders about this goal. In the first example, the data collection may be simple, especially since preliminary data have been collected in Step 1. However, in the second example, the plan must take into account the kinds of stakeholders from whom information will be gathered (e.g., focus groups or key informants), how many stakeholder collection “events” there should be (e.g., if focus groups, how many groups and how many people per group?), and where the “events” may take place (e.g., will there be focus groups all around the state? in urban areas? in rural areas?).
Specify work plan for Steps 3-6. Identify specific data and study sources and collection methods to be used for Step 3 data collection in each of the information strategies, especially the stakeholder input. Plan for Step 4 analysis, Step 5 developing conclusions,
59

Develop plans
and Step 6 informing the State Plan. The detail of each step’s activities is provided later in this Guide. Review those activities prior to planning each Step, as choices such as the number of focus groups or hearings, and options for conducting surveys will affect the planning in terms of time, staff needed, and costs.
Planning for skills and extra costs. To accomplish each activity, specialized skills are required and extra costs may need to be considered. Exhibit 2.2 provides a list of skills and experience needed for each task as well as other costs to be considered.
Estimate staffing. Identify staff skills needed and available. Create a personloading chart. The plan is not complete without a sense of the personnel time to be devoted to the effort. Whether this is done by in-house staff or by contractors, this personnel estimation will be the most major cost element of the CSNA. How the CSNA is structured over time (e.g., a step done in each of the three years, all steps done in one year, etc.) will have a large impact on the intensity of the personnel need. In Exhibit 2.3, an example personloading chart is provided. A more detailed version should be done by each step once the plans are more specified.
Establish a timeline for Steps 3-6. There are two options to produce the CSNA for RSA: 1) once every three years or 2) a portion of the CSNA every year, such that a complete CSNA is achieved every three years. The length of the timeline offers a variety of options for carrying out the CSNA, such as to focus on participants one year and providers the next.
Determine the timeline for each activity in each step, paying attention to making sure the time does not conflict with the amount of person hours called for in the personloading chart. Example timelines for one and three year cycles are shown in Exhibits 2.4a and 2.4b.
2.2 Developing the specific plan for dissemination
Disseminating CSNA findings is an opportunity to reach out to organizations and agencies to assure continuous stakeholder input in the needs assessment implementation process, nurture long-term collaborations, and establish new and mutually beneficial connections with national, state, and local service providers and organizations. It also is important in providing outcomes and feedback to those who have participated. The dissemination will involve both VR and SRC staff.
Determine the objectives and goals of dissemination, and the potential barriers to each. Articulate the desired ends of the dissemination process as part of the needs assessment plan.
60

2
The recipients of the dissemination need to be identified. In particular, anyone who participates in the input or can use the assessment would be a appropriate recipient of any dissemination. These parties include:
• VR clients;
• potential VR clients (unserved or underserved people with disabilities);
• VR counselors;
• state and local organizations and agencies; and
• service providers.
Each audience may need to know different aspects of the needs assessment and should be informed in ways likely to be most relevant to them. Piloting the work products among various target audiences prior to full release can yield helpful feedback.
Determine how and where the findings will be disseminated. Materials need to be delivered to all possible locations where people with a need for the findings—as well as people who can spread the word to others who can benefit from the information—may be living or working. Some examples of distribution strategies include the following:
• web site posting;
• delivering reports to VR offices and One-Stop Centers;
• mailing findings to each agency and organization that provided a data source used in the assessment; and
• E-mailing personal contacts and network members an executive summary.
Determine dissemination costs. Costs for printing, creating Web content, mailing, and personnel hours to complete dissemination tasks need to be estimated and budgeted over the dissemination time frame.
61

Develop plans
Exhibit 2.1 Information Strategies in the Model CSNA
1 2 3 4 5 6 7
Popu
latio
n st
atis
tics
Popu
latio
n es
timat
es
Popu
latio
n pr
ojec
tions
&
econ
omic
fore
cast
s
VR
age
ncy
data
&
info
rmat
ion
reso
urce
s
Stat
e le
vel d
ata
from
fe
dera
l sou
rces
Stat
e/lo
cal d
ata
& re
ports
St
akeh
olde
r inp
ut: f
ocus
gr
oups
, sur
veys
, in
terv
iew
s, he
arin
gs
Rehabilitation needs of individuals with disabilities x x x x x x x
Needs of individuals with most significant disabilities x x x x x x
Need for supported employment x x x x x
Needs of minorities x x x x x x x
Needs of individuals other than minority who are unserved or underserved
x x x x x x
Needs of individuals served through other parts of statewide workforce investment system
x x x x
Need to establish, develop or improve CRPs x x x
62

2
Exhibit 2.2 Skills and Costs
Step Skills and experience needed Other costs to plan for
Overall Project management Consultants/contractors, as needed (depends on skills in VR/SRC team)
Experience with needs assessments
State plan development
2
Study design Planning and budgeting
Public announcements, dissemination
3 Data search skills Meeting costs (e.g., focus group incentive fees, travel) Meeting accessibility (e.g., sign language interpretation, translation)
Literature search skills
Survey design
Survey administration
Focus group facilitation
Phone interviewing
Conducting public hearings
4 Quantitative analysis
Qualitative analysis
Mixed method analysis Cross cutting analysis
5 Development of action strategies Publication costs, including accessible
materials
Writing, production Distribution costs
6 Meeting facilitation
Consensus-building skills
63

Develop plans
Exhibit 2.3 Example Personloading
Step Management Instrument
design Information
collection Analysis Writing/ Editing
1 xx % FTE
2 xx % FTE
3 xx % FTE xx % FTE xx % FTE
4 xx % FTE xx % FTE xx % FTE
5 xx % FTE xx % FTE
6 xx % FTE xx % FTE
Exhibit 2.4a Time Line (One-Year Cycle Example)
Step
Month
1 2 3 4 5 6 7 8 9 10 11 12
1 x x
2 x x
3 x x x x x x
4 x x
5 x x
6 x x
Exhibit 2.4b Time Line (Three-Year Cycle Example)
Step
Month
1-3
4-6
7-9
10-12
13-15
16-18
19-21
22-24
25-27
28-30
31-33
34-36
1 x
2 x
3 x x x x
4 x x x
5 x x
6 x x
64

3
Step 3: Gathering the information
The objective of Step 3 is to generate information collection results for each information strategy. At the end of Step 3, the following products should be completed.
Task Product
Step 3: Gathering the information
3.1 Obtain secondary data Secondary data findings
3.2 Survey VR counselors VR Counselor survey results
3.3 Survey VR consumers VR Consumer survey results
3.4 Focus groups Focus group transcripts
3.5 Key informant interviews Key informant interview record
3.6 Community hearings Community hearing record
3.1 Obtain Secondary data
Several categories of data sources are noted in this Guide. Obviously, not all applicable data and reports can be included, and provided lists are not intended to be exhaustive; resources shown are known to be reliable and current. Appendices A-E describe the sources in greater detail.
Useful secondary data sources
Population Statistics - Statistics show current numbers and percentages of people in many categories, including age, sex, race, geographic location, employment, and health and disability status. Values are based on actual survey data collection. The main resources are the American Community Survey (ACS), the Current Population Survey (CPS), and the Behavioral Risk Factor Surveillance Survey (BRFSS). See Exhibit 3.1 for specific information.
Disability Population State Estimates. Estimates use mathematical techniques applied to survey and census data to approximate the number of people with disabilities and are generated when extant data do not provide these measures. See Exhibit 3.1 for specific information.
Population Projections and Economic Forecasts. Projections and forecasts use mathematical techniques to estimate specific values in the future. Because predicting anything necessarily requires making assumptions about rates of change that may or may not come to pass, accuracy may vary. Some projections include high, middle, and low
65

Gather information
values to account for different scenarios that are likely to occur. In general, projections far into the future—for example, population projections for the year 2030—are less accurate than those made with a shorter time horizon. Sources are State Projections that use U.S. Census Data and Bureau of Labor Statistics (BLS) Labor and Economic Forecasts. See Exhibit 3.1 for specific information.
VR Agency Data and Information. These data provide detailed information on VR consumers, including disability and other demographic characteristics, types of services received and their costs, and employment status. Comparing VR client demographic profiles with the state’s aggregate demographic profile can help with identifying groups of individuals with disabilities who are unserved or underserved and their demographic and socioeconomic characteristics. See Exhibit 3.1 for specific information.
State Level Data from Federal Sources. These data come from national programs that collect and distribute administrative, state-level data about program recipients with disabilities. Statistics include education patterns and graduation rates among people with disabilities, recipients of Social Security disability benefits, and employment and job retention patterns. These findings are germane to the CSNA, and are uniform from state to state. See Exhibit 3.1 for specific information.
State/Local Data & Reports. There is a vast array of state and local information sources, including organizations focusing on the needs of individuals with specific disabilities, and administrative agencies who serve people with disabilities. Topics, timeliness, and data quality will naturally vary from state to state and over time, but CSNA teams should be aware of as many nearby resources as possible. Service provided and unmet needs at the state and local levels can often be identified by reviewing subnational materials.
Obtaining data from sources
Collecting secondary data. Pre-identified disability tables and reports are easy to acquire and review, allowing for rapid development of a working knowledge base and general summary (some may have been collected in Step 1). Additional statistical materials about which a state’s CSNA team is aware should be included as well. As information is reviewed, significant trends and gaps should be noted as topics for further analysis.
Beyond the pre-identified tables, a review of the sources and Web sites noted in the Exhibit 3.1 may reveal additional relevant resources. Some data sets, such as those available from American FactFinder, allow the user to enter specific parameters, such as a geographic region, a series of data years for trend studies, or particular variables. When downloading tables or other materials note the Web page on each file saved or printed and the date the Web site was accessed.
66

3
Obtain relevant reports for basic information. Locate current and past needs assessments, labor and economic reports, VR publications, readily available committee reports and hearing summaries or transcripts, staff surveys, SRC reports, State Plans, budgets, and related background materials for quick appraisal of the status quo within the state. Use Exhibit 3.1 along with the list of agencies developed in Step 1 to search for relevant reports. For each report:
• identify any additional VR services identified as important for people to achieve their VR goals that are mentioned in reports and organize by information goal;
• identify barriers to VR services for specific groups and organize by information goal (e.g., “report found that lack of medication monitoring led to consumers with psychiatric disabilities dropping out of VR system” would be included as a barrier under the “most significant disability” information goal);
• identify findings related to service capacity (e.g., services not available but identified as valuable; services not available because providers working at capacity); and
• identify any other issues or themes.
Exhibit 3.2 is a form that can be used to summarize information from reports that will then be useful in Step 4.
3.2 Survey VR counselors
Counselors are the key source of information on served groups and on the availability of CRPs. Since there is a potential for input from a large majority or perhaps all counselors, a survey is recommended. For general information on surveys please see Appendix G. Texts from publishers such as Sage Publications have detailed information on sampling, survey methods, question development, survey techniques, data collection, and/or data analysis (http://www.sagepub.com/allSageSearch.nav?&_requestid=545946).
Identify the sample. If it is not possible to survey all counselors, a second choice would be to select a sample randomly. In sampling, consider whether it is important to stratify the sample, such as for experience with a particular consumer population with needs specified in the CSNA goals or for a large region.
Choose a method. Mail, email, or Web-based surveys are all possible methods for delivering the survey. Specific information about methods of surveying is provided in more detail in Appendix G (more detail, if needed, should be sought in survey texts from publishers such as Sage Publications). If an established feedback or quality assurance survey of counselors is already in place, adding questions to that instrument will be the most cost-effective way to gather the data needed.
67

Gather information
Develop Survey Questions. Example questions are listed in Exhibit 3.3 at the end of this section. At a minimum, a VR counselor survey includes:
• counselor demographics (gender, race/ethnicity) and office location;
• counselor responsibilities (job title, specialization, caseload size); and
• counselor feedback on each of the major information goals.
Implement Survey. Distribute the survey in the method chosen (Web, mail, etc.). The survey should be accompanied by a cover sheet explaining the purpose of the survey (i.e., to gather input for the required Needs Assessment that will inform the State Plan), the importance of receiving input from counselors, and instructions on how to return the survey. Follow up with those who have not completed the survey to encourage submission.
Collect and input results. Surveys that are returned should be input into a database or spreadsheet in preparation for analysis in Task 4. Surveys done via the Web should be programmed to collect inputs in a database or spreadsheet.
3.3 Survey VR consumers
Besides lending input to the topic of needs of all individuals with disabilities, the consumer’s own background and experience with VR can inform several other requirement areas, including the needs of those with significant disabilities, minorities, and those who are underserved. Several state agencies and SRCs already conduct a satisfaction survey, and results of that survey can inform the CSNA. Surveys can be phone, mail, email, or Web based. Appendix G has more on each of those methods. Texts from publishers such as Sage Publications have detailed information on sampling, survey methods, question development, survey techniques, data collection, and/or data analysis (http://www.sagepub.com/allSageSearch.nav?&_requestid=545946).
Develop survey questions. Several state agencies have satisfaction surveys. If a satisfaction survey is not already being implemented, this Web site provides links to several state agency customer satisfaction surveys that can be used as models (http://ncrtm.org/course/view.php?id=100). SRCs will provide valuable input to satisfaction survey question design. An example survey is provided in Exhibit 3.4.
Topics to ask about in a VR consumer survey include:
• demographics of respondent (Gender, year born, race, ethnicity, primary disability, current status in VR); and
68

3
• consumer impressions of VR experiences (Were service needs met? What other services were needed? Was desired employment outcome achieved? What services and processes worked well? Recommendations for improvement?).
More detailed questions can examine services received, impressions of those specific services, or other service provision issues.
Implement Survey. The distributed survey should be accompanied by a cover sheet explaining the purpose of the survey (i.e., to gather input for the required Needs Assessment that will inform the State Plan), the importance of receiving input from consumers, and instructions on how to return the survey. Follow up with those who have not completed the survey to encourage submission.
Collect and input results. Surveys that are returned by mail should be entered into a database or spreadsheet in preparation for analysis in Task 4. Surveys done via the Web should be pre-programmed to be input into a database or spreadsheet.
3.4 Focus groups
Focus groups provide depth on a relatively small number of topics. They rely on discussion on a clearly defined set of topics to develop a broad understanding of the participant’s point of view. Focus group facilitators need to be trained in how to effectively manage the groups, especially how to encourage the respondents in conversation.
Focus groups usually bring together 8-12 individuals based on characteristics on which the research seeks input. While the number of participants may vary, groups should be large enough to gather a diversity of opinion but small enough so that everyone can participate.
Focus groups also provide an opportunity to interface with other state and community organizations assembled in Step 1. SRCs and VR agencies can benefit from a working relationship with these organizations and these groups may be willing to assist in recruiting people to participate in focus groups or even to host a focus group.
69

Gather information
Example focus groups include:
• People with disabilities focus groups (at least two)
• Individuals with significant disabilities (e.g., blind group, deaf group, mobility impairment group);
• Minority individuals with disabilities (e.g., African American, Asian American, Hispanic, Native American, etc.);
• Most significant disabilities and underserved individuals with disabilities (e.g., mental retardation group, mental illness group, traumatic brain injury group, other groups identified as most significant and/or underserved in the state); and
• Unserved individuals with disabilities: Use CILs, advocacy groups, One-Stops, and other local community resources to recruit individuals who have not used VR services but are eligible.
• Employer focus group (at least one)
• Employers who have familiarity with VR agencies can review experience with VR clients, plus organizational requirements or preferences (needs) for individuals coming through the VR or WIA system.
• Disability Navigator/One Stop staff/VR counselor focus group (at least one)
• One or more Disability Navigators or equivalent along with One-Stop staff members and VR counselors from the corresponding statewide or local area will provide points of view of the gaps and approaches as seen by the entire workforce system for individuals with disabilities.
• Service provider/CRP focus group (at least one)
• Service providers and/or CRPs will provide input from the field on needs of individuals as well as on CRPs.
Prepare for the focus groups
1. Where will focus groups occur? Determine whether VR and/or SRC will host all of the focus groups or if other organizations will assist.
2. How long is the focus group? Plan for each focus group session to last 1.5 to 2 hours.
3. Determine dates, times, places and topics for focus groups. Create a master schedule of focus groups by topic.
Find organizations to host the focus groups that are to be held in different locations around the state that will reach the populations to be involved (e.g., rural and urban areas, areas that would yield participants that represent various cultures, ethnicities, or
70

3
disabilities, etc.). Contracting with local host organizations works well, especially in states large in area or population.
Focus groups are made up of individuals with diverse backgrounds who represent diverse viewpoints on the topic areas. Use of SRC resources and the Step 1 list of community organizations will help to outreach to geographically or culturally isolated populations. Offer to cover travel expenses and also provide an honorarium for participants.
Send prepared materials to participants and follow up with participants a few days prior to the scheduled focus group meeting to assure attendance. Make sure focus group participants complete the Information/Consent Form prior to participation. Determine accessibility needs of participants (including needs for supports in the group to participate).
Although most focus group discussions are informal, a series of important questions will help keep discussion flowing in the right direction. Questions should be ordered with the five or six most important questions first.
Staffing for the focus group generally includes a trained facilitator, assistant facilitator who serves as observer and note taker, and possibly an audio or videotape person. The facilitator and assistant should have experience in leading focus groups that include people with disabilities.
A trained facilitator will understand how to convene the group, ask questions, probe for people’s opinions, encourage people to participate, and keep the group focused. Results will be more consistent if the same facilitator is used for most focus groups.
The assistant will serve as an objective observer, monitoring group dynamics, keeping notes on reactions and responses. This person can also be responsible for the audio or video.
Conducting the focus groups
The seating should be arranged so that the participants can see each other. A round table or seating arrangement with a writing surface is ideal.
The recommended pattern for introducing the group discussion includes these steps:
• registration, collecting consent and information forms;
• welcome and introductions of facilitator and VR staff by the host organization staff; and
71

Gather information
• an overview of the topic, review of the ground rules for the discussion and presentation of questions by the facilitator.
After the focus group, thank you letters should be sent to the host organization and focus group participants along with the promised honoraria. Even if honoraria are paid at the meeting, they should be accompanied or followed with a thank you letter.
Review the recording of each meeting and generate an electronic transcript of the proceedings, including all comments from participants.
3.5 Guide to implementing key informant interviews
These are interviews with experts who are particularly knowledgeable about VR needs of people with disabilities, including people who have in-depth knowledge of the rehabilitation needs of individuals with disabilities and of the rehabilitation service system. The aim is to establish a conversation and for the interviewer to gain a broad understanding of the respondent’s point of view. Interviews can be done in person or by telephone.
Identify the respondent list
The model CSNA includes key informant interviews with 15-20 people knowledgeable on one or more of the following, including members of statewide and local boards and disability organizations:
• VR system;
• state developmental disabilities system;
• state mental health system;
• employment of people with disabilities, including WIA;
• community rehabilitation programs (CRPs);
• community services for people with disabilities;
• needs of minorities with disabilities; and
• unserved or underserved groups.
One way to determine with whom to speak is to establish a “snowball” process whereby calls are made to agency representatives to discover who else might be highly knowledgeable and appropriate to speak with.
A matrix of key interviewee expertise can be used to track whether all important topic areas will be covered by selected interviewees (Exhibit 3.5).
72
3
Develop and pretest discussion guide
The discussion guide should include information that will explain to the interviewees the purpose of the interview, why they have been selected, the confidentiality of the interview, the use of the interview, and the length of the interview. It should invite questions from the interviewee before beginning. An example key informant discussion guide is provided in Exhibit 3.6.
If more than one interviewer is used for the key informant interviews, it is very important to assure that the interviewers are approaching the task in a similar way. A trained interviewer will understand how to use a friendly probing manner on the phone, how to allow the interviewee to talk as much as possible after a question is asked, how to engage a person who does not want to participate, how to probe an interviewee to elicit his or her input (such as repeating what interviewer says to confirm the information, use of silence to allow interviewee time to respond, use of probes asking about specific content, use of general probes such as “tell me more” or “I’m not sure I understand what you mean”) and how to record the information heard.
Conversations can be recorded by tape or via conference call with a stenographer after alerting the interviewee ahead of time that the call will be recorded for the purposes of assuring the accuracy of the input. The result will be a record of the call.
3.6 Community hearings
Commonly conducted in an accessible public location such as a large auditorium, hearings offer the opportunity for community members to voice views and opinions for the agency to consider.
Community hearings will be very useful in gathering input on needs for individuals with disabilities, those with significant disabilities and minority, unserved, and underserved populations.
While a hearing on general vocational rehabilitation needs is the most logical topic, also consider opportunities to conduct a hearing in conjunction with other hearings being done by the state VR agency and/or SRC, especially any related to the State Plan. Hearings on specific CSNA questions such as CRP establishment, development, and improvement also are appropriate. (Other public hearings and testimony conducted by agencies such as Developmental Disability, Mental Health, and Veteran’s Administration also may contain relevant information.)
Identify and contact statewide and local advocacy and service organizations from Step 1 located in the areas where the hearings will be held to collaborate in planning of and
73

Gather information
outreach for hearings. In any publicity requesting participation in hearings, note the main questions related to the CSNA goals. Use new media, such as Web sites, Facebook fan clubs, and Twitter to conduct outreach.
Preparation
Arrange for alternative formats for materials used in public hearings. Create sign-in forms; arrange for interpreters, translation, and transcription; and any other meeting set-up that is necessary for that site.
The agenda can be organized by information questions for the CSNA. Individual testimonies should be recorded in any one of a variety of ways (court recorder, handwritten notes, video recording, audio recording). If video or audio recording is used, notice should be given to the audience before the hearing begins.
Produce a record of the proceedings for use in the analysis.
74

3
Exhibit 3.1 Data Resources to Retrieve
National survey sources on disability available for each state
Data Source Description Web Address American Community Survey (ACS) <http://factfinder.census.gov> Table S1801 Disability characteristics: age, disability
type, employment status, and poverty status
<http://factfinder.census.gov/servlet/STTable?_bm=y&-qr_name=ACS_2007_1YR_G00_S1801&-geo_id=01000US&-ds_name=ACS_2007_1YR_G00_&-state=st&-_lang=en&-format=> (US 2007 Table – change geography for state)
Table S1802 Selected economic characteristics for the civilian noninstitutionalized population by disability status
<http://factfinder.census.gov/servlet/STTable?_bm=y&-geo_id=01000US&-qr_name=ACS_2007_1YR_G00_S1802&-ds_name=ACS_2007_1YR_G00_&-_lang=en&-redoLog=false&-state=st&-format=&-CONTEXT=st> (US 2007 Table – change geography for state)
Tables C18020 and versions A-I
Noninstitutionalized people with a disability and not employed by state, age 16-64, by race and ethnicity, and by state
<http://factfinder.census.gov/servlet/DTGeoSearchByListServlet?ds_name=ACS_2007_1YR_G00_&state=dt&mt_name=ACS_2007_1YR_G2000_C18020&_lang=en&_ts=266419110891> (Insert state in geography)
Table S1601 Languages spoken at home <http://factfinder.census.gov/servlet/STTable?_bm=y&-geo_id=01000US&-qr_name=ACS_2007_1YR_G00_S1601&-ds_name=ACS_2007_1YR_G00_&-_lang=en&-redoLog=false&-state=st&-format=&-CONTEXT=st>>> (US 2007 Table – change geography for state)
Table S1603 Characteristics of people by language spoken at home
<http://factfinder.census.gov/servlet/STTable?_bm=y&-geo_id=01000US&-qr_name=ACS_2007_1YR_G00_S1603&-ds_name=ACS_2007_1YR_G00_&-_lang=en&-
75

Gather information
Data Source Description Web Address redoLog=false&-state=st&-CONTEXT=st> (US 2007 Table – change geography for state)
Table B16001 Language spoken at home by ability to speak English for the population 5 years and over
<http://factfinder.census.gov/servlet/DTGeoSearchByListServlet?ds_name=ACS_2007_1YR_G00_&state=dt&mt_name=ACS_2007_1YR_G2000_B16001&_lang=en&_ts=261076229603> (Insert state in geography)
Cornell Disability Statistics Center Interactive Tables <http://www.ilr.cornell.edu/edi/DisabilityStatistics/>
ACS Prevalence, employment
CPS Prevalence, labor market activity, employment, household income, poverty
Census 2000 Prevalence, employment
Disability Status Reports
State summaries of population size, disability, employment, earnings, and household income
Disability Planning Data
Substate and state estimates of disability from the ACS
<http://www.disabilityplanningdata.com>
Behavioral Risk Factor Surveillance Survey (BRFSS) <http://www.cdc.gov/BRFSS> Core disability question 1
Adults who are limited in any activities because of physical, mental, or emotional problems
<http://apps.nccd.cdc.gov/brfss/list.asp?cat=DL&yr=2008&qkey=4000&state=All>
Core disability question 2
Adults with health problem(s) that require the use of special equipment
<http://apps.nccd.cdc.gov/brfss/list.asp?cat=DL&yr=2008&qkey=4001&state=All>
Bureau of Census Projections <http://www.census.gov/population/www/projections/index.html>
Summary Table B-1 Projected population by state showing projected population changes 2000-2030 by 5-year increments
<http://www.census.gov/population/www/projections/projectionsagesex.html>
Race and ethnicity projections by state from 1990
<http://www.census.gov/population/projections/state/stpjrace.txt>
National race, ethnicity projections from 2010 to 2050
<http://www.census.gov/population/www/projections/summarytables.html>
Bureau of Labor Statistics (BLS) <http://www.bls.gov/> Short- and long-term occupational
projections by state <http://www.projectionscentral.com>
76

3
Data Source Description Web Address Unemployment rates by state, current and
historical <http://data.bls.gov/map/servlet/map.servlet.MapToolServlet?survey=la>
Unemployment rates by county, current and historical
<http://data.bls.gov/map/servlet/map.servlet.MapToolServlet?survey=la&map=county&seasonal=u>
Other national surveys of use
Data Source Description Web Address Current Population Survey (CPS) <http://www.census.gov/cps/> Employment status of the civilian
noninstitutional population by sex, age, and disability status
<http://www.bls.gov/cps/cpsdisability.htm>
Survey of Income and Program Participation (SIPP) <http://www.census.gov/sipp/ > Current Population Reports Household
Economics Studies P70-117 (Americans with Disabilities: 2005) and P70-73 (Americans with Disabilities: 1997)
<http://www.census.gov/prod/www/abs/p70.html>
National program administrative data and reports
Data Source Description Web Address Rehabilitation Services Administration <http://rsamis.ed.gov> ARR - RSA Annual Review Report, Tables 2-18, 24
Waiting list characteristics
RSA-113 - Quarterly Cumulative Caseload Report
Waiting list data, exit data
RSA-911 Summary by fiscal year and State agency
Characteristics of clients served, employment status at closure by characteristics, service patterns for most significant, use of supported employment, referred by CRP, and services provided by public or private CRP
RSA-2 - Annual Vocational Rehabilitation Program/Cost Report
Expenditure data, individuals served and expenditures by service category; services provided at CRPs; services purchased at public and private CRPs; establishment, development or improvement of CRPs; and construction of facilities for CRPs
SF-269 - Financial Status Report
Supported employment
VR State Plan Monitoring reports
77

Gather information
Data Source Description Web Address Annual Report to Congress on the Implementation of the Individuals with Disabilities Education Act (IDEA)
<http://www.ideadata.org>
Table 1-1; 1-5; 1-6; 1-8; 4-4
Children and students; age 12-17; age 18-21; students by age; for ages 14 through 21
<http://www.ideadata.org/arc_toc7.asp>
Institute for Community Inclusion’s StateData.info <http://www.statedata.info>
State ID/DD Agency Survey
Employment; program funding, costs and spending; program outcomes; program use/enrollment
Rehabilitation Services Administration closures (RSA-911)
Employment; earnings; program funding, costs and spending; program outcomes; program use/enrollment
Social Security Administration
Employment; program outcomes; program use/enrollment
State Demographic Data Employment; earnings
Wagner Peyser Employment; program use/enrollment
Workforce Investment Act
Employment; earnings; program outcomes; program use/enrollment
American Community Survey
Employment; earnings
State Mental Health Agency Data
Employment; program outcomes; program use/enrollment
Section 504 data
Table 3B Number of students receiving Section 504 services only, for states and the U.S
<http://www.ed.gov/about/offices/list/ocr/data.html?src=rt>
Data tables on students with disabilities
<http://ocrdata.ed.gov/ocr2006rv30/VistaApp/browsetables.aspx?VistaLanguage=en>
Department of Labor, Employment Training Administration <http://www.doleta.gov> Wagner-Peyser and Veteran’s Employment Programs
Jobseekers with disabilities, services received
<http://www.doleta.gov/Performance/results/wagner-peyser_act.cfm>
ETA Form 9002, VETS 200 Report <http://www.doleta.gov/performance/guidance/wia/Employment-Training-406-Handbook-060505.pdf>
Workforce Investment Act (WIA)
WIA adults, dislocated workers, older youth, national emergency grants, and trade adjustment assistance
<http://www.fred-info.org/>
78
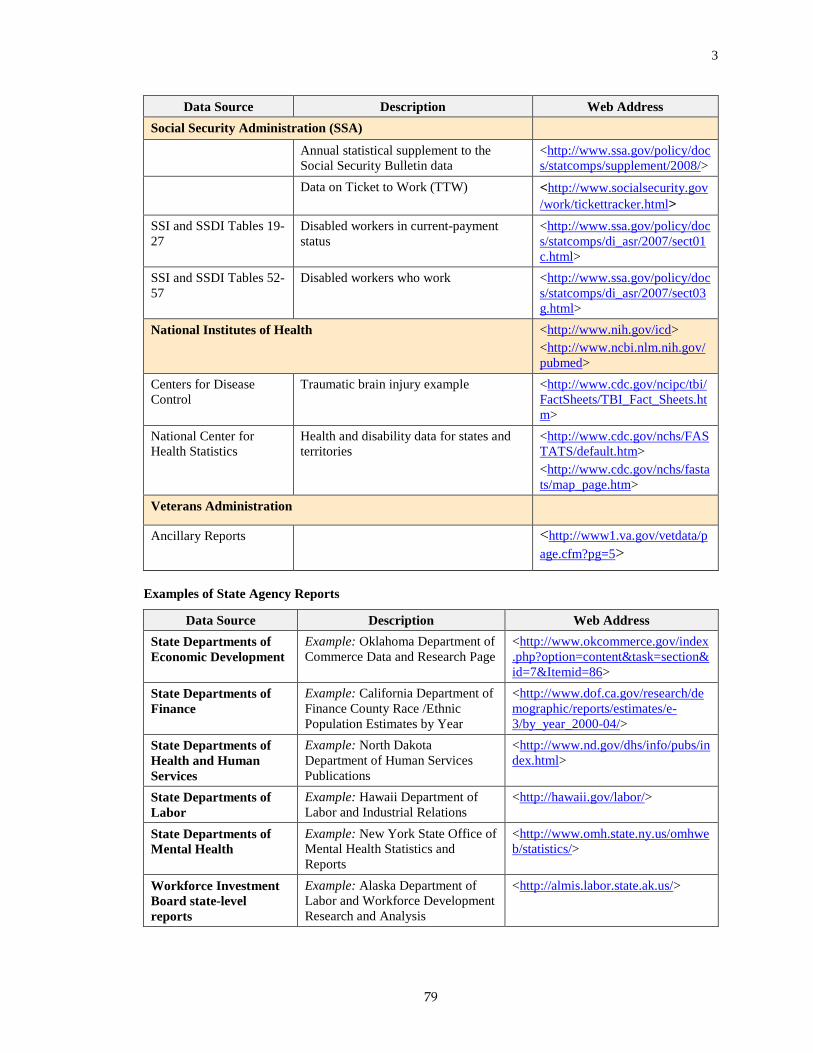
3
Data Source Description Web Address Social Security Administration (SSA)
Annual statistical supplement to the Social Security Bulletin data
<http://www.ssa.gov/policy/docs/statcomps/supplement/2008/>
Data on Ticket to Work (TTW) <http://www.socialsecurity.gov/work/tickettracker.html>
SSI and SSDI Tables 19-27
Disabled workers in current-payment status
<http://www.ssa.gov/policy/docs/statcomps/di_asr/2007/sect01c.html>
SSI and SSDI Tables 52-57
Disabled workers who work <http://www.ssa.gov/policy/docs/statcomps/di_asr/2007/sect03g.html>
National Institutes of Health <http://www.nih.gov/icd> <http://www.ncbi.nlm.nih.gov/pubmed>
Centers for Disease Control
Traumatic brain injury example <http://www.cdc.gov/ncipc/tbi/FactSheets/TBI_Fact_Sheets.htm>
National Center for Health Statistics
Health and disability data for states and territories
<http://www.cdc.gov/nchs/FASTATS/default.htm> <http://www.cdc.gov/nchs/fastats/map_page.htm>
Veterans Administration
Ancillary Reports <http://www1.va.gov/vetdata/page.cfm?pg=5>
Examples of State Agency Reports
Data Source Description Web Address State Departments of Economic Development
Example: Oklahoma Department of Commerce Data and Research Page
<http://www.okcommerce.gov/index.php?option=content&task=section&id=7&Itemid=86>
State Departments of Finance
Example: California Department of Finance County Race /Ethnic Population Estimates by Year
<http://www.dof.ca.gov/research/demographic/reports/estimates/e-3/by_year_2000-04/>
State Departments of Health and Human Services
Example: North Dakota Department of Human Services Publications
<http://www.nd.gov/dhs/info/pubs/index.html>
State Departments of Labor
Example: Hawaii Department of Labor and Industrial Relations
<http://hawaii.gov/labor/>
State Departments of Mental Health
Example: New York State Office of Mental Health Statistics and Reports
<http://www.omh.state.ny.us/omhweb/statistics/>
Workforce Investment Board state-level reports
Example: Alaska Department of Labor and Workforce Development Research and Analysis
<http://almis.labor.state.ak.us/>
79
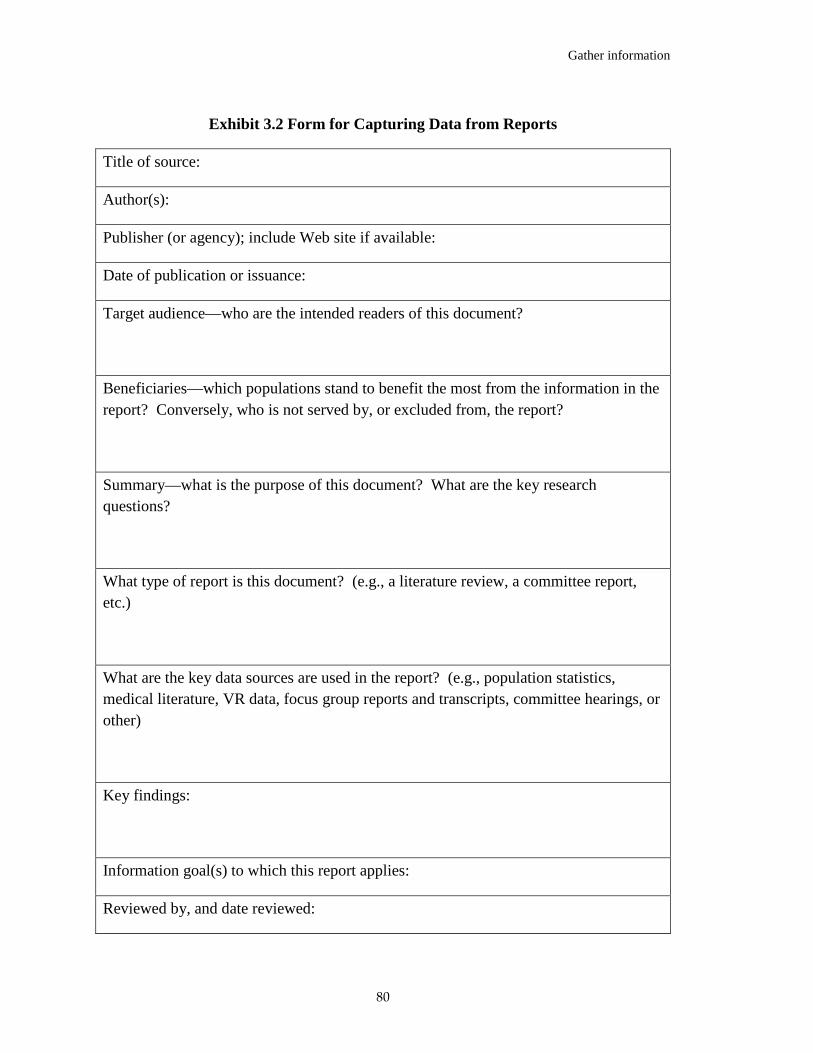
Gather information
Exhibit 3.2 Form for Capturing Data from Reports
Title of source:
Author(s):
Publisher (or agency); include Web site if available:
Date of publication or issuance:
Target audience—who are the intended readers of this document?
Beneficiaries—which populations stand to benefit the most from the information in the report? Conversely, who is not served by, or excluded from, the report?
Summary—what is the purpose of this document? What are the key research questions?
What type of report is this document? (e.g., a literature review, a committee report, etc.)
What are the key data sources are used in the report? (e.g., population statistics, medical literature, VR data, focus group reports and transcripts, committee hearings, or other)
Key findings:
Information goal(s) to which this report applies:
Reviewed by, and date reviewed:
80

3
Exhibit 3.3 Example VR Counselor questionnaire
Counselor Identifier:
Counselor Gender:
Counselor Race/Ethnicity:
Office Location:
1. From your experience with individuals with significant disabilities, please circle your response and reply about their vocational rehabilitation needs?
a. Are there services that you feel are needed for this population?
No
Yes If yes, what are they?
b. Are there barriers to the provision of these services?
No
Yes If yes, what are they?
c. What can the state VR agency or your local office do to improve the provision of services to those with significant disabilities?
2. From your experience with individuals with most significant disabilities, please circle your response and reply about their vocational rehabilitation needs?
a. Are there services that you feel are needed for this population?
No
Yes If yes, what are they?
b. Are there barriers to the provision of these services?
No
Yes If yes, what are they?
81

Gather information
c. What can the state VR agency or your local office do to improve the provision of services to those with most significant disabilities?
3. From your experience with minority individuals with disabilities, please circle your response and reply about their vocational rehabilitation needs?
a. Are there services that you feel are needed for this population?
No
Yes If yes, what are they?
b. Are there barriers to the provision of these services?
No
Yes If yes, what are they?
c. What can the state VR agency or your local office do to improve the provision of services to minority individuals with disabilities?
4. From your experience, who do you believe to be unserved populations of individuals with disabilities? (e.g., Who do you know that is not using our services and could benefit from them?)
5. From your experience, who are underserved populations of individuals with
disabilities? (e.g., Who do you know that could benefit more from our services?)
6. From your experience with underserved individuals with disabilities, please
circle your response and reply about their vocational rehabilitation needs?
a. Are there services that you feel are needed for this population?
No
Yes If yes, what are they?
82

3
b. Are there barriers to the provision of these services?
No
Yes If yes, what are they?
c. What can the state VR agency or your local office do to improve the provision of services to underserved individuals with disabilities?
7. Please circle the extent to which you agree or disagree with the following statements:
a. There is a need to establish new CRPs
Strongly agree Agree Neutral Disagree Strongly Disagree
Comments:
b. There is a need to develop recently established CRPs
Strongly agree Agree Neutral Disagree Strongly Disagree
Comments:
c. There is a need to expand current CRPs
Strongly agree Agree Neutral Disagree Strongly Disagree
Comments:
83

Gather information
Exhibit 3.4 Example VR consumer questions
Gender:
Race/Ethnicity:
Year left VR?:
Employed when left VR?:
1. Please circle the extent you agree or disagree with the following statements:
a. Overall, my VR services were provided in a timely manner
Strongly agree Agree Neutral Disagree Strongly Disagree
Comments:
b. The process of working with VR was professional and helpful
Strongly agree Agree Neutral Disagree Strongly Disagree
Comments:
c. I received all the services I was told I would receive
Strongly agree Agree Neutral Disagree Strongly Disagree
Comments:
d. The services VR provided or purchased were of high quality
Strongly agree Agree Neutral Disagree Strongly Disagree
Comments:
e. As a result of VR services, I found employment
Strongly agree Agree Neutral Disagree Strongly Disagree
Comments:
84

3
f. I am satisfied with the employment I have after having received VR services
Strongly agree Agree Neutral Disagree Strongly Disagree
Comments:
g. Overall, the VR services I received met my needs
Strongly agree Agree Neutral Disagree Strongly Disagree
Comments:
h. If a friend of mine were in a similar situation to me, I would tell them to go to VR.
Strongly agree Agree Neutral Disagree Strongly Disagree
Comments:
85

Gather information
Exhibit 3.5 Matrix of Key Interviewee Expertise and Tracking
Area of Expertise
Mal
e
Fem
ale
VR
nee
ds o
f PW
D
Sign
ifica
nt
dibi
liti
M
inor
ities
Uns
erve
d
Und
erse
rved
Wor
kfor
ce
it
t t
C
RPs
Rur
al
Urb
an
Subu
rb
Oth
er e
xper
tise
(spe
cify
)
Interview List --- Legend: ** = interviewed; * = scheduled State Government John Doe, State VR agency
Jane Smith, State Dept of Mental Health
State DD
State Employment Security Agency
Governor’s Committee on Employment of Persons with Disabilities
SILC representative Community Organizations ARC
UCP
NAMI
CIL (rural)
CIL (urban) Minority or multicultural organization
Academic (Policy) University researcher 1 University researcher 2 Foundation researcher Other Veterans Administration
Workforce Board
86

3
Exhibit 3.6 Key informant interview discussion guide
Key Informant Interview
Date of Interview: _________
Contact/Key Informant: ___________________________________________
Organization/Description: _________________________________________
Address: _______________________________________________________
Phone: _______________________________________________________
E-mail: _______________________________________________________
Interviewer: ______________________________
Script
Hello,
My name is _________________. I am calling from the state VR agency. We are conducting our Vocational Rehabilitation Needs Assessment. The study is being conducted to learn more about VR needs in this state and to help the Department prepare its State Plan.
The overall needs study includes a range of data collection and public input that will assure a broad public participation in identifying needed programs, services and resources. Key features of the study include population statistics, public hearings and focus groups, survey information collection and interviews with individuals.
Because of your knowledge, you have been selected to participate in the interview process.
None of your responses will be identified with you or your program, if that is your desire. After we receive responses from all individuals and organizations interviewed, we will combine the information with the other data we have collected and prepare findings.
The interview takes about one to two hours. Is this a good time to talk? Or would you like to make an appointment for another time?
Do you have any questions before we begin?
87

Gather information
• What do you see as the VR service needs for individuals with a disability?
• What are the barriers?
• What can VR do to meet the need (capacity)?
• What about for those with a significant disability?
• What are the barriers?
• What can VR do to meet the need (capacity)?
• From your experience, who do you believe to be unserved populations of individuals with disabilities? (e.g., Who do you know that is not using our services and could benefit from them?)
• From your experience, who are underserved populations of individuals with disabilities? (e.g., Who do you know that could benefit more from our services?)
• What do you see as the VR service needs for those who are unserved or underserved?
• What are the barriers?
• What can VR do to meet the need (capacity)?
• What about for the need for supported employment?
• What are the barriers?
• What can VR do to meet the need (capacity)?
• If you look at the entire workforce investment system in the state, are there additional service needs?
• What are the barriers?
• What can VR do to meet the need (capacity)?
• What do you see as the need for establishment, development, and improvement of CRPs?
• (ADD any state-determined goals)
• What are the barriers?
• What can VR do to meet the need (capacity)?
• Is there something else you would like to tell us? Thank you for your time and interest.
88

4
Step 4. Analyzing the results and developing findings
To this point the focus has been on collecting information from a variety of sources that informs the Needs Assessment. In the next three steps - 4, 5, and 6 - this available information will be used to develop recommendations for the State Plan.
In Step 4, the information will be analyzed and organized to inform the pre-defined information goals and to identify new areas for consideration. Then, in Step 5, VR and the SRC will identify potential agency goals, policies or actions suggested by the findings. In Step 6, the team will consider these alternatives and make recommendations for the State Plan for this needs assessment cycle.
This section of the Guide includes information on summarizing the results of the various information strategies used in the model CSNA. Again, the Guide is not a methods text. The team conducting the analysis should include people with skills and experience in quantitative and qualitative analysis, as well as people knowledgeable about the VR program. Once information from each source is organized, this information can be combined to inform each of the study’s major questions.
The following interim study products should be available:
Task Product
Step 4. Analyzing the results and developing findings
4.1 Review available survey and administrative data and tables
Tables and data sources organized by study information goals and topics
4.2 Analyze study survey data Statistical tables by study information goals and topics
4.3 Review and analyze state reports Summary of state reports by study information goals and topics
4.4 Analyze results from focus groups, hearings, and other stakeholder narrative including survey narrative comment
Qualitative results by study information goals and topics area
4.5 Combine findings from different sources to inform information goals
Needs Assessment findings by study information goals and topics
4.1 Review available survey and administrative data and tables
This model for conducting the CSNA encourages making the most use of relevant, available secondary data as found in national and state data sets (agency VR data, American Community Survey, etc.) and also developing new data for the study such as
89

Analyze results
counselor and consumer surveys. Suggestions for data resources and examples for surveys were included in Step 3. To prepare for this mixed-method analysis, a first step is to review existing extant data resources, as identified, and organize this information in terms of relevance for addressing the information goals. Exhibit 4.1 provides a review template for these data sources.
In some cases, the information is already available in prepared tables at the state or sub-state level. In other cases, it will be necessary to prepare tables using the available information. Step 3 included examples of available tables and possible tables to develop from existing data. Each of the available information sources has potential strengths for use in the needs assessment, but because these data were developed for other purposes each also has some limitations and cannot stand alone as an estimation resource.
4.2 Analyze study survey data
The example surveys provided in the Guide were designed to address the major information goals. If other surveys are used, the survey responses should be related to the relevant information goals (e.g., service needs of minorities, need for CRPs, etc.) Tables summarizing the responses to each survey can be prepared. Some statistical survey software and some Web-based survey tools (e.g., Survey Monkey®) are designed to prepare descriptive tables automatically.
Where survey respondents have contributed written comments and narrative, this qualitative information can be analyzed in the same way as focus group and hearing records (see 4.4) to relate to information goals and identified topics.
4.3 Review and analyze literature including state reports
The combination of text and data in publications and reports calls for a different type of analysis. This literature may be useful to:
• identify any gaps in services identified as important for people with disabilities to achieve their employment goals that are mentioned in reports and organize by information goal;
• identify barriers to services for specific groups (e.g., service needs of individuals with post-traumatic stress disorder (PSD)) ;
• identify findings related to service capacity (e.g., services not available but identified as valuable; services not available because providers working at capacity); and
• identify any other issues or themes.
90

4
The template in Exhibit 4.2 can be useful for analyzing relevant literature, state reports, and other related information. Each source can be reviewed and summarized using the template; identification of useful information and relating the information to the information goals will make it easy to retrieve.
4.4 Analyze results from focus groups, hearings, and other stakeholder comments
To be most useful, the observations, ideas, and suggestions available in hearing and focus group records, as well as comments from surveys and other stakeholder input, can be organized so that it is easy to review in considering each information goal.
This process begins with the study transcripts and survey comments. The general process in qualitative analysis is to “tag” each comment to identify the topics and themes and also to keep track of the origin of the comment (source of information, study event or process). There are methods resources that describe the qualitative analysis process in detail, and the methodology is only described generally here. The work should be carried out by staff or outside resources trained in qualitative analysis. Typically this is an iterative review and analysis process, because as the material is reviewed, additional topics and themes are identified. Several passes through the material are needed so that all comments are categorized with the emergent “tags.” Qualitative analysis can be very labor-intensive. Because of the subjective nature of this work, it is often recommended that this analysis involve more than one person and that each member of the analysis team conduct a part of the analysis independently. Subsequently, the team compares, discusses, and synthesizes the results to establish an independent verification of the analysis (Altschuld, 1999).
There are many ways to keep track of the “tags” and sources of information. The process does not require specialized software, but there are several tools that are available to support the work, such as nVivo ® or Ethnograph®. Simpler approaches, which may be sufficient, include using word processing, spreadsheet or database software, sorting comments based on identified topic and theme “tags,” and creating new categories as they emerge in the analysis.
The team might start with “tags” for the general information goal or a broader set based not only on the general goal but also on specific topics within the goal. For instance, for Information Goal 1 – “Rehabilitation needs of individuals with most significant disabilities, including supported employment” – there are a number of population categories of particular relevance, so the analysis could start with separate subtopics related to supported employment for mental illness, for intellectual disability, for traumatic brain injury, and for other disabilities (specify).
91

Analyze results
For Information Goal 2 – “Rehabilitation needs of minorities” – subtopics could include specific needs for Blacks or African Americans, for American Indians or Alaska Natives, for Asians, for Native Hawaiians or Other Pacific Islanders, for Hispanics or Latinos, and for specific subgroups where services may have already been identified in the state (for example Hmong, Hispanic women, Spanish-speaking immigrants, older Chinese).
For Information Goal 3 – “Rehabilitation needs of unserved or underserved groups” – any specific groups that have been identified as unserved or underserved in the state such as rural workers, people with TBI, veterans of the Iraq war, etc.
For Information Goal 4 – “Rehabilitation needs of individuals with disabilities served through other components of the statewide workforce investment system” – needs for those with disabilities served at One-Stops, served through Veteran’s Employment and Training Service, those served through Wagner Peyser programs, etc.
For Information Goal 5 – “Need to establish, develop, or improve community rehabilitation programs” – tags could specify whether the comment is general or relates to either need for new CRPS, or for development or improvement of existing CRPs, and also types of CRPs.
Other useful “tags” include whether the comment relates to the description of a “need,” the identification of a barrier to services, a recommendation for a change in a system or process, or other information. As the qualitative process continues, other categories will emerge but the structure of the needs assessment information goals provides a good place to begin.
At the conclusion of this process, the information can be sorted by any of the tags, including but not limited to the information goal. An interim product which may be useful not only for next analysis steps but also as valuable anecdotal material from the study for dissemination is a document that includes the comments, organized by information source, topics and themes.
4.5 Combine findings from different sources to inform information goals
Each information goal of the CSNA can be informed by existing data, special surveys, stakeholder input and other sources. By this point in the process, these information sources have been analyzed and organized. Now, finally, these sources can be considered together so that quantitative information from surveys, projections, and estimates is juxtaposed with the qualitative results from stakeholder participation and other sources to address the information goals.
92

4
The CSNA includes information from many sources. It is designed to focus on the questions from the Act and to take advantage of the relative strengths of a variety of methods. Tables 4.1-4.5 provide summary examples of how findings from individual information sources will combine to identify VR needs. Once the specific findings are summarized, priorities for action can be developed.
To combine the quantitative and qualitative data, it is useful to consider the strengths and weaknesses of each source, as described in the Overview of the Model CSNA section of this guide and Appendices A-G, and summarized in Exhibit .5, Strengths and Limitations of Data Sources, pp 27-29. Combining information from several sources will develop a comprehensive assessment.
Example questions regarding reliance on the information sources include:
• What does the American Community Survey (ACS) Factfinder data tell us about the disability population in the state and areas within the state, particularly the population in need of VR services? What are the shortcomings of that information? How can I use the information effectively?
• What about the other available survey data that is available?
• For any reports or studies from other agencies, what do we know about the reliability of the information? Which studies describe their methods for collecting information? Do those methods appear sound and appropriate?
• The model CSNA includes stakeholder information from many sources. How representative is this information?
Table 4.1 summarizes an approach to the first needs assessment topic - rehabilitation needs of individuals with the most significant disabilities, including supported employment. Here, we provide examples of the information that might inform this question. Since each agency will have different information available, this table should be regarded as an illustration of how the information could be combined. This section will be expanded after work with state-specific information in the Guide pretest.
• How many people in the state might need supported employment services?
The first step is to develop an estimate of the potential population in need of supported employment in the state. The ACS measure “self-care disability” (has difficulty dressing, bathing, or getting around inside the house) is a measure of significant disability and, for individuals of working age, a suggested proxy for need for supported employment. Available tables do not provide employment information about this group (people already employed, people not in the labor
93

Analyze results
force and not looking for work) so this measure will be an overestimate of the population.
• Who uses VR supported employment services now? (type of disability, significance, outcomes)?
Analyze the agency’s 911 data to develop an understanding of the individuals in the state who use supported employment currently, and those who have exited the agency with supported employment outcomes. Include Order of Selection waiting list data if relevant.
• What is the current supply of supported employment services in the state available for VR?
Relevant indicators include a list or summary of current providers, at the state level and for geographic areas within the state. Also relevant: information on vacancies and waiting lists. Other agency or provider reports may also be of use here.
• What are the service needs of people in need of supported employment? What are the barriers to services?
The RSA-911 data provides patterns of service use. Additional resources include information from other VR studies and reports, other state agencies, and literature on supported employment services and evidence-based practices.
Stakeholder information will be very valuable here, in providing examples of service needs and barriers.
Table 4.1 focuses on the first information goal - the left-hand column lists general categories of information relevant to this information goal: disability statistics, and estimates, information on service use, and identification of service needs, barriers and capacity. The second column shows sources that would be useful, and the next column identifies examples of specific information or measures available from that source. For example, for disability statistics for the state level, and also for areas within the state, the American Community Survey includes information of the rate of people with disabilities of working age with self-care disability as a percentage of individuals with different categories of disability. Prepared tables are available at the state level for this group, providing a rough estimate of the overall size of this population in the state, or in areas within the state. More detailed disability estimates for specific disabilities identified as “most significant” may use information from a variety sources including the ACS, SIPP and Social Security data.
94

4
The VR agency data includes measures that allow identification of individuals with supported employment goals. Existing tables may be available in the VR agency identifying these individuals, their service uses, and outcomes. Examination of patterns of current use is another way of examining supported employment to identify any needed changes.
Service needs, barriers, and capacity are topics that may have been included in the comments of the stakeholder processes or may be informed by prior reports. The table includes a number of examples of how these stakeholder sources may be the source of information on this question. The goal of this analysis is to develop the Needs Assessment chapter on findings, organized by information goal.
Tables 4.2-4.5 follow the same model, showing potential information sources and measures for each of the other information goals.
95

Analyze results
Table 4.1: Rehabilitation needs of individuals with most significant disabilities, including supported employment
Source Examples of Useful Information Disability statistics ACS statistics Rate of people with disabilities of working age with self
care disability as % of any disability. Disability Estimates ACS, SIPP, SSA, other Population estimates of specific disabilities identified as
most significant disability.
Service use Agency data used for RSA-911
Use of VR services including supported employment by individuals with significant disabilities; by type of disability; by type of outcome.
Service needs, barriers and capacity
VR agency data and reports
Supported employment services experience; supported employment service barriers (e.g., no source of extended services available). Evaluations of the effectiveness of previous strategies to meet needs (e.g., why were they effective or ineffective).
State and other reports
Information regarding the VR service needs of specific subgroups of individuals with significant disability who use supported employment: MI, intellectual disability (ID), TBI, other. Best practices in providing VR services to identified groups (e.g., supported employment services, other services). Identified barriers to service for these subgroups, including availability of services. Any existing information on VR internal and service system capacity to serve these subgroups.
VR counselor survey
Service use; need for additional supported employment services; Barriers to services; Internal and service system capacity for additional supported employment services or other VR services.
Disability focus group Navigator/One-Stop/VR focus group Service provider/CRP focus group Key Informants
Hearings
96

4
Table 4.2: Vocational rehabilitation service needs of minorities
Source Examples of Useful Information
Minority service rates
Agency data used for RSA-911 Rates of individuals served compared to working age population in
state and sub-state areas compared to ACS estimates and census projections. ACS and census
Languages other than English
ACS Language and needs of state population.
Service needs, barriers and capacity
VR agency data and reports
Data comparing minority service experience and outcomes to non-minority experience and outcomes. Barriers to services for minorities. Evaluations of the effectiveness of previous strategies to meet needs (e.g., why were they effective or ineffective).
State and other reports
Identified unmeet needs for VR services in ethnic/minority groups in the state or in areas of the state. Best practices in providing VR services to ethnic/minority groups. Identified barriers to service for these ethnic/minority groups. Any existing information on VR internal and service system capacity to serve these ethnic/minority groups.
VR counselor survey
Service use; needs of racial, ethnic, linguistic minorities; Barriers to services for those minorities; Internal and service system capacity for additional outreach and VR services to minorities.
Disability Focus group
Navigator/One-Stop/VR focus group Service provider/CRP focus group
Key informants: minority need
Hearings
97

Analyze results
Table 4.3: Rehabilitation needs of unserved and underserved groups (e.g., veterans, people with limited education, people living in rural areas, or others)
Source Example of Useful Information Identification of unserved and underserved groups
Disability estimates
Apply national disability rates to state or substate ACS estimates to identify size of subgroups.
Unserved: waiting Waiting lists Disability characteristics and service needs of individuals on VR waiting
lists.
Service needs, barriers, and capacity
VR agency data and reports
Identify groups that may be underserved in the state, their service needs, and barriers to services. Evaluations of the effectiveness of previous strategies to meet needs (e.g., why were they effective or ineffective).
State and other reports
Information regarding the VR service needs of unserved or underserved people with disability in need of VR services. Best practices in providing VR services to identified groups. Identified barriers to service for these groups, including availability of services. Any existing information on VR internal and service system capacity to serve these groups.
VR counselor survey
Service use; needs of groups that may be unserved or underserved groups; Barriers to services; Internal and service system capacity to meet VR service needs of those groups.
Disability Focus group
Navigator/One-Stop/VR focus group Service provider/CRP focus group
Key informants
Hearings
98

4
Table 4.4: Vocational rehabilitation services needs of individuals with disabilities served through other components of the statewide workforce investment system
Source Examples of Useful Information
WIA participants
WIASRD; state labor data
Characteristics of workforce investment system exiters with disabilities, by program (broad definition of disability).
VR Participants Agency data used for RSA-911
Characteristics of people with disabilities for VR exiters (detailed information on disability); referral to VR from One-Stops.
VR relationship to other part of system
VR agency data and reports
Characteristics of disability employment in state including: Medicaid Infrastructure Grants (MIGs); State employment/One-stop, etc.; locations of One-Stops, VR offices, including co-location; VR staff in One-Stop offices, barriers to services for individuals with disabilities in the WIA system. Evaluations of the effectiveness of previous strategies to meet needs (e.g., why were they effective or ineffective).
State and other reports
VR/Navigator/One-Stop focus groups; key informants; hearings
Characteristics of state workforce investment system; relationship of VR to the system; unserved and underserved groups. Barriers to VR service. Internal and service system capacity to meet need for additional VR services.
99

Analyze results
Table 4.5: Need to establish, develop, or improve community rehabilitation programs
Source Information
Current CRP use
VR agency admin data; RSA 911 data
Number, type and location of CRPs, costs, outcomes, disability type.
Agency data used for RSA-911; CRP data
Referrals, purchase of service from public or private CRPs, for state, regions, districts, offices; service provision by public and private CRP.
Agency cost data Agency expenditure on CRP establishment, development.
Projected CRP use
Disability estimates, projections: ID, MI, other; CRP data
Estimated future demand for CRP services.
Service needs, barriers and capacity
VR agency data and reports Evaluations of the effectiveness of previous strategies to meet
needs (e.g., why were they effective or ineffective). State and other reports VR counselor survey
Service use; need for additional CRP services. Barriers to CRP services. System capacity for additional CRP services.
CRP supply.
Disability Focus group Navigator/One-Stop/VR focus group Service provider/CRP focus group
Key informants
Hearings
100

4
Exhibit 4.3 is a template showing one way to organize the key findings for each information goal as they are identified in the analysis. This template also can be used in the next step, with findings as a starting point for identifying alternative strategies and actions to reduce the barriers and needs.
To complete this step the findings can be used by the VR and SRC participants to develop recommendations for the state plan in steps 5 and 6.
101

Analyze results
Exhibit 4.1 Template for available statistical table and data resources
Title:
Survey or data form (e.g., ACS 2007, VR agency data):
Source:
URL and download date (if applicable):
Reviewed by, and date reviewed:
Need Assessment information goal(s) to which this information applies:
Information available (summarize tables or information contents):
What is the quality of the information? Any limitations in using?
Reviewer recommendation as source for needs assessment: useful? Why?
Key findings, useful tables and information (add additional pages as needed, examples of information content/tables):
102

4
Exhibit 4.2 Template for content analysis of reports and materials
Title of source:
Author(s):
Publisher
Publication date:
URL and download date (if applicable):
Reviewed by, and date reviewed:
Need Assessment information goal(s) to which this report applies:
Purpose of the document, and intended audience:
Type of report ( e.g., statistical analysis, a literature review, a committee report):
What are the key information sources are used in the report? (e.g., population statistics, agency data, surveys, consumer feedback, other)
What is the quality of the information? Is it reliable and verifiable, or based on unsubstantiated sources?
Reviewer recommendation as source for needs assessment: useful? Why?
Key findings, useful tables and information (add additional pages as needed):
103

Analyze results
Exhibit 4.3 Example template for summarizing needs and barriers (Step 4)
For Step 4 For Step 5 Summary of findings regarding needs
Summary of findings on barriers or suggestions for change
Alternative strategies and actions
Rehabilitation needs of individuals with most significant disabilities, including supported employment
Rehabilitation needs of minorities
Rehabilitation needs of unserved and underserved groups (example entry shown) Example: Data indicate state’s Spanish speaking population is increasing; counselors describe increasing demand for services in Spanish; focus group of Spanish-speaking consumers identifies service delivery issues.
No staff are fluent in Spanish in XX field offices; translators are not available in rural areas; etc.
Rehabilitation needs of individuals with disabilities served through other components of the statewide workforce investment system
Need to establish, develop, or improve community rehabilitation programs within the state
104

5
Step 5. Develop the conclusions: Potential action strategies
Objective: Generate conclusions, synthesizing the results from the different information goals to develop needs assessment findings that will provide the basis for the State Plan goals, priorities, and strategies development in Step 6.
Task Product
Step 5. Develop the conclusions: Potential action strategies
5.1 Establish process for reviewing the results by information goal and across all the questions, and develop alternatives
Alternatives for State Plan goals, priorities, and strategies
5.1 Establish process for reviewing the results by information goal and across all the questions, and develop recommended goals, priorities or strategies
Now that the information has been reviewed and the findings on needs and barriers has been summarized, the next step is to consider the findings and suggest alternatives that can be included in the State Plan to improve the program and reduce the gaps and barriers. Step 4 was the work of analysts with research skills; this step calls for program and policy expertise and for participation by VR managers and SRC members. The goal at this point is to develop a range of potential strategies for each major area of need that has been identified. The list of strategies can start with information that has been identified as part of the needs assessment process.
Develop alternatives. From the needs assessment information collection and from participation by a wide range of VR, SRC and others, a number of potential strategies for consideration should be identified. Sources for strategy candidates may include:
• Literature on evidence-based practices or promising practices for providing VR services to people with significant and most significant disabilities
• Recommendations of key informants
• Internal agency recommendations from VR counselors, supervisors and management
• Suggestions from stakeholders including focus group participants, individuals commenting at hearings and public meetings, and respondents to surveys.
• Evaluation studies conducted by the VR agency, and analysis of VR agency data on consumers served, services provided, and outcomes
• Reports from other related agencies in the state and nationally
105

Develop conclusions
These sources help answer the following questions.
• What successful strategies are already being used in this VR agency? Other VR agencies? What has been tried and proved to be unsuccessful?
• What ideas from other agencies and service programs might suggest an approach in VR?
• What experts can be contacted to learn more about a strategy and how to implement it?
For each major area of need expressed in the Step 4 summary of needs, barriers, and suggestions for improvement, a range of potential action strategies should be generated.
One approach to this process is to hold a meeting or series of meetings where VR leadership, key staff, SRC members and other critical people can consider the ideas that came from the study and then expand the list of alternatives.
Our example (Exhibit 5.1) shows that a number of information sources have pointed to needs for improving services in Spanish. There are several ways that the agency might use to address this; our example shows only a few of the possible ideas – developing relationships with other community organizations, developing written materials on VR services in Spanish, identifying a pool of translators, recruiting Spanish-speaking counselors. There are many more ideas for improving services in Spanish that may come up in the process. This work should be creative, people should be encouraged to think outside the box, and a number of alternatives should be identified for major needs identified in the findings. This is the time for brainstorming and for coming up with a wide range of ideas.
Exhibit 5.1 at the end of this section shows how the template introduced in Step 4 might be used as a way to organize potential action strategies for each need/barrier area. These alternatives will be considered by VR and the SRC in Step 6, informing the state plan goals, priorities, and strategies.
106

5
Exhibit 5.1 Applying Potential Action Strategies to Expressed Needs Example
Step 4 Step 5 Summary of Needs Summary of Barriers and
Suggestions for Improvement Alternative strategies and actions
Rehabilitation needs of individuals with most significant disabilities, including supported employment
Rehabilitation needs of minorities
Rehabilitation needs of unserved and underserved groups (example entry shown) Example: Data indicate state’s Spanish speaking population is increasing; counselors describe increasing demand for services in Spanish; focus group of Spanish-speaking consumers identifies service delivery issues.
No staff are fluent in Spanish in XX field offices; translators are not available in rural areas; etc.
Develop relationships with community organizations. Develop service materials in Spanish. Identify pool of translators. Recruit Spanish-speaking counselors.
Rehabilitation needs of individuals with disabilities served through other components of the statewide workforce investment system
Need to establish, develop, or improve community rehabilitation programs within the state
107

Develop conclusions
(THIS PAGE LEFT INTENTIONALLY BLANK)
108

6
Step 6. Informing state plan, goals, priorities, and strategies
Objective: Recommendations for State Plan
Task Product
Step 6: Informing state plan, goals, priorities, and strategies
6.1 Establish process for developing recommendations: roles, approach, criteria
VR and SRC roles; criteria for recommendations
6.2 Decision-making process: apply criteria to conclusions and develop recommendations
State plan recommendations
6.3 Create State plan attachment 4.11(a) State plan attachment 4.11(a)
6.4 Disseminate results of Needs Assessment study
(products and audiences as defined in dissemination plan)
6.1 Establish process for developing recommendations: approach, criteria
The State Plan shall include the results of the CSNA. The model CSNA has been designed to cast a wide net, identifying needs, gaps and barriers to services, and possible suggestions for improvement. The information collection and analysis Steps 3 and 4 include information from many sources, organized by the information goals. The technical team has provided this information, and worked with agency operations specialists, managers and the SRC to develop a menu of choices for state plan goals, policies and/or strategies in Step 5. Now in Step 6, it is up to VR and SRC decision-makers, meeting together, to consider these potential strategies and develop the study recommendations.
The goal of the meeting will be to identify priority areas for the state plan. One approach to decision-making, using criteria to identify priorities, is described here.
6.2 Decision-making process: applying criteria to conclusions and developing recommendations
Several methods for systematic approaches to using criteria are described in the needs assessment literature (for a summary, see Altschuld, 2000, pp 136-172).
This step is to develop and apply criteria to evaluate proposed strategies. Exhibit 6.1 is an example of how to take alternatives created in Step 5 and apply criteria to ultimately rank
109

Inform state plan
the ideas. Criteria ratings can include scoring schemes, alternate options for each solution, probabilities and more.
Example criteria include:
• feasibility (needed staff skills are available, etc.);
• evidence-based approach;
• importance of problem or issue (areas of need, benefits large numbers of people, benefits those with significant disability, etc.); and
• cost (short and long term).
To apply these criteria, it may be necessary to learn more about candidate strategies and how they are expected to work from the literature or from others who have used them.
Rating criteria in terms of importance or likelihood is one possible method to assist in decision-making about which actions to recommend for the plan. For example, if a proposed action needs staff skills that were not currently on staff and the agency had a known hiring freeze already in place, that proposed action would be an unlikely one to recommend. On the other hand, if a proposed action had the potential to help a very large number of people, that may make it a critical action to propose. The reviewers (state agency managers and SRC members) will know how to rank the criteria in terms of importance.
Once the possible strategies are selected, attention must be given to whether they all reasonably can be done. Before issuing the final state plan recommendations, a final determination of how the set of strategies can fit within agency resources must be made.
6.3 Publish State plan Attachment 4.11(a)
From the initiation of the CSNA process, we have been describing activities that inform State plan Attachment 4.11(a) (See Exhibit .6). This Guide includes a checklist for monitoring whether all CSNA aspects have been completed (Exhibit 6.2). The Guide also includes an example outline for organizing the methods used in the CSNA process, and the results of the CSNA including results, identified service gaps, and implications for the state plan (Exhibit .7).
Results of the CSNA are included in Attachment 4.11(a). If the State conducts CSNA activities on a continuous basis over a three-year period, the CSNA results in Attachment 4.11(a) are updated annually.
110

6
6.4 Disseminate Needs Assessment
Early in the CSNA process audiences and dissemination strategies were identified. Now, with the study and state plan Attachment 4.11a completed, these materials can be made available to the public. The specific distribution will vary depending on agency policy, available media, and the specific dissemination plan developed in Step 2.
111

Inform state plan
Exhibit 6.1 Applying criteria to potential strategies
Step 5 Step 6 – Example Criteria
Potential Action Strategies
feas
ible
?
evid
ence
-bas
ed
appr
oach
?
shor
t-ter
m c
osts
long
-term
cos
ts
impo
rtanc
e of
pro
blem
or
issu
e be
nefit
larg
e nu
mbe
r of
peop
le?
affe
cts t
hose
with
si
gnifi
cant
dis
abili
ty?
need
ed st
aff s
kills
are
av
aila
ble?
time
need
ed to
des
ign
and
impl
emen
t
cost
-eff
ectiv
e?
(Oth
er c
riter
ia)
Rehabilitation needs of individuals with most significant disabilities, including supported employment
Rehabilitation needs of minorities
Rehabilitation needs of unserved and underserved groups (Example entry shown) More Spanish speaking VR, employment, training staff
Rehabilitation needs of individuals with disabilities served through other components of the statewide workforce investment system Need to establish, develop, or improve community rehabilitation programs within the state
112

6
Exhibit 6.2 Checklist
The following checklist can be used to review the methods used and the required topics in the planned CSNA process.
Checklist: CSNA √ Comments
State Population: Census, ACS
Projections of population, economy
VR caseload data, 911, other data
VR Agency reports, internal studies
Reports, surveys from other agencies
Special written or internet surveys
Focus groups
Key informant interviews
Public hearings or discussions
Identifies need for services for most significant disabilities
Identifies need for supported employment
Identifies needs for services for unserved or underserved: minorities
Identifies need for services for specific other unserved or underserved groups
Identifies need to establish, develop, improve CRPs
Identifies need for services for individuals served through state workforce investment system
Involvement of SRC
Involvement of key stakeholders (not just as data respondents)
Shows relationship to State Plan
113

Inform state plan
(THIS PAGE LEFT INTENTIONALLY BLANK)
114

Guide to Assessing VR Needs
Bibliography
Altschuld, J. W., & Witkin, B. R. (2000). From needs assessment to action: Transforming needs into solution strategies. Thousand Oaks, CA: Sage Publications, Inc.
Almis State Projections. (2007). State occupational projections. Retrieved July 17, 2009, from <http://www.projectionscentral.com>
American Association on Health and Disability. (2005). BRFSS state and territory questions concerning disability and activity limitation. Retrieved December 21, 2007, from <http://www.aahd.us/page.php?pname=publications/newsletters/2005/summer/newsFromAAHD3>
AZRSA. (2007). Results of 2006 comprehensive statewide needs assessment of the rehabilitation needs of individuals with disabilities. Retrieved February 6, 2008, from <https://www.azdes.gov/rsa/word/statplan/results_of_comprehensive_statewide_needs_assessment.doc>
Berkowitz, S. (1996a). Creating the research design for a needs assessment. In R. Reviere, S. Berkowitz, C. C. Carter & C. G. Ferguson (Eds.), Needs assessment: A creative and practical guide for social scientists (pp. 15-30). New York: Routledge.
Berkowitz, S. (1996b). Taking the sample survey approach. In R. Reviere, S. Berkowitz, C. C. Carter & C. G. Ferguson (Eds.), Needs assessment: A creative and practical guide for social scientists (pp. 34-51). New York: Routledge.
Berkowitz, S. (1996c). Using qualitative and mixed-method approaches. In R. Reviere, S. Berkowitz, C. C. Carter & C. G. Ferguson (Eds.), Needs assessment: A creative and practical guide for social scientists (pp. 53-70). New York: Routledge.
Bonham, G. S. (2000). A comprehensive assessment of the vocational rehabilitation needs of Maryland citizens with severe disabilities: Executive summary. Retrieved January 2, 2008, from <http://www.bonhamresearch.com/PDF/2000T%20A%20Comprehensive%20Sum.pdf>

Inform state plan
Campbell, P. R. (1996). Population Projections for States by Age, Sex, Race, and Hispanic Origin: 1995 to 2025. Retrieved February 15, 2008, from <http://www.census.gov/population/www/projections/ppl47.html>
Centers for Disease Control. (2006a). Behavioral Risk Factor Surveillance System. Retrieved December 20, 2007, from <http://www.cdc.gov/brfss/about.htm>
Centers for Disease Control. (2006b). Prevalence data. Retrieved July 17, 2009 from <http://apps.nccd.cdc.gov/brfss/index.asp>
Centers for Disease Control (2007). State injury indicators report, Third addition, 2004 data. Retrieved February 29, 2008, from <http://www.cdc.gov/ncipc/profiles/core_state/State_Injury_Indicators_Report.pdf>
Centers for Disease Control. (2008). Questionnaires. Retrieved June 12, 2008, from <http://www.cdc.gov/brfss/questionnaires/questionnaires.htm>
Cole, A. (2003). Arkansas Population Projections: 2003 - 2025. Retrieved February 26, 2008, from <http://cber.uark.edu/Arkansas_Population_Projections_2003-2025.pdf>
Connecticut Bureau of Rehabilitation Services. (2007). State plan for vocational rehabilitation - 2008 (Summary). Retrieved January 2, 2008, from <http://vvv.brs.state.ct.us/PDFs/BRSStatePlan2008.pdf>
Connecticut State Data Center. (2007). 2010 to 2030 population projections for Connecticut. Retrieved February 22, 2008, from <http://ctsdc.uconn.edu/>
Delaware Population Consortium. (2007). Annual population projections. Retrieved February 22, 2008, from <http://stateplanning.delaware.gov/information/dpc/DPC2007v0.pdf>
Erickson, W. A., & Lee, C. G. (2008). 2007 Disability Statistics from the American Community Survey (ACS). Retrieved July 17, 2009, from <http://www.disabilitystatistics.org>
Florida Legislature Office of Economic & Demographic Research. (2007). Data from the Demographic Estimating Conference Database Retrieved February 26, 2008, from <http://edr.state.fl.us/population.htm>
Garfin, E., & Dickson, J. (2004). Needs assessment report: Vocational rehabilitation needs of Vermonters with disabilities
ii

Georgia Office of Planning and Budget. (2005). Georgia 2015. Retrieved February 26, 2008, from <http://www.opb.state.ga.us>
Gollay, E. (1981). Estimates of the size and characteristics of the non-institutionalized developmentally disabled population in the United States. Santa Fe, NM: Gollay and Associates.
Government Accountability Office. (2007). Workforce Investment Act: One-stop system infrastructure continues to evolve, but Labor should take action to require that all employment services offices are part of the system (GAO-07-1096). Retrieved December 28, 2007, from <http://www.gao.gov/new.items/d071096.pdf>
Grayson, T. E. (2002). Needs assessment: A mini-workshop on needs assessment.
Hager, R. (2004). Policy and practice brief: Order of selection for Vocational Rehabilitation services: An option for state VR agencies who cannot serve all eligible individuals. Retrieved January 17, 2008, from <http://digitalcommons.ilr.cornell.edu/cgi/viewcontent.cgi?article=1058&context=edicollect>
Hamilton, G. L. (2005). Cohort-component population projections for Arkansas by county, race, age, and gender 2005-2030. Retrieved February 26, 2008, from <http://www.aiea.ualr.edu/research/demographic/population/Proj.pdf>
Harlow, K.S., & Turner, M. (1993). State units and convergence models: Needs assessment revisited. The Gerontologist, 33(2), 190-199.
Human Services Research Institute. (2004). Employment for all: Statewide needs assessment related to the unmet needs of Maryland citizens with disabilities. Retrieved January 2, 2008, from <http://www.dors.state.md.us/NR/rdonlyres/53246D21-94E8-4ECE-8078-742999538A9B/0/Needs_ExecSumm.pdf>
Illinois Department of Commerce and Economic Development. (2005). Population projections. Retrieved February 26, 2008, from <http://www.commerce.state.il.us/dceo/Bureaus/Facts_Figures/Population_Projections/>
Institute for Community Inclusion. (n.d.). StateData.info. Retrieved May 23, 2008, from <http://www.statedata.info/>
iii

Inform state plan
Johnson, D. & Meiller, L. (1987). Community level surveys. In D. Johnson, L. Meiller, L. Miller, & G. Summers (Eds.), Needs assessment: Theory and methods pp. 126-141). Ames: Iowa State University Press.
Kaufman, R. (1992). Strategic planning plus: An organizational guide. Newbury Park, CA: Sage Publications.
Lareau, L. (1983). Needs assessment of the elderly: Conclusions and methodological approaches. The Gerontologist, 23(5), 518-526.
Larson, S. A., Lakin, K. C., Anderson, L., Kwak, N., Lee, J. H., & Anderson, D. (2001). Prevalence of mental retardation and developmental disabilities: Estimates from the 1994/1995 National Health Interview Survey Disability Supplements. American Journal on Mental Retardation, 106(3), 231-252.
Massachusetts Rehabilitation Commission. (2007). Vocational rehabilitation consumer needs survey.
McKillip, J. (1987). Needs analysis: Tools for the human services and education. Newbury Park, CA: Sage.
Minnesota State Demographic Center. (2005). Minnesota Population Projections by Race and Hispanic Origin 2000–2030. Retrieved February 15, 2008, from <http://www.demography.state.mn.us/DownloadFiles/PopulationProjectionsRaceHispanicOrigin.pdf>
Mississippi Institutions of Higher Learning Office of Policy Research and Planning. (2009). Mississippi population projections 2015, 2020 and 2025. Retrieved July 17, 2009, from <http://www.ihl.state.ms.us/urc/downloads/PopulationProjections_092008.pdf>
New Jersey Department of Labor and Workforce Development. (2006). Projections 2014: New Jersey employment and population in the 21st century. Retrieved February 22, 2008, from <http://www.wnjpin.state.nj.us/OneStopCareerCenter/LaborMarketInformation/lmi03/Projection%202014%20WEB.pdf>
North Carolina State Demographics. (2007). County/state population projections. Retrieved February 22, 2008, from <http://demog.state.nc.us/frame_start.html>
Oregon State Rehabilitation Council and Office of Vocational Rehabilitation Services. (2008). 2008 client consumer satisfaction survey. Retrieved June 20, 2008, from <http://www.oregon.gov/DHS/vr/oregonrehabcncl/index.shtml#cssr>
iv

Program and Policy Insight LLC. (2007). Comprehensive needs assessment for Oregon Department of Human Services office of Vocational Rehabilitation Services: Executive summary to the final report. Eugene, OR: Author.
Region V Study Group. (1991a). Rehabilitation needs assessment for Vocational Rehabilitation Agencies. Volume I: Needs assessment topics identified in the Rehabilitation Act: Issues and resources. Retrieved January 2, 2008, from <http://www.eric.ed.gov/ERICDocs/data/ericdocs2sql/content_storage_01/0000019b/80/23/4a/6b.pdf>
Regional V Study Group. (1991b). Rehabilitation needs assessment for Vocational Rehabilitation Agencies. Volume II: A guide to needs assessment in Rehabilitation Agency planning. Retrieved January 2, 2008, from <http://www.eric.ed.gov/ERICDocs/data/ericdocs2sql/content_storage_01/0000019b/80/23/4a/61.pdf>
Rehabilitation Services Administration. (2001). Priorities: Capacity Building for Traditionally Underserved Populations Retrieved June 26, 2008, from <http://www.ed.gov/legislation/FedRegister/proprule/2001-4/112801b.html>
Rehabilitation Services Administration. (2006a). Client assistance program. Retrieved February 13, 2008, from <http://www.ed.gov/programs/rsacap/index.html>
Rehabilitation Services Administration. (2006b). Announcement of OMB Approval for Report Form RSA-227, Annual Client Assistance Program (CAP) Report. Retrieved February 13, 2008, from <http://www.ed.gov/policy/speced/guid/rsa/pd-06-05.pdf>
Rehabilitation Services Administration. (2007a). RSA: FY 2007 Monitoring reports on the Vocational Rehabilitation and Independent Living Programs. Retrieved December 15, 2007, from <http://www.ed.gov/rschstat/eval/rehab/107-reports/2007/index.html>
Rehabilitation Services Administration. (2007b). RSA annual review report: Appendix B. Retrieved December 17, 2007, from <http://www.ed.gov/rschstat/eval/rehab/rsamis/ann_appendix_b.html>
Rehabilitation Services Administration. (2007c). Supported employment state grants: Awards. Retrieved December 20, 2007, from <http://www.ed.gov/programs/rsasupemp/awards.html>
v

Inform state plan
Rehabilitation Services Administration. (2007d). RSA: Promising practices for VR agencies. Retrieved January 12, 2008, from <http://www.ed.gov/rschstat/eval/rehab/promising-practices/index.html>
Rehabilitation Services Administration. (2007e). Developing a model comprehensive statewide needs assessment with corresponding training materials for State VR agency staff and SRC members: Request for proposal.
Rehabilitation Services Administration. (2008a). RSA Management Information System main menu. Retrieved January 17, 2008, from <http://RSAMIS.ed.gov>
Rehabilitation Services Administration. (2008b). Client Assistance Programs: Awards. Retrieved February 13, 2008, from <http://www.ed.gov/programs/rsacap/awards.html>
Reviere, R., Berkowitz, S., Carter, C.C., & Ferguson, C. G. (1996a). Needs assessment: A creative and practical guide for social scientists. New York: Routledge.
Reviere, R., Berkowitz, S., Carter, C. C., & Ferguson, C. G. (1996b). Introduction: Setting the stage. In R. Reviere, S. Berkowitz, C. C. Carter & C. G. Ferguson (Eds.), Needs assessment: A creative and practical guide for social scientists (pp. 1-12). New York: Routledge.
Reviere, R., & Carter, C. C. (1996). Planning a needs assessment. In R. Reviere, S. Berkowitz, C. C. Carter & C. G. Ferguson (Eds.), Needs assessment: A creative and practical guide for social scientists (pp. 71-89). New York: Routledge.
Rhode Island Department of Human Services. (2005). 2005 Needs assessment report: Vocational rehabilitation needs of Rhode Islanders with disabilities. Retrieved January 2, 2008, from <http://www.ors.state.ri.us/Pdffiles/2005%20Comprehensive%20Needs%20Assessment.pdf>
Ryskulova, A., Turczyn, K., Makuc, D. M., Cotch, M. F., Klein, R. J., & Janiszewski, R. (2008). Self-reported age-related eye diseases and visual impairment in the United States: Results of the 2002 National Health Interview Survey. American Journal of Public Health, 98(3), 454-461.
Siegfried, T., Tucker, M., Curiel, A. P. B., & Siegel, S. (2007). California Department of Rehabilitation & State Rehabilitation Council Statewide Needs Assessment Final Report, 2006-2007. San Diego, CA: San Diego State University Interwork Institute.
vi

Social Security Administration. (2009a). Annual Statistical Supplement to the Social Security Bulletin, 2008. Retrieved July 17, 2009, from <http://www.ssa.gov/policy/docs/statcomps/supplement/2008/>
Social Security Administration. (2009b). Ticket tracker. Retrieved July 17, 2009, from <http://www.socialsecurity.gov/work/tickettracker.html>
Soriano, F. I. (1995). Conducting needs assessments: A multidisciplinary approach. Thousand Oaks, CA: Sage Publications Inc.
State of California Department of Finance. (2007). Race/Ethnic Population with Age and Sex Detail, 2000–2050. Retrieved February 15, 2008, from <http://www.dof.ca.gov/html/DEMOGRAP/Data/RaceEthnic/Population-00-50/RaceData_2000-2050.php>
State of Vermont Division for the Blind. (2006). Results of the comprehensive statewide assessment (FY 2004 – FY 2006). Retrieved March 5, 2008, from <http://www.dad.state.vt.us/dbvi/Attachment4-11-StateWideAssessment.htm>
State of Washington Office of Financial Management. (2006). Projections of the state population by age, gender and race/ethnicity: 2000-2030. Retrieved February 26, 2008, from <http://www.ofm.wa.gov/pop/race/methodology_0306.pdf>
Steinmetz, E. (2006). Americans with disabilities: 2002. Current Population Reports, P70-107. Retrieved January 10, 2008, from <http://www.sipp.census.gov/sipp/p70s/p70-107.pdf>
Substance Abuse and Mental Health Services Administration (SAMHSA). (2000). State Profiles, 2000, on Public Sector Managed Behavioral Health Care. Retrieved May 16, 2008, from <http://www.hrsa.gov/reimbursement/TA-materials.htm>
Substance Abuse and Mental Health Services Administration (SAMHSA) Office of Applied Studies. (2008). State mental health data by year. Retrieved May 15, 2008, from <http://www.oas.samhsa.gov/statesMH.cfm>
Texas Population Projections Program. (2009). 2005 - 2040 population projections. Retrieved July 17, 2009, from <http://txsdc.utsa.edu/tpepp/2008projections/>
U.S. Census Bureau. (1996). Projected State Populations, by Sex, Race, and Hispanic Origin: 1995-2025. Retrieved February 15, 2008, from <http://www.census.gov/population/projections/state/stpjrace.txt>
vii

Inform state plan
U.S. Census Bureau. (2004). Model-based estimates of the prevalence of specific disabilities by state and county: A note on methodology. Retrieved January 15, 2008, from <http://www.census.gov/hhes/www/disability/census/method.html>
U.S. Census Bureau. (2006a). Comparison of SIPP with other surveys. Retrieved January 9, 2008, from <http://www.bls.census.gov/sipp/vs.html>
U.S. Census Bureau. (2006b). Overview of the Survey of Income and Program Participation (SIPP). Retrieved January 10, 2008, from <http://www.census.gov/sipp/overview.html>
U.S. Census Bureau. (2006c). The American Community Survey. About page. Retrieved June 10, 2008, from <http://www.cdc.gov/brfss/about.htm>
U.S. Census Bureau. (2006d). 2006 subject definitions: American Community Survey and Puerto Rico Community Survey. Retrieved December 27, 2007, from <http://www.census.gov/acs/www/Downloads/2006/usedata/Subject_Definitions.pdf>
U.S. Census Bureau. (2007a). 2006 guide to the data products: Topic search results - Disability. Retrieved December 27, 2007, from <http://www.census.gov/acs/www/acs-php/2006_experienced_users_guide.php?acs_topic=Disability>
U.S. Census Bureau. (2007b). The American Community Survey 2006 at a glance. Retrieved December 27, 2007, from <http://www.census.gov/acs/www/Downloads/2006_ACS_At_A_Glance.pdf>
U.S. Census Bureau. (2007e). About population projections. Retrieved February 22, 2008, from <http://www.census.gov/population/www/projections/aboutproj.html>
U.S. Census Bureau. (2008a). Public use microdata sample file: American Community Survey. Retrieved June 10, 2008, from <http://www.census.gov/acs/www/UseData/Compass/handbook_def.html#pums>
U.S. Census Bureau. (2008b). 2005-2007 guide to the data products: Topic search results - Disability. Retrieved July 17, 2009, from <http://www.census.gov/acs/www/acs-php/2005_2007_experienced_users_guide.php?acs_topic=Disability>
U.S. Census Bureau. (2008c). The American Community Survey. What General Data Users Need to Know Retrieved July 17, 2009, from <http://www.census.gov/acs/www/Downloads/ACSGeneralHandbook.pdf>
viii

U.S. Census Bureau. (2008d). The American Community Survey. Main page. Retrieved June 10, 2008, from <http://www.census.gov/cps/>
U.S. Department of Education Office for Civil Rights. (2005). Students protected under Section 504. Retrieved January 28, 2008, from <http://www.ed.gov/about/offices/list/ocr/504faq.html#protected>
U.S. Department of Education Office for Civil Rights. (2007). Civil rights data. Retrieved May 20, 2008, from <http://www.ed.gov/about/offices/list/ocr/data.html?src=rt>
U.S. Department of Education Office of Special Education and Rehabilitative Services (OSERS). (2008a). 28th Annual (2006) Report to Congress on the Implementation of the Individuals with Disabilities Education Act, Vol 1. Retrieved January 23, 2008, from <http://www.ed.gov/about/reports/annual/osep/2006/parts-b-c/28th-vol-1.pdf>
U.S. Department of Education Office of Special Education and Rehabilitative Services (OSERS). (2008b). 28th Annual (2006) Report to Congress on the Implementation of the Individuals with Disabilities Education Act, Vol 2. Retrieved January 23, 2008, from <http://www.ed.gov/about/reports/annual/osep/2006/parts-b-c/28th-vol-2.pdf>
U.S. Department of Labor. (2007a). Federal research and evaluation database. Retrieved December 28, 2007, from <http://www.fred-info.org/WIA.htm>
U.S. Department of Labor. (2007b). Program and record-keeping information: WIA. Retrieved January 18, 2008, from <http://www.doleta.gov/Performance/Reporting/eta_default.cfm>
Utah State Office of Rehabilitation (2009). Program evaluation and quality assurance manual. Retrieved July 20, 2009, from <http://media.ncrtm.org/presentations/QA/UTmanual.pdf>
Warheit, G. Bell, R., & Schwab, J. (1979). Needs assessment approaches: Concepts and methods. Rockville, MD. National Institute of Mental Health, U.S. Department of Health, Education and Welfare.
Western Management Services. (2007). Wyoming assessment of rehabilitation needs. Retrieved February 11, 2008, from <http://wyomingworkforce.org/resources/publications.aspx>
ix

Inform state plan
Witkin, B. R., & Altschuld, J. W. (1995). Planning and conducting needs assessments: A practical guide. Newbury Park, CA: Sage Publications.
World Institute on Disability. (2007). Disability benefits 101: Social Security's Ticket to work
Wyoming Division of Vocational Rehabilitation, (2007). Wyoming assessment of rehabilitation needs.
x

Developing a Model Comprehensive Statewide Needs Assessment With Corresponding Training Materials
For State VR Agency Staff and SRC Members:
The VR Needs Assessment Guide
Volume II - Appendices
Submitted to: Rehabilitation Services Administration
Janette Shell, COR
Submitted by: InfoUse
2560 9th Street, Suite 320 Berkeley, CA 94710
November 30, 2009
This report was produced under U.S. Department of Education Contract No. ED04CO0106 with InfoUse. Janette Shell served as the contracting officer’s technical representative. The views expressed herein do
not necessarily represent the positions or policies of the Department of Education. No official endorsement by the U.S. Department of Education of any product, commodity, service or enterprise mentioned in this
publication is intended or should be inferred.
xi

Guide to Assessing VR Needs
Appendices Contents
APPENDIX A: DISABILITY POPULATION STATISTICS ..................................................... A-1 American Community Survey (ACS) .......................................................................... A-1 Examples of available ACS state and sub-state data ................................................... A-3 Current Population Survey (CPS) .............................................................................. A-18 Behavioral Risk Factor Surveillance Survey (BRFSS) Brief Description ................. A-18 How to Use the BRFSS .............................................................................................. A-19 Examples of BRFSS Disability Questions ................................................................. A-20
APPENDIX B: DISABILITY POPULATION ESTIMATES ...................................................... B-1 Estimating Subpopulations of Disabilities ....................................................................B-7
APPENDIX C: PROJECTIONS OF STATE POPULATION AND LABOR AND ECONOMIC FORECASTS ................................................................................................................ C-1 Population Projections ..................................................................................................C-1 Examples of Population Projection Data Available for All States ...............................C-1 Examples of Recent Population Projections Available for Some States ......................C-3 Employment and labor force forecasts ..........................................................................C-5 Examples of Available Data .........................................................................................C-5 Other Sources of Data on Labor and Economic Projections ........................................C-8
APPENDIX D: VR AGENCY DATA ................................................................................. D-1 VR program data examples and required state reports ................................................ D-1 VR Counselors and staff stakeholder surveys and interviews ..................................... D-7
APPENDIX E: STATE-LEVEL DATA FROM NATIONAL PROGRAMS ................................... E-1 Individuals with Disabilities Education Act (IDEA) .................................................... E-1 IDEA Data Examples .................................................................................................... E-2 Section 504 Data ........................................................................................................... E-7 Section 504 Data Example ............................................................................................ E-8 Social Security Data ...................................................................................................... E-8 Social Security Data Examples ................................................................................... E-10 Workforce Investment Act (WIA) Data ...................................................................... E-14
APPENDIX F: STATE AND SUB-STATE REPORTS AND OTHER MATERIALS ...................... F-1 State and Sub-state Reports and Other Materials.......................................................... F-1
APPENDIX G: INPUT FROM STAKEHOLDERS .................................................................. G-1 Surveys ......................................................................................................................... G-1 Focus Groups ............................................................................................................... G-3 Key Informant Interviews ............................................................................................ G-5 Community hearings .................................................................................................... G-6
APPENDIX H: MINORITIES AND UNSERVED OR UNDERSERVED GROUPS ....................... H-1 Examples of Potentially Unserved or Underserved Groups ........................................ H-2
APPENDIX I – LITERATURE REVIEW ................................................................................ I-1 Conclusions .................................................................................................................... I-4

Appendix A Guide to Assessing VR Needs
APPENDIX J – REVIEWS OF STATE NEEDS ASSESSMENTS ............................................... J-5
Appendix A: Disability Population Statistics
In order to assess the rehabilitation needs of people with disabilities at the state level it is essential to gain an overall picture of the distribution and characteristics of the population of people with disabilities in the state. The American Community Survey (ACS) provides existing state and substate data on disability and other demographic characteristics of the state population. For the Comprehensive Statewide Needs Assessment (CSNA) the ACS provides estimates of the disability population, employment, and language spoken. Starting in 2009 the Current Population Survey (CPS) will provide another source of data that will use the ACS questions of disability together with labor force questions. The Behavioral Risk Factor Surveillance System (BRFSS) is an optional method that includes an existing sampling frame for gathering more in-depth state-level data from a representative sample of people with disabilities in the state.
American Community Survey
The ACS is an annual survey of social, economic, housing and demographic characteristics, including disability. The ACS is the largest household survey in the United States, with an annual sample size of about 3 million addresses. The ACS was developed to replace the long form of the Decennial Census, which provided detailed information on geographical areas every 10 years. The ACS, however, can provide single-year estimates each year for geographic population areas of 65,000 or more people and will accumulate 3- and 5-year samples to produce estimates for smaller geographic areas, including census tracts and block groups (U.S. Census Bureau, 2008c). The ACS will provide 3-year-period estimates for areas with populations of 20,000 or more starting in 2008 and 5-year estimates in 2010 (U.S. Census Bureau, 2008c). In 2006 data collection began in group quarters, which include institutions such as correctional facilities and nursing homes as well as group living situations such as college dormitories and group homes (U.S. Census Bureau, 2008c). The ACS supports state and community planning by providing the information for local geographic units. Full implementation of the ACS began in 2005 in every county nationwide. Data products for the 2007 survey were released in late 2008.
The ACS provides:
• an overall picture of disability;
• demographic characteristics of the state;
A- 1

Inform state plan
• substate regions, such as metropolitan areas, larger counties, and other geographic areas;
• languages other than English that are spoken in the state; and
• most significant disability, depending on how a state defines most significant (e.g., self-care disabilities, people with two or more ACS disabilities, and people who receive SSI and/or SSDI).
There are three major sources to obtain information about the disability population from the ACS.
American FactFinder. The American FactFinder Web site <http://factfinder.census.gov> includes data from the ACS as well as other Census surveys. The Web site includes technical information on the data, the survey questionnaire, updates on technical questions, the public use data sets, and pre-designed tables and maps that can be obtained for state and substate levels (substate population units of 65,000 and above for 2007 ACS).
The American FactFinder Web site includes a number of ways to access information from the ACS. The following national, state and substate tables and maps are most pertinent to the CSNA:
• Data Profile (quick snapshot of the state in terms of population, types of households, marital status, fertility, school enrollment, educational attainment, veteran status, disability status, place of birth, and language spoken)
• Subject Tables – Disability
• Disability Characteristics (Table S1801). This table includes population by age group by sensory, physical, mental, self-care, go-outside-house and employment disabilities. A sample S1801 table is included below.
• Selected Economic Characteristics for the Civilian Non-institutionalized Population By Disability Status (Table S1802). This table includes information on people with and without disabilities, 16 years and over, including: employed, not in labor force, class of worker (private, government, self-employed, etc.), occupation, industry, method of commuting to work, educational attainment (25 years and older), earnings in past 12 months, and poverty status in past 12 months. A sample S1802 table is included below.
• Characteristics of People by Language Spoken at Home (Table S1603). A sample S1603 table is included below.
• Language Spoken at Home (S1601). A sample S1601 table is included below.
• Ranking Tables – Disability
2

Appendix A Guide to Assessing VR Needs
• Percent of People 21 to 64 Years Old With a Disability (R1802). This table lists in rank order, from highest to lowest, the percent of people in each state age 21-64 with a disability as well as the percent for the entire U.S.
• Detailed Tables (all of the disability tables are listed below)
• The American FactFinder Web site also allows users to download Public Use Microdata Sample (PUMS) files, which are a sample of the actual responses to the American Community Survey and include most population and housing characteristics. These files provide users with the flexibility to prepare customized tabulations and can be used for detailed research and analysis. Files have been edited to protect the confidentiality of all individuals and of all individual households. For an overview of the file, please see: <http://www.census.gov/acs/www/Products/PUMS/index.htm> (U.S. Census Bureau, 2008a).
All tables can be downloaded and saved in a various formats including comma separated and Excel.
Examples of available ACS state and substate data
American FactFinder:
Table on disability characteristics S1801.
The American FactFinder subject table, S1801, includes summary information about the characteristics of the disability population. Table S1801 is available for state and substate areas. This table includes:
• percentage of the total population that has no disability, one disability, and two or more disabilities;
• percentage of the working-age (16-64 years) population that has any disability, sensory, physical, mental, go-outside-home, self care and employment disabilities; and
• the number and percentage that are employed among working-age people (16-64 years) with any disability and each of the six disabilities mentioned above.
Table S1801 also includes information on poverty status and other demographics.
Exhibit A-1 shows a screen shot of Table S1801 for Oregon as an example. The exhibit shows the total population 5 years and over (as well as male and female), and percents for those with and without any disability, with one type of disability, and with two or more types of disabilities. The table also contains population totals and male and female totals for the population 5-15 years, 16-64 years, and 65 and over, along with percentages for
A- 3

Inform state plan
with any disability, with a sensory disability, with a physical disability, with a mental disability, with a self-care disability, with a go-outside the home disability (for the latter two age groupings), and with an employment disability (for the 16-64 year age group).
4

Appendix A Guide to Assessing VR Needs
Exhibit A-1 Table S1801, Disability Characteristics, for Oregon, 2007American Community Survey
Oregon S1801: Disability Characteristics Data Set: 2007 American Community Survey 1-Year Estimates Geographic Area: Oregon
NOTE. For information on confidentiality protection, sampling error, nonsampling error, and definitions, see
Survey Methodology.
Subject Total Margin of
Male Margin of
Female Margin of
Population 5 years and over 3 468 683 +/ 1 641 1 708 927 +/ 3 471 1 759 756 +/ 3 265 Without any disability 83 6% +/ 0 3 84 0% +/ 0 4 83 2% +/ 0 4 With one type of disability 7 3% +/ 0 2 7 6% +/ 0 3 7 1% +/ 0 3 With two or more types of disabilities 9 1% +/ 0 3 8 4% +/ 0 4 9 7% +/ 0 3
Population 5 to 15 years 524 043 +/ 3 963 269 856 +/ 2 673 254 187 +/ 3 038
With any disability 7 0% +/ 0 7 8 7% +/ 0 9 5 2% +/ 0 8 With a sensory disability 1 0% +/ 0 2 1 0% +/ 0 3 1 1% +/ 0 3 With a physical disability 1 1% +/ 0 2 1 1% +/ 0 3 1 1% +/ 0 4 With a mental disability 5 9% +/ 0 6 7 5% +/ 0 9 4 3% +/ 0 8 With a self care disability 1 0% +/ 0 2 1 1% +/ 0 3 0 8% +/ 0 3
Population 16 to 64 years 2 470 203 +/ 4 099 1 229 431 +/ 3 336 1 240 772 +/ 3 514
With any disability 13 5% +/ 0 4 13 5% +/ 0 5 13 6% +/ 0 5 With a sensory disability 3 3% +/ 0 2 3 9% +/ 0 3 2 7% +/ 0 3 With a physical disability 7 9% +/ 0 3 7 5% +/ 0 4 8 2% +/ 0 4 With a mental disability 5 5% +/ 0 3 5 4% +/ 0 3 5 5% +/ 0 4 With a self care disability 2 2% +/ 0 2 2 0% +/ 0 2 2 4% +/ 0 2 With a go outside home disability 3 3% +/ 0 2 2 7% +/ 0 2 3 9% +/ 0 3 With an employment disability 7 8% +/ 0 3 7 4% +/ 0 4 8 1% +/ 0 4
Population 65 years and over 474 437 +/ 2 315 209 640 +/ 2 025 264 797 +/ 1 829
With any disability 42 2% +/ 1 0 40 5% +/ 1 5 43 4% +/ 1 2 With a sensory disability 17 7% +/ 0 7 20 1% +/ 1 0 15 9% +/ 1 0 With a physical disability 31 9% +/ 0 9 28 6% +/ 1 4 34 6% +/ 1 2 With a mental disability 13 9% +/ 0 7 12 2% +/ 1 1 15 3% +/ 1 0 With a self care disability 10 6% +/ 0 8 8 6% +/ 1 0 12 2% +/ 0 9 With a go outside home disability 17 0% +/ 0 8 12 4% +/ 1 2 20 6% +/ 1 0
EMPLOYMENT STATUS
Population 16 to 64 years 2 470 203 +/ 4 099 1 229 431 +/ 3 336 1 240 772 +/ 3 514 With any disability 333 755 +/ 9 162 165 469 +/ 6 513 168 286 +/ 6 412
Employed 40 3% +/ 1 6 43 3% +/ 2 1 37 4% +/ 2 1 With a sensory disability 80 318 +/ 5 178 47 356 +/ 3 518 32 962 +/ 3 605
Employed 50 8% +/ 3 0 52 9% +/ 3 8 47 8% +/ 4 0 With a physical disability 193 961 +/ 7 501 92 157 +/ 5 075 101 804 +/ 4 648
Employed 35 5% +/ 1 9 38 2% +/ 2 7 33 1% +/ 2 4 With a mental disability 134 654 +/ 6 313 66 625 +/ 4 073 68 029 +/ 4 366
A- 5

Inform state plan
6

Appendix A Guide to Assessing VR Needs
Table on disability employment and other economic characteristics S1802.
The second relevant subject table in the American FactFinder is Table S1802, which summarizes selected economic characteristics of the population by disability status. This table is available by state and for substate population areas of 65,000 or more. This table includes:
• For the population 16 years and over, how many and what percentage are employed and how many and what percentage are not in the labor force (neither working, not looking for work) with a disability and no disability?
• What is the educational attainment of the population 25 years and over with a disability and no disability?
• What are the earnings of people 16 years and over with a disability and no disability?
Table S1802 also provides information on classes, occupations and industries of workers with and without disabilities, the means of commuting to work for workers with and without disabilities, and the poverty status for people 16 years and over, with and without disabilities.
An example from Table S1802 for the state of Kansas is shown below in Exhibit A-2. The exhibit shows portions of the table that contain information about the total civilian noninstitutionalized population age 16 and over and columns for the population with and without a disability along with percentages for those employed and those not in the labor force and the resulting total number of those employed age 16 and over. A second portion of the exhibit shows the population age 25 and over, and columns for the population with and without a disability, along with percentages of educational attainment as less than high school graduate, high school graduate (includes equivalency), some college or associate’s degree, and bachelor’s degree or higher. Also shown are the earnings in the past 12 months (in 2007 inflation adjusted dollars) for the population age 16 and over with earnings with percentages for those earning $1-$9,999 or less, $10,000-$14,999, $15,000-$24,999, $25,000-$34,999, $35,000-$49,999, $50,000-$74,999, and $75,000 or more.
A- 7

Inform state plan
Exhibit A-2 Table S1802, Selected Economic Characteristics, Kansas, 2007 American Community Survey
Kansas S1802: Selected Economic Characteristics for the Civilian Noninstitutionalized Population By Disability Status
Data Set: 2007 American Community Survey 1-Year Estimates
Survey: American Community Survey
NOTE. For information on confidentiality protection, sampling error, nonsampling error, and definitions, see Survey
Methodology.
Subject Total Civilian
Margin of
With a
Margin
No
Margin of
ACS PUMS data. While the ACS tables provide a valuable resource for state and substate disability measures, these estimates do not specifically identify the subpopulation that would be eligible for VR services. The ACS estimate that might best provide a measure of the population in need of VR services would be the population with a disability in the state that is not currently employed and is looking for work (in the labor force, not employed.) However, this subgroup is not identified specifically in the available ACS tables. The ACS Public Use Microdata Samples (PUMS) is available in the FactFinder and may be used to conduct custom analyses from ACS data.
8

Appendix A Guide to Assessing VR Needs
Tables on racial and ethnic minorities. There are a number of possible sources for data on racial and ethnic minorities by disability from the ACS, including American FactFinder, the Cornell Disability Statistics Web site and the Center for Personal Assistance Services (PAS) Web site. American FactFinder provides data from which a table may be constructed that shows the number of people with disabilities, ages 16 to 64 years, who are not employed, by racial and ethnic group.
The following sample table (Exhibit A-3) was constructed using data from 10 different American FactFinder tables - C18020, C18020A, C18020B, C18020C, C18020D, C18020E, C18020F, C18020G, C18020H, C18020I. These tables provide data on noninstitutionalized people with a disability and not employed in Oregon, ages 16 – 64 years, by race and ethnicity, estimates from the 2006 American Community Survey:
Exhibit A-3 Sample Table, Number and Percentage of People with a Disability who are not Employed, Oregon 2006 ACS
ACS OREGON 2006
With a disability and not employed (Thousands)
Percentage of total with a disability and not
employed
Total (16 - 64 years) 198 100.0%
Race (16 - 64 years)
White 172 87.1%
African American 5 2.5%
Asian/Pacific Islander 4 1.8%
American Indian/Alaska Native 4 2.0%
Some other race(s) 4 1.9%
Two or more races 9 4.6%
Ethnicity (16 - 64 years)
Hispanic 11 5.7%
This table provides a means to compare the ethnic and racial composition of people with disabilities in the state overall and those who are not employed to identify need for employment services.
Tables on languages spoken. American FactFinder includes a number of tables that have information on languages spoken. For example, Table S1601 is a table on languages spoken at home and Table S1603 presents information on characteristics of people by
A- 9

Inform state plan
languages spoken at home. American FactFinder also includes other geographical comparison tables (GCT) and ranking tables on languages spoken at home that provide additional information and comparisons. Table B16001, “Language spoken at home by ability to speak English for the population 5 years and older” presents information about the number of people in the state who speak languages other than English at home, which languages they speak and how many speak English “less than very well.” Exhibit A-4 shows a portion of a sample table for New York:
Exhibit A-4 Table B16001, Languages Spoken at Home by Ability to Speak English, New York, 2007 ACS
B16001. LANGUAGE SPOKEN AT HOME BY ABILITY TO SPEAK ENGLISH FOR THE POPULATION 5 YEARS AND OVER - Universe: POPULATION 5 YEARS AND OVER Data Set: 2007 American Community Survey 1-Year Estimates Survey: American Community Survey
NOTE. Although the American Community Survey (ACS) produces population, demographic and housing
unit estimates, it is the Census Bureau's Population Estimates Program that produces and disseminates the
official estimates of the population for the nation, states, counties, cities and towns and estimates of housing
units for states and counties.
For information on confidentiality protection, sampling error, nonsampling error, and definitions, see Survey
Methodology.
N Y k E ti t M i f E
T t l 18 097 578 +/ 2 470 S k l E li h 12 868 476 +/ 34 152 S i h S i h C l 2 556 829 +/ 15 994
S k E li h " ll" 1 345 191 +/ 17 937 S k E li h l th " ll" 1 211 638 +/ 19 001
F h (i l P t i C j ) 134 405 +/ 8 654 S k E li h " ll" 96 083 +/ 6 833 S k E li h l th " ll" 38 322 +/ 4 384
F h C l 140 275 +/ 11 554 S k E li h " ll" 90 930 +/ 8 060 S k E li h l th " ll" 49 345 +/ 5 658
It li 234 697 +/ 10 305 S k E li h " ll" 158 378 +/ 7 864 S k E li h l th " ll" 76 319 +/ 4 852
P t P t C l 43 130 +/ 5 838 S k E li h " ll" 24 339 +/ 4 304 S k E li h l th " ll" 18 791 +/ 3 593
G 64 761 +/ 4 422 S k E li h " ll" 53 245 +/ 4 041 S k E li h l th " ll" 11 516 +/ 1 808
Yiddi h 124 722 +/ 11 122 S k E li h " ll" 83 863 +/ 9 346 S k E li h l th " ll" 40 859 +/ 5 327
Oth W t G i l 14 027 +/ 2 576 S k E li h " ll" 10 572 +/ 1 967 S k E li h l th " ll" 3 455 +/ 1 335
S di i l 8 875 +/ 1 794 S k E li h " ll" 7 407 +/ 1 473
10

Appendix A Guide to Assessing VR Needs
S k E li h l th " ll" 1 468 +/ 717 G k 72 818 +/ 8 690
S k E li h " ll" 48 754 +/ 6 792 S k E li h l th " ll" 24 064 +/ 3 443
R i 226 535 +/ 13 435 S k E li h " ll" 97 354 +/ 9 252 S k E li h l th " ll" 129 181 +/ 7 598
Once downloaded, this table may be sorted by the linguistic groups that speak English less than very well to determine which groups may have the most need for materials and services in their native language. The language tables also are available by substate regions, which can assist in planning for local needs.
List of Additional Disability Tables Available at American FactFinder. The 2007 Data Products Details (U.S. Census Bureau, 2008b) lists 45 tables concerning disability that are available in American FactFinder and shown in the list below. These tables are available by state and substate regions. There are also other tables that are expanded or condensed versions of these tables. For example Table C18001 is a condensed version of Table B18001 (the first table listed below). C18001 contains the same basic information as B18001 but with less disaggregation by age group.
Exhibit A-5 Tables on Disability in American FactFinder
B18001 Sex by Age by Number of Disabilities for the Civilian Noninstitutionalized Population 5 Years and Over
B18002 Sex by Age by Disability Status for the Civilian Noninstitutionalized Population 5 Years and Over
B18003 Sex by Age by Sensory Disability for the Civilian Noninstitutionalized Population 5 Years and Over
B18004 Sex by Age by Physical Disability for the Civilian Noninstitutionalized Population 5 Years and Over
B18005 Sex by Age by Mental Disability for the Civilian Noninstitutionalized Population 5 Years and Over
B18006 Sex by Age by Self-Care Disability for the Civilian Noninstitutionalized Population 5 Years and Over
B18007 Sex by Age by Go-Outside-Home Disability for the Civilian Noninstitutionalized Population 16 Years and Over
B18008 Sex by Age by Employment Disability for the Civilian Noninstitutionalized Population 16 to 64 Years
B18010 Disability Status by School Enrollment and Educational Attainment for the Civilian Noninstitutionalized Population 18 to 34 Years
A- 11

Inform state plan
B18011 Sensory Disability by School Enrollment and Educational Attainment for the Civilian Noninstitutionalized Population 18 to 34 Years
B18012 Physical Disability by School Enrollment and Educational Attainment for the Civilian Noninstitutionalized Population 18 to 34 Years
B18013 Mental Disability by School Enrollment and Educational Attainment for Civilian Noninstitutionalized Population 18 to 34 Years
B18014 The Self-Care Disability by School Enrollment and Educational Attainment for the Civilian Noninstitutionalized Population 18 to 34 Years
B18015 Go-Outside-Home Disability by School Enrollment and Educational Attainment for the Civilian Noninstitutionalized Population 18 to 34 Years
B18016 Employment Disability by School Enrollment and Educational Attainment for the Civilian Noninstitutionalized Population 18 to 34 Years
B18020 Disability Status by Sex by Age by Employment Status for the Civilian Noninstitutionalized Population 16 to 64 Years
B18020A Disability Status by Sex by Age by Employment Status for the Civilian Noninstitutionalized Population 16 to 64 Years (White Alone)
B18020B Disability Status by Sex by Age by Employment Status for the Civilian Noninstitutionalized Population 16 to 64 Years (Black or African American Alone)
B18020C Disability Status by Sex by Age by Employment Status for the Civilian Noninstitutionalized Population 16 to 64 Years (American Indian and Alaska Native)
B18020D Disability Status by Sex by Age by Employment Status for the Civilian Noninstitutionalized Population 16 to 64 Years (Asian Alone)
B18020E Disability Status by Sex by Age by Employment Status for the Civilian Noninstitutionalized Population 16 to 64 Years (Native Hawaiian and Other Pacific Islander Alone)
B18020F Disability Status by Sex by Age by Employment Status for the Civilian Noninstitutionalized Population 16 to 64 Years (Some Other Race Alone)
B18020G Disability Status by Sex by Age by Employment Status for the Civilian Noninstitutionalized Population 16 to 64 Years (Two Or More Races)
B18020H Disability Status by Sex by Age by Employment Status for the Civilian Noninstitutionalized Population 16 to 64 Years (White Alone, Not Hispanic or Latino)
B18020I Disability Status by Sex by Age by Employment Status for the Civilian
12

Appendix A Guide to Assessing VR Needs
Noninstitutionalized Population 16 to 64 Years (Hispanic or Latino)
B18021 Sensory Disability by Sex by Age by Employment Status for the Civilian Noninstitutionalized Population 16 to 64 Years
B18022 Physical Disability by Sex by Age by Employment Status for the Civilian Noninstitutionalized Population 16 to 64 Years
B18023 Mental Disability by Sex by Age by Employment Status for the Civilian Noninstitutionalized Population 16 to 64 Years
B18024 Self-Care Disability by Sex by Age by Employment Status for the Civilian Noninstitutionalized Population 16 to 64 Years
B18025 Go-Outside-Home Disability by Sex by Age by Employment Status for the Civilian Noninstitutionalized Population 16 to 64 Years
B18026 Sex by Age by Employment Disability by Employment Status for the Civilian Noninstitutionalized Population 16 to 64
B18030 Disability Status by Sex by Age by Poverty Status for the Civilian Noninstitutionalized Population 5 Years and Over
B18031 Sensory Disability by Sex by Age by Poverty Status for the Civilian Noninstitutionalized Population 5 Years and Over
B18032 Physical Disability by Sex by Age by Poverty Status for the Civilian Noninstitutionalized Population 5 Years and Over
B18033 Mental Disability by Sex by Age by Poverty Status for the Civilian Noninstitutionalized Population 5 Years and Over
B18034 Self-Care Disability by Sex by Age by Poverty Status for the Civilian Noninstitutionalized Population 5 Years and Over
B18035 Go-Outside-Home Disability by Sex by Age by Poverty Status for the Civilian Noninstitutionalized Population 16 Years and Over
B18036 Employment Disability by Sex by Age by Poverty Status for the Civilian Noninstitutionalized Population 16 To 64 Years
B18040 Median Earnings in the Past 12 Months (in 2006 Inflation-Adjusted Dollars) by Disability Status by Sex for the Civilian Noninstitutionalized Population 16 Years and Over With Earnings
B18041 Median Earnings in the Past 12 Months (in 2006 Inflation-Adjusted Dollars) by Sensory Disability by Sex for the Civilian Noninstitutionalized Population 16 Years and Over With Earnings
B18042 Median Earnings in the Past 12 Months (in 2006 Inflation-Adjusted Dollars) by Physical Disability by Sex for the Civilian Noninstitutionalized
A- 13

Inform state plan
Population 16 Years and Over With Earnings
B18043 Median Earnings in the Past 12 Months (in 2006 Inflation-Adjusted Dollars) by Mental Disability by Sex for the Civilian Noninstitutionalized Population 16 Years and Over With Earnings
B18044 Median Earnings in the Past 12 Months (in 2006 Inflation-Adjusted Dollars) by Self-Care Disability by Sex for the Civilian Noninstitutionalized Population 16 Years and Over With Earnings
B18045 Median Earnings in the Past 12 Months (in 2006 Inflation-Adjusted Dollars) by Go-Outside-Home Disability by Sex for the Civilian Noninstitutionalized Population 16 Years and Over With Earnings
B18046 Median Earnings in the Past 12 Months (in 2006 Inflation-Adjusted Dollars) by Employment Disability by Sex for the Civilian Noninstitutionalized Population 16 to 64 Years With Earnings
14

Appendix A Guide to Assessing VR Needs
Cornell’s Research and Rehabilitation Training Center (RRTC) on Disability Demographics publishes disability Status Reports by state based on ACS data and maintains a Disability Statistics Web site: <http://www.ilr.cornell.edu/edi/DisabilityStatistics/> with interactive ACS tables as well as online versions of the Status Reports (Erickson & Lee, 2008).
Interactive tables on employment and other demographic characteristics of people with disabilities. The Cornell Disability Statistics Web site provides interactive tables based on ACS PUMS data, which complement the information that is available from the American FactFinder. In particular, the Cornell tables provide information on employment rates of people with and without disability, by gender, type of disability, age group, race, ethnicity, and education level. The tables show either number of people or percentage. The Cornell tables are available by accessing the Web site and choosing the variables of interest to create the interactive tables.
For example, the Cornell interactive tables provide information about employment rates among people who have achieved different levels of educational attainment within the working age population, aged 21-64 years. Exhibit A-8 shows an example interactive table with information on the percentage of people with disabilities who have an educational attainment of less than high school and are employed. (Information is displayed for a number of states.)
Exhibit A-8 Cornell Disability Statistics Center Interactive Table, Employment Rate, People with a Disability Aged 21-64 Years, with Less than High School
Education
A- 15

Inform state plan
Disability Status Reports. The Cornell RRTC on Disability Demographics also publishes annual status reports by state that are based on ACS data. The reports are published in hard copy and also may be downloaded from the Web site <http://www.ilr.cornell.edu/edi/DisabilityStatistics/index.cfm>. The Disability Status Reports provide another means of obtaining ACS data.
Disability Planning Data for Planners Web site. Another product of the Cornell RRTC is this Web site, created by InfoUse, that is intended to provide local planning data for municipal and regional planners. It provides state and county level ACS number and percentage estimates from the 2005-2007 pooled PUMS data set, including labor force participation variables for those age 16-64 (employed, in the labor force – not employed, and in the labor force). <http://disabilityplanningdata.com/>
University of California at San Francisco’s Research and Rehabilitation Training Center on Personal Assistance Services (Center for PAS) provides tables by state that are based on the ACS and focus on the need for personal care. The tables are available at: <http://www.pascenter.org/state_based_stats/disability_statistics.php>
These tables are especially helpful for obtaining more detailed information about the population with “self-care” disability in the state such as characteristics of age, race, ethnicity, family income, benefit recipiency, employment (for ages 18-64) and living arrangement (alone, with others) for people without disability, with disability, and with a “self-care” disability. In the ACS, people with a self-care disability are those who had difficulty dressing, bathing or getting around inside the home because of a physical, mental, or emotional condition lasting six months or more. Depending on a state’s definition of most significant disability, information on those with self-care disabilities may assist in answering questions about the needs of people with most significant disability. The state disability tables at the Center for PAS include: disability type, gender, age, race, ethnicity, family income, benefit recipiency, employment (ages 18-64 years) and living arrangement. All of these variables are shown for the population, number with a disability, percent with a disability, number with a self-care difficulty, and percent with a self-care disability.
Exhibit A-9 shows a portion of a table for Nebraska, based on ACS 2005 data.
16

Appendix A Guide to Assessing VR Needs
Exhibit A-9 Center for PAS Nebraska Disability Data Table from 2005 ACS
Nebraska Disability Data Table From the 2005 American Community Survey
Estimates for 2005
An estimated 229,000 people in Nebraska have a disability, or 14.4 percent of the population age 5 and over. An estimated 34,000 people, or 2.1 percent of the population 5 and over, have difficulty performing self-care activities, also known as Activities of Daily Living, such as dressing, bathing, or getting around inside the home.
Subject Population
(Thousands)
With a
disability
(Thousands)
With a
disability
(Percent)
With a self-
care difficulty
(Thousands)
With a self-
care difficulty
(Percent)
Total in Nebraska
(ages 5 and over)
1,586 229 14.4% 34 2.1%
Disability Type
Sensory 69 11 15.5%
Mobility 128 29 22.8%
Cognitive 74 17 22.8%
Self-care 34 34
Leaving the home 52 24 46.6%
Work disability 118 27 22.8%
Gender
Male 775 109 14.1% 15 1.9%
Female 811 120 14.7% 19 2.3%
Age
Children (5-17) 313 20 6.5% 2 0.7%
5-15 260 17 6.5% 2 0.8%
16-17 53 3 6.5% 0 0.2%
Work Ages (18-64) 1,054 118 11.2% 16 1.5%
As of October of 2008, a new Rehabilitation Research and Training Center (RTC) on disability statistics and demographics funded by the National Institute on Disability and Rehabilitation Research was awarded to Hunter College.
A- 17

Inform state plan
Current Population Survey (CPS)
In 2008 the Current Population Survey (CPS) included disability questions from the American Community Survey and provided state level estimates. The CPS is a monthly labor force survey of about 50,000 U.S. households conducted by the Census Bureau for the Bureau of Labor Statistics (BLS) for more than 50 years. The CPS collects information about the civilian noninstitutionalized population 15 years and older. The sample provides estimates for the nation as a whole and serves as part of model-based estimates for individual states and other geographic areas (U.S. Census Bureau, 2008d). These data will be available for needs assessments conducted in 2009 and later.
The Census Bureau Web site <http://www.census.gov/cps/> describes the general content of the CPS:
“Estimates obtained from the CPS include employment, unemployment, earnings, hours of work, and other indicators. They are available by a variety of demographic characteristics including age, sex, race, marital status, and educational attainment. They are also available by occupation, industry, and class of worker. Supplemental questions to produce estimates on a variety of topics including school enrollment, income, previous work experience, health, employee benefits, and work schedules are also often added to the regular CPS questionnaire.” (U.S. Census Bureau, 2008d)
Behavioral Risk Factor Surveillance Survey (BRFSS) Brief Description
The Behavioral Risk Factor Surveillance System (BRFSS) is an optional method to obtain state-level data on the needs of people with disabilities and the population that is potentially eligible for VR.
The BRFSS is the world’s largest, ongoing telephone health survey system, currently interviewing more than 350,000 adults each year. Since 1984 all of the 50 state health departments, as well as those in the District of Columbia, Puerto Rico, Guam, and the U.S. Virgin Islands, have been supported by the Centers for Disease Control (CDC) to collect data on health conditions and risk behaviors. States use BRFSS data to “identify emerging health problems, establish and track health objectives, and develop and evaluate public health policies and programs” (Centers for Disease Control, 2006a).
For the CSNA, the BRFSS provides an existing annual telephone survey method and a sampling frame for a representative sample of the state population. Existing core questions on disability provide information about the prevalence of disability in the state and could serve as screener questions to create a follow-back sample of people with
18

Appendix A Guide to Assessing VR Needs
disabilities who could answer more specific questions related to vocational rehabilitation needs.
As an optional method, the BFRSS can provide:
• a representative sample of people with disabilities in the state;
• questions about groups of individuals with disabilities who might be identified as a focus in a particular state’s comprehensive needs assessment (e.g., the aging workforce);
• questions about racial and ethnic minority groups and health disparities;
• additional questions about employment and disability; and
• questions about whether people with disabilities received services in other parts of the statewide work force investment system.
How to Use the BRFSS
The BRFSS includes two core disability questions that provide estimates of the disability populations in the state and could serve as a screener for follow-back questions if state-only questions are added. Prevalence rates for the core disability questions are available by state at: <http://apps.nccd.cdc.gov/brfss/index.asp> (Centers for Disease Control, 2006b).
Optional modules have been approved by the CDC and state BRFSS coordinators and may be adopted by any state BRFSS as long as they are used verbatim. Depending on which optional modules have been used in a given state, existing data from optional modules may be helpful in defining the needs of subpopulations such as people with mental illness, visual impairment, diabetes, and arthritis or of other groups already surveyed in an optional module. If an “optional module” on employment needs or vocational rehabilitation were approved by the CDC and the state BRFSS coordinators it could be used in any state BRFSS.
Even without an optional module on employment and vocational rehabilitation, state-only modules or questions could be added to help understand vocational rehabilitation needs in the state. State-only questions may be added for a cost to a state’s BRFSS by contacting the BRFSS coordinator for the state. The CDC does not control which questions a state adds, as long as the core questions (and any optional module questions) are asked exactly as worded. Each state has a slightly different process for adding questions. The state BRFSS coordinator has information on the process for adding questions in each state, and the BRFSS coordinators ultimately decide which questions are added. (For a list of BRFSS coordinators, see: <http://www2.cdc.gov/nccdphp/brfss2/coordinator.asp>
A- 19

Inform state plan
All states require a proposal before adding questions to the BRFSS. The length of the proposal depends on whether the proposed questions have been used on the BRFSS before. (For example, the optional modules may be easily added. Each year at the BRFSS meeting, the coordinators vote on which modules should become sanctioned “optional modules.” It may be possible for a module of questions related to disability and employment to become sanctioned as an “optional module.” In addition, any nontested or nonapproved modules can be added as “state-added” questions or modules at the discretion of the state’s BRFSS coordinator.)
States vary in terms of cost per questions, amount of “lead time” for adding a question, (which may be as early as a year before the data will be collected), how the questions are tested, and how the data are analyzed and reported. Most states try to keep the BRFSS interview to 20 minutes or less and, as a result only a limited number of questions may be added each year. In addition to the Core questions (including the two disability questions) there are mandated chronic disease questions every other year, so that states typically add more questions related to chronic disease in those years rather than questions on other topics. It is easier to add questions to the BRFSS if there are multiple stakeholders (such as state agencies, nonprofits, and research institutions) in the state who support those particular questions.
Examples of BRFSS Disability Questions
Core disability questions. The two core disability questions in the BRFSS are as follows:
(The following questions are about health problems or impairments you may have.)
1. Are you limited in any way in any activities because of physical, mental, or emotional problems? (Yes/No/Don’t know or not sure/Refused) (Variable Name: QLACTLM2)
2. Do you now have any health problem that requires you to use special equipment, such as a cane, a wheelchair, a special bed, or a special telephone? (Yes/No/Don’t know or not sure/Refused) (Variable Name: USEEQUIP)
State-only disability questions. Questions that states have added to the BRFSS have focused on access, activity limitations, assistive equipment, nature of disability, and personal assistance. Some states have added questions about employment of people with disabilities that may help set a precedent for employment-related questions in the BRFSS and could help to shape questions about the VR population. For example, in 1999 and 2001 Oregon added a 14-question module about the employment concerns of people with disability, which contained the following questions (Centers for Disease Control, 2008; American Association on Health and Disability, 2005):
20

Appendix A Guide to Assessing VR Needs
1. Are you concerned that employers have negative attitudes toward people with disabilities?
2. Are you concerned that there were no jobs available that you could perform?
3. Are you concerned that you don't have convenient or accessible transportation?
4. Are you concerned that you would lose Supplemental Security Income, known as SSI, Supplemental Security Disability Income, known as SSDI, or other sources of income if you went to work?
5. Are you concerned that you would lose your Medicare or Medicaid coverage if you went to work?
6. Are you concerned that you would lose your subsidized housing if you went to work?
7. Are you concerned that you would lose your subsidized personal attendant services if you went to work?
8. Are you concerned that you would need additional attendant care services at home if you went to work?
9. Are you concerned that you would need work accommodations, such as accessible work space?
10. Are you concerned that you would not be able to find a job offering affordable health insurance as a benefit?
11. Are you concerned that you would not be able to take time off for health-related reasons?
12. Are you concerned that you wouldn't earn enough money to make up for the disability-related benefits that you would lose by becoming employed?
13. Are you concerned that you wouldn't have control over the pace or scheduling of work activities?
14. Are you concerned that your training or skills are not adequate to be employed?
A- 21


Appendix B Guide to Assessing VR Needs
Appendix B: Disability Population Estimates
National surveys that contain detailed disability information do not provide estimates at the state or substate level of the number of people with specific disabilities. In general, state and local disability subpopulations are estimated by other means.
The methods described below provide estimates of the number of people in specific disability groups because more precise data are not available at the state or substate level. In most cases, the estimates are obtained by using data from national surveys to create state estimates. These estimates are useful where no other data exist on a particular subject in a particular geographic area.
There are two estimating approaches. The simplest involves multiplying the state population by a coefficient derived from a national survey. For example, the Survey on Income and Program Participation (SIPP) estimates that 0.8 percent of the national population has a severe vision impairment. Multiplying that percentage by the state population gives a rough estimate of severe vision impairment in any state.
The Comprehensive Statewide Needs Assessment (CSNA) also incorporates a second approach – a multivariate estimation using the rates of one population and applying them to the population structure of another population. This more complex estimate takes into account differences in demographic characteristics in the state, such as age, poverty, education and other characteristics. In this approach the relationship between a specific disability (such as severe visual disability) and a set of demographic characteristics is estimated using the SIPP data, and then these estimates are used to predict the prevalence of the specific disability using ACS local demographic data. This is the same methodology used by the Census Bureau to generate local area disability statistics for 1990. The Census Bureau combined specific disability information from the disability information from the Content Reinterview Survey (CRS), which used the SIPP instrument, and local information on the 1990 Decennial Census Long-Form (U.S. Census Bureau, 2004; 2006b).
The first step in the estimation procedure is to use logistic regressions and 2004 SIPP data to estimate the probability of reporting a specific disability as a function of demographic characteristics (age, race, gender, ethnic origin, educational attainment). In other words, estimate the following equation:
Prob[specific disability] = 1/(1 + e-f(z)),
where z = α + β1×(age) + β2×(age squared) + β3×(female) + β4×(Hispanic) + β5×(less than high school diploma) +
B-1

Inform state plan
β6× (some college experience) + β7× (Bachelor's degree or more).
The second step is to use this equation to calculate the probability reporting the specific disability for each sample member in the 2006 ACS data. The final step is, for each location, to calculate the average probability (and multiplied by 100) to obtain the percentage of people with the disability, and then calculate the number of people with the specific disability. Preliminary tables for states are shown in Exhibit B-1. Public Use Microdata Sample (PUMAs) and counties can also be calculated.
2

Appendix B Guide to Assessing VR Needs
Exhibit B-1 Multivariate Estimates for States
2004 SIPP
Actual
2006 ACS
Predicted
Total Population Ages 18-64 Total Population Ages 18-64
Location Disability Severe MR Mental Illness
Blind Visual Difficulty
Disability Severe MR Mental Illness
Blind Visual Difficulty
United States 21.6 9.9 0.61 9.2 0.11 2.4 21.1 9.5 0.56 8.6 0.11 2.3
Alabama 21.3 12.2 1.72 9.4 0.10 1.8 19.4 10.3 1.09 8.9 0.12 1.5
Alaska 23.9 8.7 2.17 7.6 0.00 1.1 22.2 7.8 0.52 5.7 0.09 1.9
Arizona 18.5 9.4 0.29 7.5 0.00 2.5 19.0 9.4 0.42 7.4 0.08 2.4
Arkansas 24.4 10.6 0.21 8.7 0.21 2.1 23.3 10.8 0.52 7.6 0.14 2.0
California 18.9 8.2 0.27 7.7 0.08 2.1 18.8 8.3 0.45 7.3 0.09 2.2
Colorado 27.7 10.9 0.52 12.2 0.00 3.5 27.5 10.5 0.37 11.5 0.07 3.7
Connecticut 18.0 7.9 0.94 6.9 0.09 1.6 18.2 8.1 0.67 6.9 0.12 2.0
Delaware 20.7 6.4 1.43 13.6 0.00 2.1 19.2 5.8 0.47 12.4 0.14 2.3
District of Columbia 20.7 8.7 0.00 13.0 0.00 3.3 16.9 6.5 0.48 11.5 0.17 2.8
Florida 17.7 9.2 0.43 7.7 0.17 2.2 17.4 9.1 0.47 6.9 0.15 2.2
Georgia 17.4 8.5 0.73 6.8 0.18 2.3 16.2 7.6 0.52 5.9 0.15 2.3
Hawaii 16.0 5.1 1.14 4.0 0.00 2.9 17.3 6.0 0.56 3.7 0.12 3.0
Idaho 32.0 9.4 0.00 10.9 0.00 5.5 31.7 9.3 0.41 10.1 0.07 5.4
Illinois 21.2 8.3 0.60 8.2 0.22 2.3 21.1 8.0 0.54 8.0 0.18 2.2
Indiana 21.6 10.2 0.73 8.2 0.15 2.6 20.7 9.7 0.55 7.6 0.16 2.5
B-3

Inform state plan
Iowa 18.4 7.8 0.87 8.5 0.10 1.5 18.6 7.9 0.46 8.2 0.05 1.6
Kansas 19.5 7.8 0.60 8.1 0.12 2.0 19.3 7.7 0.47 8.0 0.05 2.1
Kentucky 25.2 13.2 1.11 10.5 0.00 3.7 23.7 12.2 0.97 9.4 0.10 3.4
Louisiana 26.7 13.2 1.34 10.9 0.49 2.4 26.3 12.7 0.55 10.6 0.15 1.8
Maine 32.6 14.0 0.00 15.5 0.00 2.3 30.3 12.9 0.72 13.0 0.12 2.0
Maryland 19.9 8.8 0.20 8.4 0.00 2.5 18.9 7.8 0.46 7.6 0.14 2.3
Massachusetts 21.8 9.7 0.65 9.1 0.00 2.7 21.8 9.3 0.65 8.4 0.11 2.5
Exhibit B-1 Multivariate Estimates for States (cont.)
2004 SIPP
Actual
2006 ACS
Predicted
Total Population Ages 18-64 Total Population Ages 18-64
Location Disability Severe MR Mental Illness
Blind Visual Difficulty
Disability Severe MR Mental Illness
Blind Visual Difficulty
Michigan 26.4 10.3 0.68 12.3 0.12 2.4 24.9 9.5 0.55 11.7 0.17 2.0
Minnesota 18.2 7.4 0.46 8.9 0.00 1.3 19.4 7.7 0.45 8.9 0.04 1.3
Mississippi 27.4 15.1 1.05 13.5 0.30 3.6 26.3 14.6 1.22 13.0 0.13 3.6
Missouri 26.1 11.8 0.31 11.6 0.06 2.6 25.0 11.2 0.49 10.8 0.05 2.4
Montana 27.1 14.5 0.60 15.1 0.00 1.8 26.1 14.4 0.40 15.3 0.07 1.8
Nebraska 16.8 4.3 0.66 5.6 0.00 2.3 18.9 4.1 0.46 5.9 0.05 3.1
Nevada 27.2 11.5 0.59 11.8 0.00 4.1 27.3 11.5 0.46 12.8 0.08 4.1
New Hampshire 27.1 13.3 0.49 14.8 0.49 2.5 26.3 12.7 0.65 14.2 0.11 2.7
New Jersey 17.7 8.1 0.58 7.1 0.17 1.2 17.8 8.4 0.70 7.2 0.06 1.3
4

Appendix B Guide to Assessing VR Needs
New Mexico 25.5 8.6 0.72 12.2 0.00 2.9 27.4 11.8 0.44 11.6 0.10 4.7
New York 19.3 8.8 0.89 8.4 0.04 2.2 19.5 8.8 0.76 8.2 0.07 2.2
North Carolina 20.6 10.1 0.80 8.0 0.07 2.0 21.8 10.1 0.50 7.5 0.15 1.9
North Dakota 23.1 7.7 0.00 8.7 0.00 2.9 24.4 9.1 0.46 8.0 0.05 3.4
Ohio 23.9 11.9 0.40 10.5 0.23 3.2 23.4 11.4 0.54 10.1 0.17 3.3
Oklahoma 27.8 13.8 0.56 13.3 0.16 4.9 26.8 12.9 0.52 11.7 0.14 4.6
Oregon 20.4 10.0 0.23 10.2 0.39 1.4 20.3 9.8 0.39 9.8 0.07 1.3
Pennsylvania 23.7 10.4 1.00 10.2 0.00 2.9 22.7 9.5 0.73 9.4 0.06 2.7
Rhode Island 24.6 11.3 0.70 10.6 0.70 2.8 25.1 11.5 0.73 10.5 0.12 3.2
South Carolina 22.8 14.5 0.73 9.8 0.41 2.6 22.8 14.8 0.52 9.5 0.16 2.1
South Dakota 18.5 7.4 0.74 8.1 0.00 0.7 18.4 6.9 0.49 7.1 0.05 0.9
Tennessee 30.8 15.8 1.03 14.2 0.14 5.3 28.9 15.0 1.01 13.3 0.10 4.9
Texas 21.9 9.1 0.39 9.4 0.07 2.1 22.1 9.1 0.50 9.3 0.15 2.0
Utah 11.0 6.4 0.00 4.7 0.00 2.2 11.1 6.0 0.41 4.3 0.06 2.7
B-5

Inform state plan
Exhibit B-1 Multivariate Estimates for States (cont.)
2004 SIPP
Actual
2006 ACS
Predicted
Total Population Ages 18-64 Total Population Ages 18-64
Location Disability Severe MR Mental Illness
Blind Visual Difficulty
Disability Severe MR Mental Illness
Blind Visual Difficulty
Vermont 16.5 8.9 0.00 6.3 0.00 2.5 16.8 9.5 0.67 6.5 0.11 2.5
Virginia 16.6 7.9 0.66 5.7 0.12 1.2 15.4 7.0 0.46 5.1 0.14 1.0
Washington 26.3 12.3 0.77 12.0 0.15 2.7 26.4 12.3 0.40 11.8 0.07 2.6
West Virginia 20.6 10.3 0.30 5.2 0.00 2.1 21.7 10.3 0.46 5.1 0.13 2.4
Wisconsin 17.9 8.3 0.38 8.4 0.05 0.8 18.7 8.6 0.53 8.5 0.16 1.0
Wyoming 24.2 15.4 1.10 8.8 0.00 5.5 22.8 12.8 0.41 8.4 0.07 5.8
6

Appendix B Guide to Assessing VR Needs
The Exhibit shows predicted rates of any disability: severe disability, mental retardation, mental illness, blindness, and visual difficulty for each state.
Any of these estimates have less accuracy than those from a survey that is done with a large sample from the state or substate area. Often, however, conducting a survey on these subpopulations can be infeasible or prohibitively expensive. Therefore, these “synthetic” estimates are the most cost-effective method to supply a reasonably accurate estimate. In making decisions based on these relatively imprecise estimates, it is important to obtain different estimates to see the possible range of the size of the subpopulation. The estimates can help to draw a preliminary demographic sketch of the subpopulations, and other qualitative and quantitative methods in the CSNA and can help to provide detail for a fuller description of the needs of the groups.
Estimating Subpopulations of Disabilities
People with blindness and visual impairment. Applying national estimates to state populations. Different national surveys ask different questions to determine the prevalence of specific disabilities, resulting in different estimates.
• A recent analysis of the National Health Interview Survey (NHIS), a survey that is conducted by the National Center for Health Statistics, found that among noninstitutionalized US adults 18 years and older the estimated prevalence for visual impairment was 9.3 percent, including 0.3 percent with blindness (Ryskulova, Turczyn, Makuc, Cotch, Klein, & Janiszewski, 2008).
• According to the SIPP, 3.5 percent of the population age 15 and older has a visual disability (difficulty seeing words or letters in ordinary print even when wearing glasses or contact lenses), including 0.8 percent of the population with a severe visual disability (unable to see words and letters) (Steinmetz, 2006).
• By using the multivariate estimating approach, rates that take state demographic differences into consideration can be predicted by state. The SIPP actual national estimate for 2004 for those age 18-64 is 0.11 percent for blindness and 2.4 percent for visual impairment (Note that the SIPP estimate for this group should be lower than for the more inclusive age group above). The multivariate analysis using disability measures and demographic relationships in the SIPP for this age group and applying them to ACS populations results in predicted state estimates that vary from 0.04 percent (MN) to 0.18 percent (IL) for blindness and 0.9 percent (SD) to 5.8 percent (WY) visual impairment. Exhibit B-1 shows state disability rates predicted using this approach.
Applying these estimates to state population will provide a range of estimates of the number of people with blindness or severe visual impairment and those with visual impairment.
B-7

Inform state plan
Deaf or severe hearing disability. Applying national estimates to state populations. According to the SIPP estimates, 3.5 percent of the population 15 years and older have a hearing disability, including 0.4 percent severe and 3.1 percent nonsevere (Steinmetz, 2006). Applying the SIPP national estimates will provide a rough estimate of the number of people with hearing disabilities in the state.
American Community Survey (ACS) for visual and hearing disabilities. Through 2007 the ACS provides estimates of the number of people with sensory disabilities, which include both hearing and vision disabilities together as one estimate. Beginning with the 2008 ACS, the survey will ask a separate question about vision disability: “Is this person blind or does he/she have serious difficulty seeing even when wearing glasses?” and about hearing disability: ”Is this person deaf or does he/she have serious difficulty hearing?” When the 2008 ACS estimates are available in 2009, there will be state and substate estimates of vision disability and hearing disability from the ACS.
Mental retardation and other developmental disabilities. Estimates from the American Journal on Mental Retardation. Experts in mental retardation (MR) and developmental disabilities (DD) have calculated an overall estimate of the population 18 years and older with MR as two per 1,000 in the noninstitutionalized population, as published in an article in the American Journal on Mental Retardation (Larson, Lakin, Anderson, Kwak & Anderson, 2001). This estimate is based on analysis of data for the entire nation, using the National Health Interview Survey – Disability (NHIS-D), conducted in 1994-95. The same study estimated the population of people 18 years and older with MR and/or other developmental disabilities (MR/DD) as seven per 1,000 in the noninstitutionalized population. State VR agencies may apply these rates to their state ACS population estimates to obtain estimates of the subpopulations 18 years and over with MR and with MR/DD who are not living in institutions.
Estimate used by Developmental Disabilities Councils. To estimate the rate of developmental disabilities, which includes mental retardation, many Developmental Disabilities Councils use the prevalence estimate of 1.8 percent of the noninstitutionalized population developed by Gollay and Associates, based upon their analysis of the National Survey of Income and Education (Gollay, 1981). This estimate, which includes children, is higher than the one reported above, in part because the reported rates of developmental disabilities among children are higher than those of adults.
Multivariate estimates from the ACS and SIPP. Exhibit B-1 shows the 2004 SIPP national estimate to be 0.61 percent of the population ages 18-64, and predicted state estimates using the 2006 ACS ranging from 0.37 percent (CO) to 1.22 percent (MS).
8

Appendix B Guide to Assessing VR Needs
Applying these estimates to state populations will provide a range of estimates of the number of people with mental retardation and other developmental disabilities. In the adult population 0.2 percent of the population is estimated to have MR and 0.7 percent is estimated to have MR/DD. However, including a younger population, such as transitional youths, the estimate for MR/DD would be 1.8 percent.
Mental illness. SAMHSA block grant guidelines. One source to estimate the population with severe mental illness in the state is the Substance Abuse and Mental Health Services Administration (SAMHSA) guideline to calculate the rate of severe mental illness for its block grants. According to this estimate, 5.5 percent of the adult population (18 years and older) has a severe mental illness (SMI), a percentage that may be applied to the ACS state population estimate. Among youth, 10 to 17 years of age, 9.5 percent is estimated to have a serious emotional disturbance (SED) (Substance Abuse and Mental Health Services Administration [SAMHSA]Office of Applied Studies, 2008).
SAMSHA state profiles. Another resource for estimates of severe mental illness is a SAMSHA publication that includes profiles on each state, with tables estimating the number of adults with SMI and youths with SED, available at http://www.hrsa.gov/reimbursement/TA-materials.htm (SAMSHA, 2000).
Multivariate estimates from the ACS and SIPP. Predicted state estimates from the 2006 ACS vary from 3.7 percent (HI) to 14.2 percent (NH) with mental illness for those age 18-64. Nationally, the 2004 SIPP actual estimate is 9.2 percent.
Applying these estimates to state populations will provide a range of estimates of the number of people with severe mental illness. In this case, the range would be between 5.5 percent and 8.6 percent for the individual state’s rate for adults, and 9.5 percent for the individual state’s rate for youths with SED.
Additional state data on people with mental illness. The Web site www.statedata.info also contains state data on people with mental illness from state mental health agencies. Employment-related data include the number of mental health (MH) consumers who are employed, the number of MH consumers in the labor force, and the percentage of all state MH consumers who are served in the community who are employed.
Self-care disabilities. The ACS provides a method for estimating self-care disabilities. Self-care disabilities may be considered “most significant,” depending on the state’s definition. These estimates are available for state and substate areas. As of the 2005 ACS, 2.8 percent had a self-care difficulty. The Center for PAS Web site has these data by state. The range is 1.0 percent (HI) to 3.8 percent (MS and WV) for those ages 18-64. (Choose “Disability Statistics” at http://www.pascenter.org/state_based_stats/index.php).
B-9

Inform state plan
Severe speech disability. Applying SIPP estimates to ACS state population. According to the SIPP estimates, 1.2 percent of the population 15 years and older has a speech disability, including 0.3 percent severe and 0.9 percent nonsevere (Steinmetz, 2006).
Wheelchair users. Applying SIPP estimates to ACS state population. According to the SIPP estimates, 1.2 percent of the population 15 years and older used a wheelchair or similar device (Steinmetz, 2006).
Traumatic brain injury. People with a traumatic brain injury (TBI) represent another group that may be considered most significant and may have needs for supported employment. There is no SIPP estimate of TBI. Some states have TBI registries or state TBI offices that may have state-level estimates.
10

Appendix C Guide to Assessing VR Needs
Appendix C: Projections of State Population and Labor and Economic Forecasts
Projections are an important component of the needs assessment model: They allow VR agencies to understand expected changes in the state in upcoming years and to plan for those changes. Two different kinds of projections are recommended in the model for the Comprehensive Statewide Needs Assessment (CSNA): population projections, and employment and labor force forecasts.
Population Projections
Population projections provide information about expected population changes in the state, including overall population trends and changes within age groups that are of interest to VR. These projections are estimates of the population at future dates based on assumptions about future births, deaths, and international and domestic migration. Current Census Bureau projections by state include age and sex projections from census 2000 to 2030 in five-year increments (U.S. Census Bureau, 2007e).
Population projections also provide information about expected changes in the populations of racial and ethnic minority groups. As of June 2008, the most recent population projections from the US Census Bureau that include racial and ethnic minorities by state were published in 1996 and are based on the 1990 census. However, many states have more recent projections on racial and ethnic minorities that are based on census 2000. There is variation in the dates to which states have projected their populations and the age groups for which data are available.
Population projections provide
• a picture of upcoming changes in the overall population that will influence rehabilitation needs; and
• information about projected changes in the populations of racial and ethnic minority groups.
Examples of Population Projection Data Available for All States
Population by Age Group
Based on census 2000 data, Summary Table B1 from the Census Bureau at: <http://www.census.gov/population/www/projections/projectionsagesex.html> provides projected population changes from 2000 to 2030, by 5-year increments, by age groups of interest to VR. Exhibit C-1 is an example of data from Summary Table B1 on the census.gov Web site for Nevada.
C-1

Inform state plan
Exhibit C-1: Table of Projected Population Data for Nevada, Showing Projected Population Changes 2000 to 2030, by 5-Year Increments, Selected Age Groups
Geo-graphic
Area Selected
Age Groups
Census April 1,
2000
Projected July 1, 2005
Projected July 1, 2010
Projected July 1, 2015
Projected July 1, 2020
Projected July 1, 2025
Projected July 1, 2030
NEVADA
Total 1,998,257 2,352,086 2,690,531 3,058,190 3,452,283 3,863,298 4,282,102
14 to 17 years 104,267 126,996 140,930 151,047 170,434 192,340 219,275
18 to 24 years 179,708 208,923 241,995 268,976 285,509 312,870 345,666
25 to 44 years 628,572 685,376 718,950 764,185 828,071 906,584 1,000,603
45 to 64 years 459,249 598,068 734,880 851,422 950,822 1,015,982 1,063,021
65 years and over 218,929 266,255 329,621 421,719 531,120 659,700 797,179
Data in this table indicate that the total population of Nevada is expected to more than double between 2000 and 2030. A number of age groups will also double in size, and the population of people 65 years and over will nearly triple during that same period.
Population by Race and Ethnicity
For all states, state-level race and ethnicity data that were based on census 1990 and released October 1996 are available at:
http://www.census.gov/population/projections/state/stpjrace.txt (U.S. Census Bureau, 1996), which provides projected population, changes from 1995 to 2025, by 5-year increments, by sex, race and ethnicity.
2

Appendix C Guide to Assessing VR Needs
Exhibit C-2 provides an example of a table excerpted from data at that Web site, showing the expected population growth of the population by race and ethnicity for Arizona.
Exhibit C-2: Projected State Population, Arizona, by Sex, Race, and Hispanic Origin, 2000-2025
ARIZONA (in thousands) July 1, 2000
(projected from 1990)
July 1, 2005
projected
July 1, 2015
projected
July 1, 2025
projected
White 4,252 4,623 5,103 5,599
Black 177 203 241 285
American Indian, Eskimo, Aleut 262 277 304 332
Asian/Pacific Islander 107 129 159 195
Hispanic 1,071 1,269 1,641 2,065
According to this information, the Hispanic population of Arizona is expected to nearly double in the period between 2000 and 2025, and the population of Asian/Pacific Islanders to increase by more than 80 percent. The black population is also expected to increase by more than 60 percent in that time period, while the white and American Indian populations are projected to increase less dramatically.
Examples of Recent Population Projections Available for Some States
At least 14 states have created recent state population projections that include race and ethnicity and are based on census 2000. Census 2000-based state data are available for Arkansas, California, Connecticut, Delaware, Florida, Georgia, Illinois, Minnesota, Mississippi, New Hampshire, New Jersey, North Carolina, Texas and Washington, and may be available for other states (Cole, 2003; Connecticut State Data Center, 2007; Delaware Population Consortium, 2007; Florida Legislature Office of Economic & Demographic Research, 2007; Georgia Office of Planning and Budget, 2005; Hamilton, 2005; Illinois Department of Commerce and Economic Development, 2005; Minnesota State Demographic Center, 2005; Mississippi Institutions of Higher Learning Office of Policy Research and Planning, 2009; New Hampshire Office of Energy and Planning, 2006; New Jersey Department of Labor and Workforce Development, 2006; North Carolina State Demographics, 2007; State of California Department of Finance, 2007; State of Washington Office of Financial Management, 2006; Texas Populations Projections Program, 2009).
C-3

Inform state plan
When more recent projections are available, they will provide a more accurate picture of the future population of the state than the current projections based on Census 1990. However, state-generated projections vary in terms of how far into the future the data are projected and the increments by which the data are projected. In addition, some state projections may not include all racial and ethnic groups that are enumerated in the census.
For example, California has used census 2000 data to project the population by race and Hispanic origin from 2000 to 2050 in 5-year increments. These data are available at: <http://www.dof.ca.gov/html/DEMOGRAP/Data/RaceEthnic/Population-00-50/RaceData_2000-2050.php> (State of California Department of Finance, 2007). Exhibit C-3 shows data excerpted from that Web site.
Exhibit C-3 Race and Ethnic Population Projections, California
CALIFORNIA
All Ages (in thousands)
2000 Census
2005 projected
2010 projected
2015 projected
2020 projected
2025 projected
2030 projected
Total 34,105 36,957 39,136 41,573 44,136 46,720 49,241
White not Hispanic
16,134 16,408 16,439 16,474 16,509 16,483 16,378
Hispanic
11,057 12,906 14,513 16,314 18,261 20,279 22,336
Asian/Pacific Islander
3,872 4,393 4,834 5,290 5,724 6,160 6,581
Black
2,218 2,255 2,287 2,341 2,390 2,438 2,475
American Indian
186 215 241 271 300 326 351
Two or more races
637 780 822 883 951 1,035 1,120
According to these data, the populations of Hispanic, Asian/Pacific Islander, American Indian and “two or more races” are each expected to increase by well over 50 percent by 2030, while the populations of white not Hispanic and black will not dramatically increase.
4

Appendix C Guide to Assessing VR Needs
Employment and labor force forecasts
The Bureau of Labor Statistics (BLS) provides detailed 10-year projections at the national level on occupational outlook, including projected employment growth by industry, occupational category and occupations. In late 2007 the BLS released projections for the period 2006 to 2016; earlier national projections for 2004 to 2014 were released in 2006.
Employment and labor force projections provide:
• which jobs will have higher demand in upcoming years; and
• which jobs and industries are likely to employ people according to their demographic characteristics (for states with more detailed reports on employment and labor force projections).
Examples of Available Data
The BLS Web site links to <http://www.projectionscentral.com>, a Web site that uses BLS and state data to provide occupational employment projections (Almis State Projections, 2007). Projectionscentral.com currently has projections from 2006 to 2016 for each state. Exhibit C-4 provides an example of a table from the projections central Web site that shows the occupations with the highest expected numeric change in employment from 2006 to 2016 for Alabama (column labeled “Numeric employment change):
Exhibit C-4: Occupational Projections 2006 to 2016, Alabama, Sorted by Numeric Employment Change
Area Title 2006
Employment
2016
Employment
Numeric
Employment
Change
Percent
Employment
Change
Average
Annual
Openings
Alabama Total- all occupations, 2,167,980 2,485,400 317,420 15 81,440
Alabama Retail sales persons 62,340 76,190 13,850 22 3,300
Alabama Registered nurses 40,320 51,850 11,530 29 1,820
Alabama Combined food
preparation and serving
6,230 57,130 10,890 24 1,970
C-5

Inform state plan
workers, including fast
food
Alabama Team assemblers 34,390 43,620 9,240 27 1,640
Alabama Office clerks, general 41,770 48,650 6,880 17 1,460
Alabama Janitors and cleaners,
except maids and
housekeeping cleaners
33,260 39,960 6,700 20 1,310
Alabama Waiters and waitresses 28,900 35,370 6,470 22 2,220
Alabama Truck drivers, heavy and
tractor-trailer
41,030 47,240 6,210 15 1,350
Alabama Bookkeeping,
accounting, and auditing
clerks
31,730 37,770 6,040 19 1,100
Alabama Customer service
representatives
22,790 8,770 5,980 26 1,230
Alabama Postsecondary teachers 17,400 22,430 5,020 29 790
Exhibit C-5 shows the data for Alabama, sorted by “Average Annual Openings.”
6

Appendix C Guide to Assessing VR Needs
Exhibit C-5: Occupational Projections 2006 to 2016, Alabama, Sorted by Average Annual Openings
Area Title 2006
Employment
2016
Employment
Numeric
Employment
Change
Percent
Employment
Change
Average
Annual
Openings
Alabama Total, all occupations 2,167,980 2,485,400 317,420 15 81,440
Alabama Retail salespersons 62,340 76,190 13,850 22 3,300
Alabama Cashiers, except
gaming
57,690 61,310 3,620 6 3,110
Alabama Waiters and waitresses 28,900 35,370 6,470 22 2,220
Alabama Combined food
preparation and serving
workers, including fast
food
46,230 57,130 10,890 24 1,970
Alabama Registered nurses 40,320 51,850 1,530 29 1,820
Alabama Laborers and freight,
stock, and material
movers, hand
40,990 45,840 4,850 12 1,800
Alabama Team assemblers 34,390 43,620 9,240 27 1,640
Alabama Office clerks, general 41,770 48,650 6,880 17 1,460
Alabama Truck drivers, heavy
and tractor-trailer
41,030 47,240 6,210 15 1,350
Alabama Janitors and cleaners,
except maids and
housekeeping cleaners
33,260 39,960 6,700 20 1,310
Alabama Customer service
representatives
22,790 28,770 5,980 26 1,230
Together, these tables suggest that there are a number of occupations that are projected to have both higher numbers of jobs and higher average annual openings in 2016.
C-7

Inform state plan
Other Sources of Data on Labor and Economic Projections
In addition to these data that are available for all states, individual state departments of labor and economic development have used BLS and other data to produce state-level reports on employment outlook and labor force growth. For example, the New Jersey Department of Labor and Economic Development used census, BLS, and state projections to produce a report that details many aspects of employment growth that are relevant to VR planning, including information about the industries that will produce the most jobs in the state, annual projected job openings by educational attainment, and labor force growth by race, ethnicity and gender (New Jersey Department of Labor and Workforce Development, 2006).
8

Appendix D Guide to Assessing VR Needs
Appendix D: VR Agency Data
VR data and reports provide rich sources of information to answer the questions about rehabilitation needs in the state. Essential information is available from the state’s RSA-911 data system, from existing reports to RSA, and from other internal reports and studies, which complement new data collection from VR counselors and administrators. VR data also may be used to look at service patterns and needs in substate areas.
VR agency data and reports provide:
• characteristics of those who are currently receiving services (caseload statistics);
• characteristics of those who have exited the program;
• disability and other demographic characteristics of the consumer, pre- and post-descriptors of status, types of services received, and their costs, and the nature of the closure, such as reason, type, and characteristics of employment status; and
• overall service patterns and expenditures.
Each state agency has its own data system from which it can retrieve all necessary data. In order to discuss the information that can be used, examples will be presented in this appendix from the national data sources, but each state agency can refer to its own data.
VR program data examples and required state reports
Information from the following program data and existing reports from state agencies provide a snapshot of VR service patterns at the state level. Many of the reports are publicly available at: <http://rsamis.ed.gov> (Rehabilitation Services Administration, 2008a).
VR agency internal MIS reports. Internal reporting on case services and outcomes will be valuable sources of information. VR data useful for the CSNA are just a part of the overall state agency MIS and QA system. These reports may be available not only at the state level but for regions, districts or office, and show variation in services within the state as well as for the state overall.
Data from the RSA-911 system. In addition to the picture of current services provided by existing reports, administrative data from the RSA-911 data system also provide a basis for comparison with other data. Data on characteristics of VR consumers who were served may be compared with data from the ACS to obtain an overview of the population served, within the context of the state’s disability population. Data on a number of demographic characteristics are available in both the ACS and the VR-911, allowing comparison of the population that is currently served by VR with the ACS disability
D-1

Inform state plan
population that is not working. The comparisons may help to identify groups that are unserved or underserved in the VR program, relative to their representation in the state, with the caution that the ACS disability measures are much more general than VR’s definitions, and the ACS disability population is much broader than the population eligible for VR services.
Minority groups. The following sample table shell (Exhibit D-1) shows how data from the ACS on the representation of ethnic and racial minorities within the population of working age people with disabilities who are not employed may be compared with VR data.
Exhibit D-1: Noninstitutionalized people with a disability and not employed in California, ages 16 – 64 years, by race and ethnicity, estimates from the 2006 ACS
California ACS 2006
Percentage of people with a disability and not
employed
All clients served by VR agency FY2006
Total (16 – 64 years) 100.0% 100.0%
Race (16 years – 64 years)
White 61.2%
African American 11.0%
Asian/Pacific Islander 8.6%
American Indian/Alaska Native
1.7%
Some other race(s) 13.6%
Two or more races 3.9%
Ethnicity (16 – 64 years)
Hispanic 28.9%
In addition, the VR population may be compared to the ACS state population on other variables that are in both data sets, including gender, age group, educational attainment, receipt of supplementary security income (SSI), and others. This information can help to identify other groups that may be unserved or underserved within the VR program.
Using R-911 data on employment outcomes for minorities. RSA-911 data can be used also to look at the needs of minorities in the VR system by examining data on employment status at closure by type of closure for the different racial and ethnic groups.
2

Appendix D Guide to Assessing VR Needs
These data provide information about the extent to which the different minority groups are achieving comparable employment outcomes. Large differences in the rates for different groups may indicate need for tailored services for the underserved group.
Exhibit D-2 presents a table shell that shows how employment outcome closures may be compared by type of employment outcome and race/ethnicity.
Exhibit D-2: Table Shell for Comparing Employment Outcomes by Race/Ethnicity
All
empl
oym
ent o
utco
mes
Com
petit
ive
empl
oym
ent
Exte
nded
em
ploy
men
t
Self-
empl
oym
ent
Bus
ines
s ent
erpr
ise
Hom
emak
er
Whites
#
%
Blacks
#
%
American Indian
#
%
Asian Pacific Islander
#
%
Two or more races
#
%
Hispanic/Latino
#
%
Service patterns of people with most significant disability and their needs for supported employment. The RSA-911 data also provide information about people who have most significant disabilities and the extent to which they are using supported employment services. An examination of the service patterns and outcomes for people with most significant disabilities and those who received supported employment services may help understand their needs. Data on supported employment from the SF-269 Financial
D-3

Inform state plan
Status Report (not publicly available on the RSA Web site but available from state agency office) also will assist in understanding current service patterns in supported employment.
Using RSA-911 information on CRPs. The RSA-911 data includes information on whether an individual was referred by a CRP, whether services were provided by public or private CRPs, and whether individuals were closed in “extended employment,” or work in nonintegrated settings. This can be examined at the substate level (offices, districts) to identify differences in service utilization, costs, or coverage.
Annual Client Assistance Program Report (RSA-227). The RSA-227 is used to analyze and evaluate the services administered by designated Client Assistance Program (CAP) agencies. CAP grantees advocate for clients and client applicants in the VR system as well as provide assistance and advocacy regarding other employment-related services (Rehabilitation Services Administration, 2006a; 2006b; 2008b). RSA-227 summarizes services provided to consumers, consumer applicants, and CRPs. Relevant data elements include number of individuals served, reasons for closing cases, demographics of those who were served, and description of “problem areas” identified in CAP cases. Examination of the CAP reports can help to determine whether any minority groups, disability groups, or age groups have a disproportionate number of CAP cases relative to their representation in the VR agency, which could be a possible indicator of that group being unserved or underserved. A qualitative examination of “problem areas” could help to determine needs for outreach or services. See Exhibit D-4 at the end of the appendix for the data included in the RSA-227.
Waiting List Data. Examining the characteristics of individuals on the waiting list may identify some people who currently are unserved by the VR system. It also may be useful to compare the characteristics of the people on the waiting list with the state’s population, by demographic factors such as race and ethnicity, education level, age group, gender or other factors to learn whether any groups are disproportionately represented on the list relative to their representation in the state.
Annual Review Report. The Annual Review Report (ARR) uses information from a variety of sources to summarize each state’s data and annual performance, including compliance with standards and indicators (Rehabilitation Services Administration, 2007b). Many data items in this report are relevant to the CSNA. Exhibit D-3 shows the tables that are contained in the ARR, which assist in understanding service patterns for different populations (underlined below) as well as overall employment outcomes, expenditures and other pertinent information. (Information that is most relevant to the CSNA is underlined in the Exhibit.)
4

Appendix D Guide to Assessing VR Needs
Exhibit D-3: List of tables in the ARR
Table 1 Program highlights for FY
Table 2 Caseload statistics
Table 3 Individuals whose cases were closed after receiving services by disability for ADRS (includes visual impairments, physical disorders, communicative impairments, cognitive impairments, and mental/emotional impairments.)
Table 4 Special populations served (includes transition youths)
Table 5 SSI recipients and SSDI beneficiaries
Table 6 Services provided (includes eight broad services plus “other”)
Table 7 Average hours worked per week and average hourly earnings, competitive employment
Table 8 Employment outcomes by type of employment (types include: • Employment without supports in an integrated setting • Employment with supports in an integrated setting • Self-employment • BEP • Homemaker and unpaid family worker)
Table 9 Average hours worked per week and average hourly earnings by type of employment (same types as table 8)
Table 10 Employment outcomes by disability (same disabilities as table 3)
Table 11 Employment rates by disability (same disabilities as table 3)
Table 12 Average hours worked per week and average hourly earnings by disability (same disabilities as table 3)
Table 13 Employment outcomes for special populations (Includes transition youths)
Table 14 Employment rates for special populations (Includes transition youths)
Table 15 Average hours worked per week and average hourly earnings for special populations (includes transition youths)
Table 16 Employment outcomes for SSI recipients and SSDI beneficiaries
Table 17 Employment rates for SSI recipients and SSDI beneficiaries
Table 18 Average hours worked per week and average hourly earnings for SSI recipients and SSDI beneficiaries
Table 19 Staffing patterns
Table 20 Funds available
Table 21 Funds used
Table 22 Services provided to individuals
D-5

Inform state plan
Table 23 Standard 1: Did the state agency assist eligible individuals to obtain, maintain, or regain employment?
Table 24 Standard 2: Did the state agency ensure that individuals from minority backgrounds have access to VR services? (Important for minorities)
Table 25 Decisions made in formal reviews
Table 26 Types of complaints/issues involved in disputes
Performance Standards. One of the data items reported in the ARR is Evaluation Standard 2, an example of existing data that provides information relevant to the needs of minorities in the CSNA. RSA requires state VR agencies to report Performance Indicator 2.1 as the measure of Evaluation Standard 2, equal access opportunity for individuals of all groups and backgrounds. Performance Indicator 2.1 compares the “minority service rate” to the “nonminority service rate.” The minority service rate is the percentage of minority individuals who received services under an Individualized Plan for Employment (IPE) of all the minority individuals who exited the VR system in a given year. It is calculated by dividing the number of minorities who received services under an IPE by the total number who exited the VR system. (The nonminority service rate is the corresponding percentage for individuals who are not minorities.) The two rates are compared in a ratio by dividing the minority service rate by the nonminority service rate. Evaluation Standard 2 is met if Performance Indicator 2.1 is .80 or higher.
In conjunction with other information in the model, the performance indicator provides information about current services to minorities, which is relevant to understanding the rehabilitation needs of minorities in the state.
Quarterly Cumulative Caseload Report (RSA-113). The Quarterly Cumulative Caseload Report (RSA-113) includes items from the current caseloads related to eligibility for services, development of an employment plan, implementation of the plan, and outcomes. The RSA-113 includes a wide range of data generated from the state agencies’ administrative data regarding people who are currently receiving services. The report also includes information on order of selection. This report contributes to providing a snapshot of services during the previous fiscal year, which is useful for estimating service needs for next year. Exhibit D-5 at the end of the appendix shows the data elements that are included in the RSA-113.
Annual VR Program Cost Report (RSA-2). The Annual VR Program Cost Report (RSA-2) contains data on total expenditures, number of individuals served and expenditures by service category, person years by different categories of staff, expenditures by funding sources (Title VI B vs. other), and carry-over funds. Exhibit D-6 at the end of this appendix contains the data items reported in the RSA-2. Many items in the RSA-2 are relevant to the CSNA. For example, the section on individuals served and
6

Appendix D Guide to Assessing VR Needs
expenditures by service category provides information about how many people received each of eight major services and the cost of providing those services, which is relevant to understanding current overall service patterns.
As another example, the Total Expenditures section of the RSA-2 includes information on Community Rehabilitation Programs, including the following variables:
• Services Provided by State VR Agency Personnel Employed at Agency Operated Community Rehabilitation Programs
• Services purchased by State VR Agency From: Public Community Rehabilitation Programs
• Services purchased by State VR Agency From: Private Community Rehabilitation Programs
• Services for Groups of Individuals with Disabilities: Establishment, Development, or Improvement of Community Rehabilitation Programs
• Services for Groups of Individuals with Disabilities: Construction of Facilities for Community Rehabilitation Programs
These data are relevant to answering the CSNA question about the need to establish, develop, or improve community rehabilitation programs within the state, along with other VR data, such as existing internal reports and consumer satisfaction data on CRPs.
Review of VR Agency Reports and Internal Studies. Other existing VR agency reports and internal studies may contain information about rehabilitation needs in the state: reports or studies that help to answer questions in the CSNA about needs of people with most significant disabilities, including supported employment; needs of minorities and other unserved or underserved groups; needs of those served through other components of the WIA system; and need to establish, develop, or improve CRPs within the state.
Monitoring Reports on VR Agencies. Although they are not yet available for all states, the Monitoring Reports on VR agencies provide a summary of information related to performance and compliance. (Rehabilitation Services Administration, 2007a). Current monitoring reports are available at <http://www.ed.gov/rschstat/eval/rehab/107-reports/2008/index.html>
VR Counselors and staff stakeholder surveys and interviews
VR counselors and other staff are another rich source of information about the service needs of consumers who are served and rehabilitation needs in the state and substate areas. In particular, VR counselors and other staff can help to answer questions about the service needs of consumers, including needs for supported employment services. In the model, VR counselors also provide information about the need for adding or
D-7

Inform state plan
expanding Community Rehabilitation Programs (CRPs). See Appendix G: Stakeholder Data for more information on primary data collection with VR staff and other stakeholders.
8

Appendix D Guide to Assessing VR Needs
Exhibit D-4: Data items in the Annual Client Assistance (CAP) Report, RSA-227
D-9

Inform state plan
10

Appendix D Guide to Assessing VR Needs
D-11

Inform state plan
12

Appendix D Guide to Assessing VR Needs
Exhibit D-5: Data items in the RSA-113
D-13

Inform state plan
Exhibit D-6: Data items in the RSA-2
14

Appendix D Guide to Assessing VR Needs
D-15

Inform state plan
16

Appendix E Guide to Assessing VR Needs
Appendix E: State-level Data from National Programs
A number of federal programs collect and disseminate state-level administrative data about program recipients with disabilities that are relevant to the Comprehensive Statewide Needs Assessment (CSNA). In particular, the Individuals with Disabilities Education Act (IDEA) and Section 504 data on students with disabilities, Social Security data on recipients of disability benefits, and Workforce Investment Act (WIA) data on people receiving services from the WIA system all provide information that helps inform the CSNA.
Data from these programs are collected in all states, using uniform data collection systems that result in cost-effective and reliable information. However, administrative state-level data do not always provide the exact information that is most relevant to the CSNA. For example, data on students served under Section 504 is not available for transition students alone, a particular group of interest to VR, but rather for the entire Section 504 program that serves elementary through secondary students.
Individuals with Disabilities Education Act (IDEA)
The Data Analysis System of the U.S. Department of Education, Office of Special Education, provides program data on special education in the United States. Data are collected from all the states on children and youths, ages 0 to 21 years, who are served under the Individuals with Disabilities Education Act (IDEA).
In order to qualify under IDEA, children and youths must need special education and related services by reason of their disability. IDEA includes children and youths with the following disabilities:
• Specific learning disabilities
• Speech or language impairments
• Mental retardation
• Emotional disturbance
• Multiple disabilities
• Hearing impairments
• Orthopedic impairments
• Other health impairments
• Visual impairments
• Autism
E-1

Inform state plan
• Deaf-blindness
• Traumatic brain injury
• Developmental delay
IDEA data can provide:
• detailed state-level information on transition-age youths in special education;
• specific disabilities of transition-age students, including disabilities that are significant in the VR system and may be most significant depending on the individual state’s criteria (e.g., mental retardation, deaf-blind, multiple disabilities, traumatic brain injury);
• graduation and dropout patterns by racial and ethnic minority groups; and
• graduation and dropout rates, by disability, for students 14 years and over.
Analyses of IDEA program data are published each year in an annual report to Congress; the 28th Annual Report is the most recent such report (U.S. Department of Education Office of Special Education and Rehabilitative Services (OSERS), 2008a, 2008b). Volumes One and Two of the report are available at:
<http://www.ed.gov/about/reports/annual/osep/2006/parts-b-c/28th-vol-1.pdf>
< http://www.ed.gov/about/reports/annual/osep/2006/parts-b-c/28th-vol-2.pdf>
IDEA Data Examples
Size of the transition age population in special education. The IDEA data can assist in understanding the magnitude of the transition-age population that is potentially eligible for VR services in the state. Exhibit E-1 shows a portion of Table 1-1: Children and students served under IDEA, Part B, by age group and state. The table shows, by state, the total number of students, ages 3 to 21 years, in the program, as well as the numbers in the following age groups that are most relevant to the VR CSNA: 12-17 years, 14-21 years, and 18-21 years.
2

Appendix E Guide to Assessing VR Needs
Exhibit E-1: Table 1-1: Children and Students Served Under IDEA, Part B, by Age Group and State
Table 1-1. Children and students served under IDEA, Part B, by age group and state: Fall 2005
State 3-5 6-11 12-17 6-17 14-21 18-21 3-21
Alabama 8,218 36,675 42,497 79,172 33,309 5,245 92,635
Alaska 2,082 7,855 7,309 15,164 5,406 751 17,997
Arizona 14,062 53,375 51,825 105,200 37,706 5,242 124,504
Arkansas 10,286 25,125 29,060 54,185 22,428 2,843 67,314
California 66,653 280,902 302,391 583,293 224,610 26,372 676,318
Colorado 10,540 34,567 34,250 68,817 26,086 4,141 83,498
Connecticut 7,881 27,222 33,079 60,301 25,675 3,786 71,968
Delaware 2,073 7,793 8,203 15,996 6,136 788 18,857
District of
Columbia 507 4,537 5,905 10,442 4,513 789 11,738
Florida 34,350 164,811 180,464 345,275 136,380 19,291 398,916
Georgia 20,728 87,681 82,627 170,308 58,733 6,560 197,596
Hawaii 2,423 7,803 11,126 18,929 8,323 611 21,963
Idaho 4,043 12,287 11,649 23,936 8,543 1,042 29,021
Illinois 35,454 131,096 142,645 273,741 107,138 14,249 323,444
Indiana 19,228 76,487 73,460 149,947 56,458 8,651 177,826
Iowa 6,118 27,324 35,477 62,801 27,133 3,538 72,457
Kansas 9,267 26,584 26,937 53,521 20,537 2,807 65,595
Kentucky 21,317 47,000 36,927 83,927 27,212 3,554 108,798
Note that Table 1-8 in the same volume shows the number of students by each individual year of age, so that tailored tables may be constructed showing other age groups of interest. For example, if a state VR program had a special program that targeted
E-3

Inform state plan
transition-age youths 15-19 years of age, it is possible to construct a table showing the numbers in that age group within the special education population.
Transition-age students by disability category. The IDEA tables also provide a picture of the representation of different disabilities (as defined under IDEA) in the special education transition-age population. For example, an indication of the number of transition-age students with mental retardation, traumatic brain injury, multiple disabilities, deaf-blind, and other categories may help the VR agency plan for supported employment needs of these groups. Exhibit E-2 shows a portion of Table 1-5, which includes the number of students with disabilities, 12 to 17 years old, by disability category and state. The full table includes all 13 IDEA disability categories, some of which may be “most significant,” depending on the state’s definition. Another table, Table 1-6 (not shown) includes the same disability categories for the population 18-21 years.
Exhibit E-2: Table 1-5: Students Ages 12 through 17 Served Under IDEA, Part B, by Disability Category and State
Table 1-5. Students ages 12 through 17 served under IDEA, Part B, by disability category and state: Fall 2005
State All disabilities
Specific learning
disabilities
Speech or language
impairments
Mental retardation
Emotional disturbance
Alabama 42,497 26,466 2,459 6,029 1,472
Alaska 7,309 4,538 773 405 489
Arizona 51,825 34,806 1,679 3,984 5,016
Arkansas 29,060 14,670 1,269 6,042 532
California 302,391 199,273 20,904 18,050 19,444
Colorado 34,250 16,373 3,250 1,743 5,507
Connecticut 33,079 14,525 3,434 1,457 4,609
Delaware 8,203 4,997 x 1,063 563
District of 5,905 3,114 302 693 1,119
4

Appendix E Guide to Assessing VR Needs
Columbia
Florida 180,464 107,829 13,019 19,480 22,275
Georgia 82,627 33,091 3,048 14,998 14,276
Hawaii 11,126 6,200 x 1,048 1,686
Idaho 11,649 6,757 996 997 833
Illinois 142,645 85,144 5,388 14,010 19,565
Dropout rates by race and ethnicity. IDEA data also provide information on the graduation rates and drop out rates of students with disabilities from different racial and ethnic groups. Exhibit E-3 shows a portion of Table 4-4d: Hispanic students age 14 through 21 with disabilities served under IDEA, Part B, who exited school, by exit reason and state. Among other data, the table includes the numbers of students with disabilities who either dropped out or “moved, not known to continue.” The dropout rate includes students in both of these two categories.
Exhibit E-3: Table 4-4d Hispanic students age 14 through 21 served under IDEA, Part B, who exited school, by exit reason and state
Table 4-4d. Hispanic students ages 14 through 21 with disabilities served under IDEA, Part B, who exited school, by exit reason and state: 2004-05a
State Exiting total
Graduated with diploma
Received a certificate
Reached maximum age b
Died Dropped outc
Alabama 66 45 13 x x x
Alaska 33 17 x x x 15
Arizona 2,423 1,218 x 53 x 1,139
Arkansas 107 67 x x x 36
California 14,705 8,352 678 172 48 5,455
Colorado 862 493 23 55 10 281
Connecticut 834 405 7 18 8 396
E-5

Inform state plan
Delaware 40 30 x x x 6
District of Columbia 23 19 x x x x
Florida 3,786 1,437 997 x x 1,339
Georgia 323 79 116 x x 127
Hawaii 58 49 x 5 x x
Idaho 196 106 x x x 84
Illinois 2,151 1,458 16 34 6 637
Using data from this and the parallel tables on graduation and dropout rates for other minority groups, one can compare dropout rates for specific minority groups with the rates for other racial and ethnic groups in the state and/or with the rates for racial and ethnic groups in the U.S. racial and ethnic groups with particularly high dropout rates in the state will have heightened needs for VR education and training services.
Dropout rates by disability. Another IDEA table provides data that can be used to identify disability groups with especially high dropout rates in the state. Exhibit E-4 shows a portion of Table 4-1d which includes data on exit reasons for students with emotional disturbance. The same information is available for other disabilities in parallel tables.
Exhibit E-4: Table 4-1d: Students age 14 and older with emotional disturbance served under IDEA, Part B, who exited school, by exit reason and state
Table 4-1d. Students age 14 through 21 with emotional disturbance served under IDEA Part B, who exited school, by exit reason and state: 2004-05ª
State Exiting total
Graduated with
diploma
Received a certificate
Reached maximum
age
Died Dropped outb
New Jersey 2,145 1,105 x 21 x 1,010
New Mexico 192 53 x x x 109
New York 3,871 1,216 462 49 20 2,124
North Carolina 795 215 38 9 6 527
6

Appendix E Guide to Assessing VR Needs
North Dakota 137 69 x x x 64
Ohio 1,819 496 448 x x 660
Oklahoma 511 233 x x x 277
Oregon 432 138 45 x x 238
Pennsylvania 2,017 1,560 8 30 7 412
Rhode Island 341 193 x x x 142
South Carolina 693 129 67 x x 494
South Dakota 70 22 x x x 47
Tennessee 520 118 140 x x 256
Texas 2,879 986 1,065 7 11 810
Utah 167 81 x x x 84
Vermont 248 111 6 x x 130
Virginia 1,460 414 456 7 7 576
Disability groups with especially high dropout rates are at risk for being underserved. For example, in some states the dropout rate for youths with emotional disturbance is greater than 50 percent, indicating a high need for special training, education and other supports for this group in the VR system.
Section 504 Data
The Office for Civil Rights (OCR) of the U.S. Department of Education reports limited data by state on students who are covered under Section 504 but are not receiving services under IDEA. These students have a physical or mental impairment that substantially limits one or more major activities but do not have learning issues that make them eligible for IDEA; they are not included in the IDEA data described above (U.S. Department of Education Office for Civil Rights, 2005; 2007). Unfortunately, data on the total number of "Section 504 only" students are not disaggregated by age or transition status or by specific disability. Nevertheless, these data can help to give a rough indication of the size of the Section 504 population, a group that is potentially eligible for VR services during transition. In addition, state-level departments of education may be
E-7

Inform state plan
able to assist in disaggregating the data by age to give a more accurate estimate of the transition-age group with Section 504 disabilities
Section 504 Data can provide:
• an overall picture of the size of the population with disabilities that was not eligible for IDEA services but did receive Section 504 services because of their disabilities.
The Section 504 data may be accessed from the “The 2006 Civil Rights Data Collection” area at the Office for Civil Rights (OCR) of the Department of Education at the following Web site: <http://www.ed.gov/about/offices/list/ocr/data.html?src=rt>.
Table 3B <http://ocrdata.ed.gov/ocr2006rv30/VistaApp/browsetables.aspx?VistaLanguage=en> provides the number of students receiving Section 504 services only, for the states and the U.S. The table may be downloaded as a comma delimited or Excel file.
Section 504 Data Example
Exhibit E-5, based on an Excel file download (Table 3B) from the Web site listed above, shows the number of students in the state of Indiana who received Section 504 services.
Exhibit E-5: 2006 Civil Rights Data Collection, Projected Values for the State of Indiana
Data Items ED101 Number of Children Receiving Services Under Section 504 6,430
Social Security Data
The Social Security Administration (SSA) collects program data on people who receive disability benefits, including Social Security Disability Insurance (SSDI), which is a part of the Old Age, Survivors and Disability Insurance (OASDI), and Supplemental Security Income (SSI). Individuals may receive benefits from either or both programs, depending on their work history, age, and financial resources. SSA also provides information on participation in the Ticket to Work Program.
Social Security Disability Insurance (SSDI). A federal program in the Social Security Administration providing monthly benefits to disabled workers and their dependents. Disabled workers are people under age 65 who receive benefits as part of the OASDI program. Workers build protection through employment covered under Social Security (compulsory tax on earnings). The disability definition is an inability to engage in
8

Appendix E Guide to Assessing VR Needs
substantial gainful activity because of any medically determinable permanent physical or mental impairment. Later amendments made the disability length of time necessary for eligibility to be at least five months.
Supplemental Security Income (SSI). The federally administered Supplemental Security Income program provides income support to people 65 and over, blind or disabled adults, and blind or disabled children who have little or no income or other financial resources. In order to be considered disabled for SSI an adult must be unable to engage in any substantial gainful activity by reason of a medically determinable physical or mental impairment that is expected to result in death or last for a continuous period of at least 12 months. Blindness is defined as 20/200 or less vision in the better eye with the use of correcting lenses or with tunnel vision of 20 degrees or less. Children who have a physical or mental impairment that results in marked or severe functional limitations are eligible for SSI.
Ticket to Work (TTW). The Ticket to Work Program is a federal program designed to help Social Security beneficiaries with disabilities go back to work. The program offers employment support services to beneficiaries between the ages of 18 and 64 who receive SSI or SSDI. These employment support services include vocational rehabilitation, training, referrals, job coaching, and counseling. The Ticket to Work program is designed so that people who are making progress toward employment goals do not lose their benefits because they are working and thus no longer meet the criteria of “unable to engage in substantial gainful employment.” People who are eligible for the program receive a “Ticket to Work” in the mail. The ticket allows beneficiaries to access employment support services provided by VR agencies or ticket service providers called employment networks (EN’s) (World Institute on Disability, 2007).
People who are receiving Social Security disability benefits are considered to have significant disabilities and to be eligible for VR services, provided they intend to achieve an employment outcome (Hager, 2004). States that have adopted order of selection vary in their rules about whether people who receive Social Security disability benefits are considered to have a “most significant disability.” In some states receipt of SSI/SSDI automatically means that a person has a most significant disability.
Social Security data provide:
• the magnitude and age distribution of the SSI/SSDI population in the state, all of whom are considered to have at least a significant disability;
• numbers of Social Security recipients who return to work; and
• the number of Ticket to Work tickets that have been issued to VR agencies and to other entities.
E-9

Inform state plan
Each year, SSA publishes an Annual Statistical Supplement to the Social Security Bulletin (Annual Supplement) (Social Security Administration, 2009a). The data are available at: <http://www.ssa.gov/policy/docs/statcomps/supplement/2008/>
Data on Ticket to Work are available at: <http://www.socialsecurity.gov/work/tickettracker.html>
Social Security Data Examples
Size of the population that receives Social Security disability benefits. The Social Security data provides the magnitude and age distribution of the SSI/SSDI population in the state. It can also contribute to an understanding of the magnitude and age distribution of the “most significant” population in states where receipt of Social Security disability benefits qualifies as a “most significant” disability under order of selection. Exhibit E-6, shows a portion of Table 27: Disabled Workers in Current-Payment Status, available at: <http://www.ssa.gov/policy/docs/statcomps/di_asr/2007/sect01c.html#table27>
Exhibit E-6: SSA Table 27: Disabled Workers in Current-Payment Status
Disabled Workers in Current-Payment Status
Table 27. Number, by sex, state or other area, and age, December 2007
State or area Total Under 35 35–39 40–44 45–49 50–54 55–59 60–FRA
All disabled workers
All areas 7,098,723 435,000 373,621 603,495 921,560 1,228,219 1,551,082 1,985,746
Alabama 186,067 9,690 9,864 15,865 24,230 33,452 41,983 50,983
Alaska 10,617 868 606 916 1,474 1,868 2,248 2,637
Arizona 130,052 8,142 6,984 10,743 16,744 22,476 28,138 36,825
Arkansas 115,806 6,655 5,949 9,475 14,874 19,959 25,575 33,319
California 593,506 34,926 29,576 48,968 76,124 103,942 132,453 167,517
Colorado 80,207 5,026 4,233 6,612 10,951 14,514 17,668 21,203
Connecticut 70,581 4,847 4,050 7,105 9,887 11,906 13,780 19,006
Delaware 22,855 1,316 1,165 2,080 3,145 4,126 4,909 6,114
10

Appendix E Guide to Assessing VR Needs
District of
Columbia 10,732 789 618 1,078 1,536 2,161 2,291 2,259
Florida 418,502 21,444 19,281 33,849 53,880 71,908 91,688 126,452
Table 27 provides information by age group, including total, under 35, 35-39, 40-44, 45-49, 50-54, 55-59, and 60 years and above.
Disabled workers who returned to work. Social Security data also provides information on disabled workers who received SSDI and/or SSI but had benefits withheld in that year because of substantial work and those whose benefits were terminated because of successful return to work. Exhibit E-7 shows a portion of Table 56: Disabled Workers Who Work, available at: <http://www.ssa.gov/policy/docs/statcomps/di_asr/2007/sect03g.html#table56>
Exhibit E-7: SSA Table 56: Disabled Workers Who Work
Disabled Workers Who Work
Table 56. Distribution, by state or other area, 2007
State or area
All workers,
December
Workers with benefits withheld
because of substantial work,
December
Workers with benefits terminated
because of successful return
to work, calendar year
Number
Percentage
of all workers Number
Percentage
of all workers
All areas 7,098,723 37,701 0.5 33,381 0.5
Alabama 186,067 462 0.2 537 0.3
Alaska 10,617 97 0.9 81 0.8
Arizona 130,052 1,069 0.8 857 0.7
Arkansas 115,806 420 0.4 316 0.3
California 593,506 4,783 0.8 3,234 0.5
Colorado 80,207 423 0.5 419 0.5
E-11

Inform state plan
Connecticut 70,581 540 0.8 464 0.7
Delaware 22,855 148 0.6 162 0.7
District of
Columbia 10,732 88 0.8 148 1.4
Florida 418,502 1,645 0.4 2,075 0.5
This table provides information about the relatively small percentage of the overall Social Security disability population that returns to work.
Ticket to Work. Social Security data provides information about the size of the population that is participating in Ticket to Work in the state and the number of tickets issued to VR agencies and other ENs. Exhibits E-8 and E-9 show portions of the tables on tickets assigned to ENs and to VR agencies, respectively. Both of these tables are available at: <http://www.socialsecurity.gov/work/tickettracker.html> (Social Security Administration, 2009b).
12

Appendix E Guide to Assessing VR Needs
Exhibit E-8: Ticket Tracker for Employment Networks (ENs)
EN Ticket Tracker Updated July 20, 2009
State (State Abbreviation
Table)
Tickets Issued (Net)
EN Contract Awards (current)
Tickets Assigned to EN's
AK 18, 086 3 17
AL 284,944 13 369
AR 172,078 13 296
AS 1,301 0 1
AZ 190,682 18 496
CA 1,103,981 110 4,078
CO 119,806 13 322
CT 107,536 23 208
DC 25,037 14 195
DE 32,548 4 35
FL 630,326 113 2,137
E-13

Inform state plan
Exhibit E-9: Ticket Tracker for State VR Agencies
State VRA Ticket Tracker Updated July 20, 2009
State (State Abbreviation
Table)
Tickets Issued (Net)
Ticket Assigned to State VRAs
Tickets In-Use SVR
AK 17,953 1 391
AL 283,420 15 2,967
AR 170,899 41 2,192
AS 1,300 0 1
AZ 189,731 37 2,327
CA 1,099,266 25 18,569
CO 119,148 13 2,135
CT 107,293 773 1,734
DC 24,804 12 565
DE 32,362 41 2,202
FL 626,152 75 9,407
FM 0 0 0
GA 335,148 304 4,614
GU 1,582 0 1
HI 34,207 0 1,381
IA 93,994 177 3,216
ID 48,982 31 1,973
IL 412,759 135 12,426
These tables include the number of tickets issued in each state, and the (relatively small) number of tickets assigned to the Employment Network providers with ED awards (Exhibit E-8) or to the state VR agency or agencies. (Exhibit E-9).
Workforce Investment Act (WIA) Data
Workforce investment system data represents an important part of the CSNA. In addition to the fact that the Rehabilitation Act’s description of the CSNA identifies the workforce investment system by name (Section 15 A (ii)), the gathering of needs related to this system is helpful in understanding the totality of need being met for individuals with disabilities. While VR concentrates on those with the most significant disabilities, the
14

Appendix E Guide to Assessing VR Needs
other components of the workforce investment system also provide employment services to individuals with disabilities who may not be aware of, qualify for, or desire the services of VR. Together, the data from VR and the workforce investment system will provide a more complete picture of need across all programs of public employment for individuals with disabilities and thereby provide a more fundamental answer to the overall question about the rehabilitation needs of individuals with disabilities in the state. The data also may reveal possible differences in the rates or types of services among different groups, for example that minorities, unserved, or underserved individuals with disabilities receive in VR and the workforce system, allowing for potential changes to service structures or opportunities for cooperation across programs.
The Workforce Investment Act (WIA) created a new comprehensive workforce investment system that was designed to alter the way employment and training services are delivered. WIA established three new programs – Adult, Dislocated Worker, and Youth – to replace the Job Training Partnership Act (JTPA). These programs were to allow for a broader range of services to the general population, removing income as a determinant for eligibility for program services. WIA also required that services for these programs and others be provided through a single service delivery system – the one-stop system (the “others” included the Wagner-Peyser funded Employment Service that according to a GAO report “focuses on providing a variety of employment-related labor exchange services including job search assistance, job referral, and placement assistance for job seekers, re-employment services to unemployment insurance claimants, and recruitment services to employers with job openings”) (Government Accountability Office, 2007).
The following list shows the parts of the workforce investment system as noted in the Workforce Investment Act of 1998:
Title I:
• One stop delivery systems (Sec 121)
• Providers of training services (Sec 122)
• Providers of youth activities (Sec 123)
• Adult and Dislocated Worker Employment and Training (Chapter 5)
• Job Corps (Subtitle C)
• Native American Programs (Sec 166)
• Migrant and Seasonal Farmworker programs (Sec 167)
• Veteran’s workforce investment programs (Sec 168)
• Youth Opportunity grants (Sec 169)
E-15

Inform state plan
• National Emergency grants (Sec 173)
Title II:
• Adult Education and Literacy
Title III:
• Wagner Peyser Act (Subtitle A)
• Trade Act of 1974 (Sec 321)
• Veteran’s Employment programs (Sec 322)
• Older Americans Act of 1985 (Sec 323)
Title IV:
• Rehabilitation Act Amendments of 1998
16

Appendix E Guide to Assessing VR Needs
The WIA mandatory programs and federal agencies include the following:
Federal Agency Mandatory Program
Department of Labor WIA Adult WIA Dislocated Worker WIA Youth Employment Service (Wagner-Peyser) Trade adjustment assistance programs Veterans’ employment and training programs Unemployment Insurance Job Corps Senior Community Service Employment Program Employment of training for migrant and seasonal farm workers Employment and training for Native Americans
Department of Education
Vocational Rehabilitation Program Adult Education and Literacy Vocational Education (Perkins Act)
Department of Health and Human Services
Community Services Block Grant
Department of Housing and Urban Development
HUD-administered employment and training
The U.S. Department of Labor’s Employment and Training Administration (DOLETA) maintains a grantee reporting system for WIA grantees called the Workforce Investment Act Service Record Data (WIASRD). It covers the following programs: the Workforce Investment Act Information Management System (OMB No. 1205-0420), the Labor Exchange Reporting System (OMB No. 1205-0240) for programs administered under the Wagner-Peyser Act and the Veterans Employment and Training Service, the Trade Adjustment Assistance Program (OMB No. 1205-0392), the National Farm worker Jobs Program (OMB No.1205-0425) and the Indian and Native American Program (OMB No. 1205-0422) (U.S. Department of Labor 2007b).
The WIASRD is submitted by states to DOLETA on an annual basis. The WIASRD files contain detailed information on program completers (i.e., exiters), including demographics, types of services received, and outcomes attained as a result of
E-17
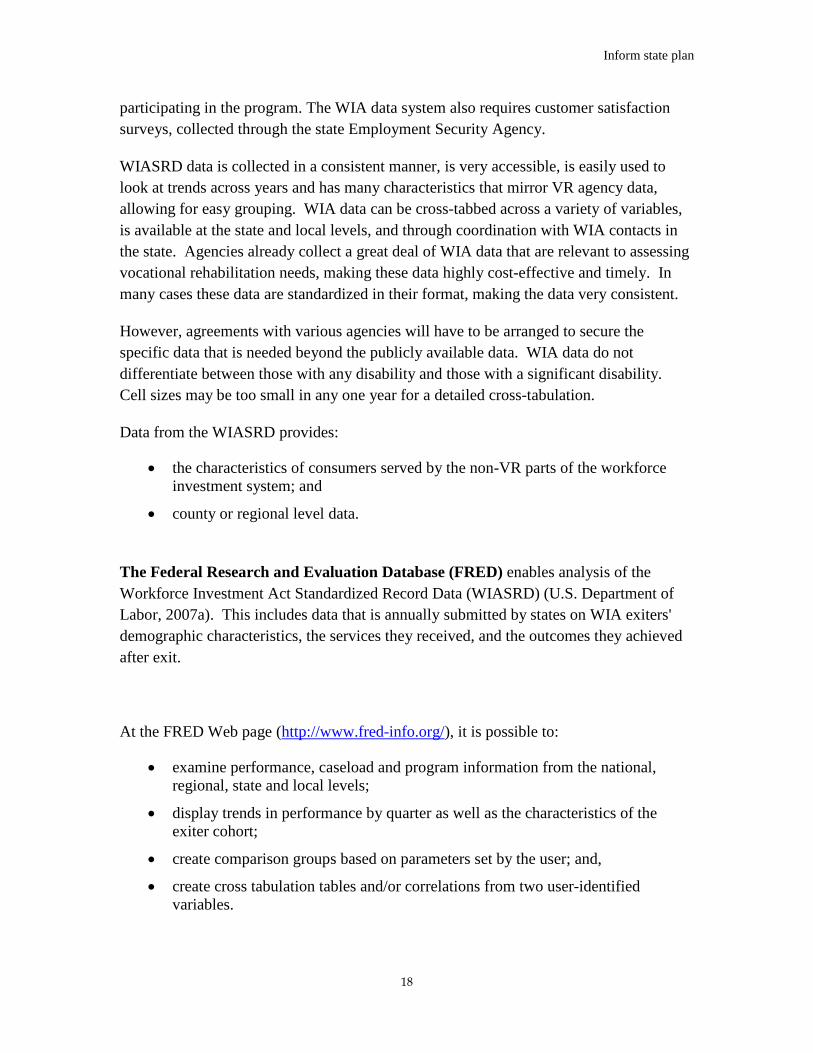
Inform state plan
participating in the program. The WIA data system also requires customer satisfaction surveys, collected through the state Employment Security Agency.
WIASRD data is collected in a consistent manner, is very accessible, is easily used to look at trends across years and has many characteristics that mirror VR agency data, allowing for easy grouping. WIA data can be cross-tabbed across a variety of variables, is available at the state and local levels, and through coordination with WIA contacts in the state. Agencies already collect a great deal of WIA data that are relevant to assessing vocational rehabilitation needs, making these data highly cost-effective and timely. In many cases these data are standardized in their format, making the data very consistent.
However, agreements with various agencies will have to be arranged to secure the specific data that is needed beyond the publicly available data. WIA data do not differentiate between those with any disability and those with a significant disability. Cell sizes may be too small in any one year for a detailed cross-tabulation.
Data from the WIASRD provides:
• the characteristics of consumers served by the non-VR parts of the workforce investment system; and
• county or regional level data.
The Federal Research and Evaluation Database (FRED) enables analysis of the Workforce Investment Act Standardized Record Data (WIASRD) (U.S. Department of Labor, 2007a). This includes data that is annually submitted by states on WIA exiters' demographic characteristics, the services they received, and the outcomes they achieved after exit.
At the FRED Web page (http://www.fred-info.org/), it is possible to:
• examine performance, caseload and program information from the national, regional, state and local levels;
• display trends in performance by quarter as well as the characteristics of the exiter cohort;
• create comparison groups based on parameters set by the user; and,
• create cross tabulation tables and/or correlations from two user-identified variables.
18

Appendix E Guide to Assessing VR Needs
Data may be examined by program: WIA Adult, WIA Dislocated Workers, WIA Older Youth, WIA Younger Youth, and WIA National Emergency Grants. Each of these WIA program areas has a section on the Web site. Exhibit E-10 shows the diagnosis and planning tools screen for the WIA Adult program.
Exhibit E-10: FRED Screen for WIA Adults Program
On each program page the Ad Hoc Analysis tool allows one to create frequency or cross-tabulation tables from the WIASRD data. Exhibit E-11 shows a selection of variables for a cross-tabulation in the WIA Adult program.
E-19

Inform state plan
Exhibit E-11: FRED WIA Variables
It is also possible to generate these tables "by" other factors in the database. For example, the Web site allows generation of a gender and race cross tabulation by local workforce area. Exhibit E-12 shows selection of geography variables.
20

Appendix E Guide to Assessing VR Needs
Exhibit E-12: FRED WIA Selection of Geography Variables
One can also select both a geography and program year of exit –including an option to select all years. See Exhibit E-13 for an example of selecting multiple variables.
E-21
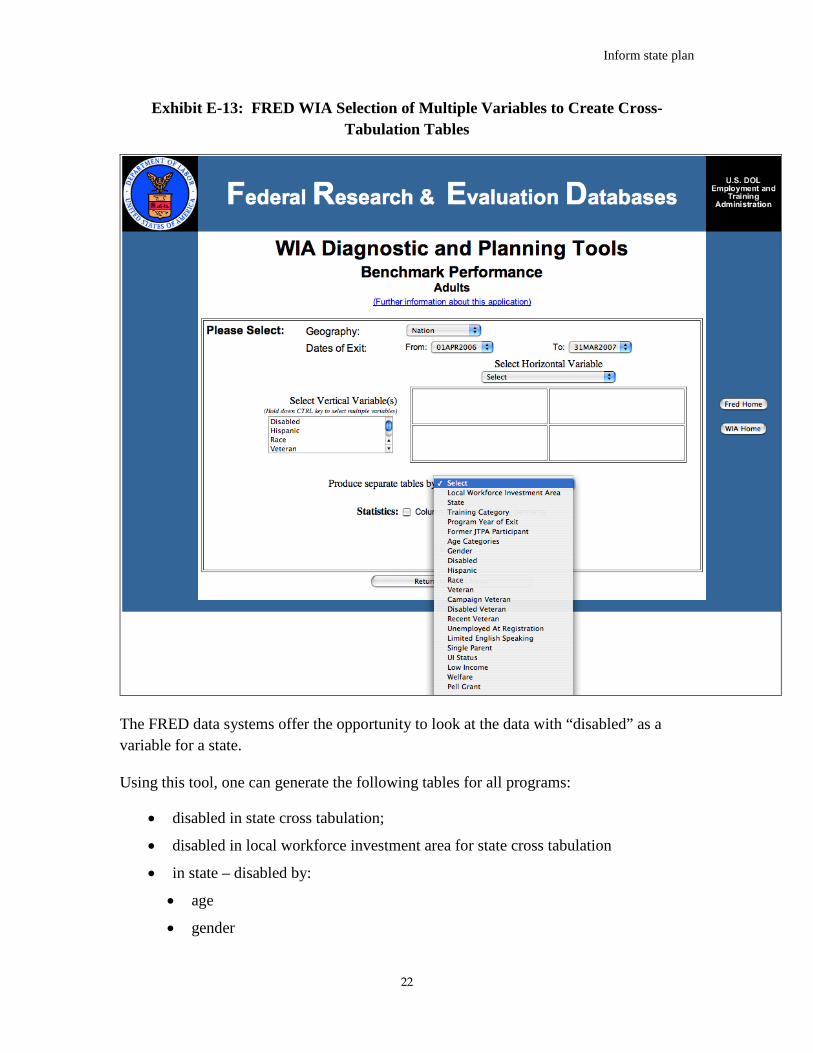
Inform state plan
Exhibit E-13: FRED WIA Selection of Multiple Variables to Create Cross-Tabulation Tables
The FRED data systems offer the opportunity to look at the data with “disabled” as a variable for a state.
Using this tool, one can generate the following tables for all programs:
• disabled in state cross tabulation;
• disabled in local workforce investment area for state cross tabulation
• in state – disabled by:
• age
• gender
22

Appendix E Guide to Assessing VR Needs
• Hispanic
• race
• education
• limited English speaking
• low income
• welfare
• high school dropout
• occupation at placement
• average annual earnings
• length of program stay
• For trend analysis (Optional) – program cross tabulations for other years
Information is also available by measure. For example, for Adults, the following measures are available: Adult Entered Employment Rate; Adult Retention Rate; Adult Earnings Change; Adult Average Earnings, and Adult Credential Rate. Similar measures are available for the other programs (Dislocated Workers, Older Youth, and Younger Youth).
E-23

Inform state plan
Exhibit E-14: FRED Measures in Adult WIA Data
DOLETA performance results Web page. Posted on the U.S. Department of Labor’s Employment and Training Administration’s Web site (http://www.doleta.gov/performance/results/Reports.cfm? #wiastann) are the WIA state annual reports summaries in excel format as well as WIASRD summary reports by state. WIA data tables are standardized and show the same information for every state and for the nation. The tables cover:
1. Table A- Workforce Investment Customer Satisfaction Results
2. Table B- Adults Program Results
3. Table C – Outcomes for Adult Special Populations (including Individuals with Disabilities)
4. Table D – Other Outcome Information for the Adult Program
5. Table E – Dislocated Worker Program Results
6. Table F - Outcomes for Dislocated Worker Special Populations (including Individuals with Disabilities)
24

Appendix E Guide to Assessing VR Needs
7. Table G - Other Outcome Information for the Dislocated Worker Program
8. Table H.1 – Youth (14-21) Program Results
9. Table H.2 – Older Youth (19-21) Program Results
10. Table I - Outcomes for Older Youth Special Populations (including Individuals with Disabilities)
11. Table J – Younger Youth (14-18) Results
12. Table I - Outcomes for Younger Youth Special Populations (including Individuals with Disabilities)
Performance is also reported by local area. Exhibit E-15 shows an example of a disability-relevant table and chart for one state.
E-25

Inform state plan
Exhibit E-15: Sample State-Level Tables for Adult WIA Data
State Level Tables – Adult WIA Program
Table C - Outcomes for Adult Special Populations Public Assistance
Recipients
Receiving Intensive
or Training Services
Veterans Individuals With
Disabilities Older Individuals
Entered
Employment
Rate
63.7%
2,442
71.2%
2,890
67.2%
2,114
65.3%
1,485
3,841 4,060 3,145 2,274
Employment
Retention
Rate
76.3%
2,131
78.0%
2,457
78.6%
1,815
79.3%
1,341
2,793 3,149 2,308 1,691
Earnings
Change in
Six Months
$4,110
$10,965,303
$1,916
$5,685,481
$2,768
$6,129,323
$664
$1,055,926
2,668 2,968 2,214 1,590
Employment
and
Credential
Rate
48.4%
1055
47.9%
863
43.5%
499
49.4%
394
2,182 1,801 1,147 798
Coordination with state WIA administrator or State Offices of Workforce Security. The data recommended above in the FRED data system is collected and entered by the state’s WIA administrator or the state’s Employment Security Agency. Coordination with
26

Appendix E Guide to Assessing VR Needs
this resource can provide data beyond that which is described above. State contacts can be found at http://www.doleta.gov/regions/.
Wagner-Peyser and Veteran’s Employment programs use forms ETA 9002 and VETS 200 to report on activities to the U.S. Department of Labor. On those forms there is reporting on the number of persons with disability, veterans status, demographic information, and services received (career guidance, job search, referred to employment, and referred to WIA services).
Exhibit E-16 is an example of a state’s data produced by this national reporting.
Exhibit E-16: Sample State Wagner-Peyser Data
STATE - WAGNER-PEYSER Program Year 2007
New Jersey
Total Job Seekers Total Eligible
Claimants
Total Veterans and
Eligible Persons
Number Percent Number Percent Number Percent
Total Active Job Seekers Total Participants 247 653 100 0% Eligible Claimants 150 287 60 7% 150 287 100 0% 11 626 63 1% Veterans and Eligible Persons 18 418 7 4% 11 626 7 7% 18 418 100 0% Dislocated Workers 7 279 2 9% 380 2 1% Persons with Disabilities 4 903 2 0% 993 5 4% Migrant and Seasonal Farmworkers 150 0 1% 103 0 1% 2 0 01% Staff-Assisted Service Distribution Received Staff-Assisted Services 231 753 93 6% 144 595 96 2% 17 956 97 5% Career Guidance 54 827 22 1% 37 868 25 2% 2 603 14 1% Job Search Activities 145 785 58 9% 98 027 65 2% 12 693 68 9% Referred to Employment 49 519 20 0% 21 306 14 2% 4 404 23 9% Referred to WIA Services 7 531 3 0% 5 521 3 7% 386 2 1% Received Workforce Info Services 163 265 65 9% 105 327 70 1% 9 819 53 3%
Outcomes
Entered Employment 118 611 77 328 10 129 Entered Employment Rate Base 207 361 132 115 17 505 Entered Employment Rate 57% 59% 58% Employment Retention at Six Months 99 725 64 744 9 755 Employment Retention at Six Months Rate Base 127 937 79 768 12 034 Employment Retention at Six Months Rate 78% 81% 81% From EBSS 11/19/08
E-27

Inform state plan
28

Appendix F Guide to Assessing VR Needs
Appendix F: State and Substate Reports and Other Materials
State and Substate Reports and Other Materials
Public agencies and private organizations generate a wide variety of resources, including reports, data sets, needs assessments, surveys, hearings and other materials that are often relevant to understanding the rehabilitation needs of people with disabilities in a state. These resources can help to answer the specific questions of the VR comprehensive statewide needs assessment (CSNA), that is: needs of people with most significant disabilities, including their need for supported employment; needs of minorities and other unserved or underserved groups; needs of people served in the statewide workforce investment system; and needs for establishment, development and improvement of community rehabilitation programs. Existing reports and other materials may also provide general information about the rehabilitation needs of people with disabilities in the state.
As these reports and other materials already exist, this is a cost effective method of obtaining information. They provide information that is unique to the state or other substate geographic regions; and in some cases, these sources may be a cost-effective way to obtain information on needs of people with disabilities in a particular city, county or other geographical area. The content and types of information will be unique to a state or locality. The quality of the data, reports, and other materials also vary, making it important to assess the reliability of the methods and the quality of the analysis and reporting.
Examples of state and substate reports and what they can provide include:
• Developmental Disabilities Councils publish a five-year strategic State Plan with estimates of the number of people with developmental disabilities in the state and often reports on people with DD who received supported employment services.
• The National Association of State Directors of Developmental Disabilities Services (NASDDDS) co-sponsors an Adult Consumer Survey in conjunction with the National Core Indicators effort to measure performance of state developmental disabilities systems. Measures of employment are available from this survey.
• Some State Departments of Mental Health have state-specific information about the population with severe mental illness, including prevalence by state and/or county and demographic characteristics that may affect the need for VR services.
• State Traumatic Brain Injury (TBI) offices or registries may have information about the prevalence of TBI in the state.
F-1

Inform state plan
• The Centers for Disease Control (2007) publishes data for some states on TBI hospitalization and fatalities.
• Agencies and organizations that serve people with significant disabilities may have reports that focus specifically on their needs related to supported employment, such as results of surveys, focus groups or hearings with consumers and their families, businesses, and/or rehabilitation providers. Consumer organizations such as United Cerebral Palsy Association (UCPA), TASH, and the National Alliance on Mental Illness (NAMI), among many others, will be important sources of these types of reports.
• State Plans of the DD Councils may have existing reports or other materials on any population that the VR agency has identified as unserved or underserved in a particular state, such as the needs of American Indians, veterans, people with limited education, or inner city residents.
• Specific state-level reports may be available from the state’s Workforce Investment Board. There are also Web sites with information about state and local resources and reports on disability issues within the workforce investment system, such as the One-Stop State Toolkit <http://www.onestoptoolkit.org/statelocalbytopic.cfm>.
• Some states have membership organizations of community rehabilitation programs (CRPs) that may be a source of information about these programs (e.g., Oregon Rehabilitation Association).
• State Departments of Health and Human Services, Departments of Economic Development or Departments of Labor may have reports or other materials on CRPs.
• Existing reports may also identify trends and emerging unserved or underserved groups. For example, existing reports may identify an increase in the number of students with autism in the schools.
• Population trends among people with specific disabilities may affect rehabilitation services, such as an increase in HIV/AIDS, diabetes, or other conditions that can lead to functional disabilities in the state or in a particular city or region.
• The Centers for Disease Control (CDC) has data on diabetes prevalence and trends for states and counties, which can help in planning for services to groups with diabetes-related disabilities. <http://apps.nccd.cdc.gov/DDTSTRS/default.aspx>
Potential Resources. Each state has a somewhat different configuration of agencies and private organizations, precluding an exhaustive list. In general, it is helpful to scan recent reports and statistics from as many as possible of the major disability-related state departments and state or local organizations to look for information that will specifically help to answer the questions of the VR comprehensive needs assessment. The following list provides a starting point for locating and reviewing sources in the state:
2

Appendix F Guide to Assessing VR Needs
• State, county and local agencies that serve people with disabilities including departments, divisions, boards, councils or authorities:
• Aging and disability services
• Developmental services or developmental disabilities
• Education and/or special education
• Housing
• Mental health
• Mental retardation
• Personal Assistance Services (PAS), Attendant Services, In-home Supportive Services
• Public health
• Regional centers
• Social services
• Transportation
• Welfare
• State or local offices or units of federal programs, including:
• Independent Living Services, Department of Rehabilitation
• Medicaid, including Medicaid waivers and Medicaid Infrastructure Grants (MIGs) (National Association of State Medicaid Directors provides links to state offices: http://www.nasmd.org/links/state_medicaid_links.asp)
• Social Security
• Veterans Affairs
• State and local service providers, including:
• Consumer and advocacy organizations (e.g., UCPA, TASH, NAMI)
• Local independent living centers
• Rehabilitation facilities, hospitals or other providers, especially those attached to teaching and research hospitals and universities
• Supported employment programs
• Research resources in the state or region, including
• Colleges and universities, especially those with departments, grants or contracts related to rehabilitation, special education or other disability subjects
• Rehabilitation Engineering Research Centers (RERCs) (Search on “rerc” at http://www.naric.com/research/pd/advanced.cfm)
F-3

Inform state plan
• Rehabilitation Research and Training Centers (RRTCs) (Search on “rrtc” at http://www.naric.com/research/pd/advanced.cfm)
• The Regional Continuing Education Programs (RRCEPs) and Community Rehabilitation Programs (CRP-RRCEPs) are another existing source of information on CRPs (http://www.rrcepnationalconsortium.org/resourcesdir.htm).
• University Centers for Excellence in Developmental Disabilities (UCEDDs) and other university affiliated programs (Directory available at http://www.aucd.org/directory/directory.cfm?program=UCEDD
• www.statedata.info Another source of state data, this Web site includes data sets from state mental retardation/developmental disabilities agencies, the Rehabilitation Services Administration, the Social Security Administration, and the U.S. Department of Labor.
• Kaiser State Health Facts at http://www.statehealthfacts.org/index.jsp
• Other State, Regional or Local Resources (which often combine service provision and research)
• ADA Technical Assistance Centers (formerly Disability Business Technical Assistance Centers or DBTACs) (Search on “dbtac” at http://www.naric.com/research/pd/advanced.cfm)
• Spinal Cord Centers (Go to SCI-Info at http://www.sci-info-pages.com/rehabs.html or Spinal Cord Injury Information Network at: http://www.spinalcord.uab.edu/
• Traumatic Brain Injury Centers and Registries (Go to the Brain Injury Association of America at http://www.biausa.org/stateoffices.htm; or the Traumatic Brain Injury Collaboration Space at http://nashia.org/issues/tbi.html)
4

Appendix G Guide to Assessing VR Needs
Appendix G: Input from Stakeholders
Gathering input from stakeholders is an important part of the CSNA. Surveys, key informant interviews, focus groups and hearings are the tools for gathering the perspectives of the stakeholders.
In this appendix we review the methods and their advantages and limitations for those stakeholders, describe what information should be retrieved, and give examples, as available.
These methods are frequently used in needs assessment as well as in other social science research. While these methods are common, experience and knowledge of how best to use them is needed in order to achieve meaningful results. Experience with the methods is assumed here. Methods textbooks can provide additional depth if needed, as can several needs assessment texts, including Reviere, Berkowitz, Carter & Ferguson (1996a), Soriano (1995), and Altschuld and Witkin (2000).
Surveys
Surveys are often the method of choice in need assessments (Berkowitz, 1996b). Surveys generally use close-ended instruments with a predefined set of topics. They may also include open-ended questions, but one advantage is the speed with which a survey using close-ended questions can be analyzed. Surveys can be conducted with the entire population of interest or with a sample of the population.
There are four main options for a survey data collection: mail, telephone, electronic, and in-person. The choices are best made on budget, type of information to be gathered, detail of information, and target audience of collection.
Mail surveys are best for straightforward, factual information, counts or numbers (e.g., of clients served), and budgetary information. Mail surveys work best when they are short and to the point. They are relatively inexpensive to conduct, but to achieve an adequate sample, follow-up mailings to nonrespondents can raise the cost. Mail surveys also need accessible alternatives, such as large print and Braille versions.
Electronic mailings or Web-based data collections are even more inexpensive than direct mail while offering the same advantages. However, the respondent group needs to be electronically aware and capable, although it can be made available at local libraries, Centers for Independent Living, and other consumer groups. Accessibility is a key issue here as well. One advantage of the Web method is the opportunity to cut costs on data entry by more easily loading data from respondents directly into a database. This does require some sophistication with Web-based database programming.
G-1
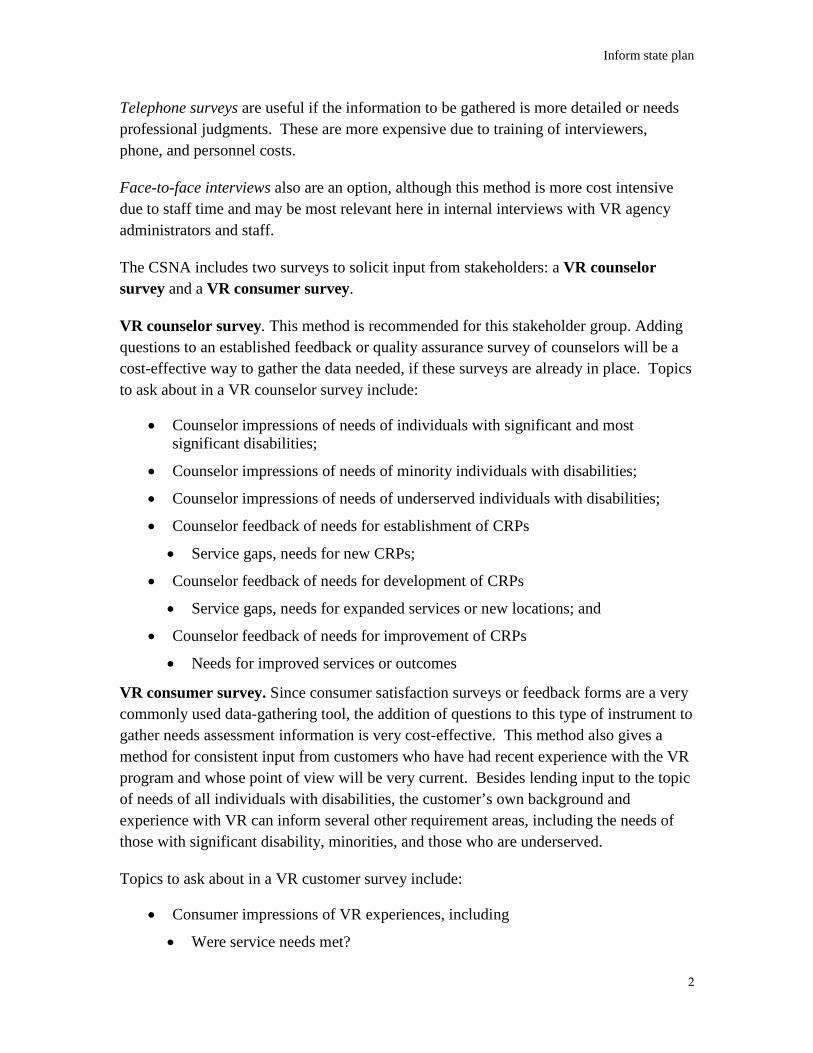
Inform state plan
Telephone surveys are useful if the information to be gathered is more detailed or needs professional judgments. These are more expensive due to training of interviewers, phone, and personnel costs.
Face-to-face interviews also are an option, although this method is more cost intensive due to staff time and may be most relevant here in internal interviews with VR agency administrators and staff.
The CSNA includes two surveys to solicit input from stakeholders: a VR counselor survey and a VR consumer survey.
VR counselor survey. This method is recommended for this stakeholder group. Adding questions to an established feedback or quality assurance survey of counselors will be a cost-effective way to gather the data needed, if these surveys are already in place. Topics to ask about in a VR counselor survey include:
• Counselor impressions of needs of individuals with significant and most significant disabilities;
• Counselor impressions of needs of minority individuals with disabilities;
• Counselor impressions of needs of underserved individuals with disabilities;
• Counselor feedback of needs for establishment of CRPs
• Service gaps, needs for new CRPs;
• Counselor feedback of needs for development of CRPs
• Service gaps, needs for expanded services or new locations; and
• Counselor feedback of needs for improvement of CRPs
• Needs for improved services or outcomes
VR consumer survey. Since consumer satisfaction surveys or feedback forms are a very commonly used data-gathering tool, the addition of questions to this type of instrument to gather needs assessment information is very cost-effective. This method also gives a method for consistent input from customers who have had recent experience with the VR program and whose point of view will be very current. Besides lending input to the topic of needs of all individuals with disabilities, the customer’s own background and experience with VR can inform several other requirement areas, including the needs of those with significant disability, minorities, and those who are underserved.
Topics to ask about in a VR customer survey include:
• Consumer impressions of VR experiences, including
• Were service needs met?
2

Appendix G Guide to Assessing VR Needs
Other services needed
• Was desired employment outcome achieved?
• Services, processes that worked well
• Recommendations for improvement
An example of a customer survey can be seen at the end of this appendix (Exhibit G-1).
Focus Groups
Focus groups provide depth on a relatively small number of topics. They rely on either unstructured or open-ended instruments that concentrate on a clearly defined set of topics. This method aims to establish communication for the facilitator to gain a broad understanding of the participant’s point of view. Focus group facilitators need to be trained in how to effectively manage the groups, especially how to encourage the respondents in conversation.
Focus groups usually bring together eight to 12 individuals based on characteristics on which the research seeks input. While the number of participants may vary, it should be large enough to gather a diversity of opinion but small enough so that everyone can participate.
The model contains at least five focus groups to solicit input from stakeholders: focus groups of people with disabilities, an Employer focus group, a joint Disability Navigator/One-Stop staff/VR staff focus group, a VR Administrative staff focus group, and a service provider/CRP focus group.
Focus groups of people with disabilities. Example focus groups include:
• individuals with significant disabilities (e.g., blind group, deaf group, mobility impairment group);
• minority individuals with disabilities (e.g., African American, Asian American, Hispanic, American Indian, etc.);
• most significant disabilities and underserved individuals with disabilities (e.g., mental retardation group, mental illness group, traumatic brain injury group, other groups identified as most significant and/or underserved in the state); and
• unserved individuals with disabilities: Use CILs, advocacy groups, One-Stops, and other local community resources to recruit individuals who have not used VR services but are eligible.
Topics to discuss in the focus groups include:
G-3

Inform state plan
• VR services needed
• Barriers to service
Employer focus group. One of the most important ways to understand market demand is to hear from the people that the product is intended to reach. In this case, employers can express requirements or preferences such as entry level worker skills or behaviors they need in their organizations, which may be interpreted as needs for individuals coming through the VR or WIA system. A focus group is the preferred method for gathering input from these stakeholders for several reasons: 1) a detailed understanding of the perspectives of employers is required to implement a responsive plan (close-ended questions in a survey might provide some answers, but not at the level of depth and understanding that can really help an agency take the steps necessary to be responsive); 2) employers have shown a recent disinclination for responding to surveys; and 3) a focus group can also promote or reinforce a connection with the employer community that will serve both the employers and the VR agency to mutually beneficial ends.
Topics to discuss in an employer focus group:
• Employer needs for entry-level worker skills
• Employer needs for entry-level worker behaviors
• Employer needs for accommodations for workers with disabilities
• Other employer needs for which VR or WIA programs can prepare applicants and workers.
Disability Navigator/One Stop staff/VR staff focus group. Disability Program Navigators (DPNs) are located in One-Stop Career Centers. The DPN program is to provide facilitation of integrated, seamless and comprehensive services to persons with disabilities in One-Stop Career Centers; improve access to programs and services; facilitate linkages to the employer community and develop demand responsive strategies to meet recruitment and retention needs; increase employment and self-sufficiency for Social Security disability beneficiaries and other people with disabilities; develop new and ongoing partnerships to leverage resources; and create systemic change.
The approximately 500 Navigators throughout local workforce investment areas in 45 states plus the District of Columbia and Puerto Rico train One-Stop staff to help individuals with disabilities access and navigate the programs and supports needed to maintain and gain employment. Navigators facilitate the transition of in- and out-of-school youth with disabilities to assist in obtaining employment and economic self-sufficiency. Navigators conduct outreach to organizations that serve people with disabilities. Navigators are not case managers, rather the position focuses on expanding the capacity of the One-Stop Career Center to serve customers with disabilities. Many
4

Appendix G Guide to Assessing VR Needs
Navigators are developing cross agency “integrated resource teams” to blend and braid resources around an individual job seeker’s employment needs.
A focus group that includes one or more Disability Navigators or equivalent along with One-Stop staff members and VR staff from the corresponding statewide or local area will provide a depth of understanding of the gaps and approaches as seen by the entire workforce system for individuals with disabilities. The joint focus group also offers the opportunity for increased understanding and potential for coordination and cooperation between the systems. Topics to ask about in this joint Disability Navigator/One Stop staff/VR staff focus group:
• Service needs and gaps
• For individuals with a disability, including unserved and underserved
• For individuals with significant disability
• Need for supported employment
• For individuals served under the workforce investment system
• For establishment, development, and improvement of CRPs
• Opportunities for coordination and cooperation of VR and One-Stops
Service provider/CRP focus group. Focus groups of service providers and/or CRPs will provide input from the field on needs of individuals as well as on CRPs. Using a focus group is the most appropriate method due to the need for in-depth understanding of the issues.
Topics to discuss in this Service Provider/CRP focus group:
• Service needs and gaps
• For individuals with a disability, including unserved and underserved
• For individuals with significant disability
• Need for supported employment
• For individuals served under the workforce investment system
• For establishment, development, and improvement of CRPs
Key Informant Interviews
Key informant interviews are done with experts who are particularly knowledgeable about VR needs of people with disabilities, including people who have in-depth knowledge of the rehabilitation needs of individuals with disabilities and of the rehabilitation service system. As with focus groups, this method provides depth on a
G-5

Inform state plan
relatively small number of topics. These interviews use interview guides or open-ended instruments on a clearly defined set of topics. The aim is to establish a conversation and for the interviewer to gain a broad understanding of the respondent’s point of view. Interviewers should be trained in managing the key informant interview, especially how to draw out the respondent in conversation. Interviews can be done in-person or on the phone.
The model includes key informant interviews with 15-20 people knowledgeable on one or more of the following, including members of statewide and local boards and disability organizations:
• VR system
• State Developmental Disabilities system
• State Mental Health system
• Employment of people with disabilities, including WIA
• Community rehabilitation programs (CRPs)
• Community services for people with disabilities
• Needs of minorities with disabilities
• Unserved or underserved groups
Topics to discuss:
• Service needs and gaps
• For individuals with a disability, including unserved and underserved
• For individuals with significant disability
• Need for supported employment
• For individuals served under the workforce investment system
• For establishment, development, and improvement of CRPs
Community hearings
Commonly conducted in a public location where the audience size can be up to 100 people or more, community hearings offer the opportunity for members of an area to voice views and opinions for the agency to consider.
Community hearings will be particularly useful in gathering input on needs for individuals with disabilities, those with significant disabilities, and minority, unserved, and underserved populations.
6
Appendix G Guide to Assessing VR Needs
Use of existing hearings that review the State Plan will be a cost-effective method for input. Transcripts of these hearings can be reviewed for comments of needs as related to the populations identified in the Rehabilitation Act.
Other public hearings and testimony also will contain relevant information. Examples include hearings conducted by developmental disability, mental health, and Veteran’s Administration agencies. Public comment from state government legislative actions (such as testimony given at public meetings as bills pass through committees) also may contain input.
In addition to existing hearings, hearings on other specific CSNA questions such as CRP establishment, development, and improvement are appropriate.
G-7

Inform state plan
Exhibit G-1 Example Customer Survey
The Oregon Department of Vocational Rehabilitation (DVR) uses the following survey instrument for collecting data from consumers for a customer satisfaction survey. The instrument below is the long form. There is also a short form and corresponding forms in Spanish.
8

Appendix G Guide to Assessing VR Needs
G-9

Inform state plan
10

Appendix G Guide to Assessing VR Needs
G-11

Inform state plan
12

Appendix G Guide to Assessing VR Needs
G-13

Inform state plan
14

Appendix H Guide to Assessing VR Needs
Appendix H: Minorities and Unserved or Underserved Groups
The term “individuals with disabilities who are minorities and individuals with disabilities who have been unserved or underserved by the vocational rehabilitation program” may refer to a wide range of different groups.
In documents on the RSA Web site, “traditionally underserved” is often used to mean racial and ethnic minority populations. For example, a priority on “capacity building for traditionally underserved populations” cited services to individuals from minority backgrounds as the target population (Rehabilitation Services Administration, 2001) and a number of rehabilitation research and training centers on underserved populations have focused on racial and ethnic minority groups. Racial and ethnic minorities that have been traditionally unserved or underserved by the vocational rehabilitation program include African Americans, Hispanic or Latinos, Americans Indians, and Asian-Americans, but may also include people from two or more racial or ethnic groups, people with limited English proficiency and people from other racial, ethnic or cultural groups that may be minority groups in a state or substate area. A number of different methods for assessing the needs of minority groups within the state are offered, including data from the ACS, IDEA and WIASRD; census projections; economic projections; VR agency data, including the R-911; state and substate reports and other materials; customer satisfaction surveys; interviews with key informants; community hearings; and business focus groups.
However, unserved and underserved groups are not limited to racial and ethnic minorities. For example, a section of the RSA Web site on “traditionally underserved populations” also refers the reader to keywords for other populations, including “high risk students,” “at risk persons,” “developmental delays,” and other disabilities, which suggests that a number of other groups may be underserved, depending on the circumstances. A Web review of definitions of “unserved or underserved” revealed a long and varied list of populations that have been considered unserved or unserved within the vocational rehabilitation program. A list of populations that are potentially unserved or underserved is summarized below.
Examining an individual state context will determine whether any of the following listed groups or other groups that may be identified are unserved or underserved.
Unserved people are those who would be eligible for VR services but have not received any VR services.
Underserved groups are those that have not traditionally received equal access to and benefits of rehabilitation services (e.g., racial and ethnic minorities).
H-1

Inform state plan
The CSNA includes an examination of the size and needs of disability subpopulations and their representation within VR, which can help determine whether certain disability groups are unserved or underserved. Review of state and substate reports and other materials, as well as data collection from stakeholders, can help identify the other kinds of groups that are unserved or underserved in the community. In particular, interviews with key informants and hearings can help to reveal needs of individuals who are unserved in the VR program. VR agency data, including the R-911, VR counselor surveys, customer satisfaction surveys, interviews with key informants, and community hearings can provide an understanding of the needs of people who are underserved by the VR program.
Examples of Potentially Unserved or Underserved Groups
Racial, ethnic and cultural minorities. The Rehabilitation Act identifies people from racial and ethnic minorities as traditionally underserved, and other cultural groups may also be unserved or underserved:
• racial/ethnic minorities in general
• African American
• Asian/Pacific Islander
• American Indian/Alaska Native
• Hispanic/Latino
• two or more racial/ethnic groups
• limited English proficiency
• other linguistic or cultural minorities in the state
Disability groups that may be unserved or underserved. Depending on the particular state, there may be groups identified as unserved or underserved in that state. People with the following conditions have been mentioned in the literature as potentially unserved or underserved:
• mental illness, chronic or serious
• traumatic or acquired brain injury
• developmental disabilities, including mental retardation
• autism spectrum disorders
• deaf-blind
• deaf/hard of hearing
• spinal cord injury
2

Appendix H Guide to Assessing VR Needs
• blind/visually impaired
• degenerative conditions
• HIV/AIDS
• dual diagnosis
• other “low incidence” disabilities
Other potentially unserved or underserved groups. In addition, other groups have been identified in the literature as possibly unserved or underserved, and each state may have groups that are of particular interest because their needs are known to be unmet or only partially met. Depending on the particular state context, a review of existing reports or other materials, conducting interviews with key informants, and other primary data collection methods can assist in understanding the rehabilitation needs of one or more of these groups. Groups identified in the literature include, but are not limited to:
• students in transition
• veterans
• people living in rural areas
• older people, including the aging workforce
• people with limited education
• poor/low income people
• inner city residents
• victims of crime or domestic violence
• former prisoners
• other disadvantaged social groups
H-3


Appendix I Guide to Assessing VR Needs
Appendix I – Literature Review
In the literature, needs assessments have been defined in many ways. Given the purpose of the VR CSNA and its focus on informing the State Plan, the most relevant definitions include not only the conduct of the needs assessment but also a focus on how it is used. Reviere and her colleagues describe needs assessments as “a systematic and ongoing process of providing usable and useful information about the needs of the target population – to those who can and will utilize it to make judgments about policy and programs” (Reviere, Berkowitz, Carter & Ferguson, 1996b). They state that the process is “population –specific, but systemically focused, empirically based, and outcome-oriented. Needs assessment then is a form of applied research that extends beyond data collection and analysis to cover the utilization of the findings.” Witkin and Altschuld (1995) concur, describing a needs assessment as “a systematic set of procedures undertaken for the purpose of setting priorities and making decisions about program or organizational improvement and allocation of resources. The priorities are based on identified needs.” Furthermore, they state that “data gathering methods by themselves are not a needs assessment. Data collection is but one component in the process, which also includes analysis, presentation, and integration of the information” (Witkin & Altschuld, 1995).
What are the “needs” that the assessment is measuring? Witkin and Altschuld (1995) describe need as the discrepancy or gap between a present state, “what is,” and a desired end state, “what should be.” Kaufman (1992) describes need as the difference between the actual and the ideal. Grayson (2002) further notes that need is neither the present nor the future state but rather the gap between them. A need is not a thing in itself but, rather, an inference drawn from examining a present state and comparing it with a vision of a future (better) state or condition. In a sense, a need is the problem or issue of concern (Grayson, 2002). Reviere et al. (1996b) suggest a definition that synthesizes these ideas and define need as a gap between the real and ideal conditions that is both acknowledged by community values and potentially amenable to change.
Stakeholder involvement
Needs assessment is a participatory process (Witkin & Altschuld, 1995), with stakeholders ranging from clients who receive services to service providers, management, community members, funders, businesses or associations, and researchers invested in the outcome (Reviere et al., 1996b). Reviere et al. further emphasize the importance of inclusion of stakeholders, especially service and program users in “defining, targeting, and carrying out the research…” They note three rationales for the use of stakeholders in needs assessments. First, active participation will generate a sense of ownership, and that will increase the likelihood that the results will be used. Second, gathering input from
I-1

Inform state plan
diverse stakeholders will more strongly guide decision-making during conduct of the needs assessment and implementation of the findings. Finally, participation in this research can empower groups that have been previously marginalized.
Connection to plans and actions
Many authors note that successful needs assessments depend on quality planning (Altschuld & Witkin, 2000; Soriano, 1995; Reviere et al., 1996b; Reviere & Carter, 1996). They point to the connection between the needs assessment’s goals and its direct relationship to an organization’s planning, while also noting the political nature of conducting needs assessments. In the case of a vocational rehabilitation needs assessment, the Rehabilitation Act connects the goals to the generation of a state plan that uses the needs assessment’s findings (Region V Study Group, 1991a).
Methodology
Needs assessments are a “type of applied social research” and therefore must have a methodological design to collect and analyze data according to social science research guidelines (Reviere et al., 1996b). Several types of methods recur in the conduct of needs assessments: surveys of service users; use of existing data including area demographics as well as program data; use of key informants with knowledge of problems, needs and desires of the population; use of group processes such as focus groups; use of public hearings for testimony or assembling interested persons for consensus on service and needs priorities; and service user statistics (Lareau, 1983; Warheit, Bell & Schwab, 1979; and Harlow & Turner, 1993 in Reviere et al., 1996b).
Berkowitz (1996a) stresses that needs assessment methods should be driven by research questions, the needs the study is attempting to address, and recommends a matrix to link research questions to information goals and sources.
Information sources
One major approach is the use of existing information sources such as national or state survey data, program data, or administrative data. Use of this ”secondary data” may include use of existing tables, or may require new analysis. These data have a number of strengths: They provide estimates of prevalence and incidence (Region V Study Group, 1991a); they can include a wealth of demographic information; and they can provide easy access to program data on who is using services (Soriano, 1995). Other advantages include: the data are often free or low cost; they often include large respondent pools and good sampling methods – leading to valid data; and the data are usually fairly current or are available in a timely manner. Drawbacks include: the sources seldom contain the exact data one is seeking; program data do not describe anything about those not using
2

Appendix I Guide to Assessing VR Needs
services; data can require technical expertise to analyze (Soriano, 1995). Existing data will not necessarily reveal needs in a low-incidence population (e.g., Hmong) nor reveal how critical a unique need is among populations (e.g., need for native language interpreters). Another issue is that definitions of disability, severity, age ranges, nature (e.g., noninstitutionalized vs. all), and scope (i.e., national, regional, or state) of the populations usually do not correspond to definitions and classifications used in VR (Region V Study Group, 1991a).
Because of these shortcomings in relying on secondary data alone, needs assessments typically involve the collection of new information as well. “Primary data collection” can be both open- or close-ended, and quantitative or qualitative in nature. Needs assessments often use surveys, key informants, focus groups, and public hearings, to provide new information that is not available in existing data. Each of these methods also has advantages and disadvantages.
Surveys done with service participants, providers, or others involved in the service provision process can be cost-effective for gathering data from a large number of people with little assistance needed. Surveys also can address attitudes, perceptions, and needs for services (Soriano, 1995), and can allow for flexibility in assessing the expectations and needs of subgroups and other audiences concerned with the needs assessment (Region V Study Group, 1991a). Surveys, however, may need technical expertise in sampling, questionnaire design, and/or analysis to be technically valid (Berkowitz, 1996b; Region V Study Group, 1991a).
Key informants are those who are particularly knowledgeable about the community or the service process. Advantages of this method include the fact that participants can competently address topics, that only a limited number of participants are needed (Soriano, 1995), and that it is relatively inexpensive to conduct (Region V Study Group, 1991a). However, reliance on a small number of respondents may emphasize biased or skewed points of view, or the effort may miss some key informants view (Soriano, 1995; Region V Study Group, 1991a). Also, input may uncover potentially sensitive issues that an agency would prefer not to confront (Region V Study Group, 1991a).
Focus groups can give an understanding of the target market through meetings of small numbers of individuals. Focus groups allow for more participation by group members, concentration on quality (not quantity) of information and can be used to design more quantitative instruments, although they rely on facilitator expertise, and may lack broad representation (Soriano, 1995), and cannot be generalized statistically (Berkowitz, 1996a). This method can use open-ended questions that allow responses in the words of the respondent – and thus a greater range of complete responses – but time is needed to code responses – and responses are not easy to quantify (Soriano, 1995).
I-3

Inform state plan
Public hearings are conducted with members of the community at large. Hearings offer the community an opportunity to be heard, but they are likely not statistically representative and may be prone to the “squeaky wheel” effect: the most persistent advocates making the most comments. Advantages and disadvantages are similar to focus groups because of the use of an open response format.
One logical question is whether one method provides sufficient information. Generally, needs assessments include a mixture of quantitative and qualitative methods to increase the quality and validity of the findings. For instance, Altschuld and Witkin (2000) note that it is not possible to understand the current situation or the desired outcome from just one method.
Conclusions
Needs assessments should be useable and useful to program management and identify the gaps in existing services that can be reduced through policies and programs. Needs assessments combine the use of existing information and the collection of new information to address defined study questions or information goals. Any one method will have strengths and weaknesses, and there is no one “best” combination of methods. Stakeholder involvement is important to inform the needs assessment and planning process, to provide opportunity for input and buy-in, to assure the relevance of the data collection and the results, and to satisfy programmatic requirements.
4

Guide to Assessing VR Needs
Appendix J – Reviews of State Needs Assessments
To date, state VR agencies have addressed the needs assessment requirements in the Rehabilitation Act through different methods and designs. A review of current practice is useful in understanding the need for a model and for technical assistance. State agencies were invited to submit needs assessment materials as part of this project. Several agencies have shared documents; in addition, a few states include the needs assessment reports on their Web sites.
The following is based on a review of nine studies available for the project and shows a wide range of approaches to the satisfaction of the needs assessment requirements. Table 1 shows the extent to which these nine studies used different types of methodologies in identifying needs and summarizes the extent to which the specific information requirements defined in the Rehabilitation Act are addressed directly in the reports. The table also shows whether SRC involvement was described and whether the report included recommendations for the State Plan.
Of the nine studies, five used U.S. Census or American Community Survey information to estimate the prevalence of disability in the state. Other national survey sources were used in two of the studies to estimate specific conditions: in one case, blindness, and in another, mental illness.
Population and economic projections and forecasts can be valuable in identifying future directions, especially when considering service capacity. Two of the studies used population projections to look ahead to expected changes in state population.
I-5

Bibliography
Table 1: Need Study Methods and Coverage of Rehab Act Requirements
1 2 3 4 5 6 7 8 9 Total
State Population: Census, ACS • • • • • 5
Projections of population, economy • • 2
VR caseload data, 911, other data • • • • • 5
VR Agency reports, internal studies • • • • 4
Reports, surveys from other agencies • • • • • 5
Special written or internet surveys • • • • • • • • 8
Focus groups • • • • 4
Public hearings or discussions • • • 3
Identifies need for services for most significant disabilities
• • • • • 5
Identifies need for supported employment • • • 3
Identifies needs for services for unserved or underserved: minorities
• • • • • 5
Identifies need for services for specific other unserved or underserved groups
• • • • • 5
Identifies need to establish, develop, improve CRPs
• • • 3
Identifies need for services for individuals served through state workforce investment system
• • • 3
Involvement of SRC • • • • • • • 7
Shows relationship to State Plan • • • • • 5
Types of methods used (8) 6 6 5 2 1 4 4 7 1
Addresses required topics (8) 5 8 3 2 2 5 4 5 1
Information from the VR agency itself is a valuable resource for describing the current services and caseload and identifying VRs own trends and changes over time. Five of the studies used VR data from the case management system or existing data reports to describe characteristics of individuals served, services and expenditure.
6

Guide to Assessing VR Needs
Other agencies and organizations may have very relevant information, and five of these studies used such materials such as brain injury statistics from the Department of Health, a Department of Education study of Students in Transition, and an annual survey of state community rehabilitation programs.
Surveys are a popular needs assessment tool, valuable for collecting new information. Surveys were conducted in eight of the nine studies. Survey subjects varied by state and included community rehabilitation providers, VR counselors, supervisors, support staff, VR consumers, VR exiters, representatives of state businesses, students in transition, and education coordinators.
Focus groups were conducted in four of the nine studies, in most cases involving current VR consumers. Comments from public hearings and meetings were used as resources in three of the studies.
No specified topic from the Rehabilitation Act was addressed explicitly or systematically by all of these nine studies. Five of the studies identified the need for service for most significant disabilities. Usually this was with a focus on one or more conditions: blindness, developmental disability, mental illness, deaf/hard of hearing, brain injury, or transition. Three of these studies addressed the need for supported employment. Five reports discussed unserved or underserved populations, including racial or ethnic minorities. Need for establishment, development or improvement of community rehabilitation programs, or needs of people with disabilities served by other parts of WIA, were each addressed by three of the studies. Most studies (7 of 9) mentioned involvement of the state rehabilitation council in the design of the studies or in the review of findings and recommendations. Five mentioned recommendations for the State Plan and other actions of the agencies.
The studies show a wide range of choices in the methods and combinations of methods used. Some concentrated much of the information collection within VR and among VR consumers, limiting the input regarding individuals who do not currently receive VR services. Four of the nine studies used a number of methods in carrying out the study, while the others focused mostly on a few methods such as focus groups and surveys.
One of the nine studies explicitly addressed all Rehabilitation Act required topics and conditions, and several others were somewhat consistent with the content requirements, addressing at least four of the identified topics. In four cases, though, the studies focused more on the findings of a particular survey or other information collection, and, while providing useful information, these studies do not organize the findings to describe the needs as specified. Some addressed disability subpopulations but not specifically whether they were either most significant or unserved or underserved.
I-7

Bibliography
The nine studies reviewed spanned a period from 2004 to 2008 and represent a range of approaches to conducting needs assessments. From the differences in approach, it is clear that the agencies for the most part selected the topics to pursue and the methods to use. Furthermore, by focusing primarily on people already being served some state agencies are missing the sources that would help to identify needs that are not being met or individuals who are unserved or underserved by the system.
8