developing a secure online java-based data analysis and ... · to important data and intuitive data...
TRANSCRIPT

Developing a Secure Online Java-based
Data Analysis and Visualization Tool
Parag Dadhania,Lloyd Greenwald,Prashant Doshi,
andJohn R. Clarke
Technical Report DU-CS-04-06Department of Computer Science
Drexel UniversityPhiladelphia, PA 19104
October 2004
1

Developing a Secure Online Java-based Data
Analysis and Visualization Tool
Parag Dadhania and Lloyd Greenwald
Department of Computer Science, Drexel University
Philadelphia, PA 19104
{parag,lgreenwa}@plan.cs.drexel.edu
Prashant Doshi
Department of Computer Science, University of Illinois, Chicago
Chicago, IL 60607
John R. Clarke
Department of Surgery, Drexel University
Philadelphia, PA 19104

2
Summary
We describe the design and development of a web-based data analysis and visualization
tool that integrates back-end security and data analysis support with flexible front-end query
and visualization support, including a variety of common and uncommon data views.
Component technologies include Java servlets, Java-based data visualization modules, and
probabilistic modeling, reasoning, and machine learning data analysis tools. This paper
describes the design and development of our prototype tool, SOJDAV (Secure Online Java-
based Data Analysis and Visualization), as an example to ground our discussion of the
practice of creating such tools. The front-end components of SOJDAV are designed to
enable dynamic visualization of data over the Internet. Intuitive, dynamic data visualization
supports a broad range of distributed research and education goals. SOJDAV’s back-end
components provide varying levels of privileged access to data, models and analysis tools.
These back-end components are created using web server and servlet technology to
insulate the main database from unauthorized access and corruption, while maintaining the
integrity of valuable research data. Back-end tools have access to both a comprehensive
cleansed database of meaningful relational data and models derived from statistical and
Bayesian network integrations of this data. Our prototype implementation of SOJDAV has
been deployed to support medical research into time-critical patient care.
Keywords: Multi-component system, research and educational aid, probabilistic and
statistical analysis, web-based flexible analysis and visualization

3
1 Introduction
Even though modern hardware and database systems have made it possible to
store gigabytes of information, it can be difficult to fully exploit the information in a
large database with complicated structure. Developing systems with secure access
to important data and intuitive data visualizations can help a wide range of users
effectively employ and analyze information. This paper introduces a prototype web-
based tool – A Secure Online Java-based Data Analysis and Visualization Tool
(SOJDAV) – that provides a novice user an ability to construct both simple and
complex queries to analyze data, and secures important data through varying levels
of privileged access. Queries may include probabilistic modeling and reasoning via
Bayesian and Naïve Bayesian networks. This tool is aimed towards wide spectrum
of users, especially novices with limited computer expertise and limited knowledge of
the inner structuring of the database. We provide details of the integration of
component technologies used to create SOJDAV to inform the practice of
developing similar tools.
1.1 Motivation and Goals
The primary motivation for developing SOJDAV is to provide a distributed research
resource for inventing new techniques in time-critical patient care in emergency
center trauma management [16, 19, 17, 18, 4, 3, 12, 5]. To be useful to medical
practitioners and researchers as well as computer scientists the tool must provide an
intuitive interface. To provide secure distributed access to private data across a
variety of users with varying levels of authority the tool must implement a flexible
4
security solution. To accomplish these goals, SOJDAV provides intuitive access to
data by providing custom visualization of data views, secure access to software tools
and private data over public networks, and remote access and remote deployment of
component tools. The additional goal of this paper is to provide enough information
regarding our prototype tool so software practitioners can build similar tools.
The Internet has made possible large-scale dissemination and round-the-clock
availability of information. With this accessibility come security and privacy issues.
By carefully controlling access, SOJDAV protects valuable research data while the
flexible component-based architecture permits the integration of a variety of back-
end resources.
1.2 Database Visualization
Formally, database visualization is any procedure performed by a computer program
that integrates data from different sources and then transforms the data into images.
As described in [9], the database visualization process consists of the following three
steps:
1. Retrieving Data from Data Source – data source can be of different types and
can be located locally or distributed over the network
2. Mapping – transform original data into a geometric representation of the data
to provide the visual representation
3. Rendering and Displaying – display data in various formats
5
As proposed in [6], a database visualization tool usually has three functions: data
visualization, data manipulation, and data analysis. In addition to providing basic
functionalities, our tool integrates probabilistic data via Bayesian and Naïve
Bayesian network modeling, learning, and inference.
1.3 Approach
Our approach to designing and developing SOJDAV derives from its data sources
and intended users. Our data sources include a comprehensive medical database
and a series of probabilistic networks derived from this database. Our intended
users include medical personnel, medical researchers, and computer science
researchers. As each one of our anticipated users requires different software tools
and interacts with our primary data sources at different levels, SOJDAV has been
developed as an integration of multiple front-end and back-end technology
components.
Our multiple-component solution follows the Java Enterprise Edition (J2EE) [13]
standard for deploying multi-tier applications. Developing our tool using general-
purpose enterprise software development tools, rather than specialized component-
building software, permits us to use a range of commercial software applications
designed to interoperate in enterprise environments. Additionally, enterprise
development tools such as servlets provide a straightforward way to make use of
existing applications not originally designed for enterprise environments. Moreover,
basing our multiple-component architecture on general-purpose tools does not

6
preclude us from incorporating special-purpose software components. The
foundation of this secure distributed solution enhances the features of component
tools. Our multiple-component solution integrates database access, secure web
server and servlet software, statistical analysis and data visualization, and
probabilistic data integration support via Bayesian network modeling, learning and
inference.
Figure 1: Interaction of various components of our approach
Figure 1 depicts the various components implementing our multiple-component
solution. These components are deployed across a distributed system consisting of
one or more Web servers and multiple client machines. A Visualization component

7
co-resides with a client browser and interacts with server-based Security
component, Statistical Analysis component, and Modeling and Inference
components. A Visualization component never interacts directly with back-end
resources such as the relational database management system (RDBMS) or
Probabilistic Modeler. This architecture prevents unauthorized access to valuable
resources and hence protects data integrity. Furthermore, communication between
any components takes place over secure channels to ensure integrity and
confidentiality.
In Section 3 we describe the design of each component depicted in Figure 1 and the
architecture that permits these components to interoperate and transfer information
securely across public networks. Our solution provides both back-end security and
data integration support and front-end query and visualization support. We motivate
the design of this multiple-component system in the context of our larger medical
research and education efforts in Section 2. Section 4 provides details on the
design and implementation of SOJDAV; while section 5 demonstrates a simple user
interaction scenario. We discuss the effectiveness of this system and identify future
directions in Section 6.
2 Building and Analyzing the Core Database
A valuable research database motivates our work and provides the core of our
system development. Our work revolves around a comprehensive medical database
derived from a large data file from the Pennsylvania Trauma Systems Foundations

8
Registry containing 412 attributes of medical information on 169,512 patients
admitted to twenty seven trauma centers in Pennsylvania between 1986 and 1999.
Information collected on each patient can be broadly classified into the following
categories:
• Patient General Information
• Patient Clinical Data
• Process of Acute Care
• Timestamps of various processes
In the development of this database, we detected and corrected over 1000 data
entry errors in non-temporal fields and an additional 5500 errors in time and date
fields. Using a probabilistic context-driven approach [4, 5], we identified and
corrected four classes of error in our dataset: (1) general typographical errors, (2)
non-domain-specific errors (e.g. calculation errors), (3) domain-specific errors, and
(4) errors in the temporal ordering of time and date fields. The resulting cleansed
and validated database is now being used to provide statistical studies and
probabilistic models to help us better understand the effect of time delays on patient
outcome.
The visualization tool described in this paper assists users with manual decision-
making and exploratory analysis of the data and probabilistic models derived from
the data. Users have varying levels of secure data access that permit them to query
and extract information from this database. We developed this tool, in part, to
provide distributed access to the data and models to researchers outside our core

9
research team. Confidentiality and privacy restrictions require us to provide a
solution with varying levels of secure data access.
This system has already been used to develop new medical knowledge. In one
study [3], we show that the time to laparotomy for intra-abdominal bleeding from
trauma does affect survival for delays in ED up to 90 minutes. Additional exploratory
research includes investigating the use of machine learning algorithms to
automatically extract models from the data to provide a clearer picture of the
significance of certain parameters in the data. Models explored include naïve Bayes
and decision tree classifiers.
Figure 2: Data Modeling and Mapping
We apply a non-domain-specific transformation as the initial step of building our
visualization components, as depicted in Figure 2. In this approach, we provide a
data mapping that transforms data to structures that can be used in visualization.
During this data mapping procedure, all trivial and unwanted information is filtered
out and interesting information is transformed into a structured form, such as a
histogram. The data mapping procedure takes place in two different steps: (1)

10
transform the original data into Java objects and (2) incorporate the Java objects into
the visualization component. As part of our visualization front-end, SOJDAV makes
use of a widely known histogram plotter API known as JAS API [7].
3 Infrastructures and Architecture
In this section we describe our approach to designing and developing SOJDAV. We
begin this section by reviewing the component technology. Inspired by its central
promise, ‘write once, run anywhere’, we chose to build our solution based on Java
software platform. Our development effort concentrated on well-established sound
methods and proven technology including the Java Enterprise Edition (J2EE) [13]
standard for deploying multi-tier applications. Multi-tier component architectures
promote minimal interdependence amongst components. The resulting system
satisfies our requirements for flexible, intuitive use as well as permitting robust and
error-free software component deployment in real-world distributed environments.
3.1 System Infrastructure
Java Enterprise Edition (J2EE) defines a standard for developing multi-tier
applications in which all pieces of the application are portable across platforms and
servers. Key components of this standard are servlets to extend and enhance Web
servers, Java server pages to create dynamic Web content, and Enterprise
JavaBeans for deploying server-side as well as client-side components. J2EE
provides multiple messaging options, performance, scalability, and security.

11
Since we chose to develop a multiple-component solution, the J2EE [13] platform
was the ideal choice as it supports distributed applications that take advantage of a
wide range of new and evolving technologies, while simplifying development through
a component-based application model. This component-based solution permits
implementation of all necessary logic at the server-side, providing a simple and clear
interface to the user-end. Also, in compliance with the J2EE architecture, our
solution defines a client tier, a middle tier or Web container, and a back-end tier or
Enterprise Information System (EIS) tier [13] as shown in Figure 3.
Figure 3: The 3-tier multi- component architecture
The client tier supports a variety of client types, both outside and inside of corporate
firewalls [13, 1]. In our solution the client tier consists of Java applets [8] launched
from within WWW browsers. A client accesses the middle tier primarily using Web
standards, such as HTTP, HTTPS, HTML, and XML. More specific details of the
12
architecture of the novel client-tier component deployed in our solution is provided in
Section 3.2.
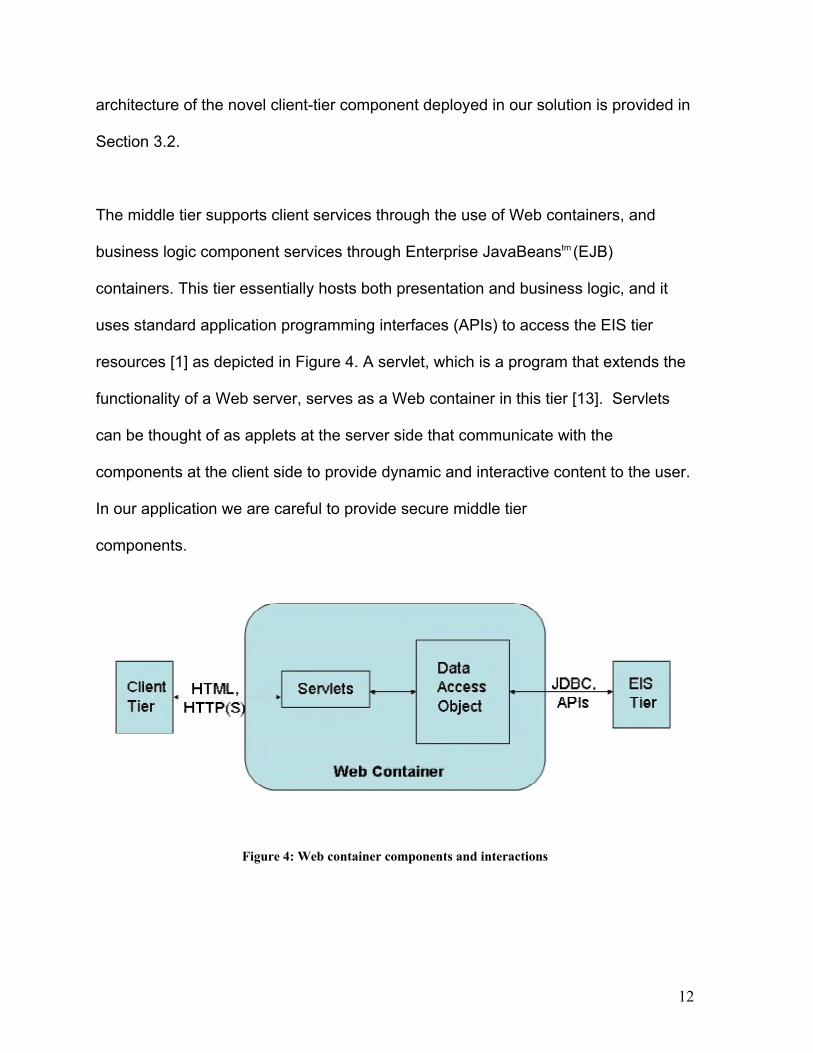
The middle tier supports client services through the use of Web containers, and
business logic component services through Enterprise JavaBeanstm (EJB)
containers. This tier essentially hosts both presentation and business logic, and it
uses standard application programming interfaces (APIs) to access the EIS tier
resources [1] as depicted in Figure 4. A servlet, which is a program that extends the
functionality of a Web server, serves as a Web container in this tier [13]. Servlets
can be thought of as applets at the server side that communicate with the
components at the client side to provide dynamic and interactive content to the user.
In our application we are careful to provide secure middle tier
components.
Figure 4: Web container components and interactions

13
The middle tier components make use of the Secure Socket Layer (SSL) protocol to
provide privacy and security over the Internet. SSL uses highly secure encryption to
allow client-server applications to communicate in a way that does not permit
eavesdropping or tampering [13]. Additionally, in this protocol servers are always
authenticated and clients are optionally authenticated for genuineness.
Figure 5: Enterprise Information System (EIS) tier components
The back-end or EIS tier supports access to existing information systems by means
of standard APIs, such as the Java Database Connectivity (JDBC) API. As depicted
in Figure 5, Relational Database Management Systems (RDBMS) and Legacy
Applications are examples of EIS tier resources. The SOJDAV EIS tier uses
PostgreSQL Server as the RDBMS for primary medical data storage, Weka APIs to
support Naïve Bayesian networks, and Netica tm APIs to support probabilistic

14
inference and storage of Bayesian networks. Since applets on the client tier do not
have direct access to the resources on EIS tier, the middle tier is designed as a
secure intermediary between the front- and back-ends.
3.2 System Architecture
In order to restrict clients’ direct access to data sources, SOJDAV is based on a
distributed asynchronous process communication architecture. This architecture
follows the client-server model for distribution of services and interoperability, while
permitting multiple clients to simultaneously access the services. In this architecture,
a client process provides a graphical user interface to visualize the information. A
server process performs most of the computation and generally resides on a
different machine. Figure 6 shows the general architecture of our tool.
Figure 6: System Architecture

15
3.2.1 Client Side Modules
A client module renders a graphical user interface, transforms the intermediate data
into displayable data and displays data graphically. Additionally, it communicates
with a server to retrieve intermediate data. In SOJDAV, a client consists of following
three modules:
1. Client Graphical User Interface Module
This module provides a graphical user interface for users to interact with our
tool. This module helps a user to formulate a query to retrieve data as well as
providing an interface to enter evidence for reasoning with probabilistic
networks. It also provides alternative display modes for data.
2. Layout and Display Module
The Layout and Display module is responsible for rendering all graphical
components for a user. The module initially sets up a graphical user interface
based on a user’s access level. Once user formulates a query and requests
data or histograms, this module converts intermediate data into appropriate
displayable format. This module also provides a user flexibility in how a
chosen histogram can be viewed. Upon user selection, this module repaints
a histogram to accommodate user selection.
3. Communication Module
This module bridges the gap between client and server in our tool. This
module resides with a client and provides methods to communicate with
server. Communication between client and server takes place over Secure
Socket Layer using HTTP.
16
3.2.2 Server Side Modules
Server side modules are responsible for interacting with database systems as well
as other application servers or services. In SOJDAV, a server consists of two sets of
modules:
1. Data Services Modules
The Data Services Modules consist of several Java servlets. Servlets are
designed for a specific purpose. Upon a client’s request, servlets will interact
with the appropriate Data Access Module to obtain raw data. They are also
responsible for formatting raw data in order to transmit it to a client.
2. Data Access Modules
The Data Access Modules retrieve and filter raw data from the data sources
and provide refined data to the appropriate Data Services Module. As data
sources can be of various types, our tool supports databases as well as
various probabilistic modelers. When databases are used as a data source,
we use JDBC-ODBC to access data sources. Similarly, we use Netica API
and Weka API to access probabilistic modeler data sources and machine
learning and probabilistic reasoning services.
4 System Design and Implementation
4.1 Client Components
Comprehensive, cleansed, and easily accessible large medical research databases
are rare resources. After putting forth the considerable effort to produce our
database we further understand its value to ourselves and the greater health care

17
and medical research communities. As mentioned earlier, we have already
employed and are continuing to employ this system to discover new medical
knowledge [3].
Providing intuitive and visual access to this data multiplies its value. Our goal in
designing a flexible client component is to provide convenient access to this data for
medical research. Our experience extracting data through manually constructing
queries and manually transferring data across independent applications informed
our user interface component and architecture design decisions.
The information retrieval process usually starts by formulating a query. The query
specifies which attributes of the data are desired and what filters to apply on records
containing these attributes. Query results are presented to the user, who then
evaluates the results and poses new queries. If the results are inadequate, the user
can re-specify the query and re-submit to obtain a refined result. This process is
known as refinement. There are many powerful query languages, such as SQL, to
provide this standard functionality. However, the potential audience of medical
researchers is much larger than the audience of researchers who have also been
trained in a formal query specification language. SOJDAV’s flexible client is
designed with an intuitive interface as an alternative to formal query specification
languages for novice users, while retaining the power of formal languages for
advanced users. Importantly, our client design maintains the security of our data
when accessed remotely.

18
As our client components are written entirely using Java and Java Beans with a
modular approach, it is easy to scale for more functionality. It also provides a secure
communication channel and does not require any specific platform to run.
4.2 Server Components
Our server components consist of several servlets that communicate with client and
back-end components. Servlets are Java programs that run on a server’s Java
virtual machine (JVM) and communicate with back-end components by means of
standard APIs. SOJDAV uses JDBC-ODBC APIs to communicate with Database
systems and Netica and Weka APIs to communicate with probabilistic inference and
machine learning systems to provide Bayesian network and Naïve Bayes network
modeling, respectively.
As with our client components, our server components are designed with a modular
approach. As a result, our system is flexible to change in one part of a module
without affecting the whole system. Also, a user can add more servlets that can
communicate with various legacy systems using their own APIs. This functionality
increases usability of our tool design in various domains.
4.3 Relational and Probabilistic Back-Ends
The server-side EIS tier interacts with a variety of third party systems through their
specific application programming interfaces. Systems that we are using include a
relational database system and software that permits efficient probabilistic inference

19
on Bayesian networks and machine learning using Naïve Bayes classifiers. In this
section, we describe these systems in further detail
4.3.1 Relational Database Management System
The trauma data is stored, organized, and manipulated through a relational
database management system called PostgreSQL. Use of a RDBMS to manage
data objects automatically enforces data integrity, data recovery in case of loss, and
data dependencies. In addition, such database systems may be accessed through
standard query language interfaces. These query language interfaces may be
embedded in high-level programming languages. Java Database Connectivity
(JDBC) – Open Database Connectivity (ODBC) provides a means to access
databases through programs written in the Java high-level programming language.
Through JDBC-ODBC, the use of a Java-based EIS tier allows efficient
communication between the server-component and the database system. All data
requests emanating from the user are captured by the EIS tier and passed onto the
database system for fulfillment.
4.3.2 Probabilistic Inference Systems
Bayesian Network
Bayesian networks provide intuitive and efficient methods for capturing and
manipulating probabilistic relationships between data. These representations have
been used effectively in medical domains since their inception. For example, the
HEPAR project [10, 11] employed a Bayesian network to predict one of 16 liver

20
disorders. Another example is a system called ALARM [2] that uses a Bayesian
network connecting 8 diagnoses, 16 findings, and 13 intermediate variables. The
system monitors patient conditions in medical centers and sounds an alarm for
distress.
Figure 7: A high level representation of our Bayesian network

21
We have constructed a series of Bayesian networks to capture the probabilistic
relationships in our trauma data. These networks vary in structural complexity,
speed of inference, predictive capability, and required expert knowledge [4]. A
medical expert (co-author John R. Clarke, M.D., Trauma Surgeon and Professor of
Surgery) and pertinent medical literature provided expert knowledge. These
networks are being used for further study into the effects of time delay on patient
outcome. A high-level description of the data and general structure of the
relationships between attributes is given in Figure 7.
An example Bayesian network constructed in this work is shown in Figure 8. This
Bayesian network contains 129 nodes encompassing information on patient pre-
hospital care, clinical signs, disease diagnosis fields, operative and non-operative
procedures and final patient outcome. The parameters (i.e. conditional probability
tables (CPT)) were learned from 148,502 records present in the medical database
using a Bayesian MAP machine learning algorithm. The complete algorithm appears
in [15]. Further detail on the construction of this network is available in [4]. Within
our multiple-component solution, Netica serves as the back-end implementing our
Bayesian network component. This commercial software permits graphical
construction of the network, efficient learning of the parameters using the algorithm
described above, and probabilistic inference using a junction tree (join tree of
cliques) algorithm [14].

22
Figure 8: The deployed Bayesian network constructed using expert domain knowledge
Using our visualization front-end component, evidence can be entered for any of the
nodes for which data is observed. A middle tier component securely relays evidence
to a back-end component that interacts with Netica through its specialized API. The
probability distribution that results from such a query (typically over patient outcome)
is communicated back to the user component and displayed through the

23
visualization graphical user interface. Our system allows the user to select any node
for evidence gathering and probabilistic inference. This puts at the disposal of the
user an expert prediction and diagnosis service that uses a large real-life medical
data set to compute its results. In addition to functioning as a research tool, the
network can provide valuable support in making time-critical decisions in the trauma
center.
Naïve Bayes Classifier
The Naïve Bayes Classifier is a highly practical algorithm for classifying a target
value given a set of attributes. We use the Naïve Bayes Classifier to classify if a
patient is going to live or die based on 147 attributes such as age, pulse, and predot
values. The target value set V is {Live, Die}. The attribute set A < a1, a2, … , an > is
a tuple of n attributes (here n is 147). Each attribute contains a value for the
patient’s age, sex, pulse, etc. The standard Naïve Bayesian classification algorithm
is used to classify the most likely outcome, given an attribute tuple. This algorithm
assumes that attribute values are conditionally independent given the target value
(the naïve approach). Simple conditional probabilities of each combination of
attribute and outcome, P(ai | vj), are automatically learned from a subset of the
medical database. A second subset of the database is used to verify the accuracy
of the learned classifier. In one result, we learned a Naïve Bayes classifier with a
90% prediction accuracy.

24
5 System Demonstrations
This section provides demonstration views of our prototype tool, SOJDAV. Before
using this tool, a potential user is manually validated and given a user account with a
certain access level from the administrator of the system.
The client component provides secure access to the database through role-based
authentication and encryption. A user must first be authenticated to start a new
session. This is done using the standard login-password combination mechanism.
This security mechanism is motivated by the crucial need to prevent unauthorized
users from accessing valuable research data. Upon successful login, the user will
be able to interact with the database, Bayesian network or Naïve Bayes network. A
role-based access policy provides varying levels of privileged access. Certain
features of the user interface are disabled depending upon the role or privilege level
of the user, permitting secure operation for a wide spectrum of users.
One view of the graphical user interface of our client component is depicted in
Figure 9. This panel allows generation of charts and formulation of queries for data.
As our goal is to provide a flexible and intuitive client component, a graphical user
interface module renders all attributes for the user to choose. With the single click of
a button, user will be presented with raw data in a tabular format, as shown in Figure
9. The back-end database for demonstration purpose comprises a restricted set of
records, not representative of our confidential medical data.

25
Figure 9: Data View of Data Manipulator
As stated earlier, SOJDAV provides a user an ability to generate histograms for
selected attributes. Figure 10 shows a frequency histogram for attribute “Amount”,
restricted to records with specified criteria.

26
Figure 10: Histogram View of Data Manipulator
The refinement process can proceed rapidly from presentation of initial histograms
of data. A straightforward interface, shown in Figure 11 and Figure 12, helps the
user to refine a query to focus on aspects of interest. This interface permits the user
to build complex queries from simple connectives, such as Boolean operators.

27
Figure 11: Attribute Selection Window
Figure 12: Attribute Value Selection Window
The graphical nature of this query construction circumvents the need to learn a
complex query programming language. Once a query has been refined using this
simple method, the initial frequency histograms are dynamically updated with the
click of a button to reflect the new constraints.
More advanced users are not limited to this visual querying. Users with knowledge of
formal query languages can directly type in the query in the constraints field of the
panel. Arbitrarily complex queries can be constructed using this input method. As
depicted in Figure 9, results are provided in tabular format to permit easy storage
and transfer to custom-designed user analysis tools. For example, tabular results
can be automatically saved as spreadsheets to make use of the sophisticated built-
in analysis tools of commercial spreadsheet applications. This feature is available

28
only to privileged users to ensure the integrity of our database, and the privacy of the
data.
Figure 13: Initial View of Naïve Network Panel
In addition to standard statistical manipulation, data visualization, and complex query

29
formation, our client component also provides an interface for entering evidence in
the form of patient parameters and obtaining probabilistic predictions. This
probabilistic inference is carried out using Bayesian network and Naïve Bayes
network back-ends as described in Section 4.3. The client component permits both
evidence accumulation for user-selected nodes in a Bayesian network and
extraction of prediction and/or diagnoses on query nodes from the network.
Furthermore, a user is able to use a Naïve Bayes classifier to classify a target value
given a set of attributes as described in Section 4.3. Figure 13 shows a panel that
allows a user to visually enter the values of a selected attribute. A user can add as
many of attributes as desired, and provide constraints on records. The bottom half
of this panel displays the outcome of the classifier (not shown).
6 Discussions and Future Work
This paper presents the design and development of a web-based data analysis and
visualization tool that integrates back-end security and data analysis support with
flexible front-end query and visualization support. We motivate this design through a
prototype tool, SOJDAV, that provides distributed secure access to a valuable
medical research database and probabilistic models derived from this database.
Dynamic visualization of information through the use of graphs coupled with user-
friendly interfaces allows easy cognizance of data for the user and promotes ease of
use of our system. Ease of use does not limit the functionality available to advanced
and privileged users.

30
We present a multiple-component solution that follows the Java Enterprise Edition
(J2EE) standard for deploying multi-tier applications. The detailed description of the
development of our tool helps inform the practice of creating similar tools. Through
the application of Secure Socket Layers and password-based authentication, data
flowing through the relatively insecure Internet is made immune to common
unauthorized activities. SSL is the de-facto standard of Internet security and meets
the challenges faced by our application. SOJDAV employs Java Servlets and Beans,
a large-scale Relational Database Management System, and third-party software for
probabilistic inference and machine learning.
The Internet has revolutionized the notion of availability, making most services
accessible any time. The large spectrum of end-users and the various uses
necessitate high availability of our system. This increased availability may translate
to more effective use of our medical database in solving problems of time-critical
patient care.
Choosing to base our multiple-component architecture on general-purpose tools
does not preclude us from adding special-purpose intelligent components or
software tools in the future. Furthermore, our approach is based on public domain
protocols and standards and does not use any proprietary code in the core system.
Our experience indicates that development is simplified if third-party software
provides a Java API. However, if a Java API is not available, back-end software

31
with non-Java APIs can be accommodated by building Java code to interact with
these APIs.
The development of this system can be duplicated by anyone interested in building
similar systems. An Appendix is provided with links to tools used.
Acknowledgments
Special thanks to Andrew Ragone for his help with the Naïve Bayes Classifier. This
research is sponsored in part by a Drexel/MCP-Hahnemann Research Synergies
award and in part by a National Science Foundation (NSF) Instrumentation Award
under grant CISE-9986105.

32
References
[1] Stephen Asbury and Scott R. Weiner. Developing Java Enterprise Applications.
John Wiley and Sons, 1999.
[2] I. A. Beinlich, H. J. Suermondt, R. M. Chavez, and G. F. Cooper. The ALARM
monitoring system: A case study with two probabilistic inference techniques for belief
networks. In Proceedings of the Second European Conference on Artificial
Intelligence in Medicine, London. Springer Verlag, Berlin, August 1989.
[3] John R. Clarke, Stanley Z. Trooskin, Prashant J. Doshi, Lloyd G. Greenwald, and
Charles J. Mode. Time to laparotomy for intra-abdominal bleeding from trauma does
affect survival for delays up to 90 minutes. In The Journal of Trauma: Injury,
Infection, and Critical Care, 52(3):420-425, 2002.
[4] Prashant Doshi. Effective methods for building probabilistic models from large
noisy data sets. Master’s thesis, Drexel University, Philadelphi,PA, June 2001.
[5] Prashant J Doshi, Lloyd Greenwald, and John R. Clarke. On retaining
probabilistic error models when building Bayesian networks. In AAAI Fall
Symposium on Using Uncertainty within Computation. North Falmouth,
Massachusetts, November 2—4, 2001, pages 47-48.
[6] Jade Goldstein, Steven F. Roth. Using aggregation and dynamic queries for
exploring large data sets. Proceedings CHI’94 Human Factors in Computing
Systems. ACM: New York, NY, 1994
[7] Java Analysis Studio, http://jas.freehep.org [2004]
[8] Bill Joy, Guy Steele, James Gosling, and Gilad Bracha. The Java (tm) Language
Specification, Second Edition. Addison Wesley, 2000.

33
[9] Ulrich Lang, Georges G. Grinstein, R. Daniel Bergeron. Visualization related
metadata. Database Issues for Data Visualization: IEEE Visualization ’95 Workshop,
Atlanta, GA (Lecture Notes in Computer Science, vol. 1183). Springer-Verlag:
Heidelberg, Germany: 26-34; 1995
[10] PJF Lucas and AR Janssens. Second evaluation of hepar, an expert system for
the diagnosis of disorders of the liver and biliary tract. Liver, 11(340), 1991.
[11] Agnieska Onisko, Marek Druzdzel, and Hanna Wasyluk. A probabilistic causal
model for diagnosis of liver disorders. In Proceedings of the Workshop held in
Malbork, Poland, Malbork, Poland, June 15-19 1998.
[12] David C. Parkes and Lloyd G. Greenwald. Approximate and compensate: A
method for risk-sensitive meta-deliberation and continual computation. In AAAI Fall
Symposium on Using Uncertainty within Computation. North Falmouth,
Massachusetts, November 2-4, 2001, pages 101-108.
[13] Paul J. Perrone and Venkata S. R. Chaganti. Building Java Enterprise Systems
with J2EE: The Authoritative Solution. Sams, 2000.
[14] D. Spiegelhalter, A. Dawid, and S. Cowell. Queries and updates in probabilistic
networks. Journal of Statistical Science, 8(3):219–283, 1993.
[15] D. Spiegelhalter, A. Dawid, S. Lauritzen, and R. Cowell. Bayesian analysis in
expert systems. Journal of Statistical Science, 8, 1993.
[16] B. L. Webber, J. R. Clarke, R. Rymon, and M. Niv. TraumAID: AI support for the
management of multiple trauma. In AAAI Symposium on Artificial Intelligence in
Medicine, Stanford, CA, 1990.

34
[17] B. L. Webber, R. Rymon, and J. R. Clarke. Flexible support for trauma man-
agement through goal-directed reasoning and planning. Artificial Intelligence in
Medicine, 4(2):145–163, April 1992.
[18] Bonnie L. Webber, Sandra Carberry, John R. Clarke, Abigail Gerntner, Terrence
Harvey, Ron Rymon, and Richard Washington. Exploiting multiple goals and
intentions in decision support for the management of multiple trauma: A review of
the TraumAID project. Artificial Intelligence, 105(1–2):263–293, 1998.
[19] Bonnie L. Webber, John R. Clarke, Michael Niv, Ron Rymon, and Marin
Milagros Ib´anez. TraumAID: Reasoning and planning in the initial definitive man-
agement of multiple injuries. Technical Report MS–CIS–90–50, Department of
Computer and Information Science, University of Pennsylvania, Philadelphia, 1990.

35
Appendix A: List of Figures
Figure 1: Interaction of various components of our approach.................................................. 6 Figure 2: Data Modeling and Mapping..................................................................................... 9 Figure 3: The 3-tier multi- component architecture................................................................ 11 Figure 4: Web container components and interactions........................................................... 12 Figure 5: Enterprise Information System (EIS) tier components ........................................... 13 Figure 6: System Architecture ................................................................................................ 14 Figure 7: A high level representation of our Bayesian network ............................................. 20 Figure 8: The deployed Bayesian network constructed using expert domain knowledge...... 22 Figure 9: Data View of Data Manipulator .............................................................................. 25 Figure 10: Histogram View of Data Manipulator................................................................... 26 Figure 11: Attribute Selection Window.................................................................................. 27 Figure 12: Attribute Value Selection Window ....................................................................... 27 Figure 13: Initial View of Naïve Network Panel .................................................................... 28

36
Appendix B: Installation Help
SOJDAV is developed using servlets and JavaServer Pages and so must be
installed on a server with a servlet container. We used Tomcat 5.x server to
demonstrate the prototype of our tool. SOJDAV must also be used in conjunction
with a network database and appropriate drivers and/or APIs.
B1. Technology Required
• J2SE 1.4.2 SDK, J2EE 1.4 SDK
These can be downloaded from Java Technology’s website –
http://java.sun.com/. Follow the installation instructions provided to properly
install and configure appropriate variables such as Classpath.
• Webserver
To demonstrate prototype of our system we have used Tomcat 5.x server,
which can be obtained from Jakarta’s website –
http://jakarta.apache.org/tomcat/. Follow installation instructions provided
along with the documentation to install Tomcat webserver and configure
appropriate variables.
After installation, modify server.xml file that provide SSL support as well as
run server on desired port. Instructions to modify server.xml and web.xml files
found under config folder can be found in Tomcat documentation.
Unpack the provided zip file under webapps folder of Tomcat to install
SOJDAV. Restart the Tomcat server to deploy our tool properly.
• Database
We use PostgreSQL to host data at the back-end. However, it is not entirely

37
necessary to use any particular database to run our tool. PostgreSQL can be
downloaded freely from it’s website at http://www.postgresql.org/. Obtain the
documentation from the same website and follow installation instruction to
properly install and configure database system.
Upon successful installation, create necessary database to host data. Once
database is created, user will need to create ODBC connection named
“DiscTrauma”. This connection should be made available to Tomcat (see
Tomcat’s Administrator Guide). Also place a jar file containing JDBC-ODBC
APIs in lib directory of Tomcat.
• NeticaJ APIs
In order to provide a probabilistic inference support, we used NeticaJ APIs
from Norsys. It can be freely obtained from Norsys’s website at
http://www.norsys.com/. Installation instructions are provided with
downloaded file. Follow these instructions to install and configure appropriate
variables properly. Place a jar file containing APIs in lib directory of Tomcat.
• Weka API
Additional probabilistic modeling and machine learning support is provided by
the Weka API. It can be freely obtained from
http://www.cs.waikato.ac.nz/ml/weka/. Installation instructions are provided.
Place a jar file containing APIs in lib directory of Tomcat.