developing a tool for assessing cost effective best
TRANSCRIPT

Developing a Tool for Assessing Cost Effective Best Management Practices for
Resilient Communities
2010 Northern Gulf Institute Annual ConferenceMay 18-20, 2010 Mobile, Alabama
Department of Landscape Architecture
G. Wayne Wilkerson Associate Professor
Dr. Timothy Schauwecker Assistant Professor
Warren Gallo Assistant Professor
Department ofCivil and Environmental Engineering
Dr. James Martin Professor
Dr. William McAnally Research Professor
Germaina Salazar-Mejia Research Assistant

Act One“The Exposition”
2010 NGI Proposal Objectives
• Refine LIDIA Spreadsheet Interfaceo Initial work funded from other sourceso Concept generated from a 2008 survey
• Link Spreadsheet Interface to Spatial Model
• Update BMP Data base
• Product: o Excel based tool with graphical interface to help
development industry evaluate BMP effectiveness
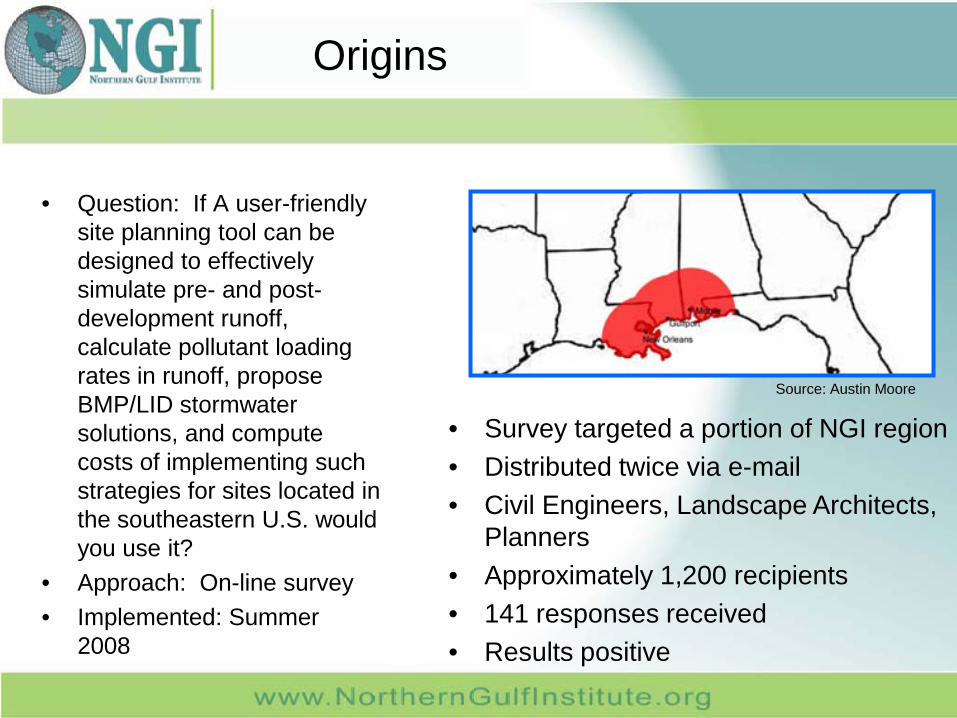
Origins
• Survey targeted a portion of NGI region • Distributed twice via e-mail• Civil Engineers, Landscape Architects,
Planners• Approximately 1,200 recipients• 141 responses received • Results positive
• Question: If A user-friendly site planning tool can be designed to effectively simulate pre- and post-development runoff, calculate pollutant loading rates in runoff, propose BMP/LID stormwater solutions, and compute costs of implementing such strategies for sites located in the southeastern U.S. would you use it?
• Approach: On-line survey• Implemented: Summer
2008
Source: Austin Moore

Survey Results
Source: Austin Moore

The LIDIA Tool
Low Impact Development Implementation Assessment
Source: Austin Moore
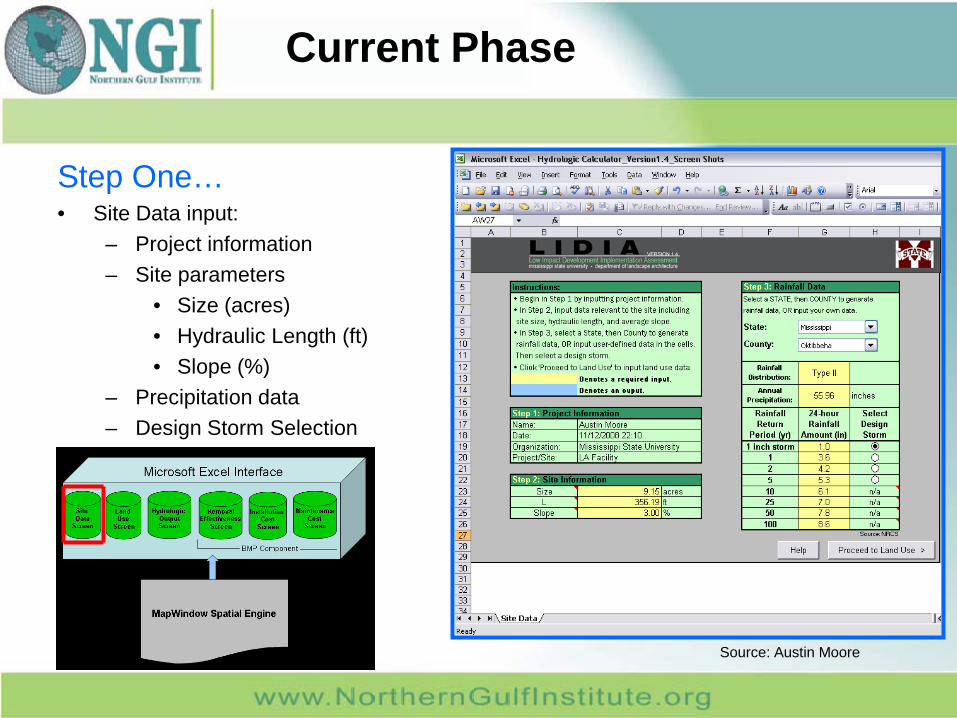
Current Phase
Step One…Project• Site Data input:
– Project information– Site parameters
• Size (acres)• Hydraulic Length (ft)• Slope (%)
– Precipitation data– Design Storm Selection
– Site parameters• Size (acres)• Hydraulic Length
(ft)• Slope (%)
– Precipitation dataSource: Austin Moore

Step Two…• Land Use/Land Cover Characterization:
– Cover Type– Hydrologic Soil Group– Area size (ft²)
• Weighted CN generated• Computations made via SCS Runoff CN
method (USDA, 1986)
• d
Current Phase
Source: Austin Moore

Current Phase
Step Three…• Pre-developed versus post-
developed conditions• Storm event:
– Runoff volumes– Peak flows– Hydrographs
• Annual runoff and infiltration amounts
Source: Austin Moore

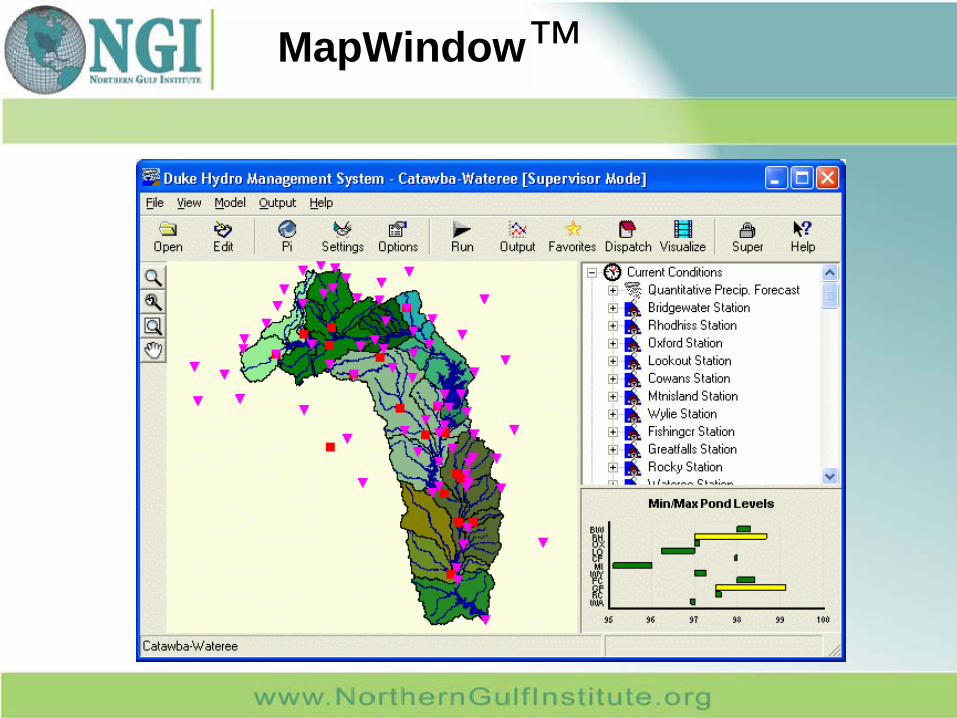
MapWindows™•MapWinGIS ActiveX Control
•Open Source Component
•Complete GIS API for Shapefile and
Grid Data
•Built in GIS features
Google Earth ?
Graphical Interface

ArcView™ Interface
MapWindow™

BMP Database
Began as a TVA Project
Five Worksheets• BMP Selection • Removal Efficiencies• Cost Data• Maintenance Data• Infiltration Data
Current Version Contains:• 275 Research Citations• 52 BMP Types
Source: James Martin

• Spatial Component– MapWindow is currently being considered as an option to assist users
in determining spatial values such size– MapWindow is a public domain, extensible GIS data visualization
application• Available: http://www.mapwindow.org
• Pollutant loading computations (TN, TP)• Database selection of BMPs
– Descriptions including performance capabilities (removal efficiencies) and costs
– Will allow the user to implement various configurations to evaluate effectiveness
• Costing component– Construction and Maintenance– Traditional versus LID/BMP solutions
• Eventually a WEB based solution
LIDIA Going Forward

Act Two“ The Main Story”

But at the end of the day…
So What?• Why should this project be funded?
• Why is it important to the NGI?
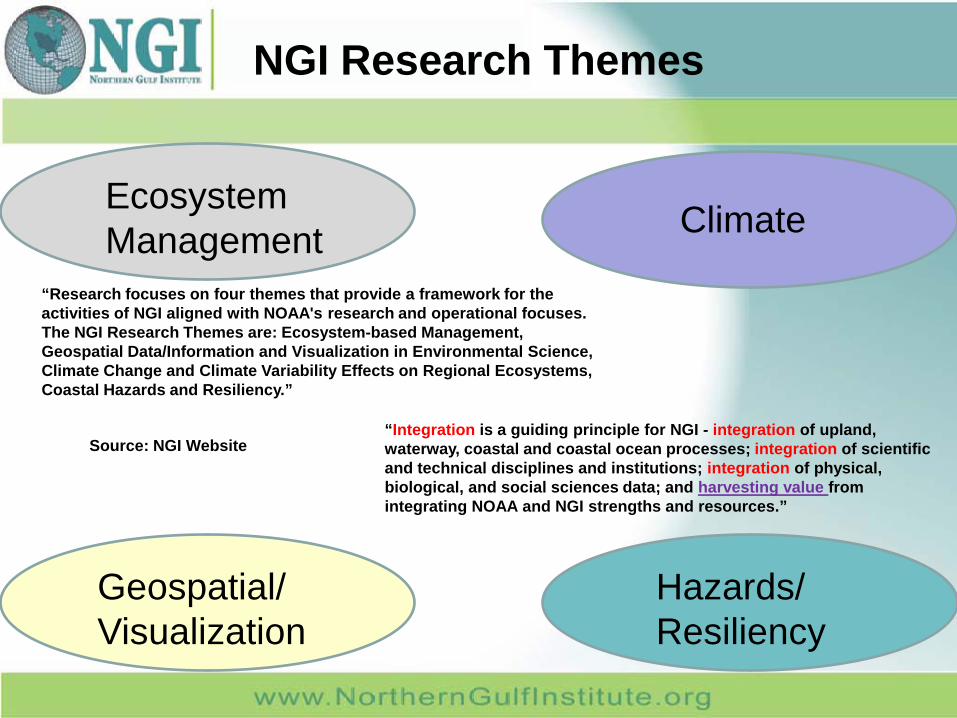
NGI Research Themes
ClimateEcosystem Management
Geospatial/Visualization
Hazards/Resiliency
“Integration is a guiding principle for NGI - integration of upland, waterway, coastal and coastal ocean processes; integration of scientific and technical disciplines and institutions; integration of physical, biological, and social sciences data; and harvesting value from integrating NOAA and NGI strengths and resources.”
“Research focuses on four themes that provide a framework for the activities of NGI aligned with NOAA's research and operational focuses. The NGI Research Themes are: Ecosystem-based Management, Geospatial Data/Information and Visualization in Environmental Science, Climate Change and Climate Variability Effects on Regional Ecosystems, Coastal Hazards and Resiliency.”
Source: NGI Website

Spatial Area Impacting NGI
ClimateEcosystem Management
Geospatial/Visualization
Hazards/Resiliency

Geospatial/Visualization
Hazards/Resiliency
Integration? Then What?
Climate
Ecosystem Management

How Do We Harvest Value?
• By solving site specific problems using the expertise and resources of the NGI, identified in the four research areas.
• This research initiative (NGI) has reached a maturity where there should be outcomes (value) that solve problems encountered by the general public in a way that improves their quality of life.
Geospatial/Visualization
Hazards/Resiliency
Climate
Ecosystem Management

…………………………………………………..…
• Hydrologist
• Biologist
• Ag Economist
• Environmental Engineer
•Climatologist
General Public
• Engineers
• Planners (Public Sector)
• Landscape Architects
• Construction Industry
• Sustainability Experts
Research World
How can NGI Address Current Issues ?

…………………………………………………..…How can NGI Address Current Issues ?

• Problem: – How to improve water quality and reduce infrastructure costs
(resiliency) for new construction in the NGI service area.
• Solution: – Use LIDIA to make a pre-assessment of the construction
approach .– Assess alternative water quality BMPs. – Assess cost factors.– Assess sizing constraints.– Implement solution.– Aimed at the design/construction industry.
Case Study: LIDIA
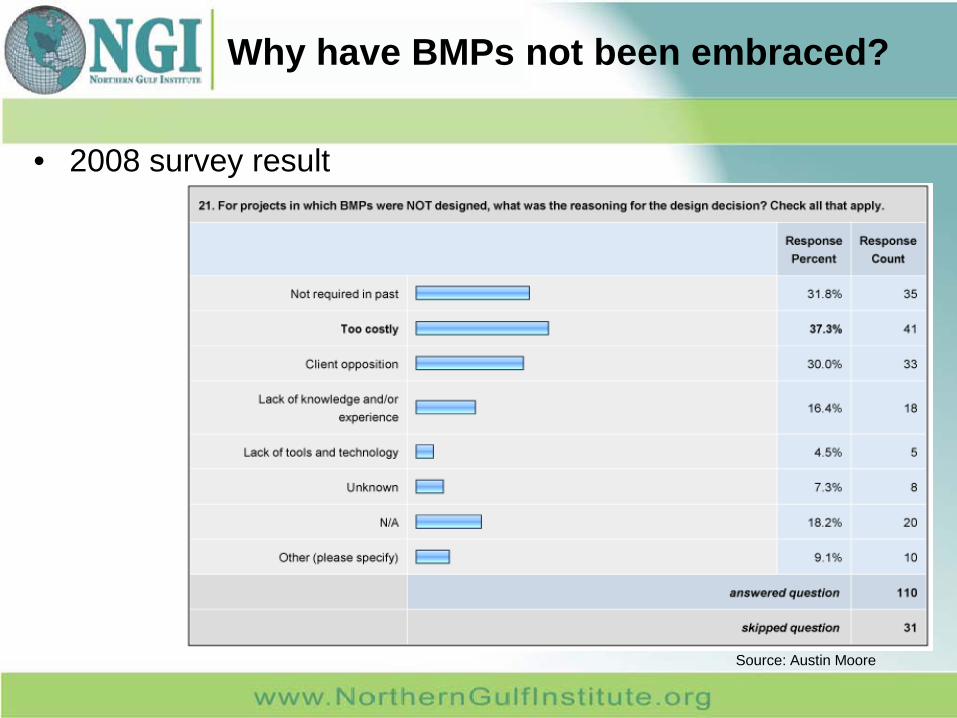
Why have BMPs not been embraced?
• 2008 survey result
Source: Austin Moore
How to modify behavior?
• Data– More test sites– More types of BMPs tested– Improved data collections
• Education– Modified university curriculums– Workshops– Continuing education credits– Include in local ordinances
Act Three“ The Dénoument”

Potential Test Sites
•Coastal Zone (III)oOcean SpringsoPascagoula
•Central (II)oJacksonoRidgeland
•North (I)oHernandooHorn Lake
•StarkvilleSource: DEQ 2001 Manual
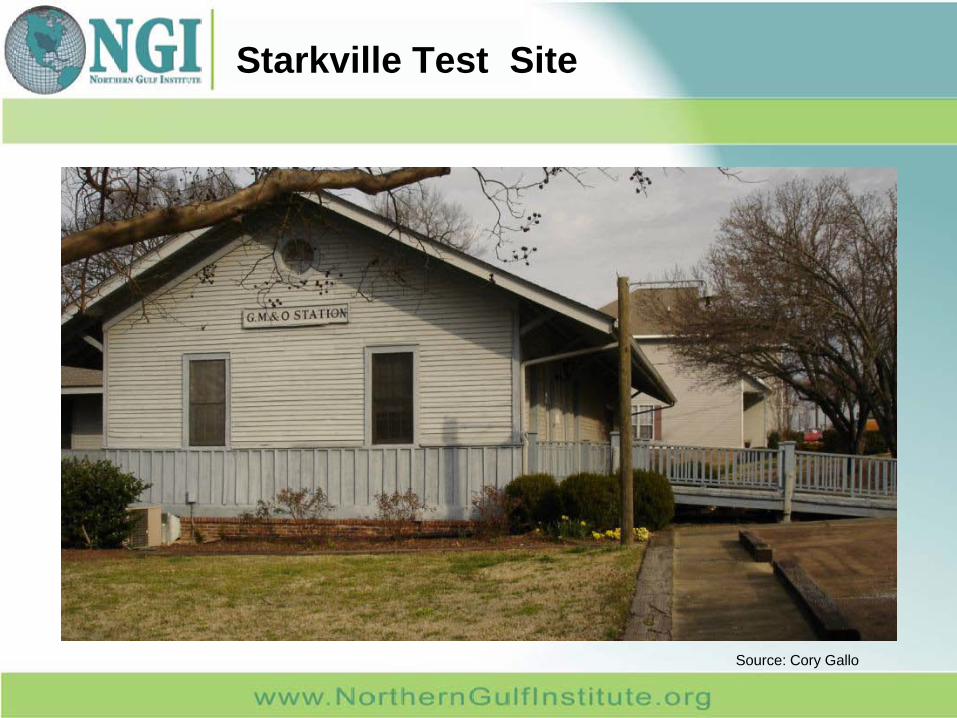
Starkville Test Site
Source: Cory Gallo
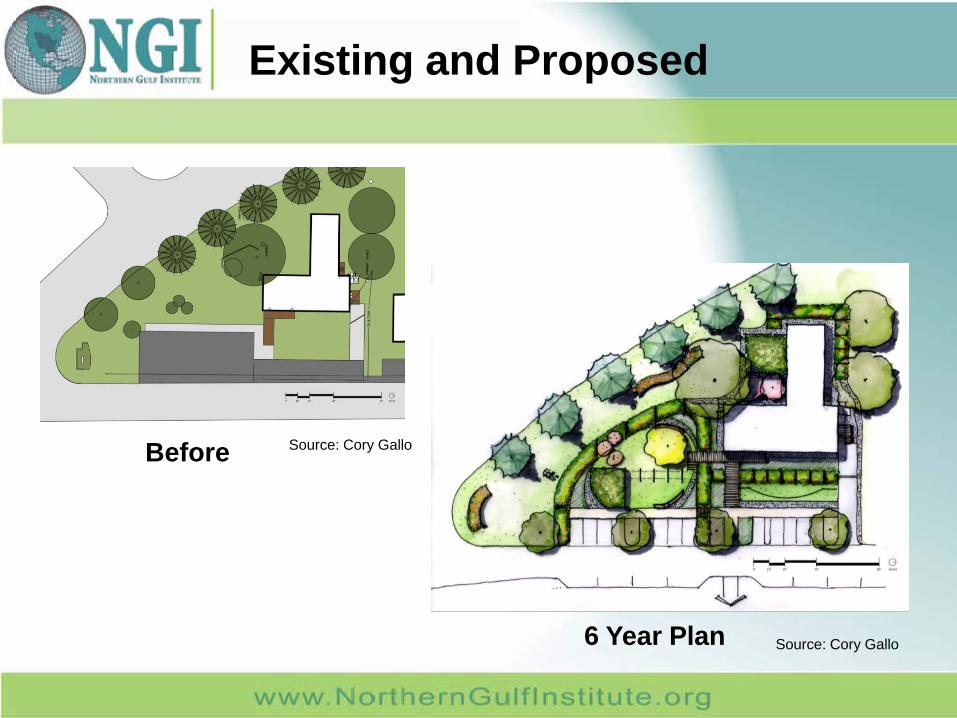
Existing and Proposed
Before
6 Year Plan Source: Cory Gallo
Source: Cory Gallo

Phase 1 – Bio-Infiltration
Source: Cory Gallo
• 9 ft wide•3:1 side slopes/ 12” storage•Mix:
•33% sand•33% organic•33 % topsoil
Completed June 2009

Phase 2 – Sand Filter
Sand filters, also known as organic filters, are devices that filter stormwater runoff through a sand layer into an under drain system that conveys the treated runoff to a detention facility or to the ultimate point of discharge. The sand-bed filtration system consists of an inlet structure, sedimentation chamber, sand bed, under drain piping, and liner to protect against infiltration (Idaho DEQ).
Source: Judd England
Source: Wayne Wilkerson
Completed May 2010

Back to the original question…
So What?• The model (LIDIA), partially funded through
NGI/NOAA, has the ability to integrate data produced by multiple research themes.
• The demonstration sites can educate the design industry, making their products more resilient.
• The demonstration sites can also generate NGI research data, filling a void.
• …. A good example of harvesting value? I think so.