developing an explorative model for saas adoption
TRANSCRIPT
Expert Systems with Applications 38 (2011) 15057–15064
Contents lists available at ScienceDirect
Expert Systems with Applications
journal homepage: www.elsevier .com/locate /eswa
Developing an explorative model for SaaS adoption
Wei-Wen WuDepartment of International Trade, Ta Hwa Institute of Technology, 1.Ta Hwa Road, Chiung-Lin, Hsin-Chu 307, Taiwan
a r t i c l e i n f o
Keywords:Cloud servicesSaaSTechnology Acceptance ModelPLS path modeling
0957-4174/$ - see front matter � 2011 Elsevier Ltd. Adoi:10.1016/j.eswa.2011.05.039
E-mail address: [email protected]
a b s t r a c t
Among several types of ‘‘cloud services’’, the Software as a Service (SaaS) solution is promising. The Tech-nology Acceptance Model (TAM) and its modified versions have been popularly utilized for examininghow users come to accept a new technology, but have not yet been employed to handle issues regardingSaaS adoption. This paper attempts to develop an explorative model that examines important factorsaffecting SaaS adoption, in order to facilitate understanding with regard to adoption of SaaS solutions.An explorative model using partial least squares (PLS) path modeling is proposed and a number ofhypotheses are tested, which integrate TAM related theories with additional imperative constructs suchas marketing effort, security and trust. Thus, the findings of this study can not only help enterprise usersgain insights into SaaS adoption, but also help SaaS providers obtain inspiration in their efforts to discovermore effective courses of action for improving both new product development and marketing strategy.
� 2011 Elsevier Ltd. All rights reserved.
1. Introduction
Effectively making use of Information technology (IT) can con-stitute a sustainable source of an organization’s competitiveness.Cloud computing has become a topic of tremendous interest asorganizations struggle to improve their IT performance. Cloudcomputing is described by Feuerlicht (2010) as follows: it involvesmaking computing, data storage, and software services availablevia the Internet. Cisco (2009) emphasizes that cloud computinghas the potential to offer services on demand, at lower cost thancurrent options, together with less complexity, greater scalability,and wider reach. According to Coombe (2009), cloud computingis a paradigm shift that enables scalable processing and storageover distributed, networked commodity machines.
Cloud services can be defined as service solutions based oncloud computing. Catteddu and Hogben (2009) state that (1) cloudcomputing is a new way of delivering computing resources; (2)cloud services, ranging from data storage and processing to soft-ware, are now available instantly and on-demand; and (3) espe-cially in a time of belt-tightening, the growth of cloud services ispromising. According to the U.S. National Institute of Standardsand Technology (NIST), major characteristics of cloud servicesare: on-demand self-service, ubiquitous network access, locationindependent resource pooling, rapid elasticity, and measured ser-vice. Referring to Cisco (2009), cloud services can be divided intoseveral subcategories, such as: (1) IT as a Service (ITaaS) allows ser-vice subscribers to obtain network connectivity and either individ-
ll rights reserved.
ual or bundled services; (2) Software as a Service (SaaS) enablesservice subscribers to access a software application from a soft-ware vendor through the web; (3) Platform as a Service (PaaS)makes raw computing power and disk space available from a plat-form of resources in the network cloud; and (4) Infrastructure as aService (IaaS) provides the use of a virtual computer infrastructureenvironment as a service with a pay-as-you-use basis.
The use of cloud services is a ground breaking alternative thatenables organizations to pay only for what they use with regardto computing and network resources, rather than having to investin upgrading data centers, not to mention hiring requisite staff todeal with all the hardware and software. According to Klems,Nimis, and Tai (2009), cloud services allow organizations to rentvirtualized infrastructure, deploy applications, and store data onthe infrastructure, as well as to access applications and data viaweb protocols on a pay-per-use basis. Feuerlicht (2010) indicatesthat (1) cloud services can be rented on a pay-as-you-use basis,thus enabling client organizations to adjust the usage of IT re-sources according to their present needs; (2) the adoption of cloudservices leads organizations into a new scenario in which an orga-nization begins interacting with multiple external providers aswell as partner organizations; and (3) internally, organizationsare required to focus on service integration as well as managingthe interface with service providers.
Although cloud-services-related surveys have provided infor-mation about current state and development trends in terms ofthe adoption of cloud services, few studies have discussed in depththe issue of SaaS adoption. The Technology Acceptance Model(TAM), and its modified versions, has often been employed forpurposes of examining how users come to adopt or accept a new
15058 W.-W. Wu / Expert Systems with Applications 38 (2011) 15057–15064
technology, but has not yet been used to handle the issue of adopt-ing SaaS solutions. Therefore, this paper develops an explorativemodel that examines important factors affecting SaaS adoption.An explorative model using partial least squares (PLS) path model-ing is proposed and the hypotheses are tested.
The remainder of this paper is organized as follows: in Section2, a literature review is conducted; in Section 3, the research modeland hypotheses are developed; in Section 4, research design is con-ducted; and in Section 5, data analysis and results are given. Final-ly, based on the findings of this research, conclusions andimplications for management are presented.
2. Literature review
2.1. Cloud services and SaaS solutions
Cloud services are new business models, consisting of ways ofdelivering and applying computing services through IT. Mowbrayand Pearson (2009) remark that (1) the central idea of cloud com-puting services is that these services are carried out on behalf ofcustomers on hardware that the customers do not own or operate;and (2) the customer sends input data to the cloud, this data is pro-cessed by an application provided by the cloud service provider,and the result is sent back to the customer. Cloud services are thusvaluable service solutions based on the cloud computing system,and they constitute a new way of utilizing and consuming IT ser-vices based on the Internet. Importantly, Feuerlicht (2010) com-ments that (1) cloud services allow organizations to focus oncore business processes and to implement supporting applicationsthat can deliver competitive advantage; and (2) cloud services freeorganizations from the burden of having to develop and maintainlarge-scale IT systems.
According to Klems et al. (2009), typical IaaS offerings are: Ama-zon’s Elastic Compute Cloud (EC2) and Simple Storage Service (S3),Joyent’s Accelerator, and Rackspace’s Mosso; whereas typical PaaSofferings are: Google’s App Engine, and Salesforce’s Force.com. Asfor SaaS offerings, Salesforce.com’s Sales Force Automation is thebest representative. The Sales force automation is an excellentsales tool which speeds up and streamlines all phases of sales fromlead management to analytics and forecasting. Mowbray and Pear-son (2009) comment that when undertaking such tasks as Salesforce automation, it makes sense for organizations to use cloud ser-vices instead of purchasing computing hardware and software todo it in-house. Typical SaaS solutions provide business applicationsonline which are accessed from a web browser. Another notewor-thy SaaS offering is Workday.com’s human-capital management(HCM) software service that is designed to help a company orga-nize, staff, pay, and develop its global workforce.
For the purpose of increasing understanding of the adoption ofcloud services, a number of surveys have been conducted. Forexample, Catteddu and Hogben (2009) reports that (1) among pos-sible reasons for using cloud services, the foremost reason is avoid-ing capital expenditure in hardware, software, and IT support,followed by utilizing flexibility and scalability of IT resources; (2)as for what types of cloud services are commonly used, the leadingtype is ‘‘SaaS’’ followed by ‘‘PaaS’’; and (3) main concerns with re-gard to using the cloud services include: privacy, availability of ser-vices and/or data, integrity of services and/or data, confidentialityof corporate data, and so on.
From this report, we understand that (1) organizations wish toavoid capital expenditure in IT related hardware and software, andthey expect to utilize cloud services in order to obtain flexible andindispensable IT resources; (2) SaaS appears to be the most attrac-tive solution among several types of cloud services; and (3) secu-rity and trust are principal concerns for those using cloud
services. More importantly, the issue arises here of how to advancethe adoption of SaaS. To this end, enterprise users need to deepentheir understanding about the merits and demerits of SaaS adop-tion. Also, SaaS providers have to realize enterprise users’ needsand concerns about SaaS adoption, and design effective marketingstrategies and actions to promote the growth of the SaaS market.
2.2. TAM and its modified versions
Davis (1986) proposed the original version of TAM based on theTheory of Reasoned Action (Fishbein & Ajzen, 1975) for testing howusers come to accept and use information systems. TAM has be-come one of the most widely used models in the information sys-tem field, partly because of its understandability and simplicity(King & He, 2006). Referring to Lee, Li, Yen, and Huang (2010),TAM enables an organization to grasp the effects of external vari-ables concerning the causal relationship between Perceived Use-fulness (PU), Perceived Ease of Use (PEOU), and BehavioralIntention (BI); it thereby helps the organization with implementa-tion and application of technology systems.
With regard to the original version of TAM, Davis (1986) arguesthat (1) user’s motivation can be explained by three factors: PU,PEOU, and Attitude Toward Using (ATU); (2) the ATU is a majordeterminant of whether the user will actually use the system; (3)the ATU is affected by two major beliefs: PU and PEOU; (4) PEOUhas a direct influence on PU; and (5) these two beliefs are both di-rectly influenced by ‘‘System Design Characteristics’’. Subse-quently, the original TAM has been modified into more advancedforms: the first modified version (Davis, Bagozzi, & Warshaw,1989), the final modified version (Venkatesh & Davis, 1996),TAM2 (Venkatesh & Davis, 2000), the Unified Theory of Acceptanceand Use of Technology (UTAUT) model (Venkatesh, Morris, Davis, &Davis, 2003), and TAM3 (Venkatesh & Bala, 2008).
Referring to King and He (2006), four kinds of modificationscontributed to the evolution of TAM: (1) altering external anteced-ents; (2) amending predictive variables; (3) manipulating modera-tor variables; and (4) varying consequence measures. Moreimportantly, there is a built-in core component that is commonto all modifications of TAM, and this consists of three constructs:PU, PEOU, and BI (King & He, 2006). Furthermore, in the core part,BI is affected by both PU and PEOU, while PU is influenced byPEOU. In other words, PU and PEOU are two core constructs thatshape user attitudes and intentions in adopting a technology sys-tem (Lee et al., 2010).
2.3. TAM-diffusion theory model
Apart from the main stream of TAM modifications, it is impor-tant to observe movements in the area of variant versions of theTAM. Some studies (Lopez-Nicolas, Molina-Castillo, & Bouwman,2008; Tung, Chang, & Chou, 2008) have endeavored to developintegrated models that combine TAM with Innovation DiffusionTheory (Rogers, 1995). Because they consider that TAM and itsmodified versions are too parsimonious, incomplete, and tautolog-ical, Lopez-Nicolas et al. (2008) propose the TAM-diffusion theorymodel (TAM-DTM), a novel research framework that is quite dis-similar to ordinary TAM modifications. Eight constructs are con-tained within the TAM-DTM, including: Media Influence, SocialInfluence, Perceived Flexibility Benefits, Perceived Status Benefits,Attitude toward Mobile Innovations, PU, PEOU, and BI.
Although TAM-DTM similarly embraces the core part of conven-tional TAM, it has some additional features, as follows. First, inpractice, it is simpler to use without involving moderating vari-ables. Second, TAM-DTM starts with the construct named MediaInfluence (MI), which directly affects Social Influence (SI). That is,MI is the antecedent of SI in TAM-DTM. Note that there are no
W.-W. Wu / Expert Systems with Applications 38 (2011) 15057–15064 15059
antecedents to SI in both TAM3 and UTAUT. This is because thatTAM-DTM argues that mass media influences are generally domi-nant in the initial stages of innovation adoption. Fourth, in theTAM-DTM, SI may widely affect nearly all constructs (PerceivedFlexibility Benefits, Perceived Status Benefits, Attitude toward Mo-bile Innovations, PU, PEOU, and BI). Five, TAM-DTM can be viewedas a media-oriented model for the technology acceptance of theend-user in a marketplace context, and it is different in this respectfrom TAM and UTAUT, which highlight technology acceptance bythe employee in the workplace context.
3. Research model and hypotheses
Prior research regarding TAM and its modifications have pro-vided valuable insights into how and why employees make a deci-sion about the adoption and use of information technologies in theworkplace (Venkatesh & Bala, 2008). However, TAM and its modi-fied versions fail to address certain crucial issues such as securityand trust, as well as marketing effort. In IDC’s study ‘‘The Adoptionof Software as a Service in Small and Medium-Sized Businesses:Perception Versus Reality’’ (IDC #205798; March 2007), theauthors note that (1) while SaaS has strong growth potential, smalland medium-sized businesses (SMBs) have not been adopting SaaSas quickly as originally anticipated; (2) concern about data securityis the factor most frequently cited as discouraging the use of SaaS;and (3) marketing efforts are called for, including establishingappropriate sales channels and deciding how best to market tothese firms. In reference to these desiderata, there is an apparentneed to develop an integrated model that combines TAM relatedtheories with imperative constructs such as marketing effort, secu-rity and trust in order to apply it in the SaaS adoption context.
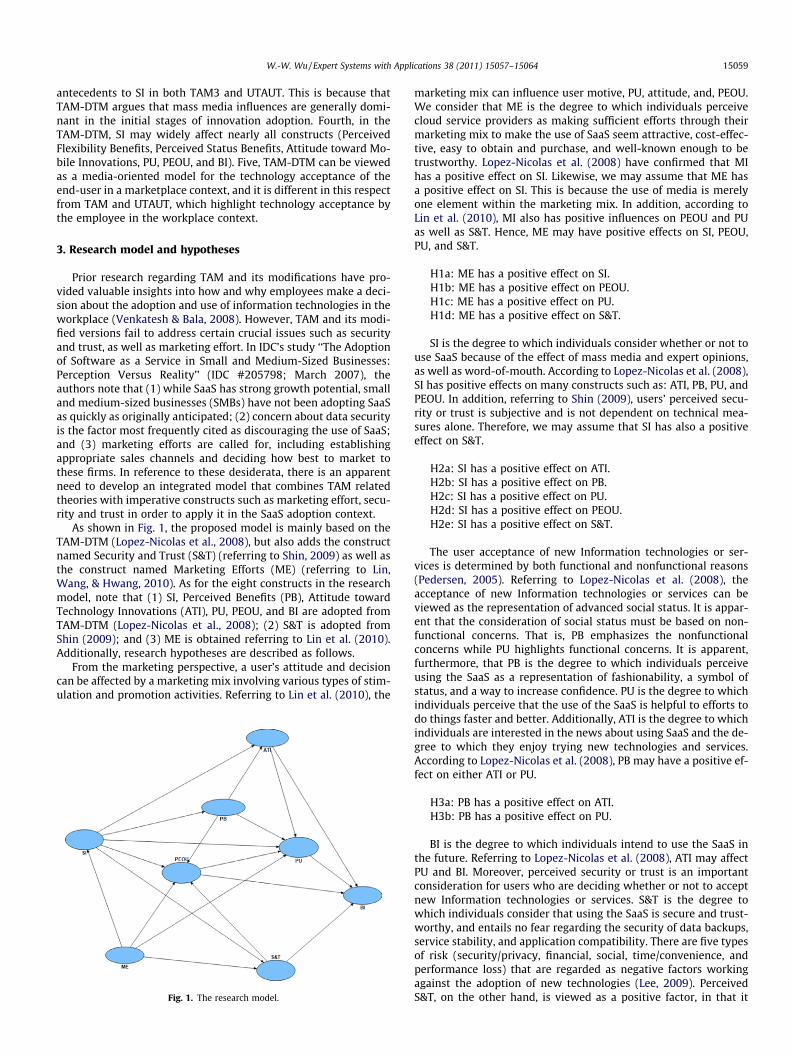
As shown in Fig. 1, the proposed model is mainly based on theTAM-DTM (Lopez-Nicolas et al., 2008), but also adds the constructnamed Security and Trust (S&T) (referring to Shin, 2009) as well asthe construct named Marketing Efforts (ME) (referring to Lin,Wang, & Hwang, 2010). As for the eight constructs in the researchmodel, note that (1) SI, Perceived Benefits (PB), Attitude towardTechnology Innovations (ATI), PU, PEOU, and BI are adopted fromTAM-DTM (Lopez-Nicolas et al., 2008); (2) S&T is adopted fromShin (2009); and (3) ME is obtained referring to Lin et al. (2010).Additionally, research hypotheses are described as follows.
From the marketing perspective, a user’s attitude and decisioncan be affected by a marketing mix involving various types of stim-ulation and promotion activities. Referring to Lin et al. (2010), the
Fig. 1. The research model.
marketing mix can influence user motive, PU, attitude, and, PEOU.We consider that ME is the degree to which individuals perceivecloud service providers as making sufficient efforts through theirmarketing mix to make the use of SaaS seem attractive, cost-effec-tive, easy to obtain and purchase, and well-known enough to betrustworthy. Lopez-Nicolas et al. (2008) have confirmed that MIhas a positive effect on SI. Likewise, we may assume that ME hasa positive effect on SI. This is because the use of media is merelyone element within the marketing mix. In addition, according toLin et al. (2010), MI also has positive influences on PEOU and PUas well as S&T. Hence, ME may have positive effects on SI, PEOU,PU, and S&T.
H1a: ME has a positive effect on SI.H1b: ME has a positive effect on PEOU.H1c: ME has a positive effect on PU.H1d: ME has a positive effect on S&T.
SI is the degree to which individuals consider whether or not touse SaaS because of the effect of mass media and expert opinions,as well as word-of-mouth. According to Lopez-Nicolas et al. (2008),SI has positive effects on many constructs such as: ATI, PB, PU, andPEOU. In addition, referring to Shin (2009), users’ perceived secu-rity or trust is subjective and is not dependent on technical mea-sures alone. Therefore, we may assume that SI has also a positiveeffect on S&T.
H2a: SI has a positive effect on ATI.H2b: SI has a positive effect on PB.H2c: SI has a positive effect on PU.H2d: SI has a positive effect on PEOU.H2e: SI has a positive effect on S&T.
The user acceptance of new Information technologies or ser-vices is determined by both functional and nonfunctional reasons(Pedersen, 2005). Referring to Lopez-Nicolas et al. (2008), theacceptance of new Information technologies or services can beviewed as the representation of advanced social status. It is appar-ent that the consideration of social status must be based on non-functional concerns. That is, PB emphasizes the nonfunctionalconcerns while PU highlights functional concerns. It is apparent,furthermore, that PB is the degree to which individuals perceiveusing the SaaS as a representation of fashionability, a symbol ofstatus, and a way to increase confidence. PU is the degree to whichindividuals perceive that the use of the SaaS is helpful to efforts todo things faster and better. Additionally, ATI is the degree to whichindividuals are interested in the news about using SaaS and the de-gree to which they enjoy trying new technologies and services.According to Lopez-Nicolas et al. (2008), PB may have a positive ef-fect on either ATI or PU.
H3a: PB has a positive effect on ATI.H3b: PB has a positive effect on PU.
BI is the degree to which individuals intend to use the SaaS inthe future. Referring to Lopez-Nicolas et al. (2008), ATI may affectPU and BI. Moreover, perceived security or trust is an importantconsideration for users who are deciding whether or not to acceptnew Information technologies or services. S&T is the degree towhich individuals consider that using the SaaS is secure and trust-worthy, and entails no fear regarding the security of data backups,service stability, and application compatibility. There are five typesof risk (security/privacy, financial, social, time/convenience, andperformance loss) that are regarded as negative factors workingagainst the adoption of new technologies (Lee, 2009). PerceivedS&T, on the other hand, is viewed as a positive factor, in that it
15060 W.-W. Wu / Expert Systems with Applications 38 (2011) 15057–15064
can reduce uncertainty related to adopting the new technologies,thus enhancing PEOU as well as BI (Hsu, 2008). Additionally, S&Tmay affect PEOU and BI, because perceived S&T is largely deter-mined by users’ feeling about control of the interactive system(Shin, 2009).
H4a: ATI has a positive effect on PU.H4b: ATI has a positive effect on BI.H5a: S&T has a positive effect on PEOU.H5b: S&T has a positive effect on BI.
PEOU is the degree to which individuals consider that usingthe SaaS is easy to access, learn and utilize. Several studies(Lopez-Nicolas et al., 2008; Venkatesh & Bala, 2008; Venkatesh &Davis, 1996, 2000) deem that PEOU may affect both PU and BI. Inaddition, many studies (Lopez-Nicolas et al., 2008; Venkatesh &Bala, 2008; Venkatesh & Davis, 1996, 2000) have confirmed thatPU is able to affect BI.
H6a: PEOU has a positive effect on PU.H6b: PEOU has a positive effect on BI.H7: PU has a positive effect on BI.
4. Research design
Whether or not to make use of cloud services has become animportant issue, with profound consequences for the improvementof IT performance for organizations. Among the various types ofcloud services, the SaaS solution is seen as a potential segment(Catteddu & Hogben, 2009). However, few studies have empiricallyinvestigated the effectiveness of the adoption of SaaS solutions.TAM and its modified versions are useful tools for examining useradoption or acceptance of a new technology, but they have notbeen utilized to deal with the adoption of SaaS solutions, and lackthe ability to evaluate the issues of security and trust, as well as
Table 1Constructs and measuring items.
Construct Measuring item
Marketing Efforts (ME) ME01ME02ME03
Social Influence (SI) SI01SI02SI03
Perceived Benefits (PB) PB01PB02PB03PB04
Attitude toward Technology Innovations (ATI) ATI01ATI02ATI03
Security and Trust (S&T) S&T01S&T02S&T03S&T04S&T05
Perceived Usefulness (PU) PU01PU02PU03PU04PU05
Perceived Ease of Use (PEOU) PEOU01PEOU02PEOU03PEOU04
Behavioral Intention (BI) BI01
marketing effort. This paper therefore proposes an explorativemodel that integrates TAM related theories with imperative con-structs such as ME and S&T. Measurement development, samplingand data collection are described below.
4.1. Measurement development
In implementing our research project, based on the proposedresearch model, the task of measurement development was per-formed. Items to be measured were developed for each construct.As for the collection of items to be measured, it was largelyadopted from concepts derived from Lopez-Nicolas et al. (2008),Shin (2009) and Lin et al. (2010). After reviewing the related liter-ature and conducting interviews with experts in the field, as shownin Table 1, a total of 28 items were confirmed for use in this study.
4.2. Sampling and data collection
SaaS is regarded as a promising segment because it achievessimpler, cheaper and faster deployment than software based ontraditional premises. However, in the Taiwan cloud computing ser-vice market, SaaS is still in an introductory stage, and Taiwaneseenterprises are generally not yet familiar with SaaS solutions. Wethus first need to investigate why there is so little interest in adop-tion of SaaS on the part of Taiwanese enterprises.
With this in mind, all 120 members of the Taiwan Style Compe-tency Study Group (TSCSG) were targeted for this study, since themembers of the TSCSG, coming primarily from the Hsin-ChuScience-Based Industry Park (HSIP), are generally highly-educatedCEOs or managers, and they are known to be interested in innova-tion and new technologies. Informants were contacted by tele-phone to invite them to participate and to explain the purpose ofthe research. The survey was conducted via mailed questionnaires(each question was translated into traditional Chinese). Thequestionnaire was developed according to Table 1, with eight
Using the SaaS solutions is attractive to me.Using the SaaS solutions is cost-effective.Using the SaaS solutions is easy to get and purchase.
Mass media affects me for using the SaaS solutions.Expert opinions affect me for using the SaaS solutions.The word-of-mouth affects me for using the SaaS solutions.
Using the SaaS solutions is a representation of fashion.Using the SaaS solutions is a symbol of status.Using the SaaS solutions is a way to increase confidence.Using the SaaS solutions makes me cheerful.
I am interested in the news about using the SaaS solutions.I enjoy trying new technologies and services.I want to be a pioneer to try using the SaaS solutions.
The security of data backups is the determinant of using the SaaS solutions.The service stability is the determinant of using the SaaS solutions.The application compatibility is the determinant of using the SaaS solutions.Using the SaaS solutions is secure.Using the SaaS solutions is trustworthy.
Using the SaaS solutions enables me to do things faster.Using the SaaS solutions enables me to do things better.Using the SaaS solutions improves my performance.Using the SaaS solutions advances my competitiveness.The functionality of the SaaS solutions satisfies me.
The user interface of the SaaS solutions is friendly.The procedure of using the SaaS solutions is understandable.It is easy to learn using the SaaS solutions.It is easy to make use of the SaaS solutions.
Overall, I intend to use the SaaS solutions in the future.
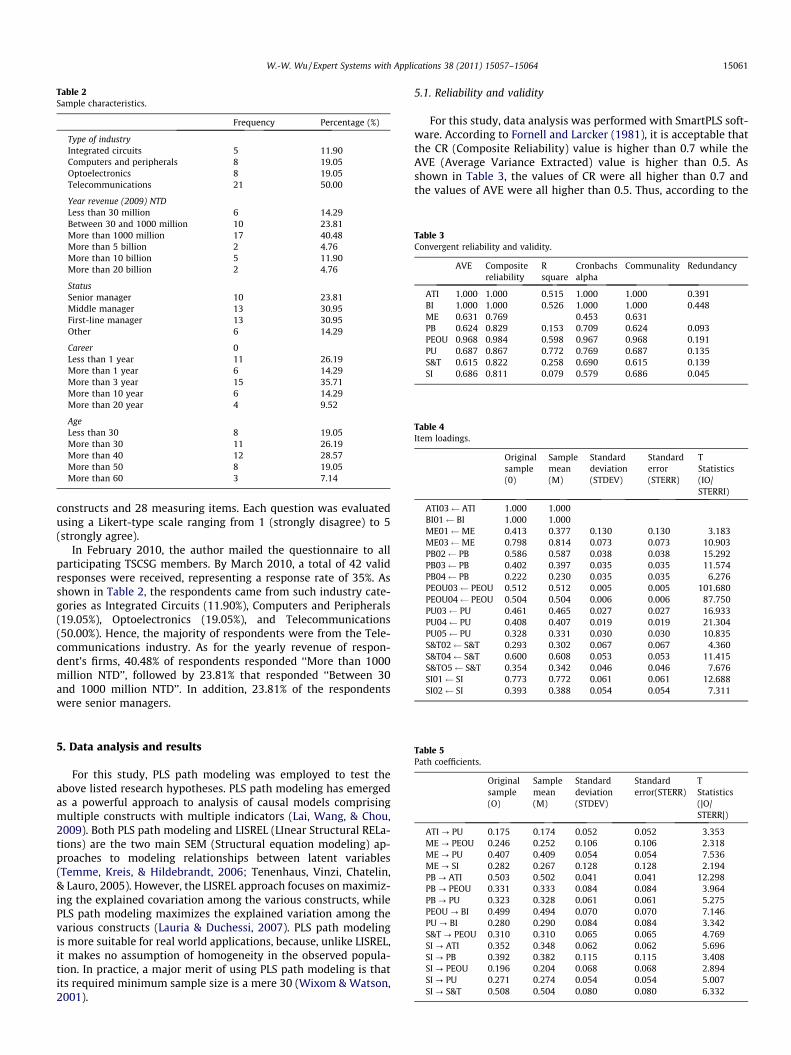
Table 2Sample characteristics.
Frequency Percentage (%)
Type of industryIntegrated circuits 5 11.90Computers and peripherals 8 19.05Optoelectronics 8 19.05Telecommunications 21 50.00
Year revenue (2009) NTDLess than 30 million 6 14.29Between 30 and 1000 million 10 23.81More than 1000 million 17 40.48More than 5 billion 2 4.76More than 10 billion 5 11.90More than 20 billion 2 4.76
StatusSenior manager 10 23.81Middle manager 13 30.95First-line manager 13 30.95Other 6 14.29
Career 0Less than 1 year 11 26.19More than 1 year 6 14.29More than 3 year 15 35.71More than 10 year 6 14.29More than 20 year 4 9.52
AgeLess than 30 8 19.05More than 30 11 26.19More than 40 12 28.57More than 50 8 19.05More than 60 3 7.14
Table 3Convergent reliability and validity.
AVE Compositereliability
Rsquare
Cronbachsalpha
Communality Redundancy
ATI 1.000 1.000 0.515 1.000 1.000 0.391BI 1.000 1.000 0.526 1.000 1.000 0.448ME 0.631 0.769 0.453 0.631PB 0.624 0.829 0.153 0.709 0.624 0.093PEOU 0.968 0.984 0.598 0.967 0.968 0.191PU 0.687 0.867 0.772 0.769 0.687 0.135S&T 0.615 0.822 0.258 0.690 0.615 0.139SI 0.686 0.811 0.079 0.579 0.686 0.045
Table 4Item loadings.
Originalsample(0)
Samplemean(M)
Standarddeviation(STDEV)
Standarderror(STERR)
TStatistics(IO/STERRI)
ATI03 ATI 1.000 1.000BI01 BI 1.000 1.000ME01 ME 0.413 0.377 0.130 0.130 3.183ME03 ME 0.798 0.814 0.073 0.073 10.903PB02 PB 0.586 0.587 0.038 0.038 15.292PB03 PB 0.402 0.397 0.035 0.035 11.574PB04 PB 0.222 0.230 0.035 0.035 6.276PEOU03 PEOU 0.512 0.512 0.005 0.005 101.680PEOU04 PEOU 0.504 0.504 0.006 0.006 87.750PU03 PU 0.461 0.465 0.027 0.027 16.933PU04 PU 0.408 0.407 0.019 0.019 21.304PU05 PU 0.328 0.331 0.030 0.030 10.835S&T02 S&T 0.293 0.302 0.067 0.067 4.360S&T04 S&T 0.600 0.608 0.053 0.053 11.415S&TO5 S&T 0.354 0.342 0.046 0.046 7.676SI01 SI 0.773 0.772 0.061 0.061 12.688SI02 SI 0.393 0.388 0.054 0.054 7.311
W.-W. Wu / Expert Systems with Applications 38 (2011) 15057–15064 15061
constructs and 28 measuring items. Each question was evaluatedusing a Likert-type scale ranging from 1 (strongly disagree) to 5(strongly agree).
In February 2010, the author mailed the questionnaire to allparticipating TSCSG members. By March 2010, a total of 42 validresponses were received, representing a response rate of 35%. Asshown in Table 2, the respondents came from such industry cate-gories as Integrated Circuits (11.90%), Computers and Peripherals(19.05%), Optoelectronics (19.05%), and Telecommunications(50.00%). Hence, the majority of respondents were from the Tele-communications industry. As for the yearly revenue of respon-dent’s firms, 40.48% of respondents responded ‘‘More than 1000million NTD’’, followed by 23.81% that responded ‘‘Between 30and 1000 million NTD’’. In addition, 23.81% of the respondentswere senior managers.
Table 5Path coefficients.
Originalsample(O)
Samplemean(M)
Standarddeviation(STDEV)
Standarderror(STERR)
TStatistics(|O/STERR|)
ATI ? PU 0.175 0.174 0.052 0.052 3.353ME ? PEOU 0.246 0.252 0.106 0.106 2.318ME ? PU 0.407 0.409 0.054 0.054 7.536ME ? SI 0.282 0.267 0.128 0.128 2.194PB ? ATI 0.503 0.502 0.041 0.041 12.298PB ? PEOU 0.331 0.333 0.084 0.084 3.964PB ? PU 0.323 0.328 0.061 0.061 5.275PEOU ? BI 0.499 0.494 0.070 0.070 7.146PU ? BI 0.280 0.290 0.084 0.084 3.342S&T ? PEOU 0.310 0.310 0.065 0.065 4.769SI ? ATI 0.352 0.348 0.062 0.062 5.696SI ? PB 0.392 0.382 0.115 0.115 3.408SI ? PEOU 0.196 0.204 0.068 0.068 2.894SI ? PU 0.271 0.274 0.054 0.054 5.007SI ? S&T 0.508 0.504 0.080 0.080 6.332
5. Data analysis and results
For this study, PLS path modeling was employed to test theabove listed research hypotheses. PLS path modeling has emergedas a powerful approach to analysis of causal models comprisingmultiple constructs with multiple indicators (Lai, Wang, & Chou,2009). Both PLS path modeling and LISREL (LInear Structural RELa-tions) are the two main SEM (Structural equation modeling) ap-proaches to modeling relationships between latent variables(Temme, Kreis, & Hildebrandt, 2006; Tenenhaus, Vinzi, Chatelin,& Lauro, 2005). However, the LISREL approach focuses on maximiz-ing the explained covariation among the various constructs, whilePLS path modeling maximizes the explained variation among thevarious constructs (Lauria & Duchessi, 2007). PLS path modelingis more suitable for real world applications, because, unlike LISREL,it makes no assumption of homogeneity in the observed popula-tion. In practice, a major merit of using PLS path modeling is thatits required minimum sample size is a mere 30 (Wixom & Watson,2001).
5.1. Reliability and validity
For this study, data analysis was performed with SmartPLS soft-ware. According to Fornell and Larcker (1981), it is acceptable thatthe CR (Composite Reliability) value is higher than 0.7 while theAVE (Average Variance Extracted) value is higher than 0.5. Asshown in Table 3, the values of CR were all higher than 0.7 andthe values of AVE were all higher than 0.5. Thus, according to the
15062 W.-W. Wu / Expert Systems with Applications 38 (2011) 15057–15064
Fornell and Larcker criteria, the study reached satisfactory conver-gent reliability and validity.
5.2. Path coefficients and predictive ability
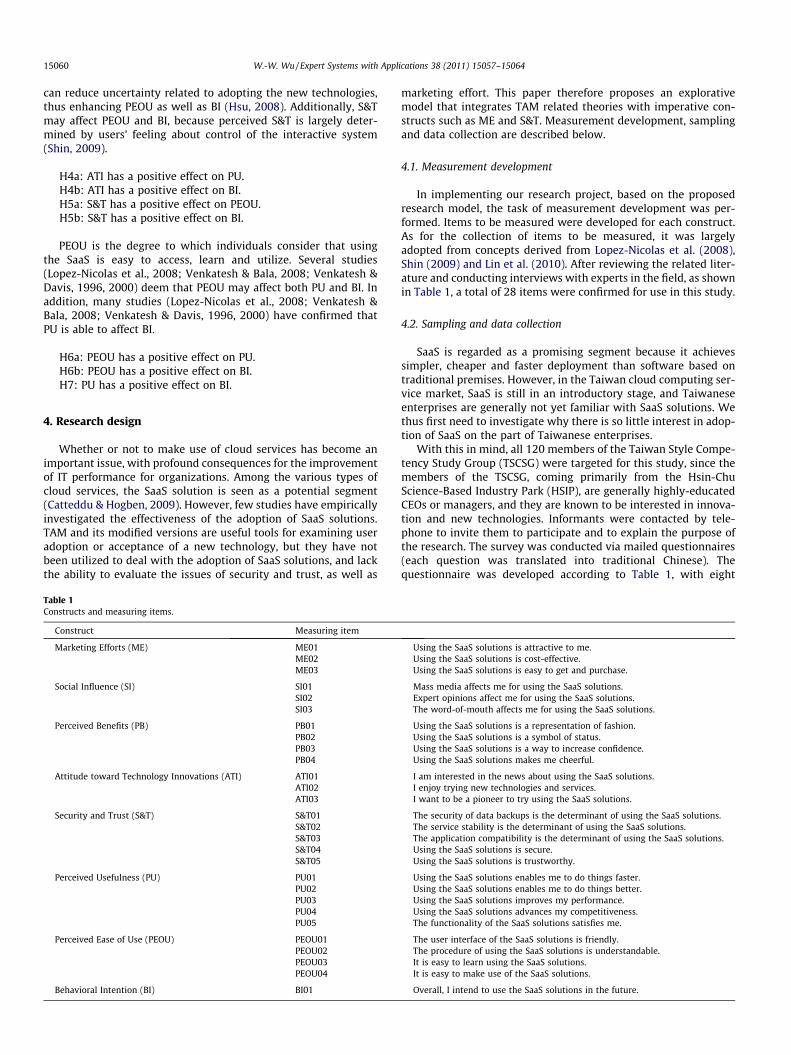
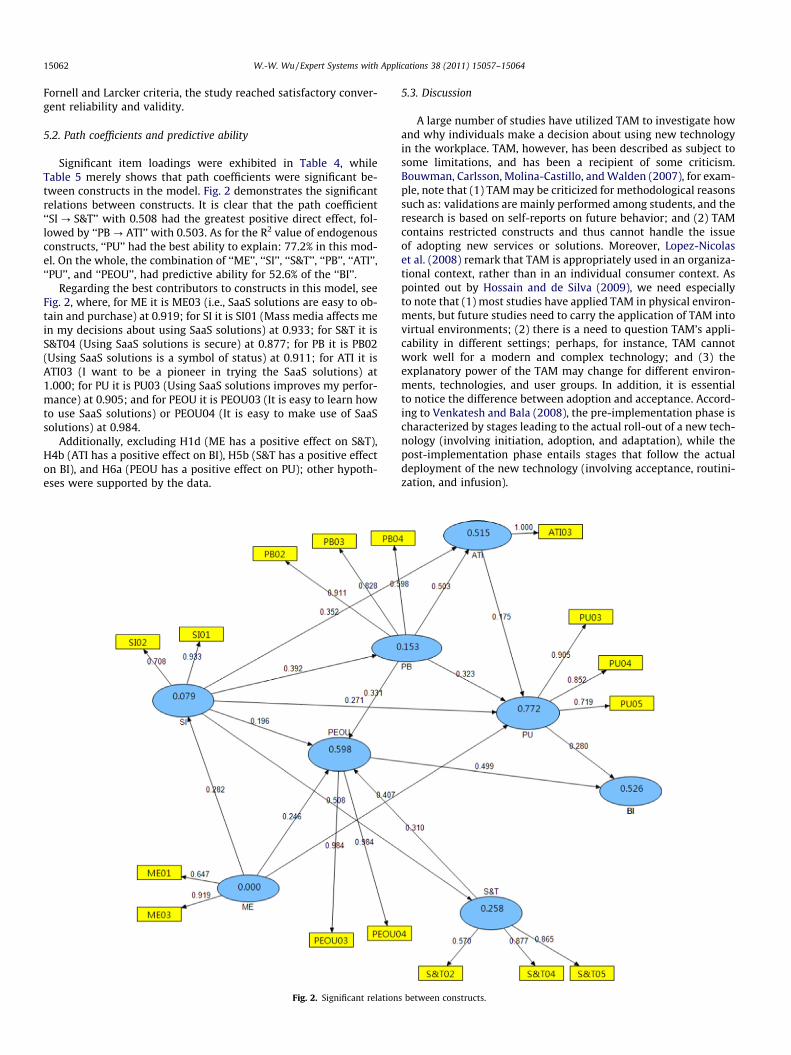
Significant item loadings were exhibited in Table 4, whileTable 5 merely shows that path coefficients were significant be-tween constructs in the model. Fig. 2 demonstrates the significantrelations between constructs. It is clear that the path coefficient‘‘SI ? S&T’’ with 0.508 had the greatest positive direct effect, fol-lowed by ‘‘PB ? ATI’’ with 0.503. As for the R2 value of endogenousconstructs, ‘‘PU’’ had the best ability to explain: 77.2% in this mod-el. On the whole, the combination of ‘‘ME’’, ‘‘SI’’, ‘‘S&T’’, ‘‘PB’’, ‘‘ATI’’,‘‘PU’’, and ‘‘PEOU’’, had predictive ability for 52.6% of the ‘‘BI’’.
Regarding the best contributors to constructs in this model, seeFig. 2, where, for ME it is ME03 (i.e., SaaS solutions are easy to ob-tain and purchase) at 0.919; for SI it is SI01 (Mass media affects mein my decisions about using SaaS solutions) at 0.933; for S&T it isS&T04 (Using SaaS solutions is secure) at 0.877; for PB it is PB02(Using SaaS solutions is a symbol of status) at 0.911; for ATI it isATI03 (I want to be a pioneer in trying the SaaS solutions) at1.000; for PU it is PU03 (Using SaaS solutions improves my perfor-mance) at 0.905; and for PEOU it is PEOU03 (It is easy to learn howto use SaaS solutions) or PEOU04 (It is easy to make use of SaaSsolutions) at 0.984.
Additionally, excluding H1d (ME has a positive effect on S&T),H4b (ATI has a positive effect on BI), H5b (S&T has a positive effecton BI), and H6a (PEOU has a positive effect on PU); other hypoth-eses were supported by the data.
Fig. 2. Significant relation
5.3. Discussion
A large number of studies have utilized TAM to investigate howand why individuals make a decision about using new technologyin the workplace. TAM, however, has been described as subject tosome limitations, and has been a recipient of some criticism.Bouwman, Carlsson, Molina-Castillo, and Walden (2007), for exam-ple, note that (1) TAM may be criticized for methodological reasonssuch as: validations are mainly performed among students, and theresearch is based on self-reports on future behavior; and (2) TAMcontains restricted constructs and thus cannot handle the issueof adopting new services or solutions. Moreover, Lopez-Nicolaset al. (2008) remark that TAM is appropriately used in an organiza-tional context, rather than in an individual consumer context. Aspointed out by Hossain and de Silva (2009), we need especiallyto note that (1) most studies have applied TAM in physical environ-ments, but future studies need to carry the application of TAM intovirtual environments; (2) there is a need to question TAM’s appli-cability in different settings; perhaps, for instance, TAM cannotwork well for a modern and complex technology; and (3) theexplanatory power of the TAM may change for different environ-ments, technologies, and user groups. In addition, it is essentialto notice the difference between adoption and acceptance. Accord-ing to Venkatesh and Bala (2008), the pre-implementation phase ischaracterized by stages leading to the actual roll-out of a new tech-nology (involving initiation, adoption, and adaptation), while thepost-implementation phase entails stages that follow the actualdeployment of the new technology (involving acceptance, routini-zation, and infusion).
s between constructs.
W.-W. Wu / Expert Systems with Applications 38 (2011) 15057–15064 15063
Although modified versions of TAM (such as TAM2, UTAUT, andTAM3) have made great progress, it must be emphasized that theyfocus on understanding the determinants of employees’ new tech-nology adoption, rather than trying to ascertain the determinantsof managerial decision making in terms of new technology adop-tion. Moreover, as noted above, although TAM and its modifiedversions attempt to highlight some specific concepts, they all lackthe capacity to deal with such constructs as security and trust, aswell as marketing effort. These aspects are increasingly importantfor us to consider with regard to the adoption of modern ITs. TAM,for instance is aimed at achieving a better understanding of theantecedents of PEOU, in order to design effective training interven-tions to improve user acceptance (Venkatesh & Davis, 1996); TAM2endeavors to deepen understanding of PU in order to design orga-nizational interventions that would increase user acceptance ofnew systems (Venkatesh & Davis, 2000); UTAUT formulates a uni-fied model as a useful tool for managers needing to assess the like-lihood of success for new technology introductions, and helpsthem understand the drivers of acceptance in order to proactivelydesign interventions (Venkatesh et al., 2003); and TAM3 presentsan integrated model with the emphasis on PU and PEOU, in orderto address how managers make informed decisions about inter-ventions that can lead to greater acceptance and effective utiliza-tion of IT (Venkatesh & Bala, 2008).
As mentioned above, current TAM and its modifications cannotbe suitable for application in all kinds of settings. This is mainlydue to the fact that they employ a limited range of constructs, andparticularly, that they neglect to emphasize the importance of mar-keting effort, security and trust. Referring to Lee (2009), perceivedrisk is the principal negative factor affecting the adoption of a mod-ern and complex technology. Perceived S&T, on the other hand, isthe positive factor that lessens the uncertainty surrounding newtechnology adoption (Hsu, 2008). A significant barrier to the adop-tion of cloud services is the problem of security and trust, in thatmost users have considerable fear about data leakage and loss of pri-vacy (Mowbray & Pearson 2009). Thus, in any attempt to conduct re-search into the issue of SaaS adoption, it is essential to add theconstructs of security and trust into the research model. Addition-ally, it must be taken into account that SaaS is a relatively new solu-tion and is not yet well-known. Therefore, in order to advance thegrowth of the SaaS market, SaaS providers need to make consider-able efforts in the marketing area in order to increase enterpriseusers’ understanding about potential merits and reasonable securitysolutions. Clearly, marketing effort, based on an appropriate mar-keting mix, may influence PEOU, PU, and S&T (Lin et al., 2010).
For the purpose of exploring important factors affecting SaaSadoption, this paper has developed an integrated model that incor-porates TAM related theories with additional essential constructssuch as marketing effort, security and trust. The results of thisstudy indicate that most hypotheses were supported by the data.From these significant and supported hypotheses, we can deriveseveral implications about business management as follows: (1)SI has been shown to have positively wide-ranging influences onATI, PB, PU, PEOU, and S&T; (2) excluding the S&T, ME had positiveeffects on SI, PEOU, and PU; this means that ME cannot directly af-fect S&T, but can indirectly affect S&T through SI; (3) PB had posi-tive effects on both ATI and PU; this implies that the nonfunctionalPB can advance ATI as well as PU; (4) ATI had a positive influenceon PU; (5) S&T had a positive influence on PEOU; (6) PEOU had apositive effect on BI; and (7) PU had a positive effect on BI. Hence,it is clear that SaaS providers must put out their best marketing ef-forts to shape beneficial SI, since this is the factor which affectsmost of the determinants of BI. Enterprise users, on the other hand,need to pay attention to SI, and to pursue such issues as real PU,S&T assurances, and meaningful PEOU in order to maximize perfor-mance as well as to minimize risk with regard to SaaS adoption.
Additionally, the construct with the highest explanatory powerwas PU (77.2%), followed by PEOU (59.8%), ATI (51.5%), S&T(25.8%), PB (15.3%), and SI (7.9%). This finding is consistent withseveral prior studies that have identified PU and PEOU as twokey determinants of BI (King & He, 2006). However, this study indi-cates that PEOU had no positive effect on PU, and thus that merelyimproving PEOU will not necessarily contribute to increase PU inthe SaaS adoption setting. Furthermore, with reference to signifi-cant items measured (see Fig. 2), various possible explanationsare proposed, such as the following: (1) for ME, SaaS was attractiveand easy to purchase, but not cost-effective; (2) for SI, SaaS adop-tion was affected by mass media and expert opinions, but appar-ently not by word-of-mouth; and (3) for S&T, the SaaS solutionwas secure and trustworthy, and service stability was the principaldeterminant leading to use of SaaS solutions. However, clients re-tained concerns about application compatibility as well as aboutthe security of data backups. Hence, it is obvious that SaaS provid-ers should offer more powerful optimal practices so that they canconvince users of their significant contributions in response tothese worries and concerns regarding cost-effectiveness, applica-tion compatibility, and the security of data backups. Enterpriseusers, on the other hand, need to examine their capabilities andstrategies in terms of SaaS adoption, not merely to follow tradi-tional best practices.
6. Conclusions
Although new technologies always involve potential benefitsand possible risks, most enterprises have an ongoing need to dealwith the issue of new technology adoption. TAM and its modifica-tions have contributed to efforts to examine how users come to ac-cept a new technology, but they have not yet been employed tohandle the issue of SaaS adoption. More importantly, they havesome significant limitations, such as: not being applicable in allkinds of settings (Bouwman et al., 2007; Hossain & de Silva,2009); focusing on helping managers make constructive interven-tions to encourage employees to accept and utilize a new technol-ogy, rather than on helping managers make informed decisionsabout a new technology adoption; and failure to address theimportance of security and trust, an issue that is increasingly cru-cial for those considering the adoption of new technologies.
Lopez-Nicolas et al. (2008) argues that TAM and its modifiedversions are too parsimonious, incomplete, and tautological. Theypropose, therefore, the TAM-DTM system, which is more compactand suitable for use, and possesses such merits as: (1) it allows thatSocial Influence (SI) is affected by Media Influence (MI) as the ante-cedent, because mass media influence is dominant in the initialstage of innovation adoption; and (2) it makes clear that PerceivedBenefits (PB) is based on the nonfunctional factors while PerceivedUsefulness (PU) is focused on the functional factors. TAM-DTM,however also fails to emphasize security and trust, and it high-lights the individual consumer context rather than the organiza-tional context. Moreover, it is essential to note that, in order topromote the adoption of new technologies, marketing efforts areindispensable (Lin et al., 2010). Hence, in order to examine signif-icant factors affecting SaaS adoption, this paper proposes a re-search model, which is mainly based on TAM-DTM but addscrucial constructs, namely, Marketing Efforts (ME) citing from Linet al. (2010) as well as Security and Trust (S&T) citing from Shin(2009).
This paper has attempted to contribute to the development ofan explorative model that extends the practical applications ofcombining TAM related theories with additional essential con-structs such as marketing effort, security and trust, in order to pro-vide a useful framework for managers to assess the issue of SaaS
15064 W.-W. Wu / Expert Systems with Applications 38 (2011) 15057–15064
adoption and for SaaS providers to become sensitive to the voicesof enterprise users. The findings of this study, moreover, providea foundation for further research, with the goal of more deeplyinvestigating issues surrounding the adoption of SaaS solutions.The findings also offer a meaningful base for enterprise users orSaaS providers to deepen their understanding with regard to SaaSadoption. However, this study has some limitations. Certainly, thesample size is small and is therefore of somewhat limited statisti-cal significance, and thus, in future research, the usefulness of theproposed model needs to be tested out with a larger sample size.
References
Bouwman, H., Carlsson, C., Molina-Castillo, F. J., & Walden, P. (2007). Barriers anddrivers in the adoption of current and future mobile services in Finland.Telematics and Informatics, 24(2), 145–160.
Catteddu, D., & Hogben, G. (2009). Cloud Computing: Benefits, risks andrecommendations for information security. European Network and InformationSecurity Agency (ENISA) pp. 1–125.
Cisco, (2009). The Cisco powered network cloud: An exciting managed servicesopportunity. White Paper, Cisco Systems.
Coombe, B. (2009). Cloud computing-overview, advantages, and challenges forenterprise deployment. Bechtel Technology Journal, 2(1), 1–11.
Davis, F. D. (1986). A technology acceptance model for empirically testing new end-userinformation systems: Theory and results. Doctoral dissertation, Sloan School ofManagement, Massachusetts Institute of Technology, Cambridge, MA.
Davis, F. D., Bagozzi, R. P., & Warshaw, P. R. (1989). User acceptance of computertechnology: A comparison of two theoretical models. Management Science,35(8), 982–1003.
Feuerlicht, G. (2010). Next generation SOA: Can SOA survive cloud computing?. In:V. Snasel, P.S. Szczepaniak, & J. Kacprzyk, (Eds.), Advances in Intelligent WebMastering - 2, AISC 67, pp. 19–29.
Fishbein, M., & Ajzen, I. (1975). Belief, attitude, intention, and behavior: Anintroduction to theory and research reading. MA: Addison-Wesley.
Fornell, C., & Larcker, D. F. (1981). Evaluating structural equation models withunobservable variables and measurement error. Journal of Marketing Research,18(1), 39–50.
Hossain, L., & de Silva, A. (2009). Exploring user acceptance of technology usingsocial networks. The Journal of High Technology Management Research, 20(1),1–18.
Hsu, S. H. (2008). Developing an index for online customer satisfaction: Adaptationof American customer satisfaction index. Expert Systems with Applications, 34(4),3033–3042.
King, W. R., & He, J. (2006). A meta-analysis of the technology acceptance model.Information & Management, 43(6), 740–755.
Klems, M., Nimis, J., & Tai, S. (2009). Do Clouds Compute? A Framework for Estimatingthe Value of Cloud Computing. C. Weinhardt, S. Luckner, & J. Stoßer (Eds.): WEB2008, LNBIP 22, pp. 110–123.
Lai, J. Y., Wang, C. T., & Chou, C. Y. (2009). How knowledge map fit andpersonalization affect success of KMS in high-tech firms. Technovation, 29(4),313–324.
Lauria, E. J. M., & Duchessi, P. J. (2007). A methodology for developing Bayesiannetworks: An application to information technology (IT) implementation.European Journal of Operational Research, 179(1), 234–252.
Lee, M. C. (2009). Factors influencing the adoption of internet banking: Anintegration of TAM and TPB with perceived risk and perceived benefit.Electronic Commerce Research and Applications, 8(3), 130–141.
Lee, Y. C., Li, M. L., Yen, T. M., & Huang, T. H. (2010). Analysis of adopting anintegrated decision making trial and evaluation laboratory on a technologyacceptance model. Expert Systems with Applications, 37(2), 1745–1754.
Lin, W. B., Wang, M. K., & Hwang, K. P. (2010). The combined model of influencingon-line consumer behavior. Expert Systems with Applications, 37(4), 3236–3247.
Lopez-Nicolas, C., Molina-Castillo, F. J., & Bouwman, H. (2008). An assessment ofadvanced mobile services acceptance: Contributions from TAM and diffusiontheory models. Information & Management, 45(6), 359–364.
Mowbray, M., & Pearson, S. (2009). A Client-Based Privacy Manager for CloudComputing. Conference on Communication System Software and Middleware.COMSWARE’09, June 16–19, 2009, Dublin, Ireland.
Pedersen, P. (2005). Adoption of mobile Internet services: An exploratory study ofmobile commerce early adopters. Journal of Organizational Computing andElectronic Commerce, 15(3), 203–222.
Rogers, E. M. (1995). The diffusion of innovation (4th ed.). Free Press.Shin, D. H. (2009). Towards an understanding of the consumer acceptance of mobile
wallet. Computers in Human Behavior, 25(6), 1343–1354.Temme, D., Kreis, H., & Hildebrandt, L. (2006). PLS Path Modeling-A Software Review,
SFB 649 Discussion Papers SFB649DP2006-084, Humboldt University, Berlin,Germany.
Tenenhaus, M., Vinzi, V. E., Chatelin, Y. M., & Lauro, C. (2005). PLS path modeling.Computational Statistics and Data Analysis, 48(1), 159–205.
Tung, F. C., Chang, S. C., & Chou, C. M. (2008). An extension of trust and TAM modelwith IDT in the adoption of the electronic logistics information system in HIS inthe medical industry. International Journal of Medical Informatics, 77, 324–335.
Venkatesh, V., & Bala, H. (2008). Technology acceptance model 3 and a researchagenda on interventions. Decision Sciences, 39(2), 273–315.
Venkatesh, V., & Davis, F. D. (1996). A model of the antecedents of perceived ease ofuse: Development and test. Decision Sciences, 27(3), 451–481.
Venkatesh, V., & Davis, F. D. (2000). A theoretical extension of the technologyacceptance model: Four longitudinal field studies. Management Science, 46(2),186–204.
Venkatesh, V., Morris, M. G., Davis, G. B., & Davis, F. D. (2003). User acceptance ofinformation technology: Toward a unified view. MIS Quarterly, 27(3), 425–478.
Wixom, B. H., & Watson, H. J. (2001). An empirical investigation of the factorsaffecting data warehousing success. MIS Quarterly, 25(1), 17–41.