developing an overall ranking of 79 marketing journals: an
TRANSCRIPT

Australasian Marketing Journal 17 (2009) 160–174
Contents lists available at ScienceDirect
Australasian Marketing Journal
journal homepage: www.elsevier .com/locate /amj
Developing an overall ranking of 79 marketing journals: An introductionof PRINQUAL to marketing
Boonghee Yoo *
Department of Marketing and International Business, Frank G. Zarb School of Business, Hofstra University, Room 131 Weller Hall, Hempstead, NY 11549, USA
a r t i c l e i n f o
Keywords:Optimal scaling
PRINQUAL procedureQualitative dataMissing valuesMissing data imputationJournal rankingMarketing journals1441-3582/$ - see front matter � 2009 Australian andoi:10.1016/j.ausmj.2009.05.014
* Tel.: +1 (516) 463 4242; fax: +1 (516) 463 4834.E-mail address: [email protected]
a b s t r a c t
The PRINQUAL (PRINcipal components of QUALitative data) procedure transforms original variables lin-early or nonlinearly and optimizes the properties of the transformed variables’ covariance or correlationmatrix. During the transformation procedure, PRINQUAL also imputes missing values measured at all lev-els of measurement. Although the application of PRINQUAL is endless in marketing, it is virtuallyunknown to marketing researchers. This study introduces PRINQUAL to marketing by demonstratingits capability, which produces a composite ranking of marketing journals across a variety of studies thatused different ways of rankings and ranked a different set of journals. The application PRINQUAL inte-grates 13 studies and produces overall rankings of 79 marketing journals.
� 2009 Australian and New Zealand Marketing Academy. All rights reserved.
The PRINQUAL (PRINcipal components of QUALitative data)procedure, available in SAS (SAS Institute, 2004) as the mostpopular implementation of principal component analysis accom-panied by optimal scaling, transforms original variables linearlyor nonlinearly and optimizes the properties of the transformedvariables’ covariance or correlation matrix. Simply put, as a col-lection of optimal scaling procedures, it transforms variables andreduces their number for other data analyses such as regressionanalysis and cluster analysis. After optimal transformation, itconducts ordinary principal components analysis for quantitativedata as well as qualitative data. During the transformation proce-dure, it also imputes missing values measured at all levels ofscale (i.e., nominal, ordinal, interval, ratio, or mixed). PRINQUALshows a great advantage particularly in dealing with qualitativemissing data. In addition, it displays data in multiple dimensionsusing multidimensional unfolding algorithms (SAS Institute,2008).
Although virtually unknown to marketing researchers (Dadzieet al., 2002 for an exception), PRINQUAL has been found very usefulfor many important problems in a variety of disciplines. Examplesinclude imputing missing data in a neuropsychological study ofrelatives of schizophrenic patients (Faraone et al., 1995); estimat-ing missing values for internal preference mapping (Hedderleyand Wakeling, 1995) and for ranking the working partners in thecommunication network (Beyers and Dierickx, 1998); transform-ing the original rankings of information sources to obtain the max-
d New Zealand Marketing Academ
imum variance (White and Jacobs, 1998); estimating the numberof the sexual partners for nonrespondents in a large national sur-vey (Kupek, 1999); testing the true levels of measurement in polit-ical election data (Jacoby, 1999); taking account of the importantmorphognostic features in an ethnic anthropology study (Vonde-rach, 2006); examining the cross-cultural measure equivalence ofcore marketing constructs (Dadzie et al., 2002); plotting an internalpreference map of cheddar cheese profile characteristics (Young etal., 2004); deriving quantitative variables from categorical data ineducation (Parra and Yano, 2005); extracting more informationfrom ordinal-scaled variables in ecology (Vaughan and Ormerod,2005); and synthesizing a variety of nursing activities into one la-tent variable (Sermeus et al., 2008).
The application of PRINQUAL is endless wherever multiplesources or judges rank the objects entirely or selectively and bythe same or different levels of measurement. For example, themethod can be useful in computing overall preference or qualityranks of brands, firms, stores, sports players, movies, schools,peers, employees, and strategic alternatives as evaluated by multi-ple judges or in various sources. PRINQUAL is a more powerful toolin imputing missing values than any other statistical method par-ticularly when data are of ordinal or nominal scale because it isflexible to the type of scale.
In summary, PRINQUAL has the following major advantagesover ordinary linear principal component analysis (de Leeuw,2006; Kuhfeld, 1990; Linting et al., 2007a). First, it can preprocessdata, transforming variables prior to other analyses. The type ofscale covers any mix of metric and nonmetric measures (nominal,ordinal, interval and ratio). This enables a researcher to incorporatemultiple sources or variables which have used very different
y. All rights reserved.

B. Yoo / Australasian Marketing Journal 17 (2009) 160–174 161
measurement levels to one another. Second, it has a great ability inimputing missing data, which makes it possible to utilize an obser-vation with many missing values and accordingly increase thenumber of data observations that can be used for analysis. Third,as an optimal scaling technique (converting nominal and ordinalvariables to interval variables), it transforms data nonlinearly(and linearly) in direction to maximize the covariance or correla-tion aspects of variables. Fourth, as principal component analysismethod, it reduces the number of variables for other subsequentstatistics such as regression analysis and cluster analysis.
The purpose of this study is introduce PRINQUAL to marketingby demonstrating its capability, which produces a compositeordering of marketing journals across a variety of rankings studies,especially in a situation where studies used different ways of rank-ings and where some journals were not graded in all studies. Anyrankings study has its own set of journals which could be differentfrom other studies. Therefore, ‘‘missing” or incomplete rankingsare inevitable when one attempts to integrate multiple studies.
1. The PRINQUAL procedure
PRINQUAL has three major algorithms of data transformation:the maximum total variance algorithm (MTV), the minimum gen-eralized variance (MGV), and the maximum average correlationmethod (MAC) (for details, see Perreault and Young, 1980). Allthree methods optimize some properties of the correlation orcovariance matrix of the variables, producing new, transformedscores for the observations of the original variables.
The MTV (Kuhfeld et al., 1985; Young, 1981; Young et al., 1978)maximizes the total variance of the first r principal componentsamong the variables by iteratively conducting Hotelling’s (1933)ordinary principal components model until obtaining convergence.The ordinary principal components analysis hypothesizes that Z iscomposed of the following two parts: Z = XF́, where Z is an m � nmatrix of m observations or subjects on n variables, X is an m � rmatrix of m principal component scores on r principal compo-nents, and F is an n � r matrix of n loadings of the manifest vari-ables on the r principal components.
The solution to the identification problem is that X́X/m = I(identity) and F́F = D (diagonal). Conventionally, Z is solved byminimizing h = tr(Z � Z^)0(Z � Z^) for a selected number of princi-pal components where tr stands for trace. Thus, minimizing h is thesame as maximizing the total variance of Z accounted for since h
indicates the unexplained variance of Z. This process creates a sca-lar summary on how well the new predicted matrix explains thanoriginal variance–covariance matrix.
The MGV method has the following fit criterion h equation:h = |(Z�Z^)0(Z�Z^)|. To solve this equation, MGV alternates multi-ple regression and optimal scaling equations for each variable.Each variable becomes the dependent variable while all other vari-ables become independent variables. This process achieves theminimal generalized variance by transforming each variable sothat a linear combination of the remaining variables can explainthe focal variables sufficiently (Kuhfeld et al., 1985).
The MAC iterates a constrained multiple regression model tomaximize the equally weighted average of the elements of the cor-relation matrix (Kuhfeld et al., 1986). This method transforms eachvariable to approach the average of the remaining variables. TheMAC algorithm is very similar to the MGV one, except for a minordifference in its fit function. This method is appropriate with vari-ables positively correlated to one another and with the use of nomonotonic transformation.
PRINQUAL has two major families of fit functions for data trans-formation. The first family is a group of nonoptimal transforma-tions that mechanically replace the original variables with new
nonoptimal, nonlinear transformation. Specific functions includeinverse trigonometric sine, exponential, logarithm, logit, power,and ranks. The second family is a group of optimal transformationsthat iteratively derive optimal transformation that fits the specifiedmodel. Examples of functions are linear, monotonic with ties,monotonic without ties, B-spline (i.e., a smooth line in contrastto a straight line), and optimal scoring transformations.
It should ne noted that there are other software options equiv-alent to PRINQUAL. Examples include HOMALS in the R contributedpackages and nonlinear PCA in the Guttman–Lingoes programs (deLeeuw, 2006). However, CATPCA of the SPSS Categories is the mostcommonly used commercial package along with PRINQUAL (seeLinting et al., 2007a for algorithms and, 2007b for applications).
2. Journal rankings
Journal rankings are important for several reasons. First, journalpublications are a primary measure for scholarly performance (Du-Bois and Reeb, 2000; Guidry et al., 2004). Therefore, researchersuse journal rankings to figure out top-quality publication outletsin order to ‘‘enhance the visibility and impact of their research”,through which they want to gain ‘‘prestige, rank promotion, ten-ure, and pay increases” (Baumgartner and Pieters, 2003, p. 123).Accordingly, the rankings are used as a very suitable measure of re-search performance evaluations for chairpersons and committees(Baumgartner and Pieters, 2003; Hult et al., 1997; Zinkhan, 2004)and a means of explicit publication targets and publication strate-gies (van Fleet et al., 2000). Departments often use the rankings toclassify journals to A, B, and C categories as an objective standardfor recruitment, promotion, and performance evaluations. Second,similarly, institutions and journal editors use rankings as ‘‘a meansto promote their accomplishments to both higher-level adminis-trators and outside audiences” (Zinkhan and Leigh, 1999) and todifferentiate themselves (Polonsky and Whitelaw, 2006). Third, li-braries and electronic databases use journal rankings to determinewhich journals to purchase and index, respectively (Rogers, 2001).
However, there could be problems with overall journal rank-ings. First, any rankings study could be susceptible to rater biasresulting from the rater’s familiarity with the journal, area ofexpertise, publishing record, geographic location, affiliation withthe journal, and the type of university that evaluates the journal(Bauerly and Johnson, 2005; Hult et al., 1997; Polonsky et al.,1999; Theoharakis and Hirst, 2002). For example, raters show aninherent tendency to evaluate methodological, research, or olderjournals more favorably than applied, pedagogical, or youngerjournals (Hawkins et al., 1973; Jobber and Simpson, 1988; Polon-sky et al., 1999). Second, leading journals easily reach a consensusin ranking across studies, but lower-ranked journals outside the‘‘A” group are often omitted in ranking and seem to be influencedby a range of institutional and individual factors (Polonsky andWhitelaw, 2006). Third, journals show discrepancies in many as-pects. For example, some journals focus on development of basicresearch whereas others focus on applied or pedagogical research.Some journals serve broad areas of interest whereas others serve acertain area. Some journals target academic researchers whereasothers target practitioners. Some journals deal with a certain geo-graphic region whereas others deal with all countries.
In summary, development of fair overall journal rankings re-quires integration of multiple rankings studies to minimize the im-pact of missions, audiences, ranking developers, areas, andgeographic markets embedded in any particular journal-rankingsstudy (Hult et al., 1997; Polonsky et al., 1999; Polonsky and White-law, 2006). In an effort of integrating multiple rankings studies ofdifferent characteristics, this task inevitably faces two major, diffi-cult methodological challenges: first, many missing data (as each

162 B. Yoo / Australasian Marketing Journal 17 (2009) 160–174
rankings study has a different set of journals) and, second, differenttypes of measurement (as some studies use ratings or ratio scaleswhile others use ordinal categories).
In this context, PRINQUAL must be a proper method to over-come those two challenges because it deals with all levels of mea-surement, imputes missing values, and reduces multiple variables(here, ranking scores of the journals in individual studies) into oneprincipal component (that is, overall ranking scores integratingthose in individual studies).
Although the purpose of this study is to demonstrate the useful-ness of PRINQUAL, some readers might wonder if we need anothernew study on marketing rankings. However, note that the numberof marketing and, broadly, business journals does not remain thesame; instead, the number increases. On this trend, Svenssonet al. (2007) write, ‘‘In the field of marketing, the number of aca-demic journals has continuously increased during recent decades,and Cabell has listed more than 550 journals that publish contribu-tions in this discipline. One reason for the plethora of marketingjournals is that each journal positions itself within certain sub-dis-ciplines or sub-areas of the wider subject area (Baumgartner andPieters, 2003; Malhotra, 1999).” As marketing scholars have to dealwith ever-increasing and overwhelmingly large numbers of jour-nals, the journal rankings need to be updated on the regular basis.
PRINQUAL Application in Developing Ove
1. Sample o 13 rankino 79 marke
2. Data preparation o Raw rankthose of the rank)
3. Imputation of missing ranks o MGV selranks
o Best tran“averagetransform
4. Validation of the imputed missing ranks
o Correlatioranks, an
5. Birth of overall rankings o PRINQUstudies
o Varianceo The first
overall ra
6. Grouping the journals o Cluster aten tiers
7. Validation of the overall rankings
o The overo Too Be
stuo Be
an
Fig. 1. PRINQUAL application in developing o
This is, of course, necessary for new journals rather than well-established ones, whose rankings are believed to show greatstability.
3. Data analysis and results
Fig. 1 summarizes the steps of data analysis showing how PRIN-QUAL was applied to development of overall rankings of marketingjournals.
3.1. Sample
This study analyzed 13 rankings studies (see their brief infor-mation in Table 1). Except for the classic 1997 study by Hult,Neese, and Bashaw, all studies were fewer than five years old. Eachstudy ranked from 20 to 61 journals and 41 journals on average.The analyzed studies showed a good spectrum of diversity. First,five studies were academic journal publications, whereas eightstudies were rankings that business schools were using for theirinternal use or that business faculty agreed upon in a survey. Sec-ond, the studies showed a geographic diversity as their rankingsoriginated from the whole world as well as individual countries,including the US, the UK, Australia, New Zealand, Germany,
rall Rankings of 79 Marketing Journals
gs studies of marketing journals selected ting journals selected out of the studies
s of some studies reversed to be consistent with other studies (The lower the score, the higher
ected over MTV and MAC to maintain the raw
sformation type selected by the highest ” and “minimum” correlations of both raw and ed ranks to the first principal component
n computed among raw ranks, transformed d the first principal component
AL run for the transformed ranks of the thirteen
explained for maximized principal component scores interpreted as new nkings of the 79 marketing journals
nalysis performed to group journals into two to
all rankings compared: the citation indexes by JCR tween studies by institutions for internal use and dies appeared in peer-reviewed journals tween studies that ranked marketing journals d studies that ranked related-field journals
verall rankings of 79 marketing journals.

Table 1A summary of 13 studies of marketing journal rankings.
Study Rankingmethod
Journalsranked
Marketingratioe (%)
Source
1 JME97 Full rankings 40 73.2 Hult, G. Tomas, M., Neese, W. T., & Bashaw, R. E. (1997). Faculty perceptions of marketing journals. Journal ofMarketing Education, 19 (1), 37–52
2 ML02 Full rankingsc 40 67.5 Theoharakis, V., & Hirst, A. (2002). Perceptual differences of marketing journals: A worldwide perspective.Marketing Letters, 13 (4), 389–402
3 Aston03a 5 Categories(4 to 1)d
34 97.1 Aston University (2003) based on a large survey of opinions of academics of the Midlands universities
4 JM03 Full rankings 50 75.5 Baumgartner, H., & Pieters, R (2003). The structural influence of marketing journals: A citation analysis of thediscipline and its sub-areas over time. Journal of Marketing, 67 (April), 123–139
5 UQ03a 5 Categories(1 to 5)
56 96.4 University of Queensland (2003) based on a mega-database (over 2000 titles) of ratings and rakings from over120 sources
6 Warwck03b 4 Categories(4 to 1)
32 96.9 Warwick Business School (2003)
7 AMJ04 Full rankings 60 95.0 Mort, G. S. M, McColl-Kennedy, J. R., Kiel, G, & Soutar, G. N. (2004). Perceptions of marketing journals by senioracademics in Australia and New Zealand. Australasian Marketing Journal, 12 (2), 51–61
8 BBS04b 4 Categories(4 to 1)
48 95.8 Bristol Business School, University of the West of England (2004)
9 CRL04 Full rankings 49 75.5 Joswick, K. E., Bauerly, R. J., & Johnson, D. T. (2004). Assessing marketing literature: A study of the readingsassigned in doctoral seminars in marketing. College & Research Libraries, 65 (5), 384–398
10 Imperl04b 4 Categories(4 to 1)
32 96.9 Imperial College, London (2004)
11 VHB04 10 Point scale(10 to 1)
61 95.1 Association of Professors of Management in German-speaking countries (2004) based on a highly interactiveand individualized survey of 651 professors and researchers in Germany, Austria, and Switzerland
12 CRA05a 4 Categories(4 to 1)
25 95.8 Cranfield University School of Management (July 2005) based on a large number of internal and externalsources, including journal impact factors
13 ESS05a 5 Categories(0 to 2)
20 95.0 ESSEC Business School, Paris (2005) based on a committee of seven ESSEC professors with outstandingperformance in research
a The rankings were reported in Journal Quality List, November 13, 2005, compiled by A. Harzing, University of Melbourne, Australia.b The rankings were reported in Bristol Business School, University of the West of England, January 2005, complied by C. Harvey and H. Morris.c Worldwide rankings were used.d The highest to lowest category of journal quality.e The ratio of marketing-focused journals among the ranked journals.
B. Yoo / Australasian Marketing Journal 17 (2009) 160–174 163
Switzerland, and Austria. Third, they hired various methods, suchas journal impact factors, faculty surveys, and doctoral seminarsyllabi analyses to develop journal rankings.
Table 2 reports the list and ranking scores of the journals orga-nized in the order of the frequency that a journal appeared in thestudies. The 13 studies ranked 94 journals overall, but this studyanalyzed the 79 journals that appeared in at least two studies.Out of the 79 journals, eleven journals appeared in all 13 studies,whereas eight ones appeared in two studies only. The journals cov-ered mainly the marketing field, but a few came from related busi-ness fields as marketing researchers often published in thosejournals.
3.2. Data preparation
To achieve consistency in ranking scores across studies, the rawscores were reversed in six studies of Aston03, Warwck03, BBS04,Imperl04, VHB04, and CRA05, whose raw scores went in oppositedirections of other studies. As a result, a lower score consistentlymeant a higher rank in every study. Then the PRINQUAL procedureavailable in SAS version 9 (SAS Institute, 2004) was conducted.
3.3. Imputation of missing ranks
The 13 studies did not rank all journals or the same number ofjournals. Thus, the very first task was to estimate the missing ranksof the journals unranked in all studies. For this task, the MGVtransformation method was selected rather than MTV or MAC be-cause the missing rank of a journal could be estimated more accu-rately when it was defined in linear combinations of the remainingrankings studies. Unlike MTV or MAC, the MGV algorithm preventsdramatic alterations of the original ranks, which is desirable for arankings study. One principal component solution was conducted
because all journals should be ranked in one hierarchy, and theoverall ranking should be the single underlying factor acrossstudies.
Then, 12 different transformation types were performed oneby one to see which type would produce the best result. All trans-formation types seemed to show a very similar performance be-cause every type is designed not to break severely thesimilarities between raw and transformed rankings by being loyalto the objectives of the algorithm specific to the type. However,two criteria were used to select the best type. First, the averagecorrelation of both raw and transformed ranks with the principalcomponent should be high so that the maximum variance can beobtained. Second, the minimum correlation of both raw andtransformed ranks with the principal component should be highso that a suitable amount of variance for every study can be ex-plained by the principal component. Table 3 shows how wellthe first principal component resulted from PRINQUAL correlatesto the raw ranks and the transformed ranks for each transforma-tion type. After careful comparisons, the monotonic, ties pre-served transformation was selected as it best satisfied the twocriteria mentioned above.
This monotonic transformation preserves the original order ofthe nonmissing ranks when estimating the values of the missingranks iteratively. Preserving ranks is important and necessary sothat the ranking made by each study remains intact. While mono-tonic transformation preserves the nonmissing ranks, it gives roomat the same time to the estimated missing ranks to fit in betweenthe nonmissing ranks whose order is not altered.
3.4. Validation of the imputed missing ranks
The monotonic transformations of ranking scores are plotted foreach rankings study in Fig. 2. In each plot, the horizontal axis

Table 2The list and rankings of the 79 journals selected for analysis.
COUNTa JME97 ML02 Aston03 JM03 UQ03 Warwck03 AMJ04 BBS04 CRL04 Imperl04 VHB04 CAR05 ESS05 Journal title
13 30 14 3 17 3 3 11 3 21 3 6.9 3 2 European Journal of Marketing13 20 21 3 10 3 3 16 3 18 3 5.6 3 2 Industrial Marketing Management13 26 6 4 22 2 4 8 4 16 4 8.9 3 0 Int’l Journal of Res in Mktg13 9 15 3 15 2 3 9 3 8 3 6.8 2 2 Journal of Advertising13 10 13 3 11 2 3 13 3 7 3 7.5 2 1 Journal of Advertising Research13 3 3 4 3 1 4 1 4 2 4 9.4 4 0 Journal of Consumer Research13 1 2 4 1 1 4 2 4 3 4 9.5 4 0 Journal of Marketing13 2 1 4 2 1 4 3 4 1 4 9.7 4 0 Journal of Marketing Research13 4 8 4 9 2 4 4 4 10 4 8.4 3 1 Journal of Retailing13 5 9 4 8 2 4 4 4 13 4 8.9 4 1 Journal of The Academy of Mktg Sci13 6 4 4 7 1 4 4 4 4 4 9.7 4 1 Marketing Science12 24 30 3 42 3 3 23 3 47 3 8.2 3 . Journal of International Marketing12 31 29 2 34 3 2 16 3 34 3 6.8 3 . Journal of Marketing Management12 34 11 4 25 2 4 10 4 14 4 8.2 . 1 Marketing Letters11 36 . 2 39 4 2 45 2 42 2 6.3 1 . Journal of Bus and Industrial
Marketing11 12 32 3 18 3 . 28 2 19 . 7.7 2 1 Journal of Pers Selling and Sales
Mgmt11 16 25 4 29 3 . 16 4 34 . 7.9 2 1 Psychology and Marketing10 13 17 . 6 3 2 . 2 9 2 7.3 2 . Advances in Consumer Research10 37 . 1 45 4 1 54 1 47 1 4.6 . . Journal of Global Marketing9 . 38 2 . 4 2 28 2 . 2 6.6 . 2 International Journal of
Advertising9 21 36 2 35 4 . 38 2 42 . 5.6 . . Journal of Consumer Marketing9 . . . 36 4 2 45 2 37 2 7.4 . 1 Journal of Interactive Marketing9 . . 2 . 3 2 34 2 . 3 6.0 1 2 Journal of Product and Brand
Management9 25 37 2 31 3 . 34 2 25 . 6.7 . . Journal of Services Marketing8 . 40 2 . 3 2 23 2 . 2 6.9 . . International Marketing Review8 14 27 . 21 2 . 13 . 21 . 7.1 2 . Journal of Public Policy and
Marketing8 . . 3 . 3 3 19 3 . 3 7.3 2 . Journal of Strategic Marketing8 . 35 2 39 . 3 . 3 23 3 7.1 . . Journal of The Market Research
Society7 . . 1 . 4 1 54 2 . 1 7.1 . . International Journal of Bank
Marketing7 8 12 . 12 2 . 11 . 12 . . 2 . Journal of Business Research7 . . 1 . 3 1 23 2 . 1 7.2 . . Journal of Consumer Behaviour7 27 10 . 40 3 . 21 . 27 . 7.4 . . Journal of Consumer Psychology7 28 . . 48 4 . 42 2 47 . 6.3 . . Journal of Marketing Theory and
Practice7 . . 1 49 4 . 58 3 42 . 7.0 . . Journal of Nonp and Public Sector
Marketing7 . . 1 . 3 1 27 1 . 1 8.9 . . Marketing Theory6 . . . 47 5 . 50 2 47 . 6.9 . . Journal of Business To Business
Marketing6 . . . . 4 2 42 2 . 2 6.3 . . Journal of Marketing
Communications6 15 . . 24 3 . 28 . 34 . 6.3 . . Journal of Marketing Education6 . 34 . . 2 . 13 . . . 8.4 2 2 Journal of Service Research6 . . . . 4 1 42 1 . 1 6.2 . . Marketing Intelligence and
Planning5 . . . . 3 . 28 . . . 5.8 2 2 International Journal of Market
Research5 . . 2 . 4 . 50 2 . . 5.4 . . Journal of Euromarketing5 32 . . 33 . . 45 . 37 . 6.2 . . Journal of Health Care Marketing5 19 24 . 13 . . 7 . 27 . . . . Journal of International Business
Studies5 . . 1 . 3 . 19 2 . . 6.9 . . Journal of Macromarketing5 35 19 . 16 . . . . 11 . 7.9 . . Journal of Product Innovation
Management5 . . 1 41 . . 45 1 47 . . . . Journal of Professional Service
Marketing5 . . . . 5 1 . 1 . 1 6.4 . . Journal of Relationship Marketing5 . . . . . 1 50 2 . 2 5.7 . . Journal of Targ Mea and Anal for
Mktg5 38 . . 28 4 . 45 . 23 . . . . Marketing Management4 29 . . 27 . . . . 29 . 6.7 . . AMA Proceedings4 23 33 . 20 . . . . 37 . . . . Business Horizons4 22 22 . 19 . . . . 32 . . . . California Management Review4 34 26 . 37 . . . . 30 . . . . Decision Sciences4 7 7 . 4 . . . . 6 . . . . Harvard Business Review4 . . . . 3 . 34 1 . . 5.1 . . Journal of Brand Management4 18 20 . 26 . . . . 16 . . . . Journal of Business4 . . . 30 3 . . . 29 . 7.1 . . Journal of Consumer Affairs
(continued on next page)
164 B. Yoo / Australasian Marketing Journal 17 (2009) 160–174

Table 2 (continued)
COUNTa JME97 ML02 Aston03 JM03 UQ03 Warwck03 AMJ04 BBS04 CRL04 Imperl04 VHB04 CAR05 ESS05 Journal title
4 . . . . . 1 67 1 . 1 . . . Journal of Database Marketing4 . . . . . 1 . 1 . 1 3.7 . . Journal of Financial Services
Marketing4 . . . . 5 . 54 2 . . 7.4 . . Journal of Int’l Mktg and Mktg
Research4 . 39 . . 4 . 28 . . . 5.7 . . Journal of Market Focused
Management4 . . 2 . 4 . . 1 . . 6.9 . . Journal of Marketing Channels4 11 5 . 5 . . . . 5 . . . . Management Science4 41 . . 46 . . 64 . 42 . . . . Marketing Education Review4 17 18 . 14 . . . . 17 . . . . Sloan Management Review3 . . . . 4 . . . . . 5.5 1 . Int’l J. of Rettail and Distri Mgmt3 39 . . 23 . . . . 32 . . . . Journal of Business Ethics3 40 . . 44 . . . . 47 . . . . Journal of Business Logistics3 . . . 43 . . . . 39 . 6.6 . . Journal of Consumer Policy3 . . . . 3 . 28 . . . 6.4 . . Journal of Retand Consumer
Services2 . . . . 3 . 34 . . . . . . Australasian Marketing Journal2 . . . . 5 . 58 . . . . . . Australian Journal of Market
Research2 . . 3 . . . . 3 . . . . . Int’l Journal of Electronic
Commerce2 . . . . . . . 1 . . 7.5 . . J. of Con Sat Dissat and Compl
Behavior2 . . . 32 . . . . 24 . . . . Journal of Economic Psychology2 . . . . 4 . 58 . . . . . . Journal of Int’l Consumer
Marketing2 . . . . . . 58 . . . 6.2 . . Journal of Travel and Tourism
Marketing2 . . . . 2 . . . . . . . 1 Public Opinion Quarterly
a The number of studies where the journal was ranked.
B. Yoo / Australasian Marketing Journal 17 (2009) 160–174 165
indicates the raw ranking scores and the vertical axis indicatestheir transformed scores. As each plot shows, raw scores weremonotonically transformed in a direction to maximize the fit ofthe data to the principal component model. Therefore, the Spear-man correlation between the raw and transformed ranks for eachrankings study ranged from 0.99 to 1.00. In addition, Fig. 3 showsa consistent monotonic relationship between the raw ranks andthe first principal component, which would contain new overallrankings integrating the 13 studies. The raw scores of the journalrankings had a correlation of 0.81 on average with the first princi-pal component. Note that Figs. 1 and 2 do not yet include missingranks due to dealing with raw, rather than transformed, ranks.With all missing ranks of the 79 journals estimated and imputed,Fig. 4 exhibits the monotonic relationship between the trans-formed ranks and the first principal component, whose correlationwas 0.80 on average. All three figures clearly demonstrate that theraw ranks, the transformed ranks, and the first principal compo-nent are highly correlated to one another.
3.5. Birth of overall rankings
In Table 4, the iteration history of the MGV monotonic, ties re-served transformation that finds out the estimates of the missingvalues shows that algorithm converged at the seventh iteration,meaning the variance explained for by the first principal compo-nent did not increase further. Table 4 also shows that the varianceaccounted for increased from an initial 77% to 100%, which was a23% increase. The 77% variance represents the proportion of vari-ance explained by an ordinary principal component analysis ofthe untransformed data for the first principal component. Thetransformation markedly increased the variance explained for byoptimally transforming the nonmissing and missing ranks of eachjournal. As a result, the first principal component became substan-tive enough to describe the rankings of the journals of the 13studies.
In summary, the MGV monotonic, ties reserved transformation,selected as the best method of all other alternative ones, found outthe estimates for missing rankings for each study over 79 journalsin the way to maximize the variance accounted for. Then, the prin-cipal component analysis was performed for the transformed dataover 13 studies to generate the principal component score for thefirst dimension. One component alone explained the very high por-tion of the variance, which means the single component, whichobviously should be labeled as overall rankings, was the mostdominant theme across the 13 studies. Table 5 reports the resul-tant rankings based on the score of first principal component ofeach journal.
Table 5 shows the composite ranking of the 79 journals inte-grating the 13 rankings studies. The score of the second columnin the table is the standardized principal component score. It indi-cates the relative strength of each journal, meaning the lower thescore the higher the rank. According to the table, the Journal of Mar-keting, the Journal of Marketing Research, and the Journal of Con-sumer Research make the top three journals, with a negligibledifference from one to the other. The Marketing Science is rankedfourth with a little difference from the top three but with a notice-able difference from the next-ranked journals. The Journal of theAcademy of Marketing Science, the Journal of Retailing, and the Inter-national Journal of Research in Marketing make the next solid groupa little apart from the Marketing Science. However, those top sevenjournals seem significantly higher in score than all the rest of thejournals.
3.6. Grouping the journals
Schools often group journals into a prefixed number of categorytiers for convenience, such as A, B, and C journals for a three-tierclassification. Journals in the same tier are considered generallyequivalent in quality. However, just how many journals should be-long to each tier could be arbitrary from school to school. The

Table 3Correlation of the raw and transformed ranks to the first principal component by the PRINQUAL transformation type for 13 marketing journal rankings studies.
Study Transformation types
1 2 3 4 5 6 7 8 9 10 11 12
Correlation between the raw ranks and the first principal componentJME97 0.76 0.64 0.64 0.75 0.77 0.85 0.77 0.74 0.75 0.71 0.75 0.73ML02 0.89 0.77 0.77 0.95 0.90 0.93 0.90 0.84 0.89 0.82 0.87 0.83Aston03 0.90 0.92 0.92 0.73 0.91 0.81 0.91 0.85 0.89 0.87 0.88 0.86JM03 0.82 0.71 0.71 0.86 0.84 0.86 0.84 0.78 0.82 0.79 0.81 0.79UQ03 0.85 0.75 0.75 0.75 0.87 0.85 0.87 0.83 0.86 0.82 0.84 0.83Warwck03 0.93 0.95 0.95 0.94 0.94 0.91 0.84 0.88 0.92 0.90 0.91 0.90AMJ04 0.81 0.73 0.73 0.61 0.84 0.81 0.94 0.75 0.80 0.76 0.79 0.77BBS04 0.86 0.86 0.86 0.84 0.87 0.86 0.84 0.81 0.85 0.82 0.84 0.83CRL04 0.85 0.75 0.75 0.75 0.87 0.85 0.87 0.81 0.85 0.83 0.84 0.83Imperl04 0.91 0.94 0.94 0.94 0.91 0.91 0.91 0.86 0.89 0.87 0.88 0.88VHB04 0.78 0.61 0.61 0.61 0.78 0.78 0.78 0.77 0.79 0.77 0.80 0.76CRA05 0.88 0.84 0.84 0.84 0.89 0.88 0.89 0.86 0.88 0.87 0.87 0.87ESS05 0.76 0.72 0.72 0.72 0.72 0.76 0.72 0.78 0.74 0.78 0.75 0.77
Average 0.85 0.78 0.78 0.79 0.85 0.85 0.85 0.81 0.84 0.82 0.83 0.82Maximum 0.93 0.95 0.95 0.95 0.94 0.93 0.94 0.88 0.92 0.90 0.91 0.90Minimum 0.76 0.61 0.61 0.61 0.72 0.76 0.72 0.74 0.74 0.71 0.75 0.73
Correlation between the transformed ranks and the first principal componentJME97 0.74 0.68 0.68 0.68 0.69 0.74 0.69 0.81 0.71 0.82 0.70 0.80ML02 0.84 0.45 0.45 0.45 0.90 0.84 0.90 0.87 0.90 0.81 0.94 0.87Aston03 0.90 0.81 0.81 0.81 0.90 0.90 0.90 0.89 0.92 0.78 0.91 0.93JM03 0.72 0.15 0.15 0.15 0.77 0.72 0.77 0.74 0.76 0.73 0.73 0.74UQ03 0.83 0.58 0.58 0.58 0.88 0.83 0.88 0.86 0.88 0.78 0.90 0.80Warwck03 0.83 0.88 0.88 0.88 0.84 0.83 0.84 0.82 0.84 0.81 0.83 0.82AMJ04 0.82 0.24 0.24 0.24 0.79 0.82 0.79 0.82 0.85 0.73 0.90 0.74BBS04 0.80 0.80 0.80 0.80 0.83 0.80 0.83 0.85 0.87 0.79 0.86 0.80CRL04 0.79 0.40 0.40 0.40 0.81 0.79 0.81 0.80 0.80 0.76 0.78 0.76Imperl04 0.81 0.83 0.83 0.83 0.80 0.81 0.80 0.80 0.81 0.79 0.81 0.79VHB04 0.72 0.35 0.35 0.35 0.73 0.72 0.73 0.87 0.80 0.74 0.87 0.73CRA05 0.70 0.82 0.82 0.82 0.70 0.70 0.70 0.71 0.73 0.61 0.73 0.62ESS05 0.64 0.53 0.53 0.53 0.35 0.64 0.35 0.61 0.38 0.52 0.46 0.52
Average 0.78 0.58 0.58 0.58 0.77 0.78 0.77 0.80 0.79 0.74 0.80 0.76Maximum 0.90 0.88 0.88 0.88 0.90 0.90 0.90 0.89 0.92 0.82 0.94 0.93Minimum 0.64 0.15 0.15 0.15 0.35 0.64 0.35 0.61 0.38 0.52 0.46 0.52
Transformation types: 1 = inverse trigonometric sine transformation; 2 = exponential transformation; 3 = logarithm transformation; 4 = logit transformation; 5 = transfor-mation that raises variables to specified power; 6 = transformation to ranks; 7 = linear transformation; 8 = monotonic, ties preserved transformation; 9 = monotonic B-splinetransformation; 10 = optimal scoring transformation; 11 = B-spline transformation; 12 = monotonic, ties not preserved transformation.
166 B. Yoo / Australasian Marketing Journal 17 (2009) 160–174
important question is how to group journals to maximize within-group homogeneity and between-group heterogeneity. The bestmethod for that purpose is cluster analysis. Cluster analysis wasconducted for the 79 journals in order to see how the journalscould be divided from the statistical perspective. The data usedwere the transformed ranking scores of the 13 studies. Imaginedata set with 79 rows and 13 columns. Based on the transformedranking scores, cluster analysis was performed for the 79 journalsin order to see how the journals could be divided from the statis-tical perspective. Table 6 summarizes the results of 2- to 10-clustersolutions, whose F-value ranged from 187.24 to 512.99, all ofwhich were significant at the 0.0001 level.
Two major findings are as follows. First, top tiers consist of few-er journals, whereas low tiers consist of more journals because topjournals distinguish themselves drastically from the large numberof the subsequent journals. For example, when journals are catego-rized into three tiers only, the first tier should consist of the top se-ven journals rather than one-third of the journals, the second tiershould consist of 30 journals, and the third tier, 42 journals. Thequality of the top seven journals exceeds that of all other journals.Likewise, the first tier in the five-cluster solution consists of threejournals only. Second, some journals tend to make a firm cohortacross multiple cluster solutions, although the exact grouping de-pends on the solution. For example, the Journal of Marketing, theJournal of Marketing Research, and the Journal of Consumer Researchmake ‘‘the” premier marketing journals holding together. The mid-
dle group of journals starting from the Journal of International Busi-ness Studies (ranked 15th) to the Journal of Marketing Management(37th) and the bottom one starting from the Journal of TargetingMeasurement and Analysis for Marketing (66th) to the Journalof Global Marketing (79th) make a strong cohort each acrosssolutions.
3.7. Validation of the overall rankings
To validate the usefulness of the generated new overall rankingsreported in Table 5, they were compared with other sources ofranking information. First, the comparison was made against Jour-nal Citation Reports� (JCR�) by Thomson Scientific. JCR evaluatesthe quality of a journal based on the frequency of citations ratherthan judges’ subjective evaluations. In particular, three JCR indiceswere selected for comparison: the journal impact factor, the imme-diacy index, and the cited half-life. Thomson Scientific defines eachindex as follows:
The journal impact factor is the average number of times articlesfrom the journal published in the past two years have beencited in the JCR year. The impact factor is calculated by dividingthe number of citations in the science citation index by the totalnumber of articles published in the two previous years. Animpact factor of 1.0 means that, on average, the articles pub-lished one or two year ago have been cited one time.

Fig. 2. Plots for each rankings study: raw versus transformed ranks.
B. Yoo / Australasian Marketing Journal 17 (2009) 160–174 167
The immediacy index is the average number of times an article iscited in the year it is published. The journal immediacy indexindicates how quickly articles in a journal are cited. The imme-diacy index is calculated by dividing the number of citations toarticles published in a given year by the number of articles pub-lished in that year.The cited half-life is the median age of articles cited by the jour-nal in the JCR year. For example, in JCR 2003, the journal FoodBiotechnology has a cited half-life of 9.0. That means that 50%of all articles cited by articles in Food Biotechnology in 2003were published between 1995 and 2003.
The correlation of overall journal rankings to JCR’s journal im-pact factor, immediacy index, and cited half-life were highly signif-icant: 0.58 (p < 0.001, n = 31), 0.54 (p < 0.01, n = 30), and 0.46(p < 0.01, n = 30), respectively. Note that the sample size reducedfrom 79 to 31 or 30 because JCR evaluates an only selective numberof journals. The result shows that the higher the journal’s ranking,the greater the journal impact factor the higher the immediacy in-dex and the longer the cited half-life. It clearly matches an expec-tation that an article from a high-ranked journal must be morecited, immediately used, and longer circulated.
Second, the overall rankings of this study were compared withthose of the ERA rankings. The ERA refers to the Excellence in
Research for Australia (ERA) initiative that the Australian ResearchCouncil (ARC) has ranked 19,000 unique peer-reviewed journalsinto four tiers (A*, A, B and C) on the basis of the overall quality thateach has for a particular discipline. The ERA rankings are very valu-able and relevant to Australia and New Zealand scholars and have agreat potential to influence the rest of the world thanks to theircomprehensive scope. Out of 79 journals of this study, 70 journalsappeared in the July 2008 ERA rankings. For comparisons, appro-priate numbers were assigned to the four ERA tiers: first, 1, 2, 3,and 4 in order and second, 0.5, 1, 2, and 3. The correlation of therankings of this study to those of the ERA was 0.61 and 0.60(p < 0.0001, n = 70) in each numbering way. The result demon-strates that the global consensus of rankings is consistent withthe local rankings of Australia. This consistency might have beenachieved as the ARC referenced, and tried to integrate, rankingsof other regions and credible sources.
Here is one more validation of the overall rankings. A variety ofrankings studies were included in this study to demonstrate, first,the versatility of the PRINQUAL methodology that produces overallrankings by overcoming missing values and different rankingmethods, but some readers might be concerned with heavy reli-ance on internal institutional rankings. However, one can assumereasonable convergence in rankings between institutions and jour-nal articles. In this study, some rankings studies were conducted by

Fig. 3. Plots for each rankings study: raw ranks versus first principal component.
168 B. Yoo / Australasian Marketing Journal 17 (2009) 160–174
institutions, mainly for their internal uses (Aston03, UQ03, War-wck03, BBS04, Imperl04, CRA05, and ESS05), whereas other studieswere shown in peer-reviewed academic journals (JME97, ML02,JM03, AMJ04, CRL04, and VHB04). When overall rankings werecomputed separately for each group of those two types of studies,however, the two groups showed correlation of 0.67 (p < 0.0001),which illustrates that the rankings by institutions are highly com-parable to those shown in journals. Such a high similarity might re-sult from similar scholarly standards that institutions use indetermining the rankings.
In addition, some studies ranked only marketing-focused jour-nals, whereas others ranked all journals publishing marketing re-search articles. However, in this study it was assumed that therelative rank of any particular journal does not change either in astudy of marketing-focused journals or in a study of all journals.To test this assumption, first, the 13 studies were divided intotwo groups: marketing-focused studies and all journals studies.The latter’s members were JME97, ML02, JM03, and CRL04 as theratio of marketing-focused journals was less than 75%, as reportedin Table 1, whereas the former’s members included all the remain-ing nine studies, 95% or more of whose ranked journals consistedof marketing-focused journals. Then, PRINQUAL was conductedfor each group of studies, producing two sets of new journal rank-ings. Then, correlation of the overall journal rankings between two
groups was computed, which was 0.64 (p < 0.0001) for the 79 jour-nals. This highly significant correlation supports the assumptionand resolves the question on the consistency of journal rankings,especially on those lower-ranked journals outside the top ones:so-called B or C publications (e.g., Hawes and Keillor, 2002; Polon-sky and Whitelaw, 2006). It is a great relief that the rank of jour-nals, top or not, remains consistent across rankings studies ofdifferent purposes.
4. Discussion
This study attempted to introduce PRINQUAL to marketing bydemonstrating its usefulness, particularly by solving two method-ological problems in ranking the marketing journals based on mul-tiple sources: first, estimate the missing ranks of the marketingjournals not shown in every rankings study and second, make com-posite ranks of marketing journals that integrate the 13 rankingsstudies. The PRINQUAL procedure solved the problems success-fully. Specifically, it transformed the original journal ranks and im-puted the missing ranks to account for the entire variance of thetransformed ranks by just one principal component after sixiterations. The results showed that missing ranks were estimatedwithout changing the order of the original nonmissing ranks and

Fig. 4. Plots for each rankings study: transformed ranks versus first principal component scores.
Table 4PRINQUAL MGV algorithm iteration history for monotonic, ties reserved transformation.
Iteration number Average change Maximum change Average R-square Criterion change Note
1 0.25711 2.07413 0.770202 0.02519 0.36179 0.99220 0.222003 0.00713 0.17803 0.99895 0.006754 0.00173 0.04959 0.99982 0.000865 0.00018 0.01208 1.00000 0.000186 0.00002 0.00132 1.00000 0.000007 0.00000 0.00014 1.00000 0.00000 Converged
Algorithm converged.
B. Yoo / Australasian Marketing Journal 17 (2009) 160–174 169
that the composite ranks were quite consistent with the originalnonmissing ranks across studies. There are a lot of multivariateimputation methods of missing data, but not all methods handlequalitative data or produce equally reasonable results. However,the advantage of PRINQUAL over other methods is that it can dealwith any mix of measurements (quantitative and qualitative; par-ticularly excellent for qualitative data) and that its results are reli-able and reasonable. In summary, as demonstrated in the rankingsanalysis, the contribution of PRINQUAL to marketing would be itsversatility to impute qualitative missing data and transform tooptimize the properties of the covariance matrix so that data canbe analyzed by other normal statistics.
The resulting composite ranking of the 79 marketing journalscan serve the purpose of evaluating marketing faculty researchquality for three major reasons. First, it ranks more journals thanany other rankings study because the list of journals is quite inclu-sive. Second, it is comprehensive by integrating 13 latest and di-verse rankings studies, and it is global, not limited to onegeographic region only, such as America, Europe, or Asia. Third, itis versatile. Whenever a new rankings study appears, it can readilyintegrate the new study by the PRINQUAL method to develop anew composite ranking.
The current study contributes in three ways. First, PRINQUAL isintroduced and validated as a very useful method of marketing as

Table 5New overall rankings of 79 marketing journals.
Rank Scorea Journal
1 �9.97167 Journal of Marketing2 �9.95932 Journal of Marketing Research3 �9.94450 Journal of Consumer Research4 �8.42279 Marketing Science5 �6.44169 Journal of The Academy of Marketing Science6 �5.85261 Journal of Retailing7 �5.59250 International Journal of Research in Marketing8 �3.21858 Marketing Letters9 �3.18177 Management Science10 �2.54070 Harvard Business Review11 �1.99010 Journal of Advertising Research12 �1.80071 Journal of Advertising13 �1.75568 Journal of Business Research14 �1.40888 Psychology and Marketing15 �0.92421 Journal of International Business Studies16 �0.83584 Journal of Business17 �0.80387 European Journal of Marketing18 �0.71869 Sloan Management Review19 �0.69314 Industrial Marketing Management20 �0.63349 Journal of Consumer Psychology21 �0.60441 Advances in Consumer Research22 �0.52823 Journal of Strategic Marketing23 �0.41643 Public Opinion Quarterly24 �0.28235 International Journal of Electronic Commerce25 �0.19797 Journal of International Marketing26 �0.16136 Australasian Marketing Journal27 0.07485 Journal of Product Innovation Management28 0.11236 Journal of Personal Selling and Sales Management29 0.13510 California Management Review30 0.13823 Journal of Economic Psychology31 0.14165 Journal of Public Policy and Marketing32 0.18434 Journal of Service Research33 0.26604 Journal of Consumer Affairs34 0.28414 Journal of Retailing and Consumer Services35 0.43279 Journal of Business Ethics36 0.44329 Journal of Consumer Satisfaction Dissatisfaction
and Complaining Behavior37 0.44931 Journal of Marketing Management38 0.58658 Journal of Marketing Education39 0.61954 Journal of The Market Research Society40 0.72947 Marketing Management41 0.73900 Journal of Travel and Tourism Marketing42 0.75892 AMA Proceedings43 0.91981 Journal of Brand Management44 0.96944 Decision Sciences45 0.98520 Journal of International Consumer Marketing46 0.98621 Business Horizons47 1.08217 Marketing Theory48 1.19858 Journal of Market Focused Management49 1.21928 Journal of Marketing Channels50 1.23112 Journal of International Marketing and
Marketing Research51 1.27731 International Journal of Retail and Distribution
Management52 1.29159 International Marketing Review53 1.30056 Journal of Macromarketing54 1.42408 Journal of Services Marketing55 1.42430 International Journal of Market Research56 1.44311 Australian Journal of Market Research57 1.48487 Journal of Health Care Marketing58 1.58257 Journal of Euromarketing59 1.59445 Journal of Marketing Communications60 1.60188 International Journal of Advertising61 1.61947 Journal of Consumer Policy62 1.69454 Journal of Product and Brand Management63 1.91397 Journal of Interactive Marketing64 1.93856 Journal of Consumer Marketing65 2.01934 Journal of Consumer Behaviour66 2.15346 Journal of Targeting Measurement and
Analysis for Marketing67 2.24141 Marketing Education Review68 2.41478 Journal of Nonprofit and Public Sector Marketing69 2.51601 International Journal of Bank Marketing70 2.64992 Journal of Marketing Theory and Practice71 2.66949 Journal of Professional Service Marketing
Table 5 (continued)
Rank Scorea Journal
72 2.73127 Journal of Financial Services Marketing73 2.80419 Marketing Intelligence and Planning74 2.80550 Journal of Database Marketing75 2.87474 Journal of Business and Industrial Marketing76 3.10282 Journal of Business to Business Marketing77 3.35186 Journal of Relationship Marketing78 3.45244 Journal of Business Logistics79 4.81557 Journal of Global Marketing
a The first dimension’s score by the principal component analysis on the trans-formed data over 13 studies.
170 B. Yoo / Australasian Marketing Journal 17 (2009) 160–174
demonstrated in integrating journal rankings across studies. Sec-ond, readers can logically get the idea that this new method canbe applied to any situation that needs to integrate multi-methodand multi-evaluator rankings or ratings of various marketing situ-ations such as salesperson or retail store performance, segmentmarket attractiveness, new product idea screening, and advertise-ment. Third, the study updates the rankings of marketing journals.Updated rankings are always needed as new journals come out andsome existing journals improve themselves.
On the other hand, limitations of this study should be recog-nized. First, it might be possible that this study provides a some-what misleading aggregation of studies that were done withdifferent objectives, at different points of time, and by authors withvarious institutional affiliations with different strategic researchpriorities. Submitting these data to the PRINQUAL procedure doesnot remove the qualitative limitations of the original sources. Sec-ond, the outcome rankings are global, ignoring the subfields ofmarketing. Disaggregate rankings, which examine subfields, mightbe more insightful and have more perspective than global rankingsacross subfields. Third, the study did not elaborate the seriousnessof missing data and different kinds of scales used in different rank-ings studies. A future study needs to examine what the character-istics of these problems are, how big a problem they are, and whatcontroversy may exist over the ranking of marketing journals.Fourth, how the new method, PRINQUAL, compares to existingmethods and why, beyond the technical differences, its results pro-vide deeper insight than past rankings should be investigated.Regardless of the interesting features of a new method, there is acertain burden of proof that has to be met. Fifth, the study focusedon technical solutions, but a future study needs to provide a stron-ger description of the conceptual model underlying rankings. Forexample, future research needs to investigate the impact of quali-tative features, such as ranking methods, type of raters and respon-dents, sub-field orientation, size of sub-field catered to, and type ofinstitutions. Such a meta-analysis will be useful to explain rankingvariations across the studies.
There are a few more suggestions for future research, particu-larly, on marketing journal rankings. First, the quality of a journalchanges over time, but its change would be captured slowly whenold rankings studies are all integrated with new ones. This studyused rankings studies of less than the five years except one study,but the latest ones among them might convey the current ranks ofjournals more accurately.
Second, ranking studies tend to give a higher rank to pure the-oretical and methodological journals (Lehmann, 2005). Therefore,problem-solving and narrowly defined specialized journals havelittle chance to be ranked high. This may hinder area specializa-tions and implementation orientations of researchers. As a result,academia may be separated from industries and their researchmay accordingly lose relevance and significance to practitioners.
Third, the rankings made by institutions might have dependedon not only the objective quality of journals but also the institu-tions’ strategic research priorities and their unique internal

Table 6Cluster analysis results for 79 marketing journals: 2- to 10-cluster solutions.
Rank Clusters Journal
2 3 4 5 6 7 8 9 10
1 1 1 1 1 1 1 1 1 1 J. of Marketing2 1 1 1 1 1 1 1 1 1 J. of Marketing Research3 1 1 1 1 1 1 1 1 1 J. of Consumer Research4 1 1 1 2 2 2 2 2 2 Marketing Science5 1 1 2 3 3 3 3 3 3 J. of The Academy of Marketing Science6 1 1 2 3 3 3 3 4 4 J. of Retailing7 1 1 2 3 3 3 3 4 4 Int’l J. of Research in Marketing8 1 2 3 3 4 4 4 5 5 Marketing Letters9 1 2 3 3 4 4 4 5 5 Management Science10 2 2 3 4 4 4 5 6 6 Harvard Business Review11 2 2 3 4 4 4 5 6 6 J. of Advertising Research12 2 2 3 4 4 4 5 6 6 J. of Advertising13 2 2 3 4 4 4 5 6 6 J. of Business Research14 2 2 3 4 4 4 5 6 6 Psychology and Marketing15 2 2 3 4 4 5 6 7 7 J. of Int’l Business Studies16 2 2 3 4 4 5 6 7 7 J. of Business17 2 2 3 4 4 5 6 7 7 European J. of Marketing18 2 2 3 4 4 5 6 7 7 Sloan Management Review19 2 2 3 4 4 5 6 7 7 Industrial Marketing Management20 2 2 3 4 4 5 6 7 7 J. of Consumer Psychology21 2 2 3 4 4 5 6 7 7 Advances in Consumer Research22 2 2 3 4 4 5 6 7 7 J. of Strategic Marketing23 2 2 3 4 4 5 6 7 7 Public Opinion Quarterly24 2 2 3 4 4 5 6 7 7 Int’l J. of Electronic Commerce25 2 2 3 4 4 5 6 7 7 J. of Int’l Marketing26 2 2 3 4 4 5 6 7 7 Australasian Marketing Journal27 2 2 3 4 5 5 6 7 8 J. of Product Innovation Management28 2 2 3 4 5 5 6 7 8 J. of Personal Selling and Sales Management29 2 2 3 4 5 5 6 7 8 California Management Review30 2 2 3 4 5 5 6 7 8 J. of Economic Psychology31 2 2 3 4 5 5 6 7 8 J. of Public Policy and Marketing32 2 2 3 4 5 5 6 7 8 J. of Service Research33 2 2 3 4 5 5 6 7 8 J. of Consumer Affairs34 2 2 3 4 5 5 6 7 8 J. of Retailing and Consumer Services35 2 2 3 4 5 5 6 7 8 J. of Business Ethics36 2 2 3 4 5 5 6 7 8 J. of Cons Sat. Dis. and Complaining Behavior37 2 2 3 4 5 5 6 7 8 J. of Marketing Management38 2 3 4 4 5 6 7 8 8 J. of Marketing Education39 2 3 4 4 5 6 7 8 8 J. of The Market Research Society40 2 3 4 4 5 6 7 8 8 Marketing Management41 2 3 4 5 5 6 7 8 8 J. of Travel and Tourism Marketing42 2 3 4 5 5 6 7 8 8 AMA Proceedings43 2 3 4 5 5 6 7 8 8 J. of Brand Management44 2 3 4 5 5 6 7 8 8 Decision Sciences45 2 3 4 5 5 6 7 8 8 J. of Int’l Consumer Marketing46 2 3 4 5 5 6 7 8 8 Business Horizons47 2 3 4 5 5 6 7 8 9 Marketing Theory48 2 3 4 5 5 6 7 8 9 J. of Market Focused Management49 2 3 4 5 5 6 7 8 9 J. of Marketing Channels50 2 3 4 5 5 6 7 8 9 J. of Int’l Marketing and Marketing Research51 2 3 4 5 5 6 7 8 9 Int’l J. of Retail and Distribution Management52 2 3 4 5 5 6 7 8 9 Int’l Marketing Review53 2 3 4 5 5 6 7 8 9 J. of Macromarketing54 2 3 4 5 5 6 7 8 9 J. of Services Marketing55 2 3 4 5 5 6 7 8 9 Int’l J. of Market Research56 2 3 4 5 5 6 7 8 9 Australian J. of Market Research57 2 3 4 5 5 6 7 8 9 J. of Health Care Marketing58 2 3 4 5 5 6 7 8 9 J. of Euromarketing59 2 3 4 5 5 6 7 8 9 J. of Marketing Communications60 2 3 4 5 5 6 7 8 9 Int’l J. of Advertising61 2 3 4 5 5 6 7 8 9 J. of Consumer Policy62 2 3 4 5 5 6 7 8 9 J. of Product and Brand Management63 2 3 4 5 6 6 7 8 9 J. of Interactive Marketing64 2 3 4 5 6 6 7 8 9 J. of Consumer Marketing65 2 3 4 5 6 6 7 8 9 J. of Consumer Behaviour66 2 3 4 5 6 7 8 9 9 J. of Targeting Meas. and Analy. for Marketing67 2 3 4 5 6 7 8 9 9 Marketing Education Review68 2 3 4 5 6 7 8 9 10 J. of Nonprofit and Public Sector Marketing69 2 3 4 5 6 7 8 9 10 Int’l J. of Bank Marketing70 2 3 4 5 6 7 8 9 10 J. of Marketing Theory and Practice71 2 3 4 5 6 7 8 9 10 J. of Professional Service Marketing72 2 3 4 5 6 7 8 9 10 J. of Financial Services Marketing73 2 3 4 5 6 7 8 9 10 Marketing Intelligence and Planning74 2 3 4 5 6 7 8 9 10 J. of Database Marketing
(continued on next page)
B. Yoo / Australasian Marketing Journal 17 (2009) 160–174 171
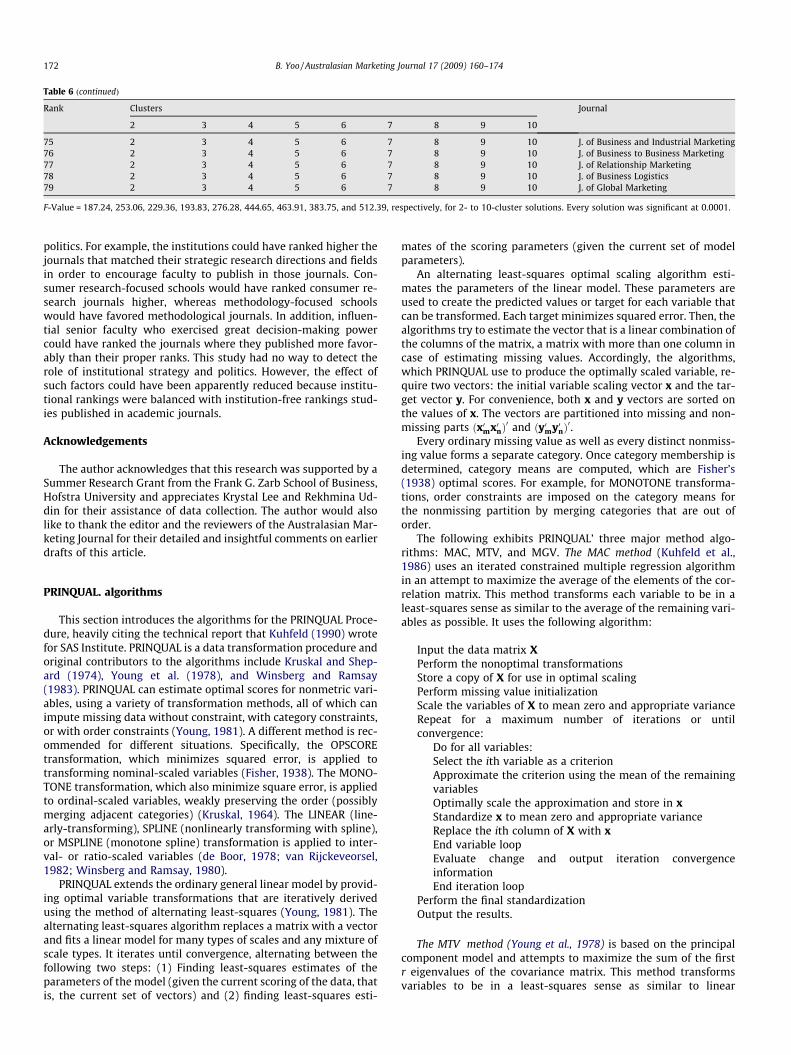
Table 6 (continued)
Rank Clusters Journal
2 3 4 5 6 7 8 9 10
75 2 3 4 5 6 7 8 9 10 J. of Business and Industrial Marketing76 2 3 4 5 6 7 8 9 10 J. of Business to Business Marketing77 2 3 4 5 6 7 8 9 10 J. of Relationship Marketing78 2 3 4 5 6 7 8 9 10 J. of Business Logistics79 2 3 4 5 6 7 8 9 10 J. of Global Marketing
F-Value = 187.24, 253.06, 229.36, 193.83, 276.28, 444.65, 463.91, 383.75, and 512.39, respectively, for 2- to 10-cluster solutions. Every solution was significant at 0.0001.
172 B. Yoo / Australasian Marketing Journal 17 (2009) 160–174
politics. For example, the institutions could have ranked higher thejournals that matched their strategic research directions and fieldsin order to encourage faculty to publish in those journals. Con-sumer research-focused schools would have ranked consumer re-search journals higher, whereas methodology-focused schoolswould have favored methodological journals. In addition, influen-tial senior faculty who exercised great decision-making powercould have ranked the journals where they published more favor-ably than their proper ranks. This study had no way to detect therole of institutional strategy and politics. However, the effect ofsuch factors could have been apparently reduced because institu-tional rankings were balanced with institution-free rankings stud-ies published in academic journals.
Acknowledgements
The author acknowledges that this research was supported by aSummer Research Grant from the Frank G. Zarb School of Business,Hofstra University and appreciates Krystal Lee and Rekhmina Ud-din for their assistance of data collection. The author would alsolike to thank the editor and the reviewers of the Australasian Mar-keting Journal for their detailed and insightful comments on earlierdrafts of this article.
PRINQUAL. algorithms
This section introduces the algorithms for the PRINQUAL Proce-dure, heavily citing the technical report that Kuhfeld (1990) wrotefor SAS Institute. PRINQUAL is a data transformation procedure andoriginal contributors to the algorithms include Kruskal and Shep-ard (1974), Young et al. (1978), and Winsberg and Ramsay(1983). PRINQUAL can estimate optimal scores for nonmetric vari-ables, using a variety of transformation methods, all of which canimpute missing data without constraint, with category constraints,or with order constraints (Young, 1981). A different method is rec-ommended for different situations. Specifically, the OPSCOREtransformation, which minimizes squared error, is applied totransforming nominal-scaled variables (Fisher, 1938). The MONO-TONE transformation, which also minimize square error, is appliedto ordinal-scaled variables, weakly preserving the order (possiblymerging adjacent categories) (Kruskal, 1964). The LINEAR (line-arly-transforming), SPLINE (nonlinearly transforming with spline),or MSPLINE (monotone spline) transformation is applied to inter-val- or ratio-scaled variables (de Boor, 1978; van Rijckeveorsel,1982; Winsberg and Ramsay, 1980).
PRINQUAL extends the ordinary general linear model by provid-ing optimal variable transformations that are iteratively derivedusing the method of alternating least-squares (Young, 1981). Thealternating least-squares algorithm replaces a matrix with a vectorand fits a linear model for many types of scales and any mixture ofscale types. It iterates until convergence, alternating between thefollowing two steps: (1) Finding least-squares estimates of theparameters of the model (given the current scoring of the data, thatis, the current set of vectors) and (2) finding least-squares esti-
mates of the scoring parameters (given the current set of modelparameters).
An alternating least-squares optimal scaling algorithm esti-mates the parameters of the linear model. These parameters areused to create the predicted values or target for each variable thatcan be transformed. Each target minimizes squared error. Then, thealgorithms try to estimate the vector that is a linear combination ofthe columns of the matrix, a matrix with more than one column incase of estimating missing values. Accordingly, the algorithms,which PRINQUAL use to produce the optimally scaled variable, re-quire two vectors: the initial variable scaling vector x and the tar-get vector y. For convenience, both x and y vectors are sorted onthe values of x. The vectors are partitioned into missing and non-missing parts ðx0mx0nÞ
0 and ðy0my0nÞ0.
Every ordinary missing value as well as every distinct nonmiss-ing value forms a separate category. Once category membership isdetermined, category means are computed, which are Fisher’s(1938) optimal scores. For example, for MONOTONE transforma-tions, order constraints are imposed on the category means forthe nonmissing partition by merging categories that are out oforder.
The following exhibits PRINQUAL’ three major method algo-rithms: MAC, MTV, and MGV. The MAC method (Kuhfeld et al.,1986) uses an iterated constrained multiple regression algorithmin an attempt to maximize the average of the elements of the cor-relation matrix. This method transforms each variable to be in aleast-squares sense as similar to the average of the remaining vari-ables as possible. It uses the following algorithm:
Input the data matrix XPerform the nonoptimal transformationsStore a copy of X for use in optimal scalingPerform missing value initializationScale the variables of X to mean zero and appropriate varianceRepeat for a maximum number of iterations or untilconvergence:
Do for all variables:Select the ith variable as a criterionApproximate the criterion using the mean of the remainingvariablesOptimally scale the approximation and store in xStandardize x to mean zero and appropriate varianceReplace the ith column of X with xEnd variable loopEvaluate change and output iteration convergenceinformationEnd iteration loop
Perform the final standardizationOutput the results.
The MTV method (Young et al., 1978) is based on the principalcomponent model and attempts to maximize the sum of the firstr eigenvalues of the covariance matrix. This method transformsvariables to be in a least-squares sense as similar to linear
B. Yoo / Australasian Marketing Journal 17 (2009) 160–174 173
combinations of the r principal component score variables as pos-sible, where r can be much smaller than the number of variables.This maximizes the total variance of the first r components (Kuh-feld et al., 1985). The method uses the following algorithm:
Input the data matrix XPerform the nonoptimal transformationsStore a copy of X for use in optimal scalingPerform missing value initializationScale the variables of X to mean zero and appropriate variancePerform any necessary initializationsRepeat for a maximum number of iterations or untilconvergence:
Compute R, the covariance matrix of XCompute W, the first r eigenvectors of RApproximate X with XWW0
Replace X with the optimally scaled variables of XWW0
Scale the variables of x to mean zero and appropriatevarianceEvaluate change and output iteration convergenceinformationEnd iteration loop
Perform the final standardizationOutput the results.
The MGV method (Kuhfeld et al., 1985) uses an iterated multipleregression algorithm in an attempt to minimize the determinant ofthe covariance matrix of the transformed variables. This methodtransforms each variable to be in a least-squares sense as similarto linear combinations of the remaining variables as possible. Thislocally minimizes the generalized variance of the transformedvariables, the determinant of the covariance matrix, the volumeof the parallelepiped defined by the transformed variables, andsphericity (Kuhfeld et al., 1985). The method uses the followingalgorithm:
Input the data matrix XPerform the nonoptimal transformationsStore a copy of X for use in optimal scalingPerform missing value initializationScale the variables of X to mean zero and appropriate variancePerform any necessary initializationsRepeat for a maximum number of iterations or untilconvergence:
Do for all variables:Select the ith variable as a criterionSelect a full rank set of predictors from all other variablesApproximate the criterion using regressionOptimally scale the approximation and store in xStandardize x to mean zero and appropriate varianceReplace the ith variable of X with xEnd variable loopEvaluate change and output iteration convergenceinformationEnd iteration loop
Perform the final standardizationOutput the results.
References
Bauerly, Ronald J., Johnson, Don T., 2005. An evaluation of journals used in doctoralmarketing programs. Journal of the Academy of Marketing Science 33(Summer), 313–329.
Baumgartner, Hans, Pieters, Rik, 2003. The structural influence of marketingjournals: a citation analysis of the discipline and its sub-areas over time. Journalof Marketing 67 (April), 123–139.
Beyers, Jan, Dierickx, Guido, 1998. The working groups of the council of theEuropean union: supranational or intergovernmental negotiations? Journal ofCommon Market Studies 36 (September), 289–317.
Dadzie, Kofi Q., Johnston, Wesley J., Yoo, Boonghee, Brashear, Thomas G., 2002.Measurement equivalence and applicability of core marketing concepts acrossNigerian, Kenyan, Japanese and US firms. Journal of Business and IndustrialMarketing 17 (September), 430–455.
de Boor, Carl, 1978. A Practical Guide to Splines. Springer Verlag, New York.de Leeuw, Jan, 2006. Nonlinear principal component analysis and related
techniques. In: Greenacre, Michael J., Blasius, Jörg (Eds.), MultipleCorrespondence Analysis and Related Methods. Chapman-Hall, Boca Raton, FL.
DuBois, Frank, Reeb, David M., 2000. Ranking the international business journals.Journal of International Business Studies 31 (4), 689–704.
Faraone, Stephen V., Seidman, Larry J., Kremen, William S., Pepple, John R., Lyons,Michael J., Tsuang, Ming T., 1995. Neuropsychological functioning among thenonpsychotic relatives of schizophrenic patients: a diagnostic efficiencyanalysis. Journal of Abnormal Psychology 104 (2), 286–304.
Fisher, Ronald A., 1938. Statistical Methods for Research Workers, 10th ed. Oliverand Boyd Press, Edinburgh.
Guidry, Julie Anna, Guidry Hollier, Brandi N., Johnson, Linda, Tanner, John R.,Veltsos, Christiane, 2004. Surveying the cites: a ranking of marketing journalsusing citation analysis. Marketing Education Review 14 (1), 45–59.
Hawes, Jon M., Keillor, Bruce, 2002. Assessing marketing journals: a mission-basedapproach. Journal of the Academy of Business Education 3 (2), 70–86.
Hawkins, Robert G., Ritter, Lawrence S., Walter, Ingo, 1973. What economists thinkof their journals. Journal of Political Economy 81, 1017–1032.
Hedderley, Duncan, Wakeling, Ian, 1995. A comparison of imputation techniques forinternal preference mapping, using Monte Carlo simulation. Food Quality andPreference 6, 281–297.
Hotelling, Harold, 1933. Analysis of complex statistical variables into principalcomponents. Journal of Educational Psychology 24, 417–441.
Hult, G. Tomas M., Neese, William T., Bashaw, R. Edward, 1997. Faculty perceptionsof marketing journals. Journal of Marketing Education 19 (1), 37–52.
Jacoby, William G., 1999. Levels of measurement and political research: anoptimistic view. American Journal of Political Science 43 (January), 271–301.
Jobber, David, Simpson, Paul, 1988. A citation analysis of selected marketingjournals. International Journal of Research in Marketing 5 (2), 137–142.
Kruskal, Joseph B., 1964. Multidimensional scaling by optimizing goodness of fit to anonmetric hypothesis. Psychometrika 38, 123–157.
Kruskal, Joseph B., Shepard, Roger N., 1974. A nonmetric variety of linear factoranalysis. Psychometrika 29, 1–27.
Kuhfeld, Warren F., 1990. SAS Technical Report R-108 Algorithms for the PRINQUALand TRANSREG Procedures. SAS Institute, Inc., Cary, NC.
Kuhfeld, Warren F., Sarle, Warren S., Young, Forrest W., 1985. Methods ofgenerating model estimates in the PRINQUAL macro. In: SAS Users GroupInternational Conference Proceedings. SAS Institute Inc., Cary, NC.
Kuhfeld, Warren F., Edds, Thomas C., Kent, Douglas P., Young, Forrest W., 1986. Newdevelopments in alternating least-square SAS procedures. In: SAS Users GroupInternational Conference Proceedings. SAS Institute Inc., Cary, NC.
Kupek, Emil, 1999. Estimation of the number of sexual partners for thenonrespondents to a large national survey. Archives of Sexual Behavior 28 (3),233–242.
Lehmann, Donald R., 2005. Journal evolution and the development of marketing.Journal of Public Policy and Marketing 24 (Spring), 137–142.
Linting, Mariëlle, Meulman, Jacqueline J., Groenen, Patrick J.F., 2007a. Nonlinearprincipal components analysis: introduction and application. PsychologicalMethods 12 (30), 336–358.
Linting, Mariëlle, Meulman, Jacqueline J., Groenen, Patrick J.F., 2007b. Stability ofnonlinear principal components analysis: an empirical study using the balancedbootstrap. Psychological Methods 12 (30), 359–379.
Malhotra, Naresh K., 1999. Guest editorial: the past, present and future of themarketing discipline. Journal of the Academy of Marketing Science 27 (2), 116–119.
Parra, Carlos, Yano, Masakazu, 2005. Testing educational system typologies usingColumbian data. International Education Journal 6 (1), 1–17.
Perreault Jr., William D., Young, Forrest W., 1980. Alternating least squares optimalscaling: analysis of nonmetric data in marketing research. Journal of MarketingResearch 17 (February), 1–13.
Polonsky, Michael J., Whitelaw, Paul, 2006. A multi-dimensional examination ofmarketing journal rankings by North American academics. Marketing EducationReview 16 (3), 59–72.
Polonsky, Michael J., Jones, Gary, Kearsley, Megan J., 1999. Accessibility: analternative method of ranking marketing journals. Journal of MarketingEducation 21 (3), 181–193.
Rogers, Sally A., 2001. Electronic journal usage at Ohio State University. College andResearch Libraries 62 (1), 25–34.
SAS Institute, Inc., 2004. The PRINQUAL procedure. In: SAS/STAT User’s Guide,Version 9.1. SAS Institute, Inc., Cary, NC. pp. 3639–3702.
SAS Institute, Inc., 2008. What is New in SAS 9.2. SAS Institute, Inc., Cary, NC.Sermeus, Walter, Delesie, Luc, Van den Heede, Koen, Diya, Luwis, Lesaffre,
Emmanuel, 2008. Measuring the intensity of nursing care: making use of thebelgian nursing minimum data set. International Journal of Nursing Studies 45,1011–1021.
Svensson, Göran, Slåtten, Terje, Tronvoll, Bård, 2007. Ethnocentricity in top journalsof services management: authors, editorial review boards, editorial boards andeditors. Managing Service Quality 17 (5), 563–578.

174 B. Yoo / Australasian Marketing Journal 17 (2009) 160–174
Theoharakis, Vasilis, Hirst, Andrew, 2002. Perceptual differences of marketingjournals: a worldwide perspective. Marketing Letters 13 (4), 389–402.
van Fleet, David D., McWilliams, Abagail, Siegel, Donald S., 2000. A theoretical andempirical analysis of journal rankings: the case of formal lists. Journal ofManagement 26 (5), 839–861.
van Rijckeveorsel, J., 1982. Canonical analysis with B-splines. In: Caussinus, H.,Ettinger, P., Tomassone, R. (Eds.), COMPUSTAT 1982, Part 1. Physica Verlag,Vienna.
Vaughan, Ian P., Ormerod, Steve J., 2005. Increasing the value of principalcomponents analysis for simplifying ecological data: a case study with riversand river birds. Journal of Applied Ecology 42 (3), 487–497.
Vonderach, Andreas, 2006. Ethnic anthropology of the former east Germany (before1945): geographical differentiations and feature correlations. The MankindQuarterly 47 (Fall/Winter), 3–39.
White, Gregory P., Jacobs, F. Robert, 1998. Perceived importance of the internet asan information channel for OM professionals. International Journal ofOperations and Production Management 18 (12), 1245–1262.
Winsberg, Suzanne., Ramsay, James O., 1980. Monotone Transformations toAdditivity Using Splines. Biometrika 67, 669–674.
Winsberg, Suzanne., Ramsay, James O., 1983. Monotone spline transformations fordimension reduction. Psychometrika 48, 575–595.
Young, Forrest W., 1981. Quantitative analysis of qualitative data. Psychometrika 46(December), 357–388.
Young, Forrest W., Takane, Yoshio, de Leeuw, Jan, 1978. The principal componentsof mixed measurement level multivariate data: an alternating least squaresmethod with optimal scaling features. Psychometrika 43 (June), 279–281.
Young, Nikki D., Drake, MaryAnne, Lopetcharat, Kannapon, McDaniel, Mina R., 2004.Preference mapping of cheddar cheese with varying maturity levels. Journal ofDairy Science 87, 11–19.
Zinkhan, George M., 2004. Accessing academic research through an E-database:issues of journal quality and knowledge use. Journal of the Academy ofMarketing Science 32 (4), 369–370.
Zinkhan, George M., Leigh, Thomas W., 1999. Knowledge use in advertising:indicators of journal quality. Journal of Advertising 28 (Summer), 51–70.