developing and applying interactive visual tools to enhance stakeholder engagement in accessibility...
TRANSCRIPT
Research in Transportation Business & Management 2 (2011) 29–41
Contents lists available at SciVerse ScienceDirect
Research in Transportation Business & Management
Developing and applying interactive visual tools to enhance stakeholder engagementin accessibility planning for mobility disadvantaged groups
Peter Jones ⁎Centre for Transport Studies, University College London, Gower Street, London WC1E 6BT, England, United Kingdom
⁎ Tel.: +44 20 7679 0478.E-mail address: [email protected].
2210-5395/$ – see front matter © 2011 Elsevier Ltd. Aldoi:10.1016/j.rtbm.2011.08.001
a b s t r a c t
a r t i c l e i n f oArticle history:Received 5 January 2011Received in revised form 1 August 2011Accepted 9 August 2011Available online 3 September 2011
Keywords:Accessibility planningStakeholder engagementDecision support toolsDisadvantaged groups
This paper presents findings from an English study that developed a range of visual tools to assist ininvestigating broader aspects of accessibility, through innovative forms of stakeholder engagement,comprising in-depth workshops with both public transport users and a wide range of professionals. Aswell as public transport operators, the latter included senior managers in the education, health and socialservice sectors, plus major private sector employers and the Regional Development Agency. A spreadsheettool was developed to assist in codifying accessibility problems and potential solutions.The study identified ways in which the uncoordinated, day-to-day decisions of the various agencies causedconsiderable accessibility problems for different user groups, and how all parties would benefit from greaterinformation exchange in the formative stages of their strategic planning processes if public transport is to playits part in meeting the mobility requirements of diverse population groups.
l rights reserved.
© 2011 Elsevier Ltd. All rights reserved.
1. Introduction
One of the primary goals of national transport policy in the UK andseveral other countries is to reduce social exclusion through providingbetter access to essential goods and services. A report by the UK cross-departmental Social Exclusion Unit (2003) provided evidence thatmany disadvantaged people experienced problems in accessing goodsand services, such as healthcare, further education, financial servicesand fresh foods, due to a wide variety of tempo-spatial related factors,especially when using public transport services.
Followingpublicationof the SEU report, responsibility for addressingthese problems in England was passed to the UK Department forTransport; this administrative arrangement has resulted in a rathernarrow focus on accessibility enhancements to the public transportsystem, at the expense of tackling other ways of improving accessibilitythat might be under the control of other agencies. Several professionalGIS-based tools have been developed to assist local authorities inmapping areas of multiple deprivation and computing travel times bypublic transport fromdeprived residential areas to desired destinations.For example, in England the Department for Transport has funded thedevelopment of the ‘Accession’ accessibility planning tool (see http://
basemap.co.uk/products/accession.aspx) and Transport for London usetheir own ‘CAPITAL’ accessibility planning software (Halden, Jones, &Wixey, 2005).
However, the consequence of relying on such narrowly focused,quantitative tools has been to reduce consideration of the many otherdimensions of accessibility, in the wider context of people's dailyactivity-travel patterns (Jones & Wixey, 2005).
The paper describes a detailed, multi-stage programme ofqualitative research that was carried out in the Barnsley Dearnearea of South Yorkshire. Its aim was to identify the accessibilityproblems and requirements of residents (particularly those withoutaccess to a car) living in some of the most socially excluded areas ofthe County, and to develop – in partnership with the residents andlocal service providers – a range of innovative and effective solutionsto the various accessibility problems that were identified. Theobjectives of this study were to devise practical solutions, customisedto local circumstances, and to develop more generic methodologiesthat could be used to address local accessibility problemsmorewidelyacross the South Yorkshire area and elsewhere in the UK.
This paper focuses on the processes used to elicit accessibilityproblems and to identify potential solutions. It describes thedevelopment of tools to assist professionals in viewing accessibilityproblems from the perspective of their client user groups, and tofacilitate dialogue among stakeholders and deliver outputs in the formof practical actions. The tools have been developed in conjunctionwith officers from South Yorkshire Passenger Transport Executive(the sub regional public transport planning authority) and Barnsley
30 P. Jones / Research in Transportation Business & Management 2 (2011) 29–41
Council (the local authority), with funding to cover local meeting andsurvey costs provided by Yorkshire Forward and One Barnsley (botheconomic development agencies).
Section 2 briefly reviews existing methods for measuring acces-sibility problems and ways in which stakeholders have been engaged.Section 3 describes the study area characteristics and Section 4 setsout the overall design of the study and outlines themain types of toolsthat were developed. Section 5 summarises the methods used in thefocus groups with local residents to elicit accessibility problems andsome possible solutions, and illustrates the kinds of findings whichresulted, while Section 6 summarises the tool that was developed foruse in the professional workshops that were held with serviceproviders, and illustrates the outputs.
A spreadsheet tool, described in Section 7, provides a way ofsummarising accessibility problems, for different population groupsand in different areas, and for identifying appropriate solutions —
drawing both on existing experience and using techniques toencourage the development of innovative solutions. Section 8considers the implications for managerial practice, with Section 9providing general conclusions and ideas for future research directions.
2. The role of public transport in ‘accessibility planning’
There has long been a recognition of the important role played bypublic transport in providing basic access to goods and services, bothin urban and rural areas (e.g. Moseley, 1979). Much of the moreanalytical work has focused on optimising bus stop location,recognising the conflict between providing frequent bus stop spacing(in order to minimisewalk access distances to services) and the desireto provide fast line haul speeds by minimising the number of stops(e.g. Murray & Wu, 2003).
Wu and Hine (2003) have sought to analyse bus service provisioninmore detail among different communities in Northern Ireland usingthe ‘PTALs’ approach, first developed for use in Inner London(Transport for London, 2010). This provides a distance-weightedsum of the frequency of public transport provision around a particularlocation, but it does not consider origin–destination patterns, nortiming, financial or local access issues. Recent studies (e.g. Soo,Ettema, & Ottens, 2009) have made progress in building in basictemporal and coupling constraints (i.e. co-location of people in spaceand time) into accessibility measures, but the literature still lacks arichness of understanding of accessibility as experienced in people'severyday lives. Gould (1969) noted that “accessibility is a slipperynotion” and the decades of academic and professional literature sincethat time have illustrated both the complexity of the concept, and thedifficulty of providing an all-encompassing measure.
In the UK, the Department for Transport has sought to promote abroader concept of accessibility planning (see Section 1), but as Prestonand Raje (2007) note, the resulting analysis is generally too aggregate,both spatially and socially, for investigating detailed issues of socialexclusion. Hodgson and Turner (2003) illustrate how the voice of thecommunity can be heard in local transport planning through thedevelopment of a community Transport Action Plan. And documentssuch as the GUIDEMAPS Guidelines (Kelly et al., 2004) have sought toprovide general advice on how to more fully engage stakeholders intransport policy and planning. But there have been few studies whichhave sought to engage disadvantaged communities in the details ofaccessibility planning in their areas, in conjunction with a range ofprofessional sector providers (e.g. education, health, social services).
One exception is the Integrated Rural Accessibility Planningmethodology (IRAP), which has been designed and applied success-fully in many developing country contexts (see Dixon-Fyle, 1998),with assistance from the International Labour Office. This seeks toengage local communities in accessibility planning exercises involv-ing a number of agencies (from roads, to health and water), but withan emphasis on the physical provision of facilities.
Based on a comprehensive review of the international accessibilityliterature, Wixey, Jones, Lucas, and Aldridge (2005) identified sevenmain types of accessibility-related social exclusion:
• Spatial: the location of where people live in relation to the placesthey need to access, or the difficulty they experience in making ajourney (e.g. the number of interchanges they need to make);
• Temporal: people who do not have access to places they need to getto at desired times, such as in the early morning or late evening oron Sundays because bus services are not available;
• Personal: people who do not have access to places because of amobility impairment, or are effectively prisoners in their own homebecause of fear for their personal safety if they venture out;
• Financial: people who are unable to access places because the cost tothem of doing so is regarded as excessive;
• Environmental: where urban social housing is located near busyroads and vulnerable people living in the area are exposed to greaterrisk from traffic pollution and accidents;
• Infrastructural: where access to places and/or quality of life isaffected by transport infrastructure; and
• Institutional: where groups or organisations exclude the interests ofcertain other groups.
Only the first of these – spatial accessibility – is fully captured inmost quantitative accessibility planning tools. This study attempts tocover a much broader spectrum of accessibility issues, usingqualitative methods designed to fully engage with the affectedcommunities themselves, as well as the relevant professional serviceproviders.
3. Characteristics of the study area
The location of the study area is shown in Fig. 1. It is an ex-coalmining area in South Yorkshire, in the north of England,comprising the three villages of Thurnscoe, Goldthorpe and Bolton-on-Dearne, with a combined population of around 20,000. It is set in arural location, roughly equidistant between the three towns ofBarnsley, Doncaster and Rotherham. There is an hourly north–southtrain service connecting the villages to the major urban centres ofSheffield and Leeds, with east–west bus services running during theday at between 30 and 60 minute intervals.
The three communities have suffered from high levels ofdeprivation since the closure of the coalmines in the 1980s, withemployment levels running at only 42% of the population, comparedwith a Yorkshire average of 60%. Over 16% of the resident populationis registered as ‘permanently sick/disabled’, reflecting in part thelegacy of the coalmining industry. The numbers of single parents arealso much higher than the regional average. Rates of petty crime andpublic disorder are high and the public realm is generally in a poorcondition. At least half of the population Super Output Areas areamong the 10% most deprived Index of Multiple Deprivation areas inEngland (see McLennan et al., 2011), and several are in the worst 3%.
4. Overall study process
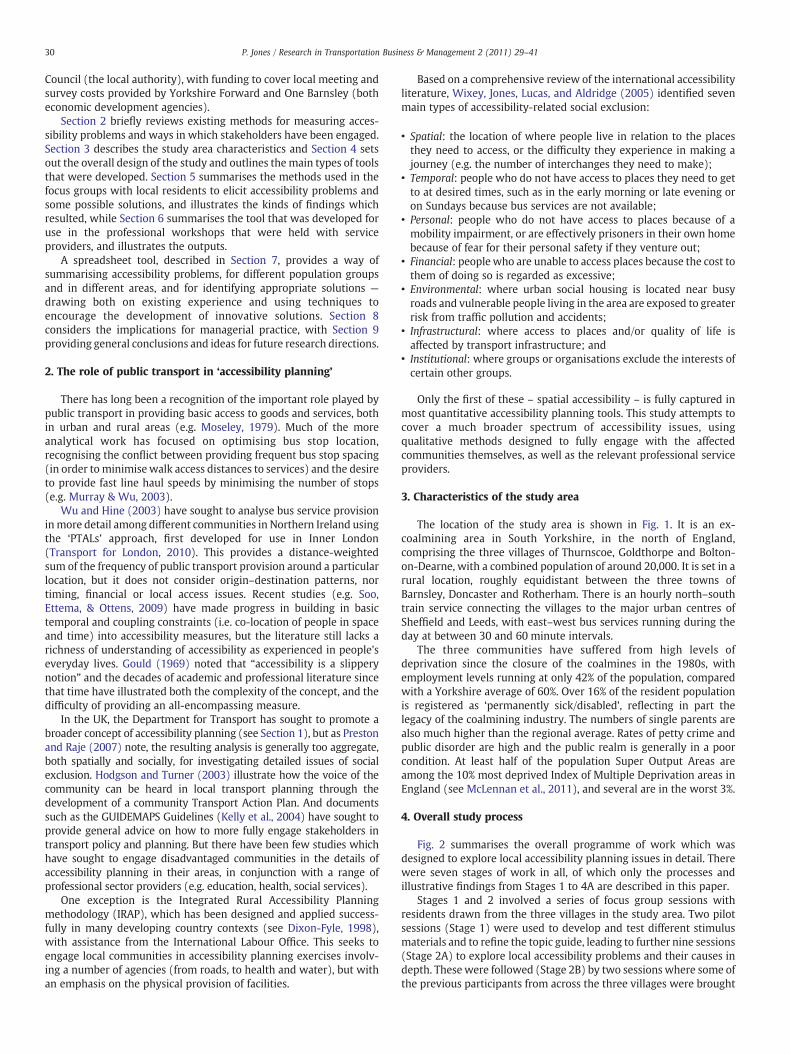
Fig. 2 summarises the overall programme of work which wasdesigned to explore local accessibility planning issues in detail. Therewere seven stages of work in all, of which only the processes andillustrative findings from Stages 1 to 4A are described in this paper.
Stages 1 and 2 involved a series of focus group sessions withresidents drawn from the three villages in the study area. Two pilotsessions (Stage 1) were used to develop and test different stimulusmaterials and to refine the topic guide, leading to further nine sessions(Stage 2A) to explore local accessibility problems and their causes indepth. These were followed (Stage 2B) by two sessions where some ofthe previous participants from across the three villages were brought
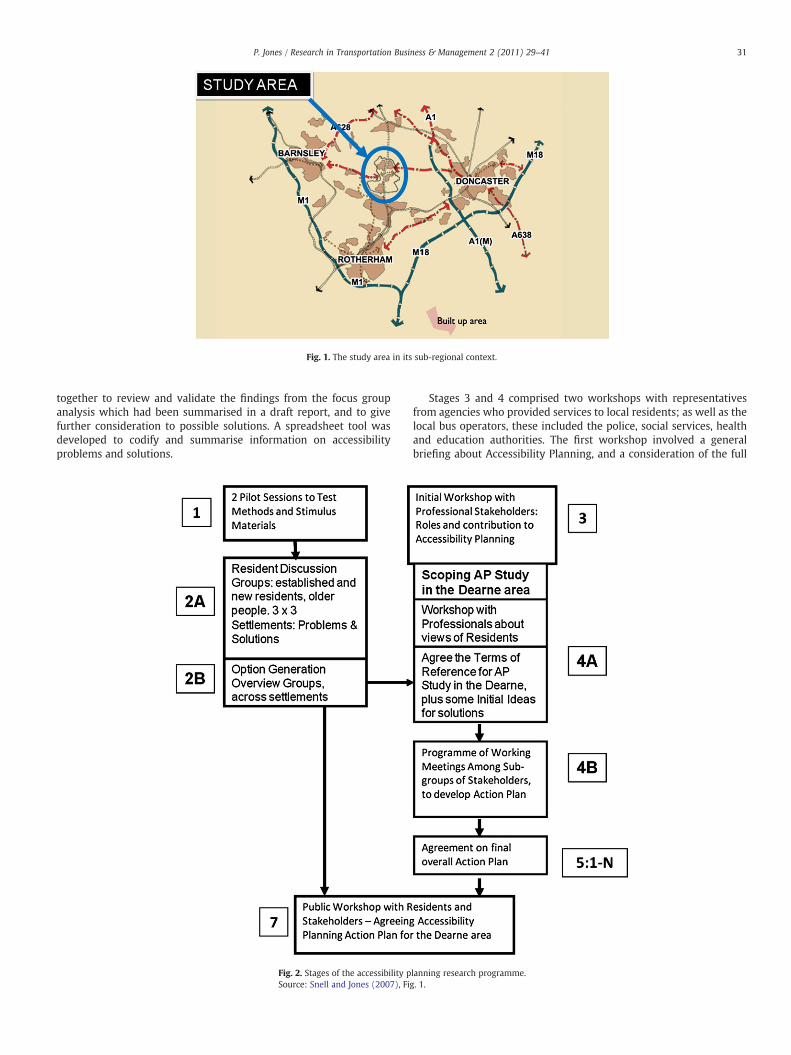
Fig. 1. The study area in its sub-regional context.
31P. Jones / Research in Transportation Business & Management 2 (2011) 29–41
together to review and validate the findings from the focus groupanalysis which had been summarised in a draft report, and to givefurther consideration to possible solutions. A spreadsheet tool wasdeveloped to codify and summarise information on accessibilityproblems and solutions.
Fig. 2. Stages of the accessibility pSource: Snell and Jones (2007), Fi
Stages 3 and 4 comprised two workshops with representativesfrom agencies who provided services to local residents; as well as thelocal bus operators, these included the police, social services, healthand education authorities. The first workshop involved a generalbriefing about Accessibility Planning, and a consideration of the full
lanning research programme.g. 1.
32 P. Jones / Research in Transportation Business & Management 2 (2011) 29–41
range of issues raised by local residents, but in a hypothetical context.The second workshop (not described in this paper) looked specificallyat service provision in the Dearne, and included a session attended bytwo representatives from the resident focus groups, where their viewswere presented to, and discussed with, the professionals.
5. Exploring accessibility issues with local residents
5.1. Focus group recruitment
Participants were selected on the basis of a number of character-istics. Previous research (Wixey et al., 2005) had indicated that thegroups most likely to be facing major accessibility problems werethose in their late teens and twenties, particularly with youngchildren, and older people who would typically be facing deteriorat-ing health conditions. In both cases, people without regular access to acar were particularly vulnerable. This made them an important focusof the work. Parts of the Dearne had also been experiencing significantgrowth in new housing, and so there was also strong interest by thelocal authority to compare the accessibility problems faced bynewcomers compared to long-term residents of the area.
The primary recruitment criteria for the different groups were age(under 30 or over 50) and whether they were a ‘newcomer’ to thevillage (i.e. had lived there less than 10 years), or had lived theremost/all their lives. Within these groupings, individual participantswere then selected on the basis of gender, having young children,access to a car, and whether or not they were in employment. Amix ofthese characteristics was sought at the recruitment stage. Betweeneight and ten participants were recruited per group, and on averagefive attended the group, although the retired groups were betterattended. Participants were professionally recruited according to aquota sample and paid a fee to attend, and any travel and child carecosts were reimbursed. Nine groups were held (following the twopilot groups), involving a total of 46 participants.
5.2. Focus group processes and stimulus materials
The focus groups lasted for around 3 hours and included a range ofexercises; they were moderated by two facilitators. Discussions weregrouped under four main topics of enquiry:
(i) Introductions and general perceptions of the local area.(ii) Patterns of access to goods and services:
a. Within the Dearneb. Further afield
(iii) Detailed analysis of accessibility problems requiring morecomplex scheduling arrangements.
(iv) Suggestions for possible solutions.
A variety of techniques was developed to help uncover the kinds ofproblems that participants experienced in accessing goods andservices, particularly by public transport, and to assist in generatingpotential solutions (see Snell & Jones, 2007). Techniques to aid inproblem identification included: schematic maps of the area, onwhich respondents could represent their typical travel patterns(activities, destinations and modes) and indicate activities that theydid not take part in; scale maps with overlays showing the location offacilities and bus routes; charts to display complex travel arrange-ments; and various prompts to encourage innovative thinking aboutpossible solutions. Some of these are illustrated in Fig. 3.
The use of schematic maps (shown top left in Fig. 3) provedparticularly successful in actively engaging the participants within thegroup and in eliciting and illustrating current travel patterns and anyaccessibility problems. A series of four ‘maps’ was prepared, coveringthe main kinds of activities which people seek to access (i.e. health,retail and financial, leisure and social, and work and education). Thelayout was the same in each case, with the three villages in the centre,
surrounded by a ring representing places within about 10 km of thevillages, and an outer segmented ring showing larger centres thatwere further afield. The amount of space provided for each locationwas based on the expected number of labels that would be placed inthat cell.
For each of the four maps, participants were given a set of stickylabels describing particular types of facility that they might wish tovisit (e.g. a post office, dentist, cinema, Further Education College).They placed these on the appropriate part of the map, and then addeda coloured dot to show the mode of transport (bus, train, taxi, cycling,walking, car driver and car passenger) which they normally used toaccess that location. Once each individual had completed the task, theresults were examined by the whole group, to see whether anygeneral patterns emerged. This demonstrated the extent to whichbehaviour was consistent or varied across the group, and provided astimulus for further discussion about any accessibility problems thatwere associated with certain activities or locations. The area at thebottom of the map was reserved for ‘Activity not undertaken’ anddrew attention to any of the activities which were not carried out byone or more participants. The reasons for this could then be probed—
were they associated with problems of lack of accessibility?In some cases, respondents reported that they had experienced
difficulties in accessing a location and/or service due to a range ofinterconnecting factors that were associated with quite complexscheduling problems. This was often related to a dependence on therequirements and performance of several public and private sectoragencies, or on assistance from their friends or relatives — either as achauffeur or for childcare.
To help elicit these interdependences, a ‘consequences’ diagramwas devised, as illustrated in Fig. 3 (bottom), in which all thesupporting actions required to accomplish a primary task (in this case,attending a social benefits assessment meeting at a job centre in thelocal market town) were mapped out. The ‘consequences’ diagramgives a good indication of the complex sets of linked actions that arerequired in some cases to accomplish a primary task, and how a failurein any one step of the chain can make it impractical to complete theprimary task. What this diagram does not bring out very clearly,however, is the importance of timing constraints that are often at theheart of the accessibility problem as experienced by an individual.This was therefore supplemented with a ‘scheduling’ diagram, tocapture this information, which was subsequently incorporated into asimple spreadsheet model (see Section 7).
5.3. Kinds of accessibility problems identified
The focus groups identified a wide variety of accessibility-relatedproblems, particularly affecting older people and (single) motherswith young children without access to a car. In broad terms, theserelated to:
• Physical restrictions affecting respondents (e.g. difficulties walkingto bus stops and railway stations and accessing public transport, forthose with buggies, or for older people with restricted mobility);
• Psychological restrictions (particularly relating to fear of trafficaccidents, and of personal injury from groups of young peoplehanging around on the streets);
• Lack of information about public transport and other agencyservices (e.g. concerning timetables, fares, financial or voluntarysupport on offer, etc.);
• Restricted availability of public transport services (at certain timesand places);
• Scheduling problems arising from a general lack of coordinationbetween agencies in their delivery of services, coupled withpersonal and childcare constraints; and
• The high cost of bus and taxi fares.
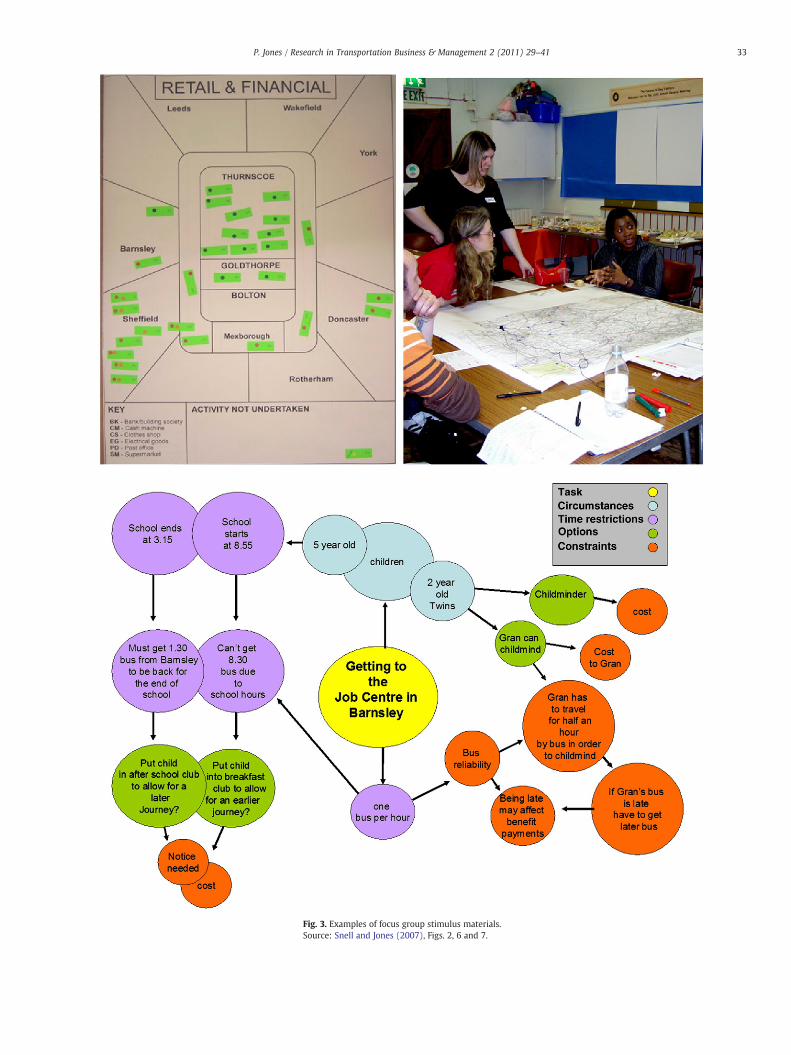
Fig. 3. Examples of focus group stimulus materials.Source: Snell and Jones (2007), Figs. 2, 6 and 7.
33P. Jones / Research in Transportation Business & Management 2 (2011) 29–41
34 P. Jones / Research in Transportation Business & Management 2 (2011) 29–41
It was reported that some employers would not employ staff ifthey did not have access to a car, because of the historical unreliabilityof public transport services. More generally, people reported beingseriously limited in their choices of employment site and FurtherEducation Colleges due to the restricted coverage of public transportservices from the Dearne. People also reported difficulties accessinghealth care by public transport (e.g. maternity care, or specialist aftercare services).
A recurring problem not previously given much attention in theaccessibility literature was a general lack of coordination, or gaps incoverage, between the activities of different service delivery agencies.This usually involved poor links between a transport and non-transport service provider, and applied particularly when things didnot go according to plan.
For example, if towards the end of the day a patient had to wait tobe seen in the hospital well beyond their appointment time, becauseof staff shortages, then the hospital car they had booked may not beable to take them home afterwards, or the bus service from the localhospital may have stopped running. On some occasions, vandalism orflooding had caused the bus company to cut or divert services to thethree villages at short notice, without any arrangements in place toensure that passengers were able to complete their journeys homesafely. Particularly at night, respondents were wary of using publictransport services in case of such service cancellations.
The unreliability of public transport services was reported to havehad serious financial consequences for some respondents. More thanone respondent reported having been dismissed from a workplacelocated in a semi-rural area after arriving late at work on severaloccasions. Three parents reported that their teenage children had losttheir Educational Maintenance Allowance payments when arriving lateat a Further Education College, due to delayed or cancelled bus services(the eligibility criteria being attendance at given times), and one singlemother reported being threatened with the loss of benefit paymentsafter turning up late for two regular appointments at her employmentcentre due to the bus not having enough room to take her young child'spushchair (see the ‘consequences’ diagram in Fig. 3). These types ofsituation were regarded by all respondents as being very unfair, as theywere beyond the control of the individuals concerned, but theywere theones being penalised for failures somewhere in ‘the system’.
5.4. Suggested solutions
Awide range of solutionswas proposed by respondents, including:the relocation and retiming of patterns of service delivery (e.g.provision of medical services); measures to make neighbourhoodssafer (both in terms of reducing traffic accidents and enhancingpersonal security); improved childcare facilities at key activity sites;improved information provision (both transport and non-transport);better waiting facilities at public transport interchanges; improve-ments to bus/rail services; and, driver/supervisor training to provideappropriate customer care when things go wrong.
6. The workshops with professionals
Two professional workshopswere held with a wide range of seniorrepresentatives of service organisations, including health, education,social services, employment, public transport, and the police; thesecovered Stages 3 and 4A in Fig. 2. The first workshop was opened bythe local Member of Parliament, and was attended by 25 pro-fessionals, as well as researchers and several facilitators.
It was designed to introduce attendees to the concept ofaccessibility planning and, in particular to:
• Explore with them their awareness of the needs of their clientgroups, and how disadvantaged groups, in particular, access – or failto access – their services;
• Gain a better understanding of their service delivery strategies;• Invite them to consider how the decisions that they make aboutservice delivery changes are likely to impact – for better or worse –
on the more disadvantaged sub-set of their clients;• Consider how other sectors are impacted by decisions that are takenin the interests of their own sector, in isolation; and
• Contribute to a process of generating innovative solutions that meetclient needs and minimise negative external impacts, in the light ofthe above considerations.
The programme for the day was divided into five parts:
(i) Introduction to the event.(ii) Sector perspectives on accessibility issues.(iii) Current and anticipated sector provision strategies.(iv) Response to specific client accessibility problems.(v) Overview of the day and next steps.
After careful consideration, it was decided to run parts (iii) and(iv) of the workshop as a hypothetical exercise, for the followingreasons:
a) To avoid possible sensitivities among participants in admitting toservice delivery failures in their own area, for which they hadexecutive responsibility.
b) To avoid problems arising from participants having very differentdegrees of knowledge about service delivery patterns in theDearne; and
c) To avoid too strong a focus on local constraints on delivery whenoptions were being considered.
This worked well in avoiding feelings of blame and in encouraginga more open discussion. It also led to a greater willingness to admit toproblems and to look for multi-sector solutions which maximised endclient benefit.
6.1. Sector perspectives on accessibility issues
Following introductions and a briefing about Accessibility Plan-ning, Part (ii) of the workshop explored the various dimensions ofaccess to facilities from the perspectives of the different sectorsrepresented. Specifically, participants were divided into groups andasked to review:
• Services provided;• Sector priorities;• Delivery patterns;• Major problems;• Significance of accessibility as an issue.
In the subsequent plenary feedback discussion, the following keybarriers to delivering coordinated accessibility planning wereidentified:
1. Deregulated public transport system (restricted commercialnetworks, public transport costs high relative to car travel).
2. Limited public transport access to local jobs (both in terms of rangeof destinations and times of day).
3. Safety issues, for pedestrians and public transport users inparticular.
4. Uncoordinated planning across sectors.5. Silo-working, inhibiting dialogue and joint cross-sector action.6. Too target driven, resulting in a narrow assessment of perfor-
mance, and no interest in external impacts of the decisions taken.
6.2. Sector provision and client accessibility problems
For Parts (iii) and (iv) of the day, participants were divided intothree groups and asked to imagine that they had just started a senior
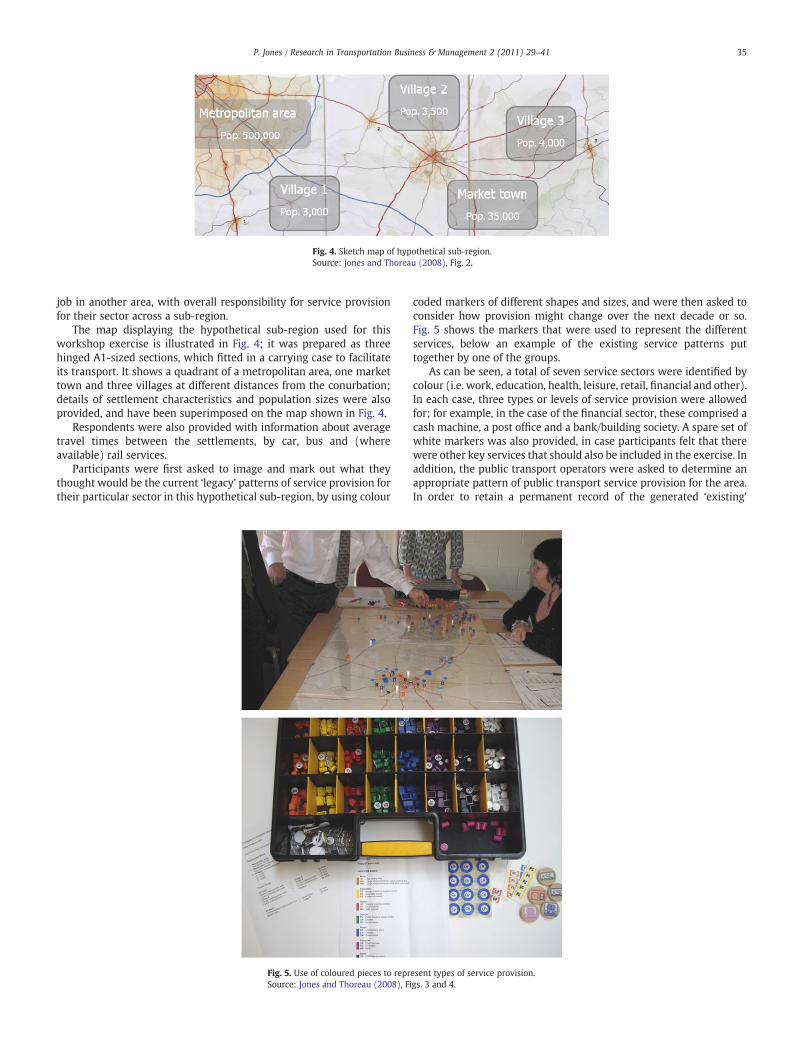
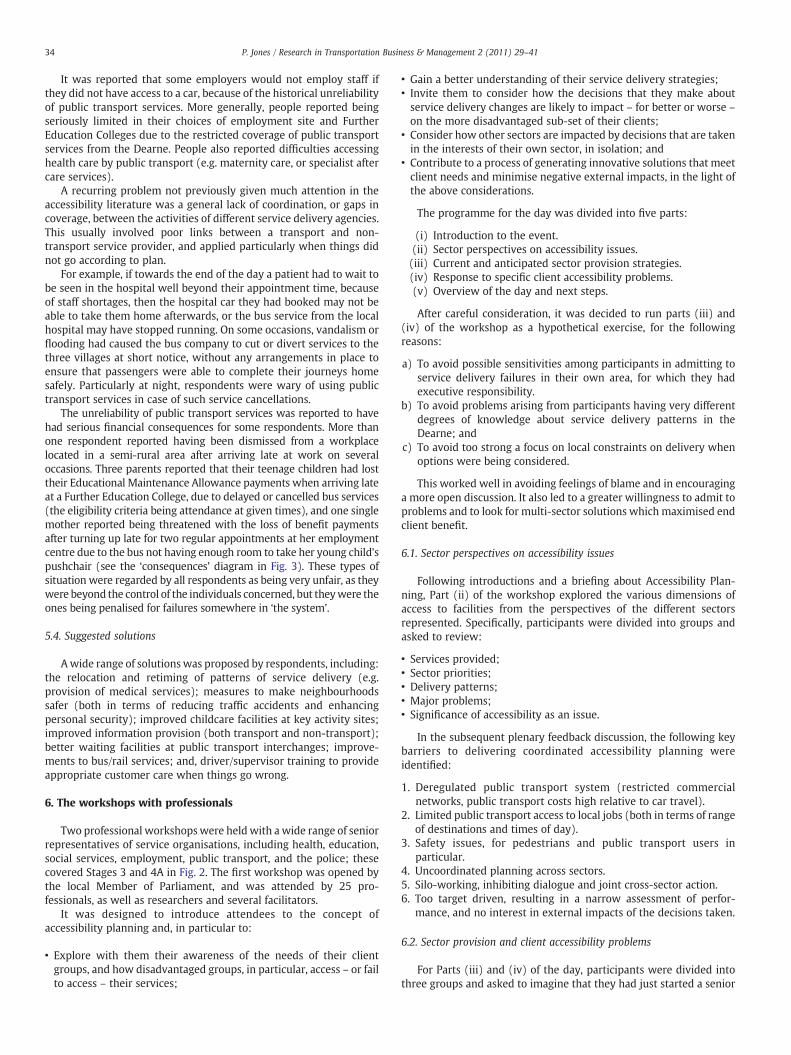
Fig. 4. Sketch map of hypothetical sub-region.Source: Jones and Thoreau (2008), Fig. 2.
35P. Jones / Research in Transportation Business & Management 2 (2011) 29–41
job in another area, with overall responsibility for service provisionfor their sector across a sub-region.
The map displaying the hypothetical sub-region used for thisworkshop exercise is illustrated in Fig. 4; it was prepared as threehinged A1-sized sections, which fitted in a carrying case to facilitateits transport. It shows a quadrant of a metropolitan area, one markettown and three villages at different distances from the conurbation;details of settlement characteristics and population sizes were alsoprovided, and have been superimposed on the map shown in Fig. 4.
Respondents were also provided with information about averagetravel times between the settlements, by car, bus and (whereavailable) rail services.
Participants were first asked to image and mark out what theythought would be the current ‘legacy’ patterns of service provision fortheir particular sector in this hypothetical sub-region, by using colour
Fig. 5. Use of coloured pieces to reprSource: Jones and Thoreau (2008), Fi
coded markers of different shapes and sizes, and were then asked toconsider how provision might change over the next decade or so.Fig. 5 shows the markers that were used to represent the differentservices, below an example of the existing service patterns puttogether by one of the groups.
As can be seen, a total of seven service sectors were identified bycolour (i.e. work, education, health, leisure, retail, financial and other).In each case, three types or levels of service provision were allowedfor; for example, in the case of the financial sector, these comprised acash machine, a post office and a bank/building society. A spare set ofwhite markers was also provided, in case participants felt that therewere other key services that should also be included in the exercise. Inaddition, the public transport operators were asked to determine anappropriate pattern of public transport service provision for the area.In order to retain a permanent record of the generated ‘existing’
esent types of service provision.gs. 3 and 4.
36 P. Jones / Research in Transportation Business & Management 2 (2011) 29–41
service patterns, the 3-D markers were replaced during a break in theworkshop by the facilitators, with appropriately sized colour stickersfixed to a transparent overlay that had been placed over the map.
The groupswere then asked to think aboutwhat changes in serviceprovision they expected to occur over the next decade, in response tocurrent or anticipated changes in government policies, marketpressures or technological advances (e.g. greater use of the internet).In general, participants from all sectors anticipated a reduction in thenumber of service provision sites, with an emphasis on the closure ofrural facilities (e.g. village post offices) and the concentration ofservices in market towns.
6.3. Developing solutions to accessibility problems
In the next stage of the exercise (i.e. Part (iv) of the firstworkshop), the participants in each group were presented with adifferent set of scenarios describing accessibility problems experi-enced by various types of residents in each of the three villages, andthey were asked to consider how they might be resolved. These wereadapted from problems raised in the residents' focus groups andincluded complex scheduling problems (e.g. juggling childcare, a part-time job and a health appointment), and difficulties caused by delaysin being seen at service appointments, or resulting from unreliabilityin public transport services.
In this way, the real-life accessibility problems of local villagerswere considered openly in this first workshop in a non-threatening,hypothetical context. As a result, a number of specific solutions wereproposed, that could be generalised and applied to the actualproblems found in the Dearne — or elsewhere. Table 1 shows one ofthe scenarios that was presented to the groups, and the kinds of multi-agency solutions that they developed (for other examples, see Jones &Thoreau, 2008).
6.4. Wrap-up session
The final plenary session began with representatives of the threegroups presenting their scenarios and potential solutions, withcomments invited from participants in the groups which had notconsidered that scenario.
The participants then discussed how the issues and hypotheticalproblems raised during the day related to the actual conditions foundin the Dearne area. It was agreed that most of the solutions given tothese hypothetical problems could in principle be applied to similarproblems in the Dearne. But, in some cases, it was noted that thestrong emphasis by national government on sector targets (e.g. in
Table 1Example scenario used in the first professional workshop.Source: Jones and Thoreau (2008), Table 4A.
Problem: A college student from Village 2 relies on the bus service to get to an FECollege in themetropolitan area; there is an hourly direct service, which should deliverthe student just in time for his first class. However, the bus is often delayed bycongestion and sometimes cancelled, as a result of which he can arrive up to an hourlate. He then loses his weekly EMA allowance, since tutors will not sign in students thatarrive late. The previous bus gets him to college 50 min early, but it is not open at thistime, and it means hanging around on the street, which his parents are unhappy about.Possible solutions:⇒ Give student permission to arrive late or make provision for early arrival⇒ Check the regularity of the problem; discuss retiming scheduled service with buscompany
⇒ College provides a shuttle service to the local villages⇒ Car sharing scheme promoted⇒ ‘Wheels to college’ scheme to enable students to purchase motor scooters⇒ Bus drivers issue a ‘late ticket’ — giving proof that vehicle was delayed orcancelled
⇒ Relocate tertiary education facilities to more local secondary schools⇒ Offer distance learning, through a local advanced learning centre
education and health) meant that senior managers would not bewilling to implement some of these solutions in practice: although itwas recognised that they would be for the greater benefit of thecommunity, they may divert resources from meeting specific targetsthat determined their future funding levels.
It was generally acknowledged that, in the past, consideration oftransport issues has been viewed in isolation from other sector serviceprovision, resulting in the kinds of adverse consequences highlightedduring the day. Overall, participants found that the events of thedayhadprovided a useful way of gaining insight into each sector's objectives,priorities and constraints, and thekinds of problems that the current siloplanning arrangements can cause for the more disadvantaged clientgroups.
7. Accessibility planning spreadsheet tool
Following completion of the main residents' focus groups, and thefirst of the professional workshops, it was decided that it would beuseful to develop a simple spreadsheet tool, with two primarypurposes:
(i) To codify the various kinds of accessibility problems experi-enced by different population groups, with an emphasis ontemporal constraints, and synthesise the knowledge gainedfrom the qualitative research; and
(ii) To outline potential solutions to the accessibility problems thathad been identified, plus provide a means of generating furtherideas.
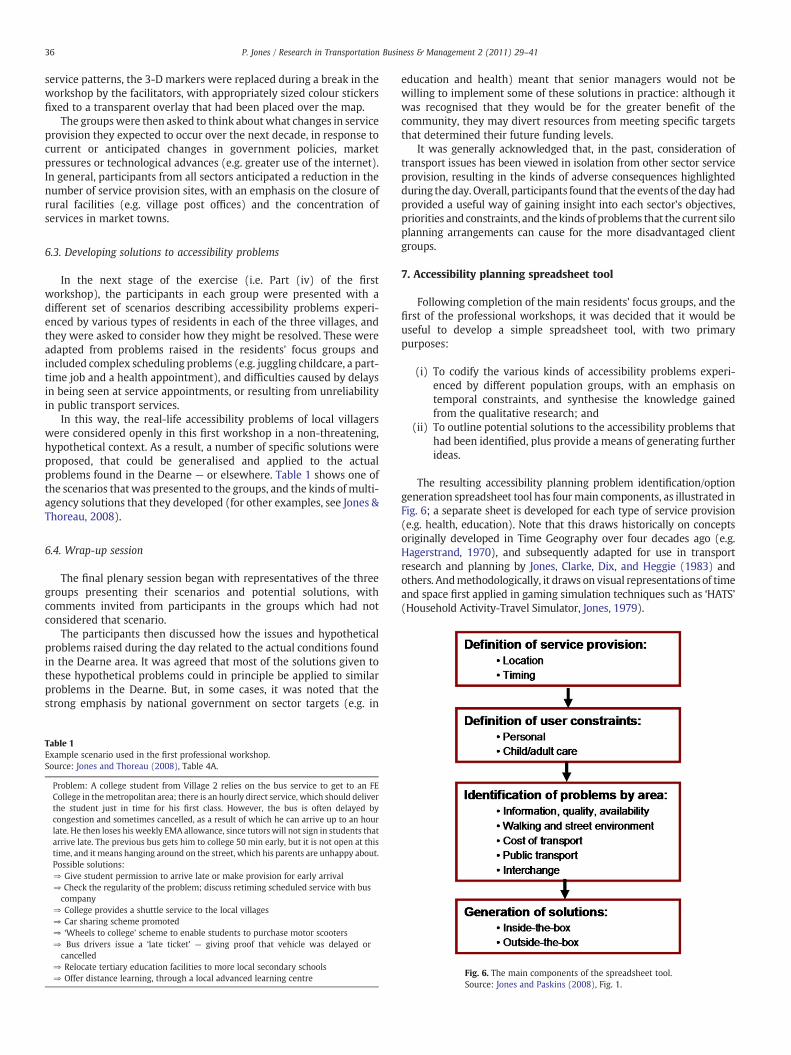
The resulting accessibility planning problem identification/optiongeneration spreadsheet tool has fourmain components, as illustrated inFig. 6; a separate sheet is developed for each type of service provision(e.g. health, education). Note that this draws historically on conceptsoriginally developed in Time Geography over four decades ago (e.g.Hagerstrand, 1970), and subsequently adapted for use in transportresearch and planning by Jones, Clarke, Dix, and Heggie (1983) andothers. Andmethodologically, it draws on visual representations of timeand space first applied in gaming simulation techniques such as ‘HATS’(Household Activity-Travel Simulator, Jones, 1979).
Fig. 6. The main components of the spreadsheet tool.Source: Jones and Paskins (2008), Fig. 1.
37P. Jones / Research in Transportation Business & Management 2 (2011) 29–41
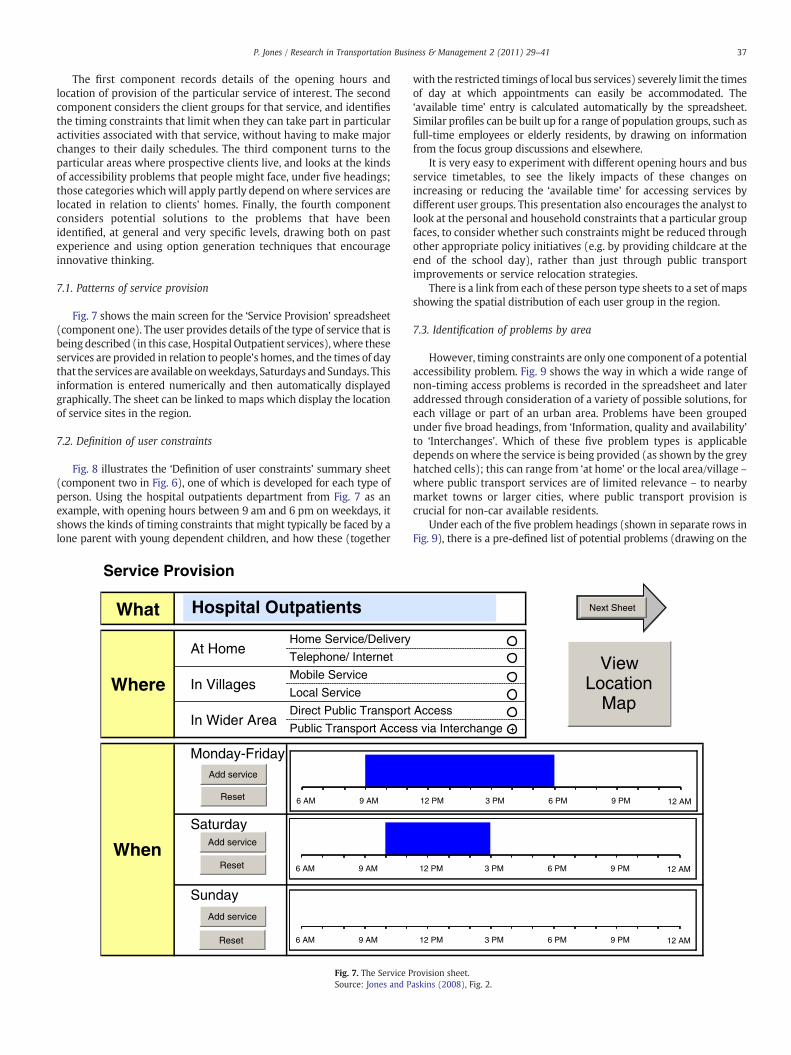
The first component records details of the opening hours andlocation of provision of the particular service of interest. The secondcomponent considers the client groups for that service, and identifiesthe timing constraints that limit when they can take part in particularactivities associated with that service, without having to make majorchanges to their daily schedules. The third component turns to theparticular areas where prospective clients live, and looks at the kindsof accessibility problems that people might face, under five headings;those categories whichwill apply partly depend onwhere services arelocated in relation to clients' homes. Finally, the fourth componentconsiders potential solutions to the problems that have beenidentified, at general and very specific levels, drawing both on pastexperience and using option generation techniques that encourageinnovative thinking.
7.1. Patterns of service provision
Fig. 7 shows the main screen for the ‘Service Provision’ spreadsheet(component one). The user provides details of the type of service that isbeing described (in this case, Hospital Outpatient services), where theseservices are provided in relation to people's homes, and the times of daythat the services are available onweekdays, Saturdays and Sundays. Thisinformation is entered numerically and then automatically displayedgraphically. The sheet can be linked to maps which display the locationof service sites in the region.
7.2. Definition of user constraints
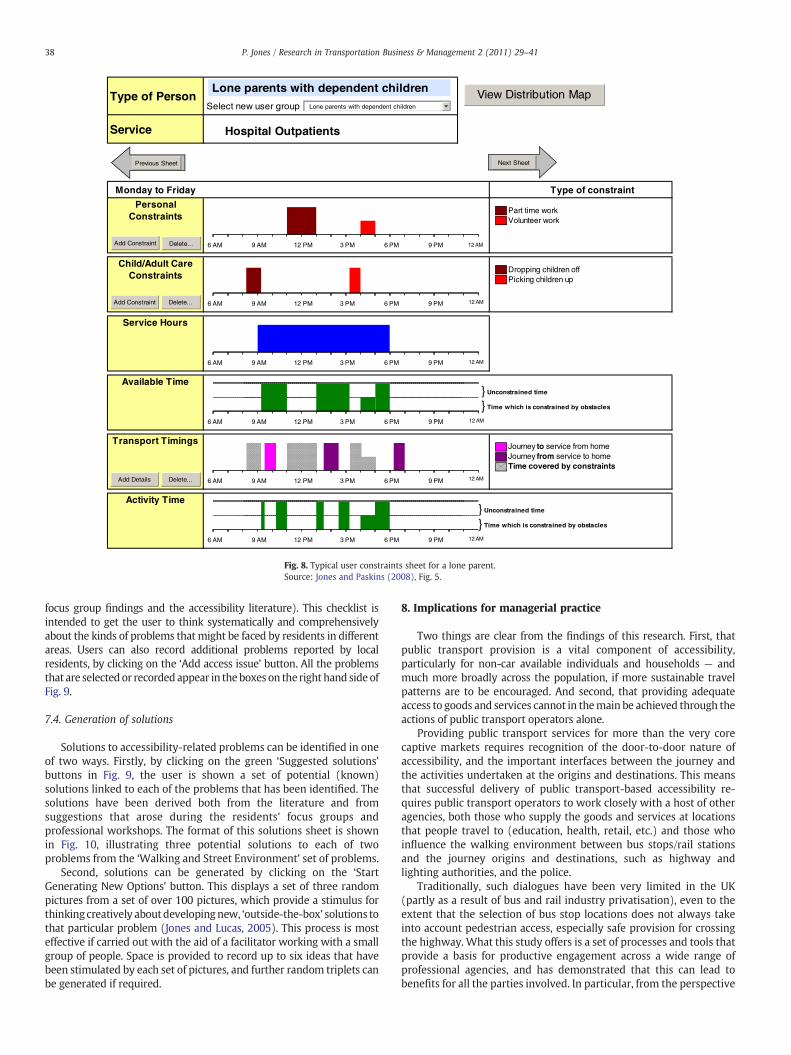
Fig. 8 illustrates the ‘Definition of user constraints’ summary sheet(component two in Fig. 6), one of which is developed for each type ofperson. Using the hospital outpatients department from Fig. 7 as anexample, with opening hours between 9 am and 6 pm on weekdays, itshows the kinds of timing constraints that might typically be faced by alone parent with young dependent children, and how these (together
Service Provision
What
Home Service/Delivery
Telephone/ Internet
Mobile Service
Local Service
Direct Public Transport
Public Transport Acces
At Home
In Villages
In Wider Area
Where
Saturday
Sunday
When
Monday-Friday
6 AM 9 AM
6 AM 9 AM
6 AM 9 AM
Add service
Reset
Add service
Reset
Add service
Reset
Hospital Outpatients
Fig. 7. The Service PSource: Jones and P
with the restricted timings of local bus services) severely limit the timesof day at which appointments can easily be accommodated. The‘available time’ entry is calculated automatically by the spreadsheet.Similar profiles can be built up for a range of population groups, such asfull-time employees or elderly residents, by drawing on informationfrom the focus group discussions and elsewhere.
It is very easy to experiment with different opening hours and busservice timetables, to see the likely impacts of these changes onincreasing or reducing the ‘available time’ for accessing services bydifferent user groups. This presentation also encourages the analyst tolook at the personal and household constraints that a particular groupfaces, to consider whether such constraints might be reduced throughother appropriate policy initiatives (e.g. by providing childcare at theend of the school day), rather than just through public transportimprovements or service relocation strategies.
There is a link from each of these person type sheets to a set of mapsshowing the spatial distribution of each user group in the region.
7.3. Identification of problems by area
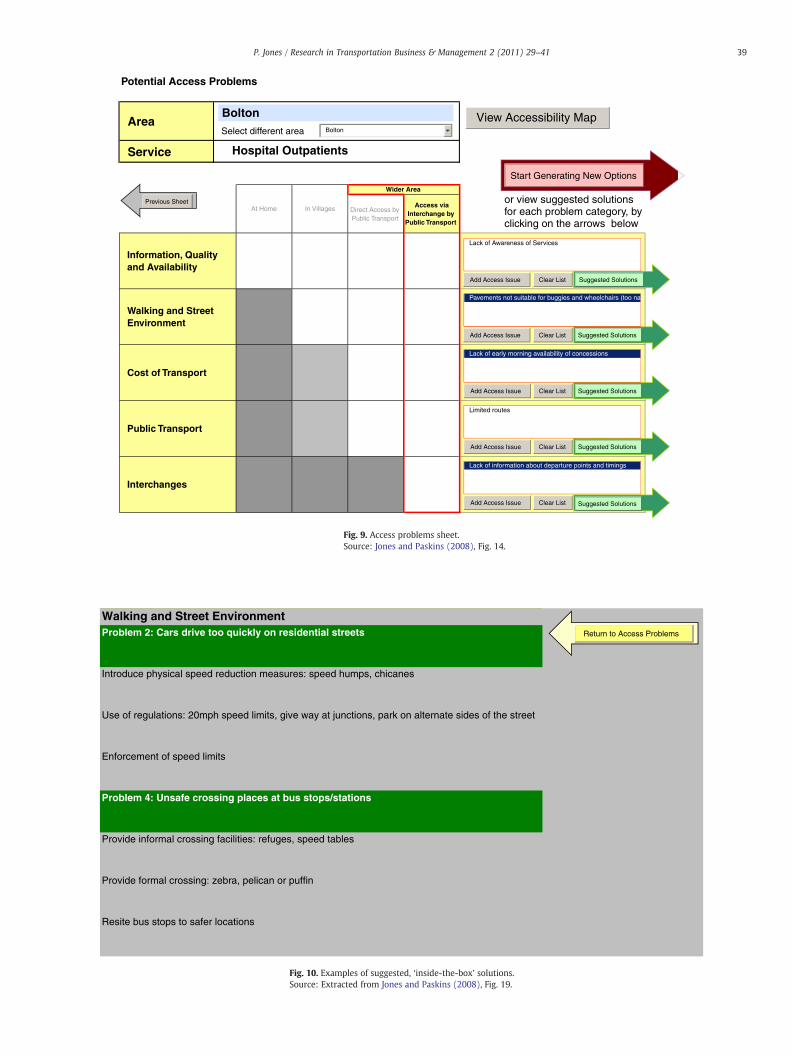
However, timing constraints are only one component of a potentialaccessibility problem. Fig. 9 shows the way in which a wide range ofnon-timing access problems is recorded in the spreadsheet and lateraddressed through consideration of a variety of possible solutions, foreach village or part of an urban area. Problems have been groupedunder five broad headings, from ‘Information, quality and availability’to ‘Interchanges’. Which of these five problem types is applicabledepends onwhere the service is being provided (as shown by the greyhatched cells); this can range from ‘at home’ or the local area/village –where public transport services are of limited relevance – to nearbymarket towns or larger cities, where public transport provision iscrucial for non-car available residents.
Under each of the five problem headings (shown in separate rows inFig. 9), there is a pre-defined list of potential problems (drawing on the
Access
s via Interchange
12 PM 3 PM 6 PM 9 PM 12 AM
12 PM 3 PM 6 PM 9 PM 12 AM
12 PM 3 PM 6 PM 9 PM 12 AM
Next Sheet
View Location
Map
rovision sheet.askins (2008), Fig. 2.
Type of Person
Service
Monday to Friday
1 Part time work1 Volunteer work
1 Dropping children off1 Picking children up
1 Journey to service from home1 Journey from service to homeTime covered by constraints
Type of constraint
Available Time
Transport Timings
Activity Time
Service Hours
Child/Adult Care Constraints
Personal Constraints
6 AM 9 AM 12 PM 3 PM 6 PM 9 PM 12 AM
6 AM 9 AM 12 PM 3 PM 6 PM 9 PM 12 AM
6 AM 9 AM 12 PM 3 PM 6 PM 9 PM 12 AM
6 AM 9 AM 12 PM 3 PM 6 PM 9 PM 12 AM
6 AM 9 AM 12 PM 3 PM 6 PM 9 PM 12 AM
6 AM 9 AM 12 PM 3 PM 6 PM 9 PM 12 AM
Add Constraint Delete...
Delete...
Delete...
Add Constraint
Add Details
Next SheetPrevious Sheet
Hospital Outpatients
} Unconstrained time
} Time which is constrained by obstacles
} Unconstrained time
} Time which is constrained by obstacles
Lone parents with dependent children
View Distribution MapSelect new user group
Lone parents with dependent children
Fig. 8. Typical user constraints sheet for a lone parent.Source: Jones and Paskins (2008), Fig. 5.
38 P. Jones / Research in Transportation Business & Management 2 (2011) 29–41
focus group findings and the accessibility literature). This checklist isintended to get the user to think systematically and comprehensivelyabout the kinds of problems that might be faced by residents in differentareas. Users can also record additional problems reported by localresidents, by clicking on the ‘Add access issue’ button. All the problemsthat are selectedor recorded appear in theboxes on the right hand side ofFig. 9.
7.4. Generation of solutions
Solutions to accessibility-related problems can be identified in oneof two ways. Firstly, by clicking on the green ‘Suggested solutions’buttons in Fig. 9, the user is shown a set of potential (known)solutions linked to each of the problems that has been identified. Thesolutions have been derived both from the literature and fromsuggestions that arose during the residents' focus groups andprofessional workshops. The format of this solutions sheet is shownin Fig. 10, illustrating three potential solutions to each of twoproblems from the ‘Walking and Street Environment’ set of problems.
Second, solutions can be generated by clicking on the ‘StartGenerating New Options’ button. This displays a set of three randompictures from a set of over 100 pictures, which provide a stimulus forthinking creatively aboutdevelopingnew, ‘outside-the-box’ solutions tothat particular problem (Jones and Lucas, 2005). This process is mosteffective if carried out with the aid of a facilitator working with a smallgroup of people. Space is provided to record up to six ideas that havebeen stimulated by each set of pictures, and further random triplets canbe generated if required.
8. Implications for managerial practice
Two things are clear from the findings of this research. First, thatpublic transport provision is a vital component of accessibility,particularly for non-car available individuals and households — andmuch more broadly across the population, if more sustainable travelpatterns are to be encouraged. And second, that providing adequateaccess to goods and services cannot in themain be achieved through theactions of public transport operators alone.
Providing public transport services for more than the very corecaptive markets requires recognition of the door-to-door nature ofaccessibility, and the important interfaces between the journey andthe activities undertaken at the origins and destinations. This meansthat successful delivery of public transport-based accessibility re-quires public transport operators to work closely with a host of otheragencies, both those who supply the goods and services at locationsthat people travel to (education, health, retail, etc.) and those whoinfluence the walking environment between bus stops/rail stationsand the journey origins and destinations, such as highway andlighting authorities, and the police.
Traditionally, such dialogues have been very limited in the UK(partly as a result of bus and rail industry privatisation), even to theextent that the selection of bus stop locations does not always takeinto account pedestrian access, especially safe provision for crossingthe highway. What this study offers is a set of processes and tools thatprovide a basis for productive engagement across a wide range ofprofessional agencies, and has demonstrated that this can lead tobenefits for all the parties involved. In particular, from the perspective
Potential Access Problems
Area
Service
Direct Access by Public Transport
Access via Interchange by
Public Transport
Wider Area
Information, Quality and Availability
Walking and Street Environment
Cost of Transport
Public Transport
Interchanges
At Home In Villagesor view suggested solutions for each problem category, by clicking on the arrows below
Add Access Issue
Add Access Issue
Add Access Issue
Lack of Awareness of Services
Limited routes
Clear List
Clear List
Clear List
Clear List
Clear List
Previous Sheet
Suggested Solutions
Suggested Solutions
Suggested Solutions
Suggested Solutions
Suggested Solutions
Start Generating New Options
Add Access Issue
Add Access Issue
Hospital Outpatients
View Accessibility MapBoltonSelect different area
Pavements not suitable for buggies and wheelchairs (too na
Lack of early morning availability of concessions
Lack of information about departure points and timings
Bolton
Fig. 9. Access problems sheet.Source: Jones and Paskins (2008), Fig. 14.
Walking and Street EnvironmentProblem 2: Cars drive too quickly on residential streets
Introduce physical speed reduction measures: speed humps, chicanes
Use of regulations: 20mph speed limits, give way at junctions, park on alternate sides of the street
Enforcement of speed limits
Problem 4: Unsafe crossing places at bus stops/stations
Provide informal crossing facilities: refuges, speed tables
Provide formal crossing: zebra, pelican or puffin
Resite bus stops to safer locations
Return to Access Problems
Fig. 10. Examples of suggested, ‘inside-the-box’ solutions.Source: Extracted from Jones and Paskins (2008), Fig. 19.
39P. Jones / Research in Transportation Business & Management 2 (2011) 29–41
40 P. Jones / Research in Transportation Business & Management 2 (2011) 29–41
of the public transport operator, there are major advantages to begained from setting up cross-sector procedures for light touchengagement at the early stages of planning new developments andservice reorganisations — before physical layouts and temporalpatterns unsuited to public transport provision become locked in.
Oneof the challenges in theprofessionalworkshopswas toencouragethe senior sector representatives to meaningfully engage in discussionsabout the problems experienced by clients in accessing their services,without them either becoming very defensive or very silo-oriented intheir consideration of possible solutions. The device of using ahypothetical area and the projection of participants' existing roles ontothis area proved to be very successful in both respects, and is stronglyrecommendedas amethodof overcomingsimilar problems in the future.
The benefits of cross sector engagement have been recognised in arecent report for the UK Commission for Integrated Transport (McLeanHazel, 2009). And, in the English context, a recent government WhitePaper (The StationeryOffice, 2010) is encouraging close liaisonbetweenmajor public and private sector players in a sub-region through thecreation of Local Enterprise Partnerships (LEPs), which should provideopportunities and incentives formore cross sectorworking in the future.
As well as attempting to loosen or align temporal constraintsbetween different service agencies, it is also evident that individuals'activity scheduling would be eased considerably if demand responsiveservices were to replace some fixed route/timed services in areascurrently provided with low frequency bus services — were thisfinancially feasible. Also, populations would have much greaterconfidence in using public transport if companies had contingencyplans for when problems arise (e.g. severe traffic delays or localflooding), rather than abandoning passengers in mid-journey andleaving them to fend for themselves.
9. Summary and conclusions
This study has provided a number of detailed insights into thenature of the practical accessibility problems experienced by sociallydisadvantaged groups without regular access to a car, living in onesemi-rural, ex-coalmining area of England. It has shown the diversenature of such constraints, both objective and subjective in nature,and their interconnectedness, often in complex ‘consequences’ chainsinvolving the separate actions of several individuals and agencies. Theparticular role of spatio-temporal constraints has been identified, ashas the importance of looking at cross sector actions and impacts.
The main focus of this paper has been on describing the processesand methods that were used to explore accessibility issues. It hasdescribed several simple, visual pen-and-paper mapping techniquesthat have been used both to record behaviour and to explore thenature of any associated accessibility problems, and a spreadsheet toolwhich helps to codify information and systematically exploreproblems and potential solutions. It has also demonstrated the valueof engaging with practitioners to explore accessibility problems andsolutions, within a controlled gaming simulation environment.
The operational accessibility planning tools that are presentlyavailable to practitioners in the UK and elsewhere tend to focus mainlyon the locational aspects of service provision, and do not consider in anydetail the many other dimensions of accessibility problems — many ofwhich, while not directly transport-related, inhibit the use of publictransport services. A number of these were identified in the residentfocus groups reported here, relating to temporal constraints, financialconstraints, personal security concerns and the lack of inter-agencycoordination. In addition, existing tools do not directly contribute to thedevelopment of suitable solutions — other than by highlighting areasfrom which residential access is poor.
Itwas evident that theparticipants in the residents' focus groupshada great deal of first-hand experience of accessibility problems whichthey faced in their daily lives, but the challenge lays in helping them toarticulate this knowledge in a systematic way which could be
documented and codified for further analysis and action. The mappingand other tools illustrated in Fig. 3 proved very useful both as ameans ofteasing out a variety of information and as a visual stimulus promotingfurther discussion. Such discussion highlighted the complex nature ofmany of their accessibility problems, particularly in relation toscheduling constraints, and the importance of perceptual and othermore subjective factors in constraining travel choices.While someof thefindings are likely to be specific to the particular study location, thenotion that accessibility is influenced by complex activity schedulingconstraints imposed by various agencies, as well as local objective andsubjective factors, is likely to be the case in most situations.
While this interactive, qualitative approach proved to be a veryrich method for identifying complex ‘real’ problems, it is relativelylabour intensive (requiring two very experienced facilitators) and canonly be applied among a relatively small number of participants. Itthus needs to form part of a portfolio of methods, with the keyfindings being subject to verification from existing data sources, orlarger scale representative attitude surveys among local residents.
The spreadsheet tool (described in Section 7) was developed toconsolidate the wide variety of knowledge about the nature ofaccessibility constraints (drawing both on existing literature and thefocus group findings). It enables the detailed temporal constraints thatcan seriously limit a client group's access to goods and services to bedocumented in detail, and shows the ‘windows’ of time when servicescan be easily accessed by public transport or other transport modes.
The tool also codifies the various non-spatial and non-temporalaccessibility problems which may be experienced in different commu-nities such as lack of information, costs of transport, poor pedestrianaccess, personal security, and other aspects of public transport services(e.g. limited capacity for buggies and wheelchairs, poor interchangefacilities). In addition, the tool provides users – both residents andprofessionals –with sets of known possible solutions, directly linked tothe different types of problems that have been identified, with thepossibility to build up this database over time from experience. It alsoaffords users the opportunity to take part in ‘out-of-the-box thinking’,through the use of randomly generated triplets of carefully selectedpictures.
This case study approach has both strengths and weaknesses,however. While it can highlight complex temporal interrelationshipsbetween the various activities carried out by an individual, there is aneed to verify the extent of such problems through recourse to otherdata sources (such as journey to work census data, or local travel andattitude surveys). It very much provides a complement to existingspatial representations of accessibility, and the summary spreadsheettool has the provision to link to such outputs in termsof facility locations(see top right ‘View Location Map’ button in Fig. 7), populationdistribution maps (see top right ‘View Distribution Map’ button inFig. 8) and accessibility surface maps (see top right ‘View AccessibilityMap’ button in Fig. 9).
9.1. Future research directions
Since the research was primarily qualitative in nature, it hasidentified a number of areas that would benefit from further in-depthinvestigation or from empirical quantification. In particular:
• Further analysis of potential activities foregone, and the reasonsunderlying this lack of activity participation;
• The relative importance of, and interrelationships between, subjec-tive and objective constraints;
• The importance of looking beyond the single trip to trip tours/tripchains and whole activity patterns, if accessibility constraints are tobe fully understood;
• Capturing the complexity of scheduling through the use of simulationmodelling; and
41P. Jones / Research in Transportation Business & Management 2 (2011) 29–41
• Incorporating this richer knowledge into current operationalaccessibility tools (for an example of how qualitative research canbe used to enhance the capability of existing operational accessi-bility models, see Wixey, Jones, & Christodoulou, 2005).
Finally, a generic issue identified during the resident focus groupsand the professional agency workshops was the lack of coordinatedworking between agencies. This could result in serious problems forsome groups of the population, either through agencies makingconflicting demands on users (e.g. through the incompatible timingconstraints of different appointments, coupled with limited frequencybus services), or where problems ‘fell through the cracks’ between theresponsibilities accepted by different agencies (e.g. late arrival at workor education). There was also considerable scope for service deliverydecisions taken by one agency to have negative impacts on the activitiesof other agencies, including public transport operators. This appears tobe a strongly under-researched – but very important – aspect ofAccessibility Planning.
Acknowledgements
The work described in this paper formed part of the DISTILLATEproject, which was funded by the UK Engineering and PhysicalSciences Research Council under its Sustainable Urban Environmentprogramme. The project was supported by sixteen UK local author-ities and a steering group including representatives of the Interna-tional Transport Forum, the European Commission, the UKDepartment for Transport and Transport Scotland. Some of thestakeholder engagement activities reported here were funded bySouth Yorkshire PTE, Yorkshire Forward and One Barnsley, andBarnsley Council. We are grateful to all of these bodies and their stafffor their support of this research; in particular, I would like to thankNeil Anderson, Martin Bowman and Ann Beddoes.
The tools described here were developed with the assistance ofresearchers in two institutions (see text and references): the Centre forTransport Studies, UCL and the Stockholm Environment Institute atYork. I would like to acknowledge in particular the contributions of Dr.Carolyn Snell (York) and James Paskins and Roselle Thoreau (UCL), aswell as Tim Grosvenor and the many local residents and agencies thattook part in the focus groups and professional workshop activities.
References
Dixon-Fyle, K. (1998). Accessibility planning and local development: The applicationpossibilities of the IRAP methodology. Development Policies department, InternationalLabour Office, Geneva.
Gould, P. (1969). “Spatial diffusion”, Commission on College Geography. Washington DC:Association of American Geographers.
Hagerstrand, T. (1970). What about people in regional science? Papers of the RegionalScience Association, 24, 7–21.
Halden, D., Jones, P., & Wixey, S. (2005). Working paper 3 (updated): Accessibilityanalysis literature review, transport studies group. London: University ofWestminster.
Hodgson, F. C., & Turner, J. (2003). Participation not consumption: The need for newparticipatory practices to address transport and social exclusion. Transport Policy,10(4), 265–272.
Jones, P. (1979). HATS: A technique for investigating household decisions. Environmentand Planning A, 11(1), 59–70.
Jones, P. M., Clarke, M. I., Dix, M. C., & Heggie, I. G. (1983). Understanding travelbehaviour. Aldershot: Gower.
Jones, P., & Lucas, K. (2005, December). “Option generation — literature review”
DISTILLATE. Working paper, project B, CTS, UCL.Jones, P., & Paskins, J. (2008, April). Identifying the Accessibility problems of
disadvantaged groups and generating solutions: Application to the BarnsleyDearne area of South Yorkshire. DISTILLATE working paper, CTS, UCL.
Jones, P., & Thoreau, R. (2008, March). Engaging with professional stakeholders in theDearne Valley Area of South Yorkshire. Strategic problem identification and optiongeneration: The case of Accessibility Planning. DISTILLATE working paper, CTS, UCL.
Jones, P., & Wixey, S. (2005, July). Measuring accessibility as experienced by differentsocially disadvantage groups. End of project summary report to the EPSRC.
Kelly, J., Jones, P., Barta, F., Hossinger, R., Witte, A. and Wolf, A.C. (2004). SuccessfulTransport Decision-making: a project management and stakeholder engagementhandbook. Volume 1: Concepts and tools; Volume 2: fact sheets. EuropeanCommission, ISBN: 3-88354-144-3 (2 volumes).
Mclean, Hazel (2009). Transport implications of public sector decisions. November:Report to the Commission for Integrated Transport by MRC Mclean Hazel 2009.
McLennan, D., Barnes, H., Noble, M., Davies, J., Garratt, E., & Dibben, C. (2011, March).The English indices of deprivation 2010: Department for Communities and LocalGovernment.
Moseley, M. J. (1979). Accessibility: The rural challenge. London: Methuen Books.Murray, A. T., &Wu, X. (2003). Accessibility trade-offs in public transit planning. Journal
of Geographical Systems, 5, 93–107.Preston, J., & Raje, F. (2007). Accessibility, mobility and transport-related social
exclusion. Journal of Transport Geography, 15, 151–160.Snell, C., & Jones, P. (2007, December). Accessibility problems in the Dearne:
Experiences of some local residents and their suggestions for solutions. A casestudy for developing accessibility planning tools for problem identification andoption generation. DISTILLATE working paper, CTS, UCL.
Social Exclusion Unit (2003, February).Making the connections: Final report on transportand social exclusion. : Office of the UK Deputy Prime Minister.
Soo, J. K. L., Ettema, D., & Ottens, H. F. L. (2009). “Towards a multi-activity multi-personaccessibility measure: Concept and first tests”. Chapter 34. In R. Kitamura, T. Yoshii,& T. Yamamoto (Eds.), The expanding sphere of travel behaviour research: EmeraldPublishing Group.
The Stationery Office (2010, October). Local growth: Realising every place's potential. Cm7961.
Transport for London (2010). Measuring public transport accessibility levels — PTALs.Summary, April 2010. See http://data.london.gov.uk/documents/PTAL-methodology.pdf
Wixey, S., Jones, P., & Christodoulou, G. (2005, June). Measuring accessibility asexperienced by different socially disadvantaged groups. Working paper 7, feedbackfrom social groups on strategic and local accessibility mapping: University ofWestminster.
Wixey, S., Jones, P., Lucas, K., & Aldridge, M. (2005, June). Measuring accessibility asexperienced by different socially disadvantaged groups.Working paper 1, user needsliterature review: University of Westminster.
Wu, B. M., & Hine, J. P. (2003). A PTAL approach to measuring changes in bus serviceaccessibility. Transport Policy, 10(4), 307–320.