developing dynamic mechanistic species distribution...
TRANSCRIPT
vol. 178, no. 1 the american naturalist july 2011
Developing Dynamic Mechanistic Species Distribution Models:Predicting Bird-Mediated Spread of Invasive Plants across
Northeastern North America
Cory Merow,* Nancy LaFleur, John A. Silander Jr., Adam M. Wilson, and Margaret Rubega
Department of Ecology and Evolutionary Biology, University of Connecticut, Storrs, Connecticut 06269
Submitted October 12, 2010; Accepted March 30, 2011; Electronically published May 25, 2011
Online enhancement: zip file.
abstract: Species distribution models are a fundamental tool inecology, conservation biology, and biogeography and typically iden-tify potential species distributions using static phenomenologicalmodels. We demonstrate the importance of complementing thesepopular models with spatially explicit, dynamic mechanistic modelsthat link potential and realized distributions. We develop generalgrid-based, pattern-oriented spread models incorporating threemechanisms—plant population growth, local dispersal, and long-distance dispersal—to predict broadscale spread patterns in hetero-geneous landscapes. We use the model to examine the spread of theinvasive Celastrus orbiculatus (Oriental bittersweet) by Sturnus vul-garis (European starling) across northeastern North America. We findexcellent quantitative agreement with historical spread records overthe last century that are critically linked to the geometry of hetero-geneous landscapes and each of the explanatory mechanisms con-sidered. Spread of bittersweet before 1960 was primarily driven byhigh growth rates in developed and agricultural landscapes, whilesubsequent spread was mediated by expansion into deciduous andconiferous forests. Large, continuous patches of coniferous forestsmay substantially impede invasion. The success of C. orbiculatus andits potential mutualism with S. vulgaris suggest troubling predictionsfor the spread of other invasive, fleshy-fruited plant species acrossnortheastern North America.
Keywords: Celastrus orbiculatus, cellular automaton, grid-basedmodel, spatially explicit model, species distribution model, Sturnusvulgaris.
Introduction
Species distribution models are a fundamental tool in bio-geography, ecology, and conservation biology; they are use-ful for addressing questions about biodiversity, morpho-logical/genetic diversity, and habitat suitability under past,present, and future climatic conditions. Species distribu-tion models (also known as ecological niche models) typ-
* Corresponding author: e-mail: [email protected].
Am. Nat. 2011. Vol. 178, pp. 30–43. � 2011 by The University of Chicago.
0003-0147/2011/17801-52545$15.00. All rights reserved.
DOI: 10.1086/660295
ically identify potential species distributions by associatingspecies occurrence with environmental characteristics andare static in time. The literature on species distributionmodels has grown substantially in the past decade, with avariety of new modeling methods, for example, Bayesiangeneralized linear models (Ibanez et al. 2009a, 2009b),boosted regression trees, ecological niche factor analysis,Maxent, and multivariate adaptive regression splines (seesummaries in Franklin 2009). Ecologists now rely on thesemodels for conservation planning and understanding oc-currence patterns. While informative, these models aregenerally phenomenological: they ignore dynamic factorsaffecting species distributions, such as dispersal and spreadpatterns, that link potential and realized distributions(Franklin 2010; Gallien et al. 2010). The omission of dis-persal mechanisms from species distribution models maylead to model output that overestimates the presence ofspecies in unreachable locations or underestimates it inlow-suitability areas with high propagule rain. Dynamicmodels allow inference about temporal change in species’distributions. Temporal variation in distributions can beparticularly important when species ranges are in flux,such as during invasions, periods of land use change orclimate change, or after disturbance (Franklin 2010).
Mechanistic models of species’ distributions are criticalbecause they go beyond identifying spatial patterns; theymake it possible to identify the factors, and the relation-ships among factors, that cause the spatial patterns. Forexample, phenomenological statistical models can identifylatent spatial patterns in species distributions using spatialrandom effects. However, these random effects cannot ex-plain species’ distributions (e.g., Ibanez et al. 2009a,2009b). Dynamic models can also estimate the timescalesassociated with species spread. We argue that the types ofdynamic mechanistic models we develop here provide thecritical link between phenomenological static models that

Modeling Bird-Mediated Invasion 31
identify distribution patterns and a more complete un-derstanding of those distributions (cf. Franklin 2010).
We focus here on the problem of invasions by bird-dispersed plant species to demonstrate the importance ofdynamic mechanistic models. Because the models are quitegeneral, they can be applied to the spread of any plantspecies across a landscape. Our capacity to successfullymanage invasive alien species is commonly limited by ourunderstanding and ability to predict the rates and patternsof spread (With 2002). Fleshy-fruited invasive plants areamong the most aggressive invasive species and are pri-marily spread by birds (Richardson et al. 2000). Bird-dispersed seeds may be moved farther (e.g., Willson 1993)and to more favorable habitats (e.g., Wenny 2001) thanthose moved by other natural means, and this interactioncan be a determining factor in the invasion process. Thisis particularly true in northeastern North America, wherebird-dispersed, invasive woody species are pervasive; theyare found in approximately 61% of 11,000� field recordsin the Invasive Plant Atlas of New England (IPANE; Mehr-hoff et al. 2003).
While there is a long history of study and a wealth ofinformation on the biology and ecology of both plantinvasions and fruit-frugivore interactions, little progresshas been made in developing predictive mechanistic mod-els for the spread of plants with animal-dispersed seeds(but see, e.g., Nathan and Muller-Landau 2000 and Hig-gins et al. 2001 for mechanistic models for wind-dispersedspecies). Existing animal-mediated seed dispersal models,with a few exceptions (e.g., Higgins et al. 2001; Levey etal. 2005; Will and Tackenberg 2008), are phenomenologicaland lack a detailed mechanistic understanding of the in-terplay between plants and their dispersers in response tovariation in environmental factors. Dispersers may foragemore frequently in some habitats than others (e.g., Guitianet al. 1992) or deposit seeds in a nonrandom pattern withrespect to habitat type (Wenny 2001; Russo et al. 2006).The environmental conditions preferred by dispersers maynot be optimal for seed germination or establishment.
We used grid-based (GB) simulation models to capturespread dynamics in a framework that is discrete in space,time, and state. These types of models are alternativelycalled cellular automata or spatially explicit models, de-pending on the context (Jongejans et al. 2008b), and areoften found in individual-based modeling schemes(Grimm and Railsback 2005; Berger et al. 2008). We usea pattern-oriented approach (Grimm and Railsback 2005)to develop GB models that can reproduce observed pat-terns of spread in both space and time. GB models areappealing because they can incorporate more biologicaland geographic realism through complex interacting fac-tors than comparable analytic techniques (Jongejans et al.2008b). GB models have been used extensively in plant
ecology (for recent reviews, see Higgins and Richardson1996; Jeltsch and Moloney 2002; Grimm and Railsback2005; Winkler 2006; Berger et al. 2008; Jongejans et al.2008b; Franklin 2010; Hui et al. 2010; Tsoar et al. 2010).GB models have the advantage of decoupling a complexspace-time problem into two simpler problems: a temporalmodel within a cell and a spatial model that connectsadjacent cells. In landscape models for population dynam-ics, this decomposition typically corresponds to local pop-ulation growth within a cell and dispersal among cells. GBmodeling has previously been applied to invasions withmuch success (see reviews listed above). It is particularlyinstructive for modeling invasions across large spatialscales because GB models readily incorporate landscapeheterogeneity based on GIS data plus stochastic, rare long-distance dispersal (LDD) events that can greatly affectspread dynamics (Kot et al. 1996; Jeltsch et al. 1997; Hig-gins and Richardson 1999; Clark et al. 2001). However,most mechanistic models for dispersal consider only ho-mogeneous landscapes (Jongejans et al. 2008b). Our mod-els are unique in the combination of factors they incor-porate in a GB framework, although elements of ourapproach can be found in earlier spatial spread modelsthat include mechanistic seed dispersal (e.g., Nathan andMuller-Landau 2000; Higgins et al. 2001; Russo et al. 2006;Tsoar et al. 2010), LDD (e.g., Higgins et al. 2001; Leveyet al. 2005, 2008; Cannas et al. 2006), heterogeneous land-scapes (e.g., With 2002; Schurr et al. 2008), and large(landscape to regional) spatial scales (e.g., Ostendorf et al.2001; Perry and Enright 2002). Our analysis also providesone of the most detailed and comprehensive explorationsof model parameterization and validation (see appendixes,available in a zip file) that we have found, following therecommendations of Grimm and Railsback (2005) andSchmolke et al. (2010).
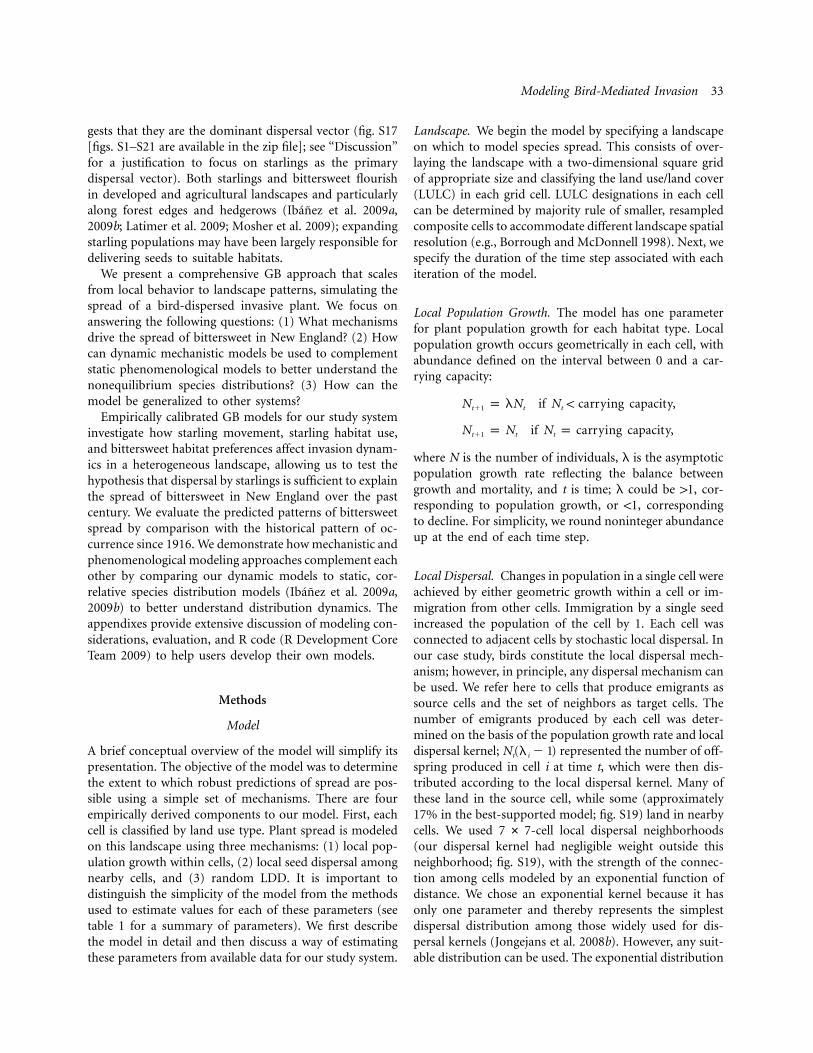
As a case study, we consider the spread of an invasivewoody liana (Oriental bittersweet Celastrus orbiculatus) fa-cilitated by invasive European starlings (Sturnus vulgaris)over the past century across northeastern North America(New England; see fig. 1). European starlings (Sturnus vul-garis), which are particularly abundant frugivores in NewEngland, are important seed dispersal agents for bitter-sweet. Large flocks of starlings forage heavily on the plen-tiful bittersweet fruits during the late autumn and wintermonths when other resources are scarce (LaFleur 2006)and increase germination of the seeds they ingest (LaFleuret al. 2009). The first records of starlings in New England(New Haven, CT, 1906) predate those of bittersweet(Derby, CT, 1916), and their range expansion precededthat of bittersweet throughout New England (fig. 1). Thesheer numerical dominance of starlings (on average 77times more abundant than other potential dispersers) inChristmas Bird Count surveys across New England sug-

Figu
re1:
Pre
sen
cere
cord
sof
Ori
enta
lbi
tter
swee
tan
dE
uro
pean
star
lings
inN
ewE
ngl
and.
Bot
hfi
eld
and
her
bari
um
data
are
show
nfo
rbi
tter
swee
tre
cord
sfo
r20
09.
We
assu
me
that
lan
du
se/l
and
cove
r(L
ULC
)h
asn
otch
ange
dap
prec
iabl
yat
this
reso
luti
ondu
rin
gth
isti
me
peri
od(c
f.M
osh
eret
al.
2009
).N
ote
the
spat
ial
sim
ilari
tyin
pres
ence
patt
ern
s;th
est
arlin
gex
pan
sion
fron
tle
ads
the
bitt
ersw
eet
expa
nsi
onfr
ont
byap
prox
imat
ely
40–6
0ye
ars.
Modeling Bird-Mediated Invasion 33
gests that they are the dominant dispersal vector (fig. S17[figs. S1–S21 are available in the zip file]; see “Discussion”for a justification to focus on starlings as the primarydispersal vector). Both starlings and bittersweet flourishin developed and agricultural landscapes and particularlyalong forest edges and hedgerows (Ibanez et al. 2009a,2009b; Latimer et al. 2009; Mosher et al. 2009); expandingstarling populations may have been largely responsible fordelivering seeds to suitable habitats.
We present a comprehensive GB approach that scalesfrom local behavior to landscape patterns, simulating thespread of a bird-dispersed invasive plant. We focus onanswering the following questions: (1) What mechanismsdrive the spread of bittersweet in New England? (2) Howcan dynamic mechanistic models be used to complementstatic phenomenological models to better understand thenonequilibrium species distributions? (3) How can themodel be generalized to other systems?
Empirically calibrated GB models for our study systeminvestigate how starling movement, starling habitat use,and bittersweet habitat preferences affect invasion dynam-ics in a heterogeneous landscape, allowing us to test thehypothesis that dispersal by starlings is sufficient to explainthe spread of bittersweet in New England over the pastcentury. We evaluate the predicted patterns of bittersweetspread by comparison with the historical pattern of oc-currence since 1916. We demonstrate how mechanistic andphenomenological modeling approaches complement eachother by comparing our dynamic models to static, cor-relative species distribution models (Ibanez et al. 2009a,2009b) to better understand distribution dynamics. Theappendixes provide extensive discussion of modeling con-siderations, evaluation, and R code (R Development CoreTeam 2009) to help users develop their own models.
Methods
Model
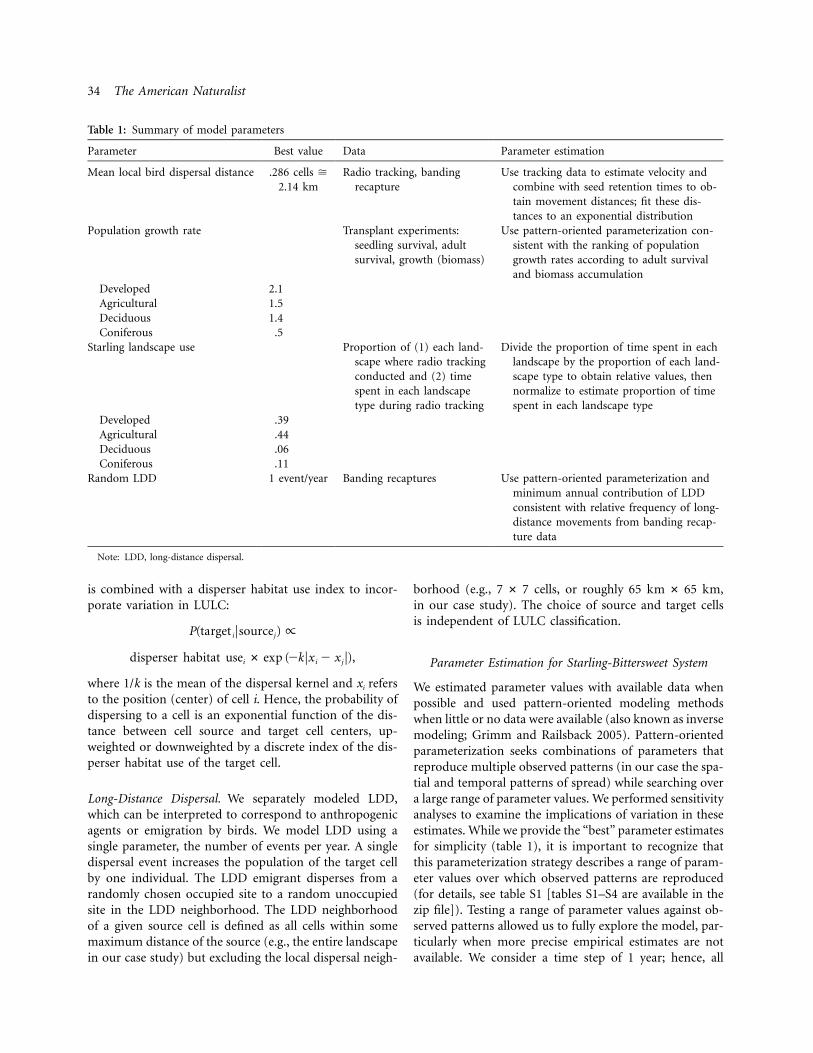
A brief conceptual overview of the model will simplify itspresentation. The objective of the model was to determinethe extent to which robust predictions of spread are pos-sible using a simple set of mechanisms. There are fourempirically derived components to our model. First, eachcell is classified by land use type. Plant spread is modeledon this landscape using three mechanisms: (1) local pop-ulation growth within cells, (2) local seed dispersal amongnearby cells, and (3) random LDD. It is important todistinguish the simplicity of the model from the methodsused to estimate values for each of these parameters (seetable 1 for a summary of parameters). We first describethe model in detail and then discuss a way of estimatingthese parameters from available data for our study system.
Landscape. We begin the model by specifying a landscapeon which to model species spread. This consists of over-laying the landscape with a two-dimensional square gridof appropriate size and classifying the land use/land cover(LULC) in each grid cell. LULC designations in each cellcan be determined by majority rule of smaller, resampledcomposite cells to accommodate different landscape spatialresolution (e.g., Borrough and McDonnell 1998). Next, wespecify the duration of the time step associated with eachiteration of the model.
Local Population Growth. The model has one parameterfor plant population growth for each habitat type. Localpopulation growth occurs geometrically in each cell, withabundance defined on the interval between 0 and a car-rying capacity:
N p lN if N ! carrying capacity,t�1 t t
N p N if N p carrying capacity,t�1 t t
where N is the number of individuals, l is the asymptoticpopulation growth rate reflecting the balance betweengrowth and mortality, and t is time; l could be 11, cor-responding to population growth, or !1, correspondingto decline. For simplicity, we round noninteger abundanceup at the end of each time step.
Local Dispersal. Changes in population in a single cell wereachieved by either geometric growth within a cell or im-migration from other cells. Immigration by a single seedincreased the population of the cell by 1. Each cell wasconnected to adjacent cells by stochastic local dispersal. Inour case study, birds constitute the local dispersal mech-anism; however, in principle, any dispersal mechanism canbe used. We refer here to cells that produce emigrants assource cells and the set of neighbors as target cells. Thenumber of emigrants produced by each cell was deter-mined on the basis of the population growth rate and localdispersal kernel; represented the number of off-N (l � 1)t i
spring produced in cell i at time t, which were then dis-tributed according to the local dispersal kernel. Many ofthese land in the source cell, while some (approximately17% in the best-supported model; fig. S19) land in nearbycells. We used -cell local dispersal neighborhoods7 # 7(our dispersal kernel had negligible weight outside thisneighborhood; fig. S19), with the strength of the connec-tion among cells modeled by an exponential function ofdistance. We chose an exponential kernel because it hasonly one parameter and thereby represents the simplestdispersal distribution among those widely used for dis-persal kernels (Jongejans et al. 2008b). However, any suit-able distribution can be used. The exponential distribution
34 The American Naturalist
Table 1: Summary of model parameters
Parameter Best value Data Parameter estimation
Mean local bird dispersal distance .286 cells �2.14 km
Radio tracking, bandingrecapture
Use tracking data to estimate velocity andcombine with seed retention times to ob-tain movement distances; fit these dis-tances to an exponential distribution
Population growth rate Transplant experiments:seedling survival, adultsurvival, growth (biomass)
Use pattern-oriented parameterization con-sistent with the ranking of populationgrowth rates according to adult survivaland biomass accumulation
Developed 2.1Agricultural 1.5Deciduous 1.4Coniferous .5
Starling landscape use Proportion of (1) each land-scape where radio trackingconducted and (2) timespent in each landscapetype during radio tracking
Divide the proportion of time spent in eachlandscape by the proportion of each land-scape type to obtain relative values, thennormalize to estimate proportion of timespent in each landscape type
Developed .39Agricultural .44Deciduous .06Coniferous .11
Random LDD 1 event/year Banding recaptures Use pattern-oriented parameterization andminimum annual contribution of LDDconsistent with relative frequency of long-distance movements from banding recap-ture data
Note: LDD, long-distance dispersal.
is combined with a disperser habitat use index to incor-porate variation in LULC:
P(target Fsource ) ∝i j
disperser habitat use # exp (�kFx � x F),i i j
where 1/k is the mean of the dispersal kernel and xi refersto the position (center) of cell i. Hence, the probability ofdispersing to a cell is an exponential function of the dis-tance between cell source and target cell centers, up-weighted or downweighted by a discrete index of the dis-perser habitat use of the target cell.
Long-Distance Dispersal. We separately modeled LDD,which can be interpreted to correspond to anthropogenicagents or emigration by birds. We model LDD using asingle parameter, the number of events per year. A singledispersal event increases the population of the target cellby one individual. The LDD emigrant disperses from arandomly chosen occupied site to a random unoccupiedsite in the LDD neighborhood. The LDD neighborhoodof a given source cell is defined as all cells within somemaximum distance of the source (e.g., the entire landscapein our case study) but excluding the local dispersal neigh-
borhood (e.g., cells, or roughly ,7 # 7 65 km # 65 kmin our case study). The choice of source and target cellsis independent of LULC classification.
Parameter Estimation for Starling-Bittersweet System
We estimated parameter values with available data whenpossible and used pattern-oriented modeling methodswhen little or no data were available (also known as inversemodeling; Grimm and Railsback 2005). Pattern-orientedparameterization seeks combinations of parameters thatreproduce multiple observed patterns (in our case the spa-tial and temporal patterns of spread) while searching overa large range of parameter values. We performed sensitivityanalyses to examine the implications of variation in theseestimates. While we provide the “best” parameter estimatesfor simplicity (table 1), it is important to recognize thatthis parameterization strategy describes a range of param-eter values over which observed patterns are reproduced(for details, see table S1 [tables S1–S4 are available in thezip file]). Testing a range of parameter values against ob-served patterns allowed us to fully explore the model, par-ticularly when more precise empirical estimates are notavailable. We consider a time step of 1 year; hence, all
Modeling Bird-Mediated Invasion 35
parameters can be interpreted as annual rates. However,the model could be readily scaled to accommodate othertemporal resolutions.
Landscape. We modeled population dynamics in -ft5 # 5cells, which required 3,057 cells to cover New England.We used LULC classifications for the region (National Oce-anic and Atmospheric Administration 1995–), in con-junction with data on starling movement patterns andbittersweet seed survival, to reclassify the original 30 classesinto four appropriate LULC classes: developed, agricul-tural/grassland, deciduous forest, coniferous, and mixeddeciduous-coniferous forest (henceforth coniferous; tableS4). This spatial resolution and LULC classification hasbeen used effectively to explain bittersweet distributionsin earlier static models (Ibanez et al. 2009a, 2009b) andallows a direct comparison to our dynamic mechanisticmodel. We assume that LULC has not changed appreciablyat this resolution in the past 90 years. This seems reason-able, given that the largest change in the region over thepast 2 centuries—the return of agricultural lands to for-est—occurred primarily from 1850 to about 1900 (cf. Fos-ter 1992; Mosher et al. 2009).
Local Population Growth. To initialize the model, we usedthe first three observed naturalized occurrences of bitter-sweet in the New England landscape (from herbarium re-cords; Mehrhoff et al. 2003). These occurred in Derby,Connecticut (1916); Falmouth, Massachusetts (1919); andNew Durham, New Hampshire (1938). We started themodel in 1919 with the first two sites, later introduced apopulation in New Durham in 1938, and iterated a totalof 90 years. In the model, we seeded the introduction siteswith a population size equal to half that of the carryingcapacity in order to avoid stochastic extinctions resultingfrom small populations (history confirms that the realsource populations overcame this complication). This as-sumption is equivalent to permitting an extremely highpopulation growth rate for the first 2 years after intro-duction, a phenomenon that has been empirically ob-served for aggressive invasive species in a number of sys-tems (e.g., Jongejans et al. 2008a; Schutzenhofer et al.2009).
Asymptotic population growth rates for each landscapewere based on survival rates in different landscapes mea-sured in transplant experiments using seedling and adultsurvival (Leicht 2005; Leicht-Young 2007; table S3). Theseare, in some sense, free parameters that can be adjustedusing a pattern-oriented approach (Grimm and Railsback2005) to overcome imprecise or unavailable data at thechosen spatial scale (as will usually be the case for coarsespatial scales). The transplant experiments indicated thatbittersweet had the highest survival (195%) and greatest
mean biomass accumulation at harvest in developed andagricultural landscapes. Plants in deciduous landscape alsoshowed high survival (90%–95%) but grew substantially(60%–70%) less, while coniferous landscapes were rela-tively unfavorable for survival (60%–80%; Leicht 2005;Leicht-Young 2007). We adopted this hierarchy for land-scape preference (the data component; table 1) and ad-justed l values to obtain the minimum amount of spreadnecessary to predict the majority of presences (the pattern-oriented component). We then used sensitivity analysis toensure that our results were robust to deviations in thechosen l values. While most perennial plant populationgrowth rates remain close to 1 (Silvertown et al. 1993)over short time periods, growth rates may be much higher(e.g., Schutzenhofer et al. 2009). We considered l valueson the interval [0, 2.1], since these reflect the range ofsustainable growth during invasion (cf. Jongejans et al.2008a).
In order to make the model run faster, we take advantageof the observation that varying the per-cell carrying ca-pacity between 50 and 50,000 had no significant effect onpredicted presence or absence (see app. S1). For the localdispersal neighborhood size and population growth rateswe considered, we find that allowing larger carrying ca-pacities does not affect early spread and affects the numberof dispersing seeds only after 8–20 years have passed. After8–20 years, most cells in the local dispersal neighborhoodof an inhabited cell have already been colonized duringthis interval, and hence patterns of presence are not af-fected. Given these considerations, we chose a carryingcapacity of 200 as a modeling convenience to allow themodel to run quickly.
Local Dispersal. Starlings were introduced to New YorkCity in 1890–1891 (Cabe 1993), and the Christmas BirdCounts, beginning in 1900, record their yearly spreadacross the New England landscape (fig. 1; National Au-dubon Society 2002). The historical presence of bittersweetappears to lag starling presence by approximately 40–60years (fig. 1). We therefore assumed in the model thatstarlings are effectively present throughout the landscapewherever bittersweet is present, and we did not modelstarling dynamics.
Seed dispersal was partitioned between local dispersalby birds and random LDD that captured infrequent birdmovement or human-assisted dispersal. Landscape struc-ture has been shown to influence feeding behavior (e.g.,Evans et al. 2009) as well as fruit abundance (e.g., Salla-banks 1993), so we interpret local seed dispersal to derivefrom feeding behavior and movements among roosts. Toobtain a distribution of local movements by starlings, weused empirical data collected by LaFleur (2006) as part ofa study examining their effectiveness as seed dispersers of

36 The American Naturalist
invasive plants. During this study, radiotelemetry was usedto measure the distances that free-living starlings movedper unit time (methods in LaFleur 2006). Distance wasmeasured as the net displacement between observationpoints and thus represents an underestimate of the totaldistance moved. Radio tracking documented movementsof up to ∼7 km (maximum [over 184distance p 7,301 mmin], ). Such local move-mean � SD p 771 � 972 mments have been used estimate bird movements at largerscales (Levey et al. 2005). We obtained estimates of starlingvelocities by assuming straight-line movement betweenobservation points; since observation points only rarelyrepresented consecutive stops on a bird’s route, these rep-resent conservative underestimates. Gut passage rate datawere collected from captive starlings that were fed bitter-sweet fruits (LaFleur 2006; LaFleur et al. 2009). The meanpassage rate of bittersweets seeds was min (SD),43 � 20so we considered retention times ranging from 20 to 90min (fig. S19). By multiplying the distribution of starlingvelocities by the passage rates, we estimated the seed dis-persal kernel (see similar approaches in Holbrook andSmith 2000; Vellend et al. 2003), which we fit with anexponential distribution (fig. S19). Since these data focuson local movement, the seed dispersal kernels provide po-tential lower bounds on starling dispersal.
Similarly, we obtained an upper bound for the local birddispersal distribution from larger-scale bird movementsdescribed by banding recaptures. While radio tracking ofstarlings suggests that they typically move seeds on thescale of hundreds to a few thousand meters during foraging(LaFleur 2006), movements on the order of many kilo-meters occur. For example, starlings roost in large groupsevery night as far as 12 km from feeding sites (Morrisonand Caccamise 1990). Such distances can easily be tra-versed within typical seed retention times (LaFleur 2009),indicating that less frequent, longer-distance movementsmay also be important for plant spread. We estimated theupper bound on seed dispersal from banding recapturesthat describe these and even longer movements. To esti-mate maximum starling velocities, we focused only onrecaptures where birds moved more than 10 km in lessthan 2 days because these provide an upper bound forstarling velocities. Using 46 records (U.S. Geological Sur-vey Bird Banding Laboratory, unpublished data) that metthese criteria, estimating that starlings could fly up to 8 hper day, and dividing the distance between recaptures byflight time, we obtained an average velocity. This providesa conservative velocity estimate, since it ignores indirectpaths. We combined these velocities with gut passage timesin the same manner as above and obtained exponentialseed dispersal kernels. We used a distribution of movementdistances with a mean (0.29 cells) that constitutes a balancebetween long- and short-distance movement (fig. S19).
We used sensitivity analysis to check that our results wererobust to deviations from this mean.
Birds use some landscapes more than others, and thismediates their delivery of seeds. We estimated starlinglandscape use on the basis of our data documenting star-ling landscape visitation rates during tracking in the win-ters of 2003–2004 and 2004–2005. We matched the co-ordinates obtained from the first location of each trackwith LULC data (CLEAR 2006) at -m resolution30 # 30to determine the proportion of observations in each land-scape type and used this as a proxy for the time spent ineach landscape type. We estimated a landscape selectivityindex by weighting the time spent in each landscape bythe proportion of the landscape in Connecticut (Manly etal. 2002; table 1), where the starling movement data werecollected.
Long-Distance Dispersal. We incorporated rare randomLDD events separately from local bird-mediated dispersal,in part to reflect the difficultly of getting estimates of rareLDD events (Clark et al. 2001). As with population growthparameters, we used a pattern-oriented approach to pa-rameter estimation. We used one event per year to allowthe minimum contribution of this mechanism withoutmaking more detailed assumptions about the nature ofLDD, but we found that using five or fewer events peryear produced equivalent results (table S1). We avoid link-ing LDD to more complex factors such as landscape struc-ture or specific sources because there is little generality inconclusions regarding LDD (other than the difficulty ofaccurately predicting it; Clark et al. 2001) and a morecomplex parameterization is apparently unnecessary tocapture dynamics in the cases we study (fig. 2). Data fromthe U.S. Geological Survey Bird Banding Laboratory in-dicate the capability of starlings to traverse long distancesquickly and contribute to LDD. They have recorded atleast three cases of starlings recaptured more than 68 kmaway from the original banding site just 2 days after cap-ture out of 25,000 total records; one individual traveledas far as 178 km (U.S. Geological Survey Bird BandingLaboratory, unpublished data; cf. fig. S19, inset). Giventhat between approximately 100,000 and 600,000 starlingshave been observed during Christmas Bird Count surveyseach year since 1960 (fig. S19), a single LDD event peryear is likely a conservative estimate.
In our model, the LDD emigrant disperses from a ran-domly chosen occupied site to a random unoccupied siteoutside the local bird dispersal neighborhood. This wasjustified because rare LDD events are typically uncorre-lated with standard means of dispersal (Higgins et al.2003), which might otherwise tend to deposit seeds inoccupied sites during starlings’ foraging movements.Equivalent results were achieved by removing the restric-

Figu
re2:
Inva
sion
prob
abili
tyof
Cel
astr
usor
bicu
latu
sfo
rbe
stpa
ram
eter
esti
mat
es(t
able
1).
Her
bari
um
reco
rds
(191
6–20
09)
and
fiel
dre
cord
s(2
002–
2009
)pr
ovid
eva
lidat
ion
data
.O
pen
circ
les
repr
esen
tob
serv
edpr
esen
ces
corr
ectl
ypr
edic
ted
byat
leas
t50
%of
mod
elru
ns,
and
fille
dci
rcle
sm
ark
inco
rrec
tpr
edic
tion
sof
know
npr
esen
ces.
Dia
mon
dsin
dica
tein
trod
uct
ion
poin
ts.
Th
ebo
ttom
righ
tof
each
inse
tsh
ows
the
prop
orti
onof
obse
rved
pres
ence
sco
rrec
tly
pred
icte
dat
each
tim
est
ep.
“Equ
ilibr
ium
”re
pres
ents
pred
icti
ons
afte
r80
0ti
me
step
s.
38 The American Naturalist
tion on occupied sites while increasing the number of LDDevents. LDD immigrants could occur in any cell. However,we also tested restricted LDD neighborhoods ( or51 # 51
cells) centered on the source cell (figs. S14, S15).25 # 25Starlings have also been noted to fly at 60–80 km/h (Feare1984); thus, traveling such distances within feasible seedretention times is quite possible. Furthermore, we expectLDD to occur through a variety of other mechanisms (notjust starlings), so modeling the entire landscape as the LDDneighborhood seemed appropriate.
Model Evaluation
We evaluated the predicted range expansion by compar-ison to two presence-only data sets from the IPANE project(Mehrhoff et al. 2003): (1) a time series derived from 179herbarium specimens collected from 1916 to 2009 (fig. 1)and (2) 991 field records collected from 2002 to 2009. Thefield data set provided greater sampling intensity than theherbarium data but essentially captured only a single snap-shot of the population in time. We compared model pre-dictions, averaged over 100 runs, to the observed presencesat five points during the historical time series (1940, 1960,1980, 2000, and 2009). Finally, we evaluated the modelusing sensitivity analysis on all parameters.
Model evaluation is challenging when comparing mod-els with different parameter values because allowinggreater spread will necessarily increase model sensitivity(i.e., correctly predicted presences). For example, we usea growth rate of 2.1 in developed landscape cells; using agrowth rate of 25 would improve the sensitivity but wouldbe completely unrealistic. Because alternative methods donot exist (Boyce et al. 2002), we report the sensitivity(percent correct) and chose parameter values that producethe minimum spread necessary to fit the approximate ob-served invasion front without overestimating spread. Inevaluating model prediction success, we required that 50%of model runs predicted presence accurately (followingIbanez et al. 2009a, 2009b).
To assess the robustness of our model and to assesswhether simpler models adequately captured historicalspread patterns or whether a more complex model mightbe indicated (Jongejans et al. 2008b), we examined theconsequences of different assumptions. We tested whetherthe three plant population expansion mechanisms—localpopulation growth, local dispersal by birds, and randomLDD—were all necessary. We also modified assumptionsabout the landscape by considering three alternative land-scapes: homogeneous (all favorable landscape), binary(where developed, agricultural and deciduous landscapeswere grouped as favorable, and coniferous landscape andwater were unfavorable), and randomly sorted heteroge-neous landscapes. We considered alternate introduction
scenarios by changing the location of the first three nat-uralized populations. We also initiated the model in 1939and 1959, using the records obtained before the respectivedate as the initial populations. We used sensitivity analysesto explore the parameter space of the model, measuringsensitivity as the change in the proportion of presencescorrectly predicted (table S1). Details of the methods andresults of the sensitivity analyses are provided in appendixS3.
Results
Our model correctly predicted the spread of bittersweetthroughout southern New England by 2009 and its con-tinued spread to northern New England. When comparedto the observed time series, the full model successfullypredicted between 82% and 95% of the observed presences(fig. 2). The model successfully predicted the temporalspread patterns, with initial spread along the southerncoast of New England, extending into the ConnecticutRiver Valley and Greater Boston, then spreading throughmuch of southern New England and isolated patches inthe north. Our model predicted that virtually all of south-ern New England and Vermont is occupied, while muchof New Hampshire and Maine were invaded in fewer than10% of runs. Many of our false negatives occurred in NewHampshire and coastal Maine. The main results of thesensitivity analysis were as follows: (1) plant populationgrowth, local bird dispersal, and random LDD were allessential to produce accurate predictions; and (2) themodel was most sensitive to developed and agriculturalland use parameters (i.e., bittersweet growth rate, starlinglandscape use, and landscape geometry) before 1960 anddeciduous and coniferous forest parameters after 1960(tables S1, S2).
Changing plant population growth rates (l) had a largeimpact on predictions (table S1). In general, increasinggrowth rates across all landscapes improved predictionsslightly. However, increasing l above 1 in coniferous for-ests led to vast overprediction. Reducing growth rates re-duced spread substantially. High growth rates in developedlandscapes were essential to match the rapid range ex-pansion through 1980. Growth in deciduous forests wasalso important because this landscape is widespread acrossNew England and separates developed and agriculturallandscapes that are more favorable to population growth.Population growth rates in deciduous forest below 1.4 lim-ited early spread into forests, while higher values over-predicted spread.
Incorporating the geometry of a heterogeneous land-scape was also critical to accurately predicting patterns ofspread. Spread patterns depended strongly on the intro-duction points (figs. S7–S11; table S2). For example, if the
Modeling Bird-Mediated Invasion 39
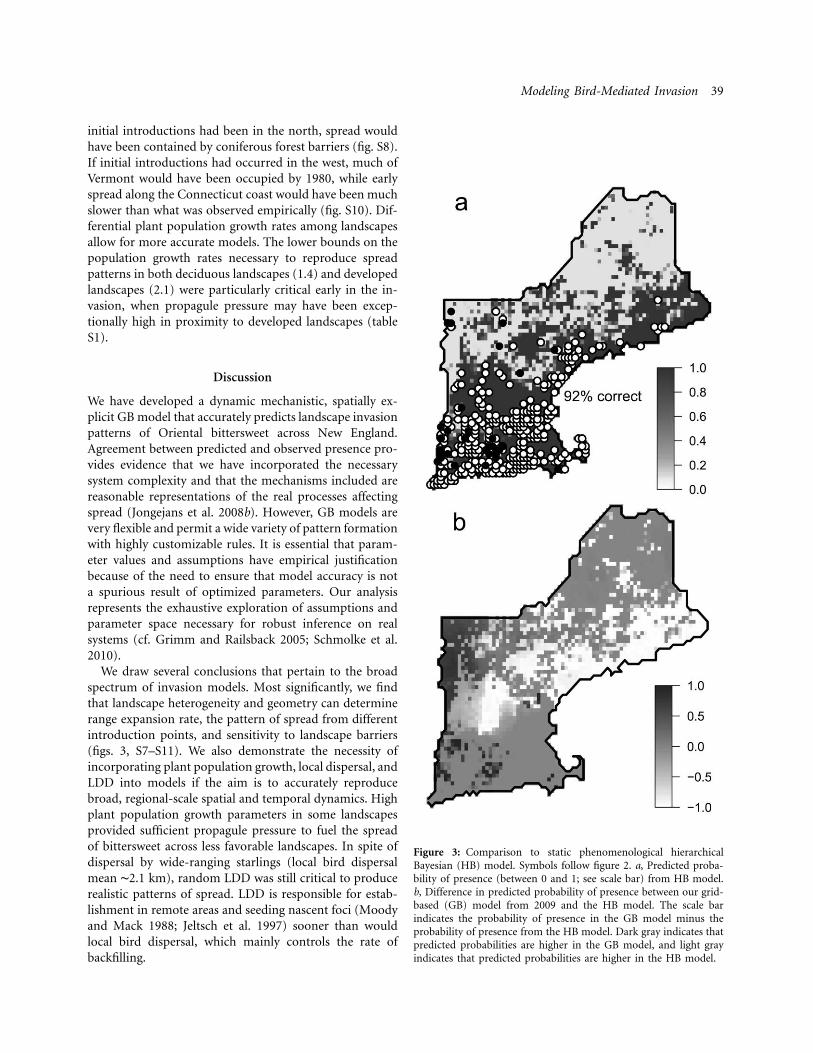
Figure 3: Comparison to static phenomenological hierarchicalBayesian (HB) model. Symbols follow figure 2. a, Predicted proba-bility of presence (between 0 and 1; see scale bar) from HB model.b, Difference in predicted probability of presence between our grid-based (GB) model from 2009 and the HB model. The scale barindicates the probability of presence in the GB model minus theprobability of presence from the HB model. Dark gray indicates thatpredicted probabilities are higher in the GB model, and light grayindicates that predicted probabilities are higher in the HB model.
initial introductions had been in the north, spread wouldhave been contained by coniferous forest barriers (fig. S8).If initial introductions had occurred in the west, much ofVermont would have been occupied by 1980, while earlyspread along the Connecticut coast would have been muchslower than what was observed empirically (fig. S10). Dif-ferential plant population growth rates among landscapesallow for more accurate models. The lower bounds on thepopulation growth rates necessary to reproduce spreadpatterns in both deciduous landscapes (1.4) and developedlandscapes (2.1) were particularly critical early in the in-vasion, when propagule pressure may have been excep-tionally high in proximity to developed landscapes (tableS1).
Discussion
We have developed a dynamic mechanistic, spatially ex-plicit GB model that accurately predicts landscape invasionpatterns of Oriental bittersweet across New England.Agreement between predicted and observed presence pro-vides evidence that we have incorporated the necessarysystem complexity and that the mechanisms included arereasonable representations of the real processes affectingspread (Jongejans et al. 2008b). However, GB models arevery flexible and permit a wide variety of pattern formationwith highly customizable rules. It is essential that param-eter values and assumptions have empirical justificationbecause of the need to ensure that model accuracy is nota spurious result of optimized parameters. Our analysisrepresents the exhaustive exploration of assumptions andparameter space necessary for robust inference on realsystems (cf. Grimm and Railsback 2005; Schmolke et al.2010).
We draw several conclusions that pertain to the broadspectrum of invasion models. Most significantly, we findthat landscape heterogeneity and geometry can determinerange expansion rate, the pattern of spread from differentintroduction points, and sensitivity to landscape barriers(figs. 3, S7–S11). We also demonstrate the necessity ofincorporating plant population growth, local dispersal, andLDD into models if the aim is to accurately reproducebroad, regional-scale spatial and temporal dynamics. Highplant population growth parameters in some landscapesprovided sufficient propagule pressure to fuel the spreadof bittersweet across less favorable landscapes. In spite ofdispersal by wide-ranging starlings (local bird dispersalmean ∼2.1 km), random LDD was still critical to producerealistic patterns of spread. LDD is responsible for estab-lishment in remote areas and seeding nascent foci (Moodyand Mack 1988; Jeltsch et al. 1997) sooner than wouldlocal bird dispersal, which mainly controls the rate ofbackfilling.

40 The American Naturalist
Mechanisms driving Bittersweet Spread
Our model provides insight into factors driving bitter-sweet’s spread. The response of bittersweet to differentlandscape types was particularly important. In the model,the early invasion (through 1960) was primarily driven byparameters in agricultural and developed landscapes (tableS1; see also Mosher et al. 2009), since these represent themain corridors through which the invasion began. Themodel proved largely insensitive to variation in all conif-erous land use parameters through 1960 because there isrelatively little of this landscape type in southern NewEngland. In contrast, the later stages of invasion were ap-parently dictated by these same parameters for deciduousand coniferous forests because these constitute the areasthat were reached only after 1980 (table S1). Populationgrowth rates must have been exceptionally high in devel-oped areas (11.9 before 1980; table S1; Leicht-Young2007). Such rapid growth suggests that density dependencewas absent (at least initially) or that anthropogenic cul-tivation and reintroduction was an important contributorto spread. Sensitivity analysis revealed the importance oflandscape geometry; prediction accuracy increased whenpopulations were initiated in the south (where humanpopulation density is highest and where the species wasfirst observed to be naturalized), suggesting that anthro-pogenic influences may have been important in this area(fig. S8). Deciduous landscapes provided the main poten-tial corridor between the favored developed and agricul-tural landscapes. Our sensitivity analysis indicated thatwhen deciduous forest is a sufficiently favorable habitat,there is little to inhibit spread throughout much of south-ern New England (table S1); population growth rates 11.4in deciduous landscapes were necessary to accurately re-produce spread patterns (table S1). Small patches of fa-vorable landscape embedded in deciduous forest may ac-tually be sufficient to sustain such high growth ( )l 1 1because the interface between forest and developed or ag-ricultural areas is a prime place for establishment andgrowth of bittersweet (cf. Mosher et al. 2009). Thus, ourmodel may underestimate spread in the north because itmay underestimate the amount of suitable habitat there.
While the seed dispersal kernel generated by starlingmovement was essential to predicting patterns of spread,variation in starling landscape use had a smaller role. Themodel showed high sensitivity to starlings’ use of decid-uous landscape and developed landscape only during theearly phase of introduction (pre-1960; table S1). Essen-tially, landscape use parameters in deciduous and devel-oped landscape trade off with one another: when the valueof one is too high, there is insufficient spread in the otherlandscape to match observations. Low sensitivity to star-ling landscape use from 1980 to 2009 (table S1) occurred
because the high-density source populations in and arounddeveloped areas produced a relatively dense propagule rainthroughout the bird dispersal neighborhoods. This thenobscures variation in landscape use. Use by starlings ofconiferous landscapes was insensitive to variation becausethe bittersweet growth rate there was below 1, while ag-ricultural landscape use was insensitive because only asmall portion of the landscape is classified as agricultural.Starling landscape use affected only temporal, not spatial,dynamics of bittersweet; the long-term predictions areconstant and driven by landscape-specific plant populationgrowth rates and LDD. The minor impact of landscapeuse by birds on predictions is not entirely surprising. Weknow of no evidence suggesting that starlings avoid trav-eling through particular landscapes, and thus they maydeposit seeds anywhere along their route.
Projecting spread over hundreds of years allowed in-formative patterns to emerge that reflect the importanceof landscape heterogeneity and its geometric configuration(fig. 2; Latimer et al. 2009; Mosher et al. 2009). Much ofMaine is apparently resistant to invasion, as evidenced bythe poor population growth of bittersweet in the largeexpanse of coniferous landscapes. Coniferous forests mayprovide a safety buffer around favorable landscape thatrequires independent introductions (LDD) for bittersweetto establish. Isolated regions of northern Maine could po-tentially harbor bittersweet, but the time span required toreach these areas from elsewhere in New England may belarge (400–800 years; fig. S13). In contrast, there are fewsubstantial barriers to long-term spread in southern NewEngland. The time necessary for bittersweet to infestnorthern Maine is inherently difficult to predict becauseit depends on the stochasticity associated with LDD.
Our model supports the idea that the immense successof bittersweet in New England has been facilitated by star-lings, suggesting an important mutualism between thesespecies. Movements on the order of kilometers drivespread (fig. S19; as much as 17% of seeds; figs. S14, S15;table 1). We suspect that these movements correspond toactual starlings traveling to roosts because these distancesare larger than typical foraging movements (LaFleur 2006).Joint use of developed and agricultural landscapes—andassociated edges—by starlings and bittersweet make sucha mutualism more likely because starlings could depositlarge numbers of seeds at favorable sites. Increasing LDDcannot account for these movements because it would leadto a much more random pattern of historical spread (fig.S18), as opposed to the relatively smooth invasion frontthat we observe (figs. 1, 3).
While other dispersers cannot be ruled out in the realrange expansion of bittersweet, we have shown that star-lings alone are sufficient to explain historical spread pat-terns. The numerical dominance of starlings, based on

Modeling Bird-Mediated Invasion 41
Christmas Bird Counts (National Audubon Society 2002;fig. S20), compared with other species that are known (orsuspected) to feed on bittersweet (LaFleur 2006; LaFleuret al. 2007) implicates them as a particularly importantdisperser. From 1960 to 1997, starlings were observed tobe between 6 and 451 times more abundant than all otherpotential avian dispersers combined (mean 77). More re-cently (1998–2009), a dip in starling abundance has beencoupled with an increase in native birds. Nonetheless, star-lings remained an average of 2.3 times more abundantthan all other potential avian dispersers combined.
The timing with which starlings eat bittersweet fruit mayalso be important. Bittersweet tends to be eaten later inwinter when few other fruits are available (N. LaFleur andJ. A. Silander, personal observations). It may provide acritical limiting resource in the winter months when star-vation is a threat, thereby supporting the growth of starlingpopulations. There is high mortality in first-winter star-lings (Kessel 1957), so widely distributed, abundant winterfood resources have the potential to drive populationgrowth. This aspect of their mutualism requires morestudy. The spread of bittersweet is of concern, given thevariety of other bird-dispersed invasive plants beginningto spread across New England (e.g., Euonymous alatus[burning bush], Elaeagnus umbellata [autumn olive], in-vasive Lonicera species [honeysuckles]).
Dynamic Mechanistic Models ComplementStatic Phenomenological Models
Dynamic mechanistic models that link potential and re-alized distributions are a critical complement to morecommonly used static phenomenological models. For ex-ample, comparing the equilibrium potential distributiontypical of many statistical models to GB model predictionsfor a particular time period (e.g., present or future) iden-tifies high-risk areas for future spread, as we demonstratebelow.
Comparison of our GB model predictions in 2009 to ahierarchical Bayesian (HB) generalized linear regressionmodel for bittersweet (Ibanez et al. 2009a) illustrates theimportance of multimodel inference. The HB model pre-dicts the potential distribution (probability of presence atequilibrium; reproduced in fig. 3a) on the basis of thesame heterogeneous landscape lattice as our model butwithout reference to any dispersal mechanisms. It alsoaccounts for smaller-scale variation through site-level hab-itat characteristics, canopy closure, proportion of eachLULC class within each cell, and a suite of climate vari-ables. If we interpret the proportion of GB model runs asa probability of presence, the two models can be directlycompared by plotting the difference between their pre-dicted probabilities of presence (fig. 3b).
Our model shares many predictions with the HB modelbut also differs in some important ways. Both modelspredict that southern New England is almost completelycolonized by bittersweet, even in low-suitability coniferouslandscapes. The HB model predicted minimal occurrencein Vermont, while the GB model predicted ample spreadthere by 2000 (fig. 3). The clumps of suitable habitat inVermont combined with potentially dense propagule rainoriginating from more favorable southern populationsmay be sufficient to offset the climatic limitations pre-dicted by the HB model. In coastal Maine, the HB modelpredicts high suitability while the GB model predicts nospread into this region. This comparison suggests thatthere may be sufficient suitable habitat should bittersweetreach the region. Identifying differences such as these be-tween models can guide management by locating high-risk areas and predicting the timescales over which spreadwill occur. These examples provide just a glimpse of theadvantages of using complementary modeling strategiesand represent an important area for future research.
Generalizing the Model
Our model is general and can easily be adapted to studyother systems. Parameters may be estimated with differentor fewer data than we have demonstrated here; pattern-oriented parameterization combined with sensitivity anal-ysis can ensure that the uncertainty in parameter valuesdoes not lead to qualitatively different predictions. Forexample, one might lack explicit information regardinglandscape use by birds, but more general kinds of obser-vation can broadly identify the landscape types used bymany birds, while sensitivity analysis can be used to testthe importance of precise parameter values.
The grid can be modified to represent any spatial scale.Population units can be scaled for different spatial andtemporal resolutions and different measures of populationsize. Large carrying capacities can be used to representindividual plants/larger cells, or smaller carrying capacitiescan indicate plant populations/smaller cells. If smaller cellsare used, one might consider an individual-based model(Grimm and Railsback 2005). A demographic model forplants can be easily incorporated within each cell to de-termine plant population growth rates and the number ofseeds available for dispersal (Grimm and Railsback 2005;Jongejans et al. 2008b). Population growth rates can beestimated from a variety of sources and need not be gen-erated from small-scale transplant experiments, as we havedone here. The dispersal rates can also be scaled, withlarger mean distances indicating smaller cell size. Localdispersal kernels can be constructed for any dispersal agent(e.g., wind, passive, animal; e.g., Greene et al. 2004; Bullock
42 The American Naturalist
et al. 2006). A more detailed treatment of LDD is possiblewhen particular dispersal agents are known or suspected.
The simplicity of the model allows for quick and effi-cient exploration of different parameter scenarios to ex-plore broadscale patterns when precise empirical data areunavailable. Sensitivity analysis can easily reveal relativelymore and less important parameters, which can be usedto refine data collection plans. Further refinements are alsopossible; incorporation of climatic variables or modelinga temporally variable landscape may be the most infor-mative. For example, if many populations are observed,growth rates could be regressed on environmental covar-iates, and regression predictions could be used to estimategrowth rates in an arbitrary cell from GIS maps of co-variates. Ultimately, however, part of our model’s appealis its simplicity. Given this attribute and the coarse spatialscale, it is encouraging that we can predict spread withsome degree of confidence.
Acknowledgments
We are grateful to J. Allen, C. Elphick, I. Ibanez, R. Mack,L. Meyerson, J. Molofsky, D. Richardson, and S. Treanorfor helpful comments that improved the manuscript. Thiswork was funded by the following grants: National ScienceFoundation DEB-0640713 to M.R. and J.A.S.; NationalResearch Initiative–Cooperative State Research, Education,and Extension Service–U.S. Department of Agriculture(NRI-CSREES-USDA) 2003-35320-13453 to M.R. andN.L.; NRI-CSREES-USDA 2005-02217 to J.A.S.; and a Re-search Assistantship Award to C.M. from the Center forEnvironmental Science and Engineering at the Universityof Connecticut.
Literature Cited
Berger, U., C. Piou, K. Schiffers, and V. Grimm. 2008. Competitionamong plants: concepts, individual-based modelling approaches,and a proposal for a future research strategy. Perspectives in PlantEcology, Evolution, and Systematics 9:121–135.
Borrough, P. A., and R. A. McDonnell. 1998. Principles of geograph-ical information systems. Oxford University Press, New York.
Boyce, M. S., P. R. Vernier, S. E. Nielsen, and F. K. A. Schmiegelow.2002. Evaluating resource selection functions. Ecological Modelling157:281–300.
Bullock, J. M., K. Shea, and O. Skarpaas. 2006. Measuring plantdispersal: an introduction to field methods and experimental de-sign. Plant Ecology 186:217–234.
Cabe, P. R. 1993. European starling (Sturnus vulgaris). The Birds ofNorth America, ed. A. Poole and F. Gill. No. 48. Academy ofNatural Sciences, Philadelphia; and American Ornithologists’ Un-ion, Washington, DC.
Cannas, S. A., D. E. Marco, and M. A. Montemurro. 2006. Long
range dispersal and spatial pattern formation in biological inva-sions. Mathematical Biosciences 203:155–170.
Clark, J. S., M. Lewis, and L. Horvath. 2001. Invasion by extremes:population spread with variation in dispersal and reproduction.American Naturalist 157:537–554.
CLEAR (Center for Land Use Education and Research). 2006. Im-agery. University of Connecticut, Haddam.http://clear.uconn.edu/data/imagery.htm.
Evans, K. L., S. E. Newson, and K. J. Gaston. 2009. Habitat influenceson urban avian assemblages. Ibis 151:19–39.
Feare, C. J. 1984. The starling. Oxford University Press, Oxford.Foster, D. R. 1992. Land-use history (1730–1990) and vegetation
dynamics in central New England. Journal of Ecology 80:753–772.Franklin, J. 2009. Mapping species distributions: spatial inference
and prediction. Cambridge University Press, Cambridge.———. 2010. Moving beyond static species distribution models in
support of conservation biogeography. Diversity and Distributions16:321–330.
Gallien, L., T. Munkemuller, C. Albert, I. Boulangeat, and W. Thuiller.2010. Predicting potential distributions of invasive species: whereto go from here? Diversity and Distributions 16:341–352.
Greene, D. F., C. D. Canham, K. D. Coates, and P. T. Lepage. 2004.An evaluation of alternative dispersal functions for trees. Journalof Ecology 92:758–766.
Grimm, V., and S. F. Railsback. 2005. Individual-based modeling andecology. Princeton University Press, Princeton, NJ.
Guitian, J., M. Fuentes, T. Bermejo, and B. Lopez. 1992. Spatialvariation in the interactions between Prunus mahaleb and frugiv-orous birds. Oikos 63:125–130.
Higgins, S. I., and D. M. Richardson. 1996. A review of models ofalien plant spread. Ecological Modelling 87:249–265.
———. 1999. Predicting plant migration rates in a changing world:the role of long-distance dispersal. American Naturalist 153:463–475.
Higgins, S. I., D. M. Richardson, and R. M. Cowling. 2001. Validationof a spatial simulation model of a spreading alien plant population.Journal of Applied Ecology 38:571–584.
Higgins, S. I., R. Nathan, and M. L. Cain. 2003. Are long-distancedispersal events in plants usually caused by nonstandard meansof dispersal? Ecology 84:1945–1956.
Holbrook, K. M., and T. B. Smith. 2000. Seed dispersal and movementpatterns in two species of Ceratogymna hornbills in a West Africantropical lowland forest. Oecologia (Berlin) 125:249–257.
Hui, C., R. M. Krug, and D. M. Richardson. 2010. Modelling spreadin invasion ecology: a synthesis. In D. M. Richardson, ed. Fiftyyears of invasion ecology: the legacy of Charles Elton. Wiley-Blackwell, Oxford. doi:10.1002/9781444329988.ch25.
Ibanez, I., J. A. Silander, J. M. Allen, S. A. Treanor, and A. Wilson.2009a. Identifying hotspots for plant invasions and forecastingfocal points of further spread. Journal of Applied Ecology 46:1219–1228.
Ibanez, I., J. A. Silander, A. M. Wilson, N. LaFleur, N. Tanaka, andI. Tsuyama. 2009b. Multivariate forecasts of potential distributionsof invasive plant species. Ecological Applications 19:359–375.
Jeltsch, F., and K. A. Moloney. 2002. Spatially-explicit vegetationmodels: what have we learned? Progess in Botany 63:326–343.
Jeltsch, F., M. S. Muller, V. Grimm, C. Wissel, and R. Brandl. 1997.Pattern formation triggered by rare events: lessons from the spreadof rabies. Proceedings of the Royal Society B: Biological Sciences264:495–503.

Modeling Bird-Mediated Invasion 43
Jongejans, E., K. Shea, O. Skarpaas, D. Kelly, A. W. Sheppard, andT. L. Woodburn. 2008a. Dispersal and demography contributionsto population spread of Carduus nutans in its native and invadedranges. Journal of Ecology 96:687–697.
Jongejans, E., O. Skarpaas, and K. Shea. 2008b. Dispersal, demog-raphy and spatial population models for conservation and controlmanagement. Perspectives in Plant Ecology, Evolution, and Sys-tematics 9:153–170.
Kessel, B. 1957. A study of the breeding biology of the Europeanstarling (Sturnus vulgaris L.) in North America. American MidlandNaturalist 58:257–331.
Kot, M., M. A. Lewis, and P. vandenDriessche. 1996. Dispersal dataand the spread of invading organisms. Ecology 77:2027–2042.
LaFleur, N. 2006. The fruits of success: examining the contributionsof avian seed dispersal to the spread of invasive, woody, fleshy-fruited plants. PhD diss. University of Connecticut, Storrs.
LaFleur, N. E., M. A. Rubega, and C. S. Elphick. 2007. Invasive fruits,novel foods and choice: an investigation of European starling andAmerican robin frugivory. Wilson Journal of Ornithology 119:429–438.
LaFleur, N. E., M. Rubega, and J. Parent. 2009. Does frugivory byEuropean starlings (Sturnus vulgaris) facilitate germination in in-vasive plants? Journal of the Torrey Botanical Society 136:332–341.
Latimer, A. M., S. Banerjee, H. Sang, E. S. Mosher, and J. A. Silander.2009. Hierarchical models facilitate analysis of large data sets: acase study of invasive plant species in the northeastern UnitedStates. Ecology Letters 12:144–154.
Leicht, S. A. 2005. The comparative ecology of an invasive bittersweetspecies (Celastrus orbiculatus) and its native congener (C. scan-dens). PhD diss. University of Connecticut, Storrs.
Leicht-Young, S. A. 2007. Comparative performance of invasive andnative Celastrus species across environmental gradients. Oecologia(Berlin) 154:273–282.
Levey, D. J., B. M. Bolker, J. J. Tewksbury, S. Sargent, and N. M.Haddad. 2005. Effects of landscape corridors on seed dispersal bybirds. Science 309:146–148.
Levey, D. J., J. J. Tewksbury, and B. M. Bolker. 2008. Modelling long-distance seed dispersal in heterogeneous landscapes. Journal ofEcology 96:599–608.
Manly, B. J. F., L. McDonald, D. L. Thomas, T. L. McDonald, andW. P. Erickson. 2002. Resource selection by animals: statisticaldesign and analysis for field studies. Springer, New York.
Mehrhoff, L. J., J. A. Silander Jr., S. A. Leicht, E. S. Mosher, and N.M. Tabak. 2003. IPANE: invasive plant atlas of New England. De-partment of Ecology and Evolutionary Biology, University of Con-necticut, Storrs. http://www.ipane.org.
Moody, M. E., and R. N. Mack. 1988. Controlling the spread of plantinvasions: the importance of nascent foci. Journal of Applied Ecol-ogy 25:1009–1021.
Morrison, D., and D. F. Caccamise. 1990. Comparison of roost useby three species of communal roostmates. Condor 92:405–412.
Mosher, E. S., J. A. Silander Jr., and A. M. Latimer. 2009. The roleof land use history in major invasions by woody plant species inthe northeastern North American landscape. Biological Invasions11:2317–2328, doi:10.1007/s10530-008-9418-8.
Nathan, R., and H. C. Muller-Landau. 2000. Spatial patterns of seeddispersal, their determinants and consequences for recruitment.Trends in Ecology & Evolution 15:278–285.
National Audubon Society. 2002. The Christmas Bird Count histor-ical results. http://birds.audubon.org/christmas-bird-count.
National Oceanic and Atmospheric Administration. 1995–. Thecoastal change analysis program. NOAA Coastal Services Center,Charleston, SC. http://www.csc.noaa.gov/crs/lca/ccap.html.
Ostendorf, B., D. W. Hilbert, and M. S. Hopkins. 2001. The effectof climate change on tropical rainforest vegetation pattern. Eco-logical Modelling 145:211–224.
Perry, G. L. W., and N. J. Enright. 2002. Spatial modelling of land-scape composition and pattern in a maquis–forest complex, MontDo, New Caledonia. Ecological Modelling 152:279–302.
R Development Core Team. 2009. R: a language and environmentfor statistical computing. R Foundation for Statistical Computing,Vienna. http://www.r-project.org.
Richardson, D. M., N. Allsopp, C. M. D’Antonio, S. J. Milton, andM. Rejmanek. 2000. Plant invasions: the role of mutualisms. Bi-ological Reviews 75:65–93.
Russo, S. E., S. Portnoy, and C. K. Augspurger. 2006. Incorporatinganimal behavior into seed dispersal models: implications for seedshadows. Ecology 87:3160–3174.
Sallabanks, R. 1993. Hierarchical mechanisms of fruit selection byan avian frugivore. Ecology 74:1326–1336.
Schmolke, A., P. Thorbek, D. L. DeAngelis, and V. Grimm. 2010.Ecological modelling supporting environmental decision making:a strategy for the future. Trends in Ecology & Evolution 25:479–486.
Schurr, F. M., O. Steinitz, and R. Nathan. 2008. Plant fecundity andseed dispersal in spatially heterogeneous environments: models,mechanisms and estimation. Journal of Ecology 96:628–641.
Schutzenhofer, M. R., T. J. Valone, and T. M. Knight. 2009. Herbivoryand population dynamics of invasive and native lespedeza. Oec-ologia (Berlin) 161:57–66.
Silvertown, J., M. Franco, I. Pisanty, and A. Medoza. 1993. Com-parative plant demography: relative importance of life-cycle com-ponents to the finite rate of increase in woody and herbaceousperennials. Journal of Ecology 81:465–476.
Tsoar, A., D. Shohami and R. Nathan. 2010. A movement ecologyapproach to study seed dispersal and plant invasion: an overviewand application of seed dispersal by fruit bats. In D. M. Richardson,ed. Fifty years of invasion ecology: the legacy of Charles Elton.Wiley-Blackwell, Oxford. doi:10.1002/9781444329988.ch9.
Vellend, M., J. A. Myers, S. Gardescu, and P. L. Marks. 2003. Dispersalof Trillium seeds by deer: implications for long-distance migration.Ecology 84:1067–1080.
Wenny, D. G. 2001. Advantages of seed dispersal: a re-evaluation ofdirected dispersal. Evolutionary Ecology Research 3:51–74.
Will, H., and O. Tackenberg. 2008. A mechanistic simulation modelof seed dispersal by animals. Journal of Ecology 96:1011–1022.
Willson, M. F. 1993. Dispersal mode, seed shadows, and colonizationpatterns. Vegetatio 107/108:261–280.
Winkler, E. 2006. Recent trends in plant-ecological modelling: speciesdynamics in grassland systems. Progress in Botany 67:420–440.
With, K. A. 2002. The landscape ecology of invasive spread. Con-servation Biology 16:1192–1203.
Associate Editor: Volker GrimmEditor: Judith L. Bronstein