developing optimal input design strategies in cancer
TRANSCRIPT

Developing Optimal Input Design Strategies in Cancer Systems Biology with Applications to Microfluidic Device Engineering
CitationMenolascina, Filippo, Domenico Bellomo, Thomas Maiwald, Vitoantonio Bevilacqua, Caterina Ciminelli, Angelo Paradiso, and Stefania Tommasi. 2009. Developing optimal input design strategies in cancer systems biology with applications to microfluidic device engineering. BMC Bioinformatics 10(Suppl 12): S4.
Published Versiondoi:10.1186/1471-2105-10-S12-S4
Permanent linkhttp://nrs.harvard.edu/urn-3:HUL.InstRepos:4774125
Terms of UseThis article was downloaded from Harvard University’s DASH repository, and is made available under the terms and conditions applicable to Other Posted Material, as set forth at http://nrs.harvard.edu/urn-3:HUL.InstRepos:dash.current.terms-of-use#LAA
Share Your StoryThe Harvard community has made this article openly available.Please share how this access benefits you. Submit a story .
Accessibility

BMC Bioinformatics
ResearchDeveloping optimal input design strategies in cancer systemsbiology with applications to microfluidic device engineeringFilippo Menolascina*1,2,5, Domenico Bellomo3,6,7, Thomas Maiwald4,Vitoantonio Bevilacqua1, Caterina Ciminelli1, Angelo Paradiso5
and Stefania Tommasi5
Address: 1Department of Electrical Engineering and Electronics, Technical University of Bari, Via E. Orabona 4, 70125, Bari, Italy, 2Systems andSynthetic Biology Laboratory, Telethon Institute of Genetics and Medicine, Via Pietro Castellino 111, 80131, Naples, Italy, 3Information andCommunication Theory Group, Faculty of Electrical Engineering, Mathematics and Computer Science, Delft University of Technology,Mekelweg 4, 2628 CD, Delft, the Netherlands, 4Department of Systems Biology, Harvard Medical School, 200 Longwood Ave, Alpert 536,Boston, MA 02115, USA, 5Clinical Experimental Oncology Laboratory, National Cancer Institute, Via F. Hahnemann 10, 70126, Bari, Italy,6Bioprocess Technology Section, Department of Biotechnology, Faculty of Applied Sciences, Delft University of Technology, Julianalaan 67,2628 BC Delft, The Netherlands and 7Kluyver Centre for Genomics of Industrial Fermentation, Julianalaan 67, 2628 BC Delft, The Netherlands
E-mail: Filippo Menolascina* - [email protected]; Domenico Bellomo - [email protected];Thomas Maiwald - [email protected]; Vitoantonio Bevilacqua - [email protected];Caterina Ciminelli - [email protected]; Angelo Paradiso - [email protected]; Stefania Tommasi - [email protected]*Corresponding author
from Bioinformatics Methods for Biomedical Complex Systems Applications (NETTAB2008)Varenna, Italy 19–21 May 2008
Published: 15 October 2009
BMC Bioinformatics 2009, 10(Suppl 12):S4 doi: 10.1186/1471-2105-10-S12-S4
This article is available from: http://www.biomedcentral.com/1471-2105/10/S12/S4
© 2009 Menolascina et al; licensee BioMed Central Ltd.This is an open access article distributed under the terms of the Creative Commons Attribution License (http://creativecommons.org/licenses/by/2.0),which permits unrestricted use, distribution, and reproduction in any medium, provided the original work is properly cited.
Abstract
Background: Mechanistic models are becoming more and more popular in Systems Biology;identification and control of models underlying biochemical pathways of interest in oncology is aprimary goal in this field. Unfortunately the scarce availability of data still limits our understandingof the intrinsic characteristics of complex pathologies like cancer: acquiring information for asystem understanding of complex reaction networks is time consuming and expensive. Stimulusresponse experiments (SRE) have been used to gain a deeper insight into the details of biochemicalmechanisms underlying cell life and functioning. Optimisation of the input time-profile, however,still remains a major area of research due to the complexity of the problem and its relevance forthe task of information retrieval in systems biology-related experiments.
Results: We have addressed the problem of quantifying the information associated to anexperiment using the Fisher Information Matrix and we have proposed an optimal experimentaldesign strategy based on evolutionary algorithm to cope with the problem of information gatheringin Systems Biology. On the basis of the theoretical results obtained in the field of control systemstheory, we have studied the dynamical properties of the signals to be used in cell stimulation. Theresults of this study have been used to develop a microfluidic device for the automation of theprocess of cell stimulation for system identification.
Page 1 of 13(page number not for citation purposes)
BioMed Central
Open Access

Conclusion: We have applied the proposed approach to the Epidermal Growth Factor Receptorpathway and we observed that it minimises the amount of parametric uncertainty associated to theidentified model. A statistical framework based on Monte-Carlo estimations of the uncertaintyellipsoid confirmed the superiority of optimally designed experiments over canonical inputs. Theproposed approach can be easily extended to multiobjective formulations that can also takeadvantage of identifiability analysis. Moreover, the availability of fully automated microfluidicplatforms explicitly developed for the task of biochemical model identification will hopefully reducethe effects of the ‘data rich-data poor’ paradox in Systems Biology.
BackgroundOur understanding of molecular basis of complexdiseases is being dramatically changed by systemsinvestigation supported by the most advanced toolsand techniques developed by the scientific community.In particular, cancer investigation has greatly benefitedby systems level approaches since tumor developmentand progression are believed to be among those systemtrajectories that arise from abnormal working states. Thework by Hornberg and colleagues [1] pointed out therelevance of Systems Biology approaches in the study ofdynamics leading to cancer. Epidermal Growth FactorReceptor (EGFR) pathway is one of those biochemicalreaction networks believed to play a central role incancer development. As a matter of fact EGFR andreceptors in the same family (ErbB2, ErbB3 and ErbB4)mediate cell to cell interactions both in organogenesisand in adult tissues [2]. The 40-year long study of thispathway led to associate overexpression of the EGFRfamily members to several types of cancer [3]. Because ofthe high clinical relevance, several efforts have beenspent in the last decades in unravelling the complexdynamics of this biochemical network, as well as infinding potential targets of therapeutic intervention[4-6]. Although global models of EGFR pathway exist[7-12], many questions still remain open both in termsof model accuracy [13-15], parameter identifiability [16]and driving input design [17,18]. In this context we putthe pioneering works by Arkin and colleagues [19-22],van Oudenaarden and colleagues [23] and Steuer andcolleagues [24]. Other recent works have focused on theconnections between optimal experimental design stra-tegies and structural and experimental identifiability analy-sis of biochemical pathways; this is the case of[16,25-28].
Structural identifiability refers to the possibility of findingthe mathematical model of the true system (see [29,30]for references in biological systems investigation), afterhaving applied a specific search strategy in the space ofthe solutions.
Experimental identifiability [31], on the other hand, isrelated to the possibility of finding the mathematical
representation of the true model given a predeterminedset of observations. This is a central aspect of this class ofidentifiability problems since it is more focused on theavailable data and, in particular, on information content.This aspect establishes an interesting bridge betweenSystem Identification Theory and Experimental Design.The Design of Experiments (DOE) is a well developedmethodology in statistics [32] focusing on the design ofall information-gathering exercises where variation ispresent, the main objective of the whole task being themaximisation of the information obtained from experi-ment and the minimisation of the number of experi-ments. This specific task is commonly referred to as‘Optimal Experimental Design’ (OED). This disciplinequickly gained a significant interest among researchersmostly in natural and social sciences but became anactive research field in engineering only with thepioneering work by Lennart Ljung and his standardmodel for dynamical system identification orientedexperiments [33]. This model has been recently modifiedby Phair et al. [34] and Cho et al. [35].
Nevertheless the main idea behind system identificationin Systems Biology remained unchanged [36]. In linewith Fisher’s criteria, Ljung’s scheme [33] suggests todefine a detailed plan of the experiments to be carriedout before starting to collect input-output data from thesystem to be modeled. Specifications like data samplingstrategies and driving inputs should be fixed in order tooptimise the information yield of each experiment andto address the cost minimisation task OED is aimed at.These issues gain an even stronger relevance, if weconsider the so-called ‘data rich-data poor paradox’ [37]resulting from the difficulties and costs involved inSystems Biology related assays. For these reasons and inorder to develop a comprehensive framework for systemidentification in Systems Biology, we will describe how aspecific issue of OED, namely Optimal Input Design(OID), can be addressed using optimality criteria andmicrofluidics-based experiments. As a matter of fact,microfluidic platforms have been shown to provide apowerful tool for the development of data-rich experi-mental strategies able to fill the gap of the previouslycited paradox. Signals obtained in this stage are used as
BMC Bioinformatics 2009, 10(Suppl 12):S4 http://www.biomedcentral.com/1471-2105/10/S12/S4
Page 2 of 13(page number not for citation purposes)

templates for the development of a microfluidic devicefor a flexible and automated platform for affordablesingle-cell experiments in Systems Biology.
In the following paragraphs, we go through a briefintroduction of the EGFR model then we analyse OEDand OID criteria. We review current approaches to cellstimulation in the ‘Methods’ section and compare themwith optimality criteria derived ones. An analysis of theexperimental results follows in ‘Results’, where weintroduce a feasible design of the microfluidic devicethought to speed up the process of data collection inSystems Biology by lowering the costs associated toexperiments. A discussion of the results presented hereinand final cues for further research are given in the lastparagraph.
Results and discussionIn order to model and understand the functionality ofthe EGFR signaling cascade a quantitative description ofthe signal dynamics is of major relevance. For thisreason, we discuss the computational results obtainedfrom in-silico simulations carried out using POTTERSWHEEL
[38]. POTTERWHEEL is a multi-experimental fitting MATLABpackage intended to allow researchers to ease modelanalysis and experimental setup steps. In particular, thispackage is one of the few in Systems Biology providing asimple interface to external input based simulation ofbiological pathways behavior.
To estimate the effects of different inputs on parametersestimates uncertainties, we carried out 1000 identifica-tion experiments for each of the three classes of stimuli,namely: a step input, a persistently exciting input and thetime profile of the stimulation obtained from theoptimisation task. Therefore we plotted a bivariatedistribution of both the Vmax and Km of the first
Michaelis-Menten based reaction ( v Vmax SKm S0 = +
[ ][ ] where
v0 is the initial reaction rate and [S] the substrateconcentration, see ‘Methods’ for a detailed description ofthe mathematical modelling step) in Kholodenko’smodel accounting for the dephosphorylation of theEGF-EGFR dimer. It should be noted that parametercorrelation can greatly affect our ability to successfullyrecover real parameters. This is one of the main issuesarising in the field of parameter idenfitiability. Inparticular parameters that are structurally correlatedcannot be uniquely identified from experiments. Inorder to investigate such peculiarities of our dynamicalmodel we carried out an identifiability analysis based onthe ‘Alternating Conditional Expectation’ algorithm (ACE)method described in [16] and implemented in the MeanOptimal Transformation Approach (MOTA) package. We
present herein the computational results so as to providea tool for comparing the different approaches to OED inSystems Biology.
Identifiability analysisThe statistical investigation of the properties of OED shouldbe a primary goal when the time profile of the input iscomputed. Previous works in this field have focused on thecomparison among alternative designs on the FIM costvalues and confidence intervals [39]. Nevertheless it hasbeen noticed that the FIM is derived from a linearisationsof the least squares thus it may be unreliable in cases ofconsiderably extended non linearities. The non identifia-bility of one of the parameters directly implies thefunctional relationships among at least two of them [16].This phenomenon can be easily observed by plotting thejoint probability distribution of each of them which willshow statistically significant differences if compared withthe expected multivariate normal one. From an algebraicpoint of view this results in the loss of rank of the covariancematrix of the multivariate distribution or, alternatively, acondition number of the same matrix asymtoticallytending to infinity. Then, in order to cope with identifia-bility issues that may arise in identification tasks, wepropose to investigate this property by using the ACEmethod proposed by Hengl and colleagues [16]. MOTApackage is included in POTTERSWHEEL toolbox and is appliedtogether with a linear fit sequence analysis. MOTA detectsgroups of two or more linearly or non-linearly relatedparameters. It revealed some major non-identifiabilities inthe parameter space (results not shown) whose natureshould be certainly investigated in order to understand theircauses and possible solutions. We should remark that anintegrated approach using Monte-Carlo methods for bothexperimental design otpimisation and parameter correla-tion investigation can be a feasible choice. However, weshould consider that this would imply a major rise incomputational costs of the approach resulting fom the highnumber of parameter estimation tasks to be accomplished.Not to mention the issues arising from large scale models,noise and potential multimodality that would certainlyimply using a robust global optimisation algorithm.
Monte-Carlo based analysisSeveral alternative choices to dynamic optimisationmethods have been used in the context of OED, themost widely employed are direct methods such likecomplete parameterisation, control vector parameterisa-tion and multiple shooting approach [39]. Thesemethods are based on the transformation of the originalinfinite dimension optimisation problem into a nonlinear programming problem through the discretisationof the state and the stimuli or only the stimuli and theapproximation of the time dependencies using locally
BMC Bioinformatics 2009, 10(Suppl 12):S4 http://www.biomedcentral.com/1471-2105/10/S12/S4
Page 3 of 13(page number not for citation purposes)

defined function. In this work, we employed a slightlydifferent approach with similar discretisation strategiesbut based on an Genetic Algorithm (GA); for thispurpose we used the implementation provided byMATLAB through the GA routine. It should be notedthat no formal proof of the convergence of GAs can bederived for the problem at hand. However, someproperty of this kind of approaches, just like computa-tional complexity and efficiency can be studied in a moreformal context [40]. We set the population to becomposed by 200 individuals and we used the tourna-ment system as selection criterion; crossover and muta-tion operators were set to ‘uniform’ and ‘heuristic’respectively. All the other options were left at the defaultvalues while constraints on signal amplitude reflectingtechnological limitations were coded in the appropriatearrays (namely A and b for which Ax ≤ b should besatisfied). As previously outlined the fitness function ofthis GA encodes for the FIM associated to the specificexperimental design under investigation. In order toinvestigate if any statistically significant differenceexisted between parametric uncertainties estimatedfrom classical and OED based experiments, we devel-oped a Monte-Carlo based analysis with N = 1000repetitions. We collected parameter estimates for eachidentification experiment. At this stage we carried out anintermediate analysis to find the parameters with thehighest relative uncertainty; we selected the highest two,namely V4 and K4. A c2goodness-of-fit test confirmedthat the probability density function for these para-meters can be well approximated by a normal curve. Inorder to compare the three experimental design selectedwe performed a Gaussian Mixture Model (GMM) fittingof the identified parameters starting from a bivariatedistribution arising from K4 and V4 variables. Estimateswere normalised and then plotted. Figure 1 shows thedistribution of parameters estimates couples fromsustained input experiments; Fig. 2 and 3 show thesame plot for persistently exciting and OID basedesperiments, respectively. The plots show the 95%confidence interval of each distribution computed asthe ellipsoid centered in the mean of the bivariatedistribution and having:
• major semiaxis equal to lmax(Cov)
• minor semiaxis equal to lmin(Cov)
• rotational offset with respect to the the x axis equal to
arctanyeigvxeigv
⎛⎝⎜
⎞⎠⎟
where Cov is the covariance matrix estimated from GMMfitting and lmax/lmin its max and min eigenvalues
Figure 1Scatter plot of the step input-based experimentestimations. The 95% confidence intervals for theparameters V4(on the y axis) and K4(on the x axis) in the caseof estimation based on the step input driven system. Meanvector and covariance matrix are fitted on the data in orderto obtain the best bivariate gaussian distributionapproximating data from in-silico experiments.
Figure 2Scatter plot of the PE input-based experimentestimations. The 95% confidence intervals for theparameters V4 and K4 in the case of estimation based onpersistently exciting input driven system. Mean vector andcovariance matrix are fitted on the data in order to obtainthe best bivariate gaussian distribution approximating datafrom in-silico experiments.
BMC Bioinformatics 2009, 10(Suppl 12):S4 http://www.biomedcentral.com/1471-2105/10/S12/S4
Page 4 of 13(page number not for citation purposes)

respectively, while yeigv and xeigv are the y and xcomponent of the eigenvectors of Cov matrix. Figure 4shows the 95% ellipsoids of the three experimentaldesigns compared. It is evident that the volume of theuncertainty ellipsoids gets minimised by more appro-priate designs. Moreover the OID based strategy provesto be the one providing the best experimental conditionsfor accurate parameter estimation and system identifica-tion. In order to obtain a more quantitative estimationof the information gain provided by OED basedexperiments we performed an Ansari-Bradley test [41]on the estimated parameter values; the Ansari-Bradleytest checks the hypothesis that two independent samplescome from the same distribution, against the alternativethat they come from distributions that have the samemedian and shape but different variances. Pairwise testscarried out on OID vs PE and OID vs step experimentsreturned p-values smaller than 0.01 thus supporting therejection of the null hypothesis and then suggestingevidence of statistically meaningful advantages of OEDbased experiments over both PE and step input basedones.
ConclusionThe intrisic quantitative nature of Systems Biology posesnew issues in everyday laboratory practice. Modelling, inthis context, has long suffered from data shortage; the
‘data rich-data poor’ paradox greatly influenced the pacetowards a comprehensive understanding of molecularmechanisms governing biological systems. Neverthelessthe potential of novel experimental techniques seems topromise new groundbreaking innovations thus increas-ing the versatility of new laboratory protocols andkeeping experiment-associated costs low. Among thesemajor limitations we should certainly mention theability to stimulate cells in chemostats with input havingvery limited harmonic content. Microfluidic technologycurrently allows us to go beyond step like stimulationand to generate complex time-varying signals whosemodulation can be achieved using control engineeringstrategies [42]. The availability of such tools and deviceswill allow us overcome the limits of indicial response forhighly complex and fed-back dynamical systems identi-fication as outlined in [43,44]. In this framework, theability to optimally control and take advantage of thenew methods and devices will be a major focus of thescientific community. This contribution presents, then, amathematical formulation of the problem of optimalexperimental design in Systems Biology by considering acase study of one of the most relevant biologicalpathways for cancer development. Formal derivation ofproblem definition results and heuristic solutions to a
Figure 3Scatter plot of the optimal input-based experimentestimations. The 95% confidence intervals for theparameters V4 and K4 in the case of estimation based onoptimal input driven system. Mean vector and covariancematrix are fitted on the data in order to obtain the bestbivariate gaussian distribution approximating data from in-silico experiments.
Figure 4Comparison of the 95% confidence intervals. Thethree 95% confidence intervals compared; continuous line(step input), dashed line (persistently exciting input) anddotted line (optimal input). A comparison of the boundariesand positions of the ellipsoids puts in evidence that OID-based experiments are characterised by the lowestuncertainty (smallest ellipsoid area) and therefore providethe greatest amount of information on the model.
BMC Bioinformatics 2009, 10(Suppl 12):S4 http://www.biomedcentral.com/1471-2105/10/S12/S4
Page 5 of 13(page number not for citation purposes)
highly non-linear optimisation problem have been bothprovided. In particular we formulated the problem ofOED in Systems Biology as a non-linear optimisationtask in which the amount of information per experi-ment, quantified in the Fisher Information Matrix, isoptimised by varying the stimulus time profile hererepresenting the concentration of extracellular EGFligand. We set up an evolutionary optimisation taskaimed at finding the time sequence of the input signalthat maximises the amount of information associated tothe experiment. Moreover we proposed a statisticalframework based on Monte-Carlo estimates for thecomputation of the uncertainty regions for the parametervalues; identifiability analysis, on the other hand, hasbeen carried out using the ACE approach integrated inPOTTERSWHEEL package. The results shown clearly indicatethat dynamic experiments outperform canonical experi-ments based on sustained or persistently exciting inputs.Nonetheless we should consider that the approachpresented herein depends on the starting model; asequential experimental design should be investigatedin order to overcome this issue. Moreover we shouldconsider that all the simulations reported should bevalidated in a series of experiments. For this reason, weproposed the microfluidic device described in the‘Methods’ section. ‘Labrys’ goes beyond the specificcontext of EGFR and, associated to a Hardware Abstrac-tion Layer like Biosteram [45], is thought to provideresearchers with a fully automated platform for complexexperiment development and implementation. Futurework in this field will certainly require a more tightcollaboration among the different competences in thefield of Systems Biology aimed at the full integration ofboth hardware and software findings for the develop-ment of a common, powerful and versatile platform forsystems oriented experiments.
MethodsModel definitionIn this work, we consider the EGFR signaling networkmodel proposed by Kholodenko and colleagues in [7].This model explores the short term pattern of cellularresponses to epidermal growth factor (EGF) in isolatedhepatocytes and predicts how the cellular response iscontrolled by the relative levels and activity states ofsignaling proteins and under what conditions activationpatterns are transient or sustained. BioModels database[46] provides a selection of the most common fileformats of this model. For our purposes, we will use theSBML version [47] featuring 25 molecular species, 23reactions and 50 parameters. The set of ODEs describingthis model can be extracted using COPASI [48] andtranslated in a MATLAB SIMULINK® model for furthersimulations and analyses. Both mass-action and
Michaelis-Menten kinetics have been used by Kholo-denko and colleagues, resulting in a non-linear model.In order to elicit this pathway with a driving input, weslightly modified it so as to include an external controlfor the ligand species, i.e. the Epidermal Growth Factor.For further experiments we selected POTTERSWHEEL[38]platform; this software provides highly powerful toolsfor the investigation of biological models’ properties(just like parameter fitting and identifiability analysis)and, to the best of our knowledge, is one of the few onesin Systems Biology allowing researchers to easily definetime evolution of forcing inputs without using complexformulations based on events and rules provided bySBML specifications.
We imported Kholodenko’s model in POTTERS WHEEL andwe edited the m-file so as to force EGF to be an input forour system and downstream species as our observablesor outputs. This is a Single Input-Multi Output (SIMO)formulation of the EGFR and will prove to be aninteresting model for the stimulation of interestingbehaviors (e.g. transmission blocking zeros elicitationwhich is a counter-intuitive behavior of some dynamicalsystems which show a null output even if they arestimulated by non-trivial inputs with specific harmoniccontent). For our purpose, however, we will select onlyone downstream species to be observed just like in SingleInput-Single Output systems whose study drove the fieldof dynamical system identification.
Dynamical systems identificationBiological systems, just like any other dynamical system,can be described by a number of mathematical toolsbeing ODEs an easy way to investigate systems’ proper-ties and Stochastic Differential Equations (SDE) moreappropriate when small copy numbers of moleculesdrive system’s dynamics. We will focus on the formerrepresentation approach since it’s more appropriate incase of cell population-based studies (the most commonones in current practice and in many of currentmicrofluidics-based experiments). In ODEs based mod-els we distinguish state variables r
x , inputs ru and
outputsry ; from now on bold notation will be used in
place of the vector one for readability sake. We definetime evolution of these entities by adding to them timedependence, obtaining xi(t) i = 1,..., n, uj(t) j = 1,..., mand yk(t) k = 1,..., p respectively. We can use a set of ODEsto represent the state change through time:
&x f x u( ) ( ( ), , ( ))t t t= qq (1)
Time evolution of the system state x(t) ΠRn can be easilyderived by solving the system of differential equations inEq. 1 and imposing constraints on initial conditions x(0). Notice that the rate of change of xi depends, in
BMC Bioinformatics 2009, 10(Suppl 12):S4 http://www.biomedcentral.com/1471-2105/10/S12/S4
Page 6 of 13(page number not for citation purposes)

general non-linearly, on state variables xj, j = 1,..., n, oninput trajectories ui and on parameters vector θ.
In order to explain this representation choice we will gothrough a brief example. Consider a simple isomerisa-tion reaction
A Bk→
1
if we were to model this reaction using mass-actionkinetics we would model the time evolution of thesespecies using the following set of ODEs (using A for theconcentration [A])
dAdt
k A= − ⋅1 (2)
dBdt
k A= ⋅1 (3)
Notice that, in order to solve these ODEs, at least twoquantities are required: k1 and the inititial concentrationof A species, A(0). The parameters vector θ is usuallyintended to collect these quantities.
Accurate identification of parameters governing thedynamics of biochemical reaction networks is currentlyconsidered a major challenge in Systems Biology. In fact,even though some control on initial concentration ofspecies can be obtained with experimental protocols(e.g. starvation), rate coefficients are driven by severalexternal factors (temperature, PH etc.) in a very complexway. Moreover accurate parameters estimation is a keystep for the elicitation of interesting behaviors in cellularpathways [49].
Unfortunately the number of observable species isusually lower than the experimenter would want. Forthis reason we define the yM(t, θ) Œ Rp as the vector ofmeasurable molecular species in an assigned experimentand we write
y u g x uMi it t i n( , , ) ( ( , , )) ,...,qq qq= = 1 (4)
The observations yO(ti) ΠRp are then given by
y y uOi
Mi it t i n( ) ( , , ) ,...,= + =qq0 1e (5)
with
e sij ijN i n j p= = =( , ) ,..., , ...,0 1 12 (6)
where we denoted the true parameter vector with θ0.Here εi Œ Rp describes the gaussian component of theerror at time ti. We notice that the observation function
g(·) together with the input function u(·) and the set ofsampling times t fully defines the experimental design. Inthis we glimpse the triple nature of OED which aims atestablishing optimal strategies for (a) sampling time[50], (b) species to be measured [17] and (c) inputselection [18].
Optimal experimental design in systems biologyAs previously stated OED has its main objective inmaximising the information yield returned by anexperiment. This is a central aspect in everyday practicein Systems Biology since experiments can be both highlyexpensive and time-consuming, limiting practical fas-ibility of otherwise promising protocols. Applications ofOED in Systems Biology have been described in[17,51-55]; in particular [54,56-60] have focused onmodel discrimination by OED. Experimental designs areusually categorised as starting and sequential designs.
In starting designs no data have been previously collectedand the experimenter is interested in drawing themaximum amount of information from the experimentto be planned. This is done by minimising (or maximis-ing) a specified objective function. Within this categorywe identify two subcategories: exact and continuous designs.
Exact designs have their own objective in the optimalplacement of a finite number of design points [61]; onthe other hand continuous designs deal with the selectionof a design measure, h, which is equivalent to aprobability density over the design space.
Sequential designs try to develop optimal strategies formodel refinement of a pre-existing model [62]. In thispaper we will focus on a semi-sequential approach thatcan be considered a sequential design in that it starts from acompiled dynamic model of the EGFR pathway, but wedo not use the results of this design to carry out furtheridentification experiments since this would require nonstandard technological platforms. Given the potentialimpact of OED strategies on Systems Biology research,some researchers proposed software packages providingthe user with significant opportunities for optimalexperiments planning [63-65]. All of these packages arebuilt on the principles of optimality and based onmetricsbeing defined on the Fisher Information Matrix. This is aquite general framework for OED; unfortunately none ofthem currently provides a solution for Optimal InputDesign. We will analyse this and other issues related tobiochemical pathway stimulation in the next sections.
Optimal input designOptimal Input Design for system identification providesseveral alternative measures of the identified model
BMC Bioinformatics 2009, 10(Suppl 12):S4 http://www.biomedcentral.com/1471-2105/10/S12/S4
Page 7 of 13(page number not for citation purposes)

being used for optimal design [66]. Here we start byreporting some of the main results in the field [33] andthen we discuss their implications in the specific case.Several contributions in this field focused on theminimisation of some measure of the variance of theestimated parameters like Fisher Information Matrixwhich can be used to estimate variance-uncertaintyassociated to parameter estimates. This process will beanalysed in the next section; in this paragraph we willfocus on a theoretical study of the OID for dynamicsystems identification. Identification processes start withdata collected on Input-Output behavior of the systemunder investigation.
Let the true system be described as:
: ( ) ( , ) ( ) ( , ) ( )( ) ( )
y s G s u s H s e sG s v s
= +q q0 0
0
124 34 1 24 34 (7)
for some initially unknown parameter vector θ0 Œ Rk,where e(s) is white noise of variance s e
2 , while G(s, θ0)and H(s, θ0) are stable transfer function (a simplefrequency-based representation of the input-outputbehavior of linear systems), with H(s, θ0) monic andminimum-phase. In most of the literature concernedwith identification issues it is assumed that the system isidentified with a model structure
= ∈{ ( , ), ( , )},G s H s kq q q R (8)
In general if ZN is our source data set composed by theobservation data we would want to fit these data to themodel structure ℳ. ℳ describes a set of models ℳ*within which the best one is sought for. In thisframework we could argue that identifiability of modelstructure, as it was previously defined, concerns thequestion whether different parameter vectors maydescribe the same model in the set ℳ*. However astrictly related question is whether the data set Z∞ allowsus to distinguish between different models in the set. Inthis context we say that a data set can be defined‘informative’ if it allows us to distinguish amongdifferent models. We say that a quasi-stationary dataset Z∞ is informative enough with respect to the model set ℳ*if, for any two models W1(q) and W2(q) in this set:
E W q W q z t[( ( ) ( ) ( ))]1 22 0− =
which implies that:
W e W ej j1 2( ) ( )w w≡
for almost all ω. On the other hand a quasi-stationarydata set Z∞ is informative if it is informative enough withrespect to the model set ℓ* consisting of all linear, time
invariant (LTI) models. The concept of informativedataset is tightly related to concept of persistently excitinginputs. This can be seen easily by observing that a quasi-stationary dataset Z∞ is informative if the spectrum matrixfor z(t) = [u(t) y(t)]T is strictly positive definite for almostall ω. In fact, if we consider two models W1(q) andW2(q) and denote W q( ) = W1(q) - W2(q), applying awell known theorem on signal filtration [33], we canwrite:
W e W e djz
T j( ) ( ) ( )w ww wΦ −
−∞
+∞=∫ 0
with Fx(ω) spectrum of the signal x(t) and where
ΦΦ ΦΦ Φz
uu uy
yu yy( )
( ) ( )
( ) ( ).w
w ww w
=⎡
⎣⎢
⎤
⎦⎥
Since Fz(ω) is positive definite, this implies thatW e j( )w ≡ 0 almost everywhere that proves the previousstatement. Moreover we can observe that, given theFz(ω), for the Schur’s Lemma we can assure algorithmconvergence only if Fu(ω) > 0 and Fuu(ω) - Fuy(ω)Fyy(ω) Fyu (ω) > 0. Evidently the only block of this arraywe have control on is the one representing the spectrumof input signal which directly depends on dynamicalproperties of the driving input signal we design. It istherefore convenient to reintroduce the concept ofpersistently exciting signal of order n for a quasi-stationarystimulus u(t): we say that a similar signal, with spectrumFu(ω) is persistently exciting of order n is, for all filters ofthe form Mn (q) = m1q
-1 + ... + mnq-n the relation
| ( ) | ( )M enj
uw w2 0Φ ≡ implies that | ( ) |M en
jw ≡ 0 . Evi-dently the function Mn (z) Mn (z-1) can have n - 1different zeros on the unit circle (since one zero is alwaysat the origin) taking symmetry into account. Hence u(t)is persistently exciting of order n if Fu(ω) is differentfrom zero on at least n points in the interval -π ≤ ω ≤ π.This is a direct consequence of the definition.
Signals that show such properties have been investigatedand include:
• Pseudo Random Binary Signal
• Generalised Binary Noise (or Random Binary Signal)
• Sum of Sines and Filtered Noise
• Coloured Noise
Notice that this is a rather general result for the class ofsystems considered herein. Nevertheless a similar argu-mentation can be carried out by considering an
BMC Bioinformatics 2009, 10(Suppl 12):S4 http://www.biomedcentral.com/1471-2105/10/S12/S4
Page 8 of 13(page number not for citation purposes)

information metric directly tied to experimental data andto the model to be identified. These results arecommonly derived from the analysis of some metricon the Fisher Information Matrix which are commonlyreferred to as ‘Optimality criteria’.
Optimality criteriaAs we previously outlined, we can estimate the informa-tion content of a measurement by the covariance matrixΣ of the estimated parameters. In order to illustrate howthis can be done we will consider a simple estimationproblem based on a widely used estimator: MaximumLikelihood Estimator (notice that these results can beextended to the Least Squares Estimator [67]). If weassume a normally distributed noise the identificationprocess can be reduced to find θ that minimises:
cs
2
11
2
( )( ) ( . , )
qqqq
=−⎛
⎝
⎜⎜⎜
⎞
⎠
⎟⎟⎟==
∑∑y jD ti y j
M ti u
iji
N
j
L
(9)
The asymptotic distribution of the least squares estimateq̂q can be computed analytically; then for a large numberof observed samples the difference between real andestimated parameters tends to 0. For this reason, ratherthan minimising Eq. 9 directly, we linearise the functionyj(ti,·) around θ0 and minimise this simpler function.Using the Taylor series expansion of y tj
Mi( , )q around θ0
we obtain
y t u y t u y
y t u g
jM
i jM
i j t
jM
i
i( , , ) ( , , ) | ( )
( , , )
,qq qq qq qq
qq qq
= + ∇ −
= + ∇
0 0
0
0
jj x jT
kT T
t
jM
i
g x x
y t u
i∇ ∇ ∇( )⎧
⎨⎩
⎫⎬⎭
−
= + ∇
[ ] [ ] | ( )
( , , )
,qq qq qq qq qq
1 L0 0
0 q yy t u ojM
iT( , , ) ( )qq qq qq0 Δ Δ+
where Δθ = θ-θ0 and ∇ is the so called nabla differentialoperator defined as
Δqq = ∂∂
∂∂ +
⎛
⎝⎜
⎞
⎠⎟q q1
,...,n k
T
(10)
and o(hk) refers to the family of functions w(h) for which
lim( )
h
w h
hk→=
00 (11)
Substituting these results in the minimisation of thefunctional, we obtain
ce
s
e
sq
s2
2
22
212
( ) ( , ) [ ] [ ] [qq qq qqqq qq qq= − ∇ + ∇ ∇ij
ij
ij
ij
y t
ij
y yi iT
jT
jΔ Δ ]] | ,
⎛
⎝
⎜⎜⎜
⎞
⎠
⎟⎟⎟
⎡
⎣
⎢⎢⎢
⎤
⎦
⎥⎥⎥==
∑∑ t
i
N
j
L
i qq qq0Δ
11
The minimisation of c2(θ) with respect to θ brings to thefollowing equation for the estimated deviation of theparameter vector Δθ
12
2
11 s
e
s
ij
y y F
ij
ij
y
i
N
jT
j
j
P
j
[ ] [ ] :
[
∇ ∇⎧⎨⎪
⎩⎪
⎫⎬⎪
⎭⎪=
= ∇
==∑∑ qq qq
qq qqΔ Δ
]]T
i
N
j
P
==∑∑
11
where we identified in F y yij
jT
ji
N
j
P= ∇ ∇== ∑∑ 1211 s
[ ] [ ]qq qq
the so called Fisher Information Matrix. Then we can solvethe last equation
Δqq qq= ∇−
==∑∑F
ij
ij
y jT
i
N
j
P1
112
e
s[ ] (12)
Therefore we can compute the covariance matrix of theparameter vector as
Σ Δ= ⟨ ⟩ = −qqqq T F 1 (13)
In order to compute this matrix we need the derivationsof the observation function with respect to the para-meters, ∇θyj(ti). We then need to compute the derivativeof g with respect to θ and x. In addition the derivation of∇θxk(ti) has to be computed from the system of ordinarydifferential equations,
∂∂
∇ = ∂∂
∇ + ∇=∑t
xfk
xrx fk r k
r
k
( )( , )
( , )qq qqqq qqx
xq1
(14)
with the initial conditions (∇θ xk) (0) = ∇θ xk(0). Giventhe Fisher Information Matrix (and thus the covariancematrix of the estimated parameters) the asymptoticconfidence intervals for the estimates can be computedfrom the multivariate normal distribution
pDet F
Pe
T F
( )( )
[ ]
q
p
=−
2 2
12
qq qq
(15)
We should also notice that, given the Cramer-Rao bound
EF
[ ]q 2 1≥ (16)
we can easily derive a lower bound for the efficacy of ageneral and unbiased estimator that directly depends
BMC Bioinformatics 2009, 10(Suppl 12):S4 http://www.biomedcentral.com/1471-2105/10/S12/S4
Page 9 of 13(page number not for citation purposes)

only on the Fisher Information Matrix. Evidently, thesmaller the joint confidence intervals for the estimatedparameters are, the more information the experimentcarries with it. We can summarise the information aboutthe variability in the covariance matrix into a singlenumber by using metrics like Det(F), max(li) (with lirepresenting the ith eigenvalue of F). This is where thealternative choice of optimality criteria arises. We candistinguish four major measures of the informationcontent [32]:
• A-Optimal design: maximising trace(F)• D-Optimal design: minimising Det(Σ)• E-Optimal design: minimising lmax(Σ)• Modified E-Optimal design: minimising l
lmaxmin
( )( )ΣΣ
A-Optimal designs are rarely used since they can lead tonon-informative experiments [68]. D-Optimal designscan be interpreted as geometric means minimisation ofthe errors in the parameter estimates. E-Optimal andModified E-Optimal designs try to minimise the largestuncertainty and the ratio of the largest and smallestuncertainties among parameter estimates respectively.Given the characteristics of each of these criteria and thecomputational efforts required for the specific problemwe selected D-Optimality as driving criterion for ourinput design task.
Computational implementationIn order to carry out the optimisation of the input timeprofile we set up an optimisation routine based on aGenetic Algorithm (GA) thought to minimise an objectivefunction encoding the D-Optimality metric on the FIM.Here we present a pseudocode of the proposed approach.
Algorithm 1 Genetic_Algorithm(population, Fitness_Func-tion) returns individual
while {an individual has a fitness value higher(lower)thanthreshold} do
new_population ← ∅
for i from 1 to Dim(population) do
x ← Random_Selection(population, Fitness_Function)
y ← Random_Selection(population, Fitness_Function)
descendant ← Reproduction(x, y)
if small_random_probability ← new_population then
new_population ← new_population ∪ descendant
end if
population ← new_population
end for
end while
return best individual evaluated on the Fitness_Funtion
Algorithm 2 Reproduction(x, y) returns individual
x ← Length(x)
c ← random number in the range {0, n}
return Append(Substring(x, 1, c), Substring(y, c + 1, n))
Algorithm 3 Fitness Function x(x) returns fitness value
input ← x
time_evolution ← Simulate(EGFR pathway, input, θ)
FIM ← Fisher_Information_Matrix(time_evolution)
return FIM
Algorithm 1 shows how the optimisation task is carriedout: here an individual encodes the time profile of theligand concentration outside the cell. While the FitnessFunction (FF) is used to estimate the quality of the singleindividual, mutation and crossover operators boost thesearch space exploration of the GA. This approachshould help the algorithm returning the best solution(individual) to the input optimisation problem byoptimising, generation after generation, the fitnessvalue of the invididuals in the population.
Microfluidic device designImplementing complex time-varying signals is quitesimple from a computational point of view; howeverobtaining realisations of signals with such properties is anactive area of research in current microfluidics. Develop-ing geometries that satisfy physical conditions for thegeneration of signals compliant with the specificationsimposed by the theoretical results is not a trivial task.Several alternative solutions have been proposed forsignal modulation inmicrofluidic channels [69-74] being[42,75,76] the most recent and advanced contribution inthis fields; they are based on diverse physical principleslike boundary diffusion controlled by relative velocity(like in H filters [74]), by exciting cells with diverselaminar flows that affect different parts of the cell etc.
BMC Bioinformatics 2009, 10(Suppl 12):S4 http://www.biomedcentral.com/1471-2105/10/S12/S4
Page 10 of 13(page number not for citation purposes)
In particular two main areas of research arose in thiscontext: on the one hand interesting phenomena in fluiddynamics have been investigated [77,78] in order toaddress the problem of cell stimulation via contrainedsignals [79,80]; on the other hand the area of DigitalMicrofluidics has found one of its most active fields ofresearch. In order to implement the signals obtainedfrom the previously described input optimisation taskwe propose a polydimethilsiloxane (PDMS) based plat-form for cell stimulation which exploits the signalmodulation at the microliter level. This platform hasbeen designed to implement spectral properties of thesignals that have been characterised during the theore-tical study of the system under investigation: in this wayit will became part of the optimal experimental designfor cell stimulation.
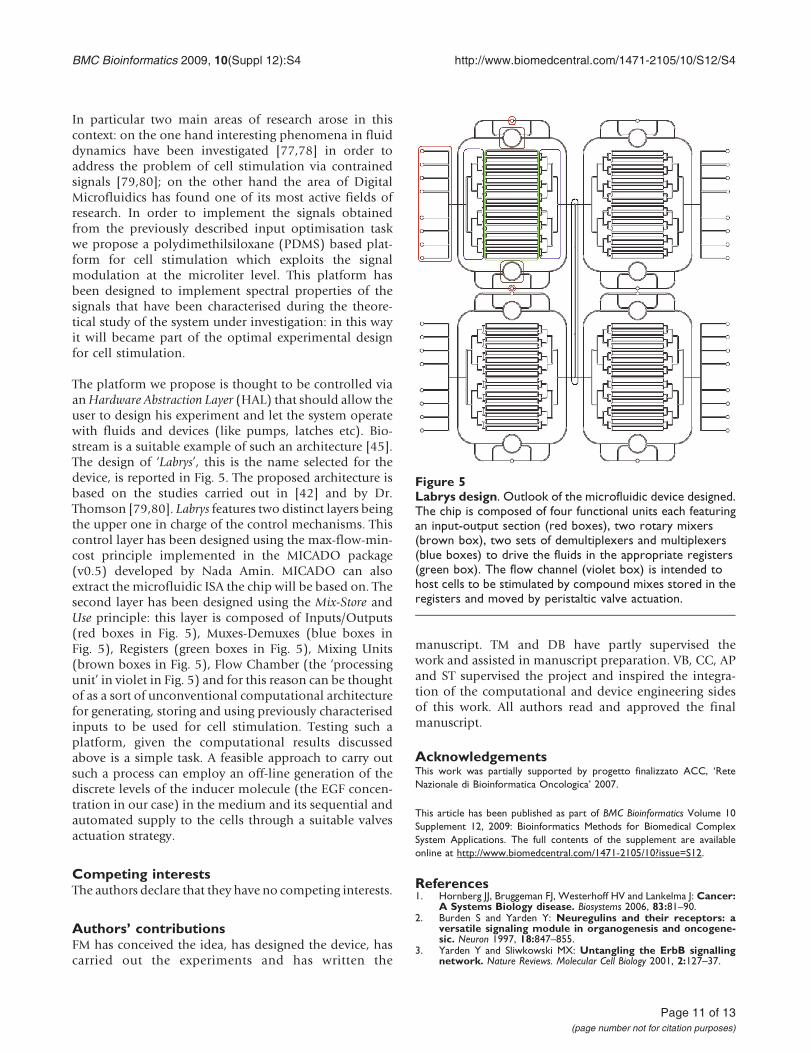
The platform we propose is thought to be controlled viaanHardware Abstraction Layer (HAL) that should allow theuser to design his experiment and let the system operatewith fluids and devices (like pumps, latches etc). Bio-stream is a suitable example of such an architecture [45].The design of ‘Labrys’, this is the name selected for thedevice, is reported in Fig. 5. The proposed architecture isbased on the studies carried out in [42] and by Dr.Thomson [79,80]. Labrys features two distinct layers beingthe upper one in charge of the control mechanisms. Thiscontrol layer has been designed using the max-flow-min-cost principle implemented in the MICADO package(v0.5) developed by Nada Amin. MICADO can alsoextract the microfluidic ISA the chip will be based on. Thesecond layer has been designed using the Mix-Store andUse principle: this layer is composed of Inputs/Outputs(red boxes in Fig. 5), Muxes-Demuxes (blue boxes inFig. 5), Registers (green boxes in Fig. 5), Mixing Units(brown boxes in Fig. 5), Flow Chamber (the ‘processingunit’ in violet in Fig. 5) and for this reason can be thoughtof as a sort of unconventional computational architecturefor generating, storing and using previously characterisedinputs to be used for cell stimulation. Testing such aplatform, given the computational results discussedabove is a simple task. A feasible approach to carry outsuch a process can employ an off-line generation of thediscrete levels of the inducer molecule (the EGF concen-tration in our case) in the medium and its sequential andautomated supply to the cells through a suitable valvesactuation strategy.
Competing interestsThe authors declare that they have no competing interests.
Authors’ contributionsFM has conceived the idea, has designed the device, hascarried out the experiments and has written the
manuscript. TM and DB have partly supervised thework and assisted in manuscript preparation. VB, CC, APand ST supervised the project and inspired the integra-tion of the computational and device engineering sidesof this work. All authors read and approved the finalmanuscript.
AcknowledgementsThis work was partially supported by progetto finalizzato ACC, ‘ReteNazionale di Bioinformatica Oncologica’ 2007.
This article has been published as part of BMC Bioinformatics Volume 10Supplement 12, 2009: Bioinformatics Methods for Biomedical ComplexSystem Applications. The full contents of the supplement are availableonline at http://www.biomedcentral.com/1471-2105/10?issue=S12.
References1. Hornberg JJ, Bruggeman FJ, Westerhoff HV and Lankelma J: Cancer:
A Systems Biology disease. Biosystems 2006, 83:81–90.2. Burden S and Yarden Y: Neuregulins and their receptors: a
versatile signaling module in organogenesis and oncogene-sic. Neuron 1997, 18:847–855.
3. Yarden Y and Sliwkowski MX: Untangling the ErbB signallingnetwork. Nature Reviews. Molecular Cell Biology 2001, 2:127–37.
Figure 5Labrys design. Outlook of the microfluidic device designed.The chip is composed of four functional units each featuringan input-output section (red boxes), two rotary mixers(brown box), two sets of demultiplexers and multiplexers(blue boxes) to drive the fluids in the appropriate registers(green box). The flow channel (violet box) is intended tohost cells to be stimulated by compound mixes stored in theregisters and moved by peristaltic valve actuation.
BMC Bioinformatics 2009, 10(Suppl 12):S4 http://www.biomedcentral.com/1471-2105/10/S12/S4
Page 11 of 13(page number not for citation purposes)

4. Eastman A and Perez RP: New targets and challenges in themolecular therapeutics of cancer. British Journal of ClinicalPharmacology 2006, 62:5–14.
5. Sebastian S, Settleman J, Reshkin SJ, Azzariti A, Bellizzi A andParadiso A: The complexity of targeting EGFR signalling incancer: from expression to turnover. Biochimica Et BiophysicaActa 2006, 1766:120–39.
6. Mendelsohn J and Baselga J: The EGF receptor family as targetsfor cancer therapy. Oncogene 2000, 19:6550–65.
7. Kholodenko BN, Demin OV, Moehren G and Hoek JB: Quantifica-tion of Short Term Signaling by the Epidermal GrowthFactor Receptor. J Biol Chem 1999, 274:30169–30181.
8. Oda K, Matsuoka Y, Funahashi A and Kitano H: A comprehensivepathway map of epidermal growth factor receptor signaling.Mol Syst Biol 2005, 1.
9. Wiley HS, Shvartsman SY and Lauffenburger DA: Computationalmodeling of the EGF-receptor system: a paradigm forsystems biology. Trends in Cell Biology 2003, 13:43–50.
10. Schoeberl B, Eichler-Jonsson C, Gilles ED and Müller G: Computa-tional modeling of the dynamics of the MAP kinase cascadeactivated by surface and internalized EGF receptors. 2002,20:370–5.
11. Hornberg JJ, Binder B, Bruggeman FJ, Schoeberl B, Heinrich R andWesterhoff HV: Control of MAPK signalling: from complexityto what really matters. Oncogene 2005, 24:5533–42.
12. Breitling R and Hoeller D: Current challenges in quantitativemodeling of epidermal growth factor signaling. FEBS Letters2005, 579:6289–94.
13. Zhang Y, Wolf-Yadlin A, Ross PL, Pappin DJ, Rush J,Lauffenburger DA and White FM: Time-resolved mass spectro-metry of tyrosine phosphorylation sites in the epidermalgrowth factor receptor signaling network reveals dynamicmodules. Molecular & Cellular Proteomics: MCP 2005, 4:1240–50.
14. Olsen JV, Blagoev B, Gnad F, Macek B, Kumar C, Mortensen P andMann M: Global, in vivo, and site-specific phosphorylationdynamics in signaling networks. Cell 2006, 127:635–48.
15. Blagoev B, Kratchmarova I, Ong SE, Nielsen M, Foster LJ andMann M: A proteomics strategy to elucidate functionalprotein-protein interactions applied to EGF signaling. NatureBiotechnology 2003, 21:315–8.
16. Hengl S, Kreutz C, Timmer J and Maiwald T: Data-basedidentifiability analysis of non-linear dynamical models.Bioinformatics 2007, 23:2612–2618.
17. Casey FP, Baird D, Feng Q, Gutenkunst RN, Waterfall JJ, Myers CR,Brown KS, Cerione RA and Sethna JP: Optimal experimentaldesign in an EGFR signaling and down-regulation model. q-bio/0610024 2006 http://arxiv.org/abs/q-bio/0610024.
18. Faller D, Klingmuller U and Timmer J: Simulation Methods forOptimal Experimental Design in Systems Biology. SIMULA-TION 2003, 79:717–725.
19. Vance W, Arkin A and Ross J: Determination of causalconnectivities of species in reaction networks. Proc Natl AcadSci U S A 2002, 99:5816–5821.
20. Samoilov M, Arkin A and Ross J: On the deduction of chemicalreaction pathways from measurements of time series ofconcentrations. Chaos (Woodbury, N.Y.) 2001, 11:108–114.
21. Vlad MO, Arkin A and Ross J: Response experiments fornonlinear systems with application to reaction kinetics andgenetics. Proc Natl Acad Sci U S A 2004, 101:7223–7228.
22. Flaherty P, Jordan MI and Arkin AP: Robust design of biologicalexperiments. Proceedings of the Neural Information ProcessingSymposium 2005, 2005.
23. Mettetal JT, Muzzey D, Gómez-Uribe C and van Oudenaarden A:The frequency dependence of osmo-adaptation in Sacchar-omyces cerevisiae. Science (New York, N.Y.) 2008, 319:482–4.
24. Steuer R, Kurths J, Fiehn O and Weckwerth W: Observing andinterpreting correlations in metabolomic networks. Bioinfor-matics 2003, 19:1019–1026.
25. Yue H, Brown M, Knowles J, Wang H, Broomhead DS and Kell DB:Insights into the behaviour of systems biology models fromdynamic sensitivity and identifiability analysis: a case studyof an NF-[small kappa]B signalling pathway. MolecularBioSystems 2006, 2:640–649.
26. Quaiser T, Marquardt W and Monnigmann M: Local identifiabilityanalysis of large signalling pathway models. Proc. of FOSBE2007 2007, 465–470.
27. Anguelova M and Wennberg B: Identifiability of the Time-lagParameter in Delay Systems with Applications to SystemsBiology. Proc. of FOSBE 2007 2007, 533–538.
28. Geffen Dara, S M, A F, Findeisen Rolf and Guay M: The Question ofParameter Identifiability for Biochemical Reaction Net-works Considering the NF-kappaB Signal TransductionPathway. Proc. of FOSBE 2007 2007, 509–514.
29. Cobelli C and Romanin-Jacur G: Structural identifiability ofstrongly connected biological compartmental systems. MedBiol Eng 1975, 13:831–838.
30. Cobelli C, Lepschy A and Romanin-Jacur G: Structural identifiability ofbiological compartmental systems. Digital computer implementation of atesting procedure 1976, 88–102 http://dx.doi.org/10.1007/3-540-07622-0_463.
31. Bellu G, Saccomani MP, Audoly S and D’Angiò L: DAISY: a newsoftware tool to test global identifiability of biological andphysiological systems. Comput Methods Programs Biomed 2007,88:52–61.
32. Pronzato L: Optimal experimental design and some relatedcontrol problems. 0802.4381 2008 http://arxiv.org/abs/0802.4381, [Automatica/Automatica J IFAC; Automatika; AutomaticaIFAC J 44 (2008) 303–325].
33. Ljung L: System Identification: Theory for the User Prentice Hall PTR;21999.
34. Phair RD and Misteli T: Kinetic modelling approaches to in vivoimaging. Nature Reviews. Molecular Cell Biology 2001, 2:898–907,[PMID: 11733769].
35. Cho KH, Shin SY, Kolch W and Wolkenhauer O: ExperimentalDesign in Systems Biology, Based on Parameter SensitivityAnalysis Using a Monte Carlo Method: A Case Study for theTNFalpha-Mediated NF-kappa B Signal Transduction Path-way. SIMULATION 2003, 79:726–739.
36. Lipschultz CA, Li Y and Smith-Gill S: Experimental design foranalysis of complex kinetics using surface plasmon reso-nance. Methods (San Diego, Calif.) 2000, 20:310–8.
37. Sontag E: Molecular Systems Biology and Control: AQualitative-Quantitative Approach. Decision and Control, 2005and 2005 European Control Conference. CDC-ECC ‘05. 44th IEEEConference on 20052314–2319.
38. Maiwald T and Timmer J: Dynamical Modeling and Multi-Experiment Fitting with PottersWheel. Bioinformatics 2008,btn350 http://bioinformatics.oxfordjournals.org/cgi/content/abstract/btn350v1.
39. Balsa-Canto E, Alonso A and Banga J: Computational proceduresfor optimal experimental design in biological systems. IETSystems Biology 2008, 2(4):163–172.
40. Rylander BI: Computational complexity and the geneticalgorithm. PhD thesis University of Idaho; 2001 http://portal.acm.org/citation.cfm?id=933869.
41. Hollander M and Wolfe DA: Nonparametric Statistical Methods Wiley-Interscience; 21999.
42. Andrew N, Craig D, Urbanski JP, Gunawardena J and Thorsen T:Microfluidic temporal cell stimulation. μTAS 08 2008.
43. Kholodenko BN, Kiyatkin A, Bruggeman FJ, Sontag E, Westerhoff HVand Hoek JB: Untangling the wires: a strategy to tracefunctional interactions in signaling and gene networks.Proceedings of the National Academy of Sciences of the United Statesof America 2002, 99(20):12841–6.
44. Sontag E, Kiyatkin A and Kholodenko BN: Inferring dynamicarchitecture of cellular networks using time series of geneexpression, protein and metabolite data. Bioinformatics 2004,20(12):1877–1886.
45. Thies W, Urbanski J, Thorsen T and Amarasinghe S: Abstractionlayers for scalable microfluidic biocomputing. Natural Comput-ing 2006 http://dx.doi.org/10.1007/s11047-006-9032-6.
46. BioModels Database. http://www.ebi.ac.uk/biomodels-main/sta-tic-pages.do?page=home.
47. BioModels Database – Kholodenko1999-EGFRsignaling.http://www.ebi.ac.uk/biomodels-main/publ-model.do?mid=-BIOMD0000000048.
48. Hoops S, Sahle S, Gauges R, Lee C, Pahle J, Simus N, Singhal M, Xu L,Mendes P and Kummer U: COPASI-a COmplex PAthwaySImulator. Bioinformatics 2006, 22:3067–3074.
49. Gunawardena J: Signals and Systems: Towards a SystemsBiology of Signal Transduction. Proceedings of the IEEE 2008,96:1386–1397.
50. Hu S: Optimal time points sampling in pathway modelling.Engineering in Medicine and Biology Society, 2004. IEMBS ‘04. 26thAnnual International Conference of the IEEE 2004, 1:671–674.
51. Steinke F, Seeger M and Tsuda K: Experimental design forefficient identification of gene regulatory networks usingsparse Bayesian models. BMC Systems Biology 2007, 1:51.
BMC Bioinformatics 2009, 10(Suppl 12):S4 http://www.biomedcentral.com/1471-2105/10/S12/S4
Page 12 of 13(page number not for citation purposes)

52. van Riel NA: Dynamic modelling and analysis of biochemicalnetworks: mechanism-based models and model-basedexperiments. Brief Bioinform 2006, 7:364–374.
53. Asprey S and Macchietto S: Designing robust optimal dynamicexperiments 2002. http://www.ingentaconnect.com/content/els/09591524/2002/00000012/00000004/art00020.
54. Apgar JF, Toettcher JE, Endy D, White FM and Tidor B: StimulusDesign for Model Selection and Validation in Cell Signaling.PLoS Computational Biology 2008, 4:e30.
55. Bernaerts K and Impe JV: Optimal dynamic experiment designfor estimation of microbial growth kinetics at sub-optimaltemperatures: Modes of implementation. Simulation ModellingPractice and Theory 2005, 13:129–138.
56. Kremling A, Fischer S, Gadkar K, Doyle FJ, Sauter T, Bullinger E,Allgower F and Gilles ED: A Benchmark for Methods in ReverseEngineering and Model Discrimination: Problem Formula-tion and Solutions. Genome Res 2004, 14:1773–1785.
57. Brik Ternbach M, Bollman C, Wandrey C and Takors R: Applica-tion of model discriminating experimental design formodeling and development of a fermentative fed-batch L-valine production process. Biotechnol Bioeng 2005, 91:356–368.
58. Franceschini G and Sanro Macchietto: Model-based design ofexperiments for parameter precision: State of the art.Chemical Engineering Science 2007.
59. Chen B and Asprey S: On the Design of Optimally InformativeDynamic Experiments for Model Discrimination in Multi-response Nonlinear Situations. Industrial & Engineering ChemistryResearch 2003, 42:1379–1390.
60. Cooney M and McDonald K: Optimal dynamic experiments forbioreactor model discrimination. Applied Microbiol Biotechnol1995, 43:826–837.
61. Atkinson AC and Donev AN: Optimum experimental designs.Optimum Experimental Designs.
62. Casey F: Prediction and Optimal Experimental Design inSystems Biology. PhD in Physics Cornell University, LASSP, PhysicsDepartment, Clark Hall, Cornell University, Ithaca, NY 14853-2501;2006.
63. UCSB Biosens – Bio-SPICE Dashboard. http://www.chemengr.ucsb.edu/~ceweb/faculty/doyle/biosens/BioSens.htm.
64. UCSB Biosens – Bio-SPICE Dashboard. http://cbbl.imim.es:8080/ByoDyn.
65. Gutenkunst RN, Waterfall JJ, Casey FP, Brown KS, Myers CR andSethna JP: Universally Sloppy Parameter Sensitivities in SystemsBiology Models. PLoS Comput Biol 2007, 3(10):1871–1878.
66. Mehra R: Optimal input signals for parameter estimation indynamic systems-Survey and new results. Automatic Control,IEEE Transactions on 1974, 19(6):753–768.
67. Rodriguez-Fernandez M, Egea J and Banga J: Novel metaheuristicfor parameter estimation in nonlinear dynamic biologicalsystems. BMC Bioinformatics 2006, 7:483.
68. Goodwin G: Identification: Experiment Design. Systems andControl Encyclopedia 1987, 4:2257–64.
69. Weibel DB and Whitesides GM: Applications of microfluidics inchemical biology. Current Opinion in Chemical Biology 2006,10:584–591.
70. Walker GM, Zeringue HC and Beebe DJ: Microenvironmentdesign considerations for cellular scale studies. Lab on a Chip2004, 4:91–97.
71. Takayama S, Ostuni E, LeDuc P, Naruse K, Ingber DE andWhitesides GM: Selective Chemical Treatment of CellularMicrodomains Using Multiple Laminar Streams. Chemistry &Biology 2003, 10:123–130.
72. Takayama S, Ostuni E, LeDuc P, Naruse K, Ingber DE andWhitesides GM: Subcellular positioning of small molecules.Nature 2001, 411:1016.
73. Breslauer DN, Lee PJ and Lee LP: Microfluidics-based systemsbiology. Molecular BioSystems 2006, 2:97–112.
74. Squires TM and Quake SR: Microfluidics: Fluid physics at thenanoliter scale. Reviews of Modern Physics 2005, 77:977–50.
75. Ye L, Zhang M, Alexopoulosa L, Sorger P and Jensen K:Microfluidicdevices for studying the response of adherent cells undershort time stimuli treatment. μTAS 07 2007.
76. King KR, Wang S, Jayaraman A, Yarmush ML and Toner M:Microfluidic flow-encoded switching for parallel control ofdynamic cellular microenvironments. Lab on a Chip 2008,8:107–116.
77. Urbanski JP: Application of Microfluidic Emulsion Technologyto Biochemistry, Drug Delivery and Lab-on-a-Chip Pro-grammability. 2005.
78. Thorsen T: Microfluidic Technologies for High-ThroughputScreening Applications. 2003.
79. Thomson TM: TMT Thesis Project – OpenWetWare. 2005http://openwetware.org/wiki/TMT_Thesis_Project.
80. Thomson TM: Stimulator Project – OpenWetWare. 2005http://openwetware.org/wiki/Stimulator.
Publish with BioMed Central and every scientist can read your work free of charge
"BioMed Central will be the most significant development for disseminating the results of biomedical research in our lifetime."
Sir Paul Nurse, Cancer Research UK
Your research papers will be:
available free of charge to the entire biomedical community
peer reviewed and published immediately upon acceptance
cited in PubMed and archived on PubMed Central
yours — you keep the copyright
Submit your manuscript here:http://www.biomedcentral.com/info/publishing_adv.asp
BioMedcentral
BMC Bioinformatics 2009, 10(Suppl 12):S4 http://www.biomedcentral.com/1471-2105/10/S12/S4
Page 13 of 13(page number not for citation purposes)