developing utility energy efficiency programs with ... · — image and...
TRANSCRIPT
Copyright © 2009 by ScottMadden. All rights reserved. Copyright © 2009 by ScottMadden. All rights reserved.
Developing Utility Energy Efficiency Programs with
Measurement and Verification (M&V)
An Overview of the ScottMadden Methodology
Contact: [email protected]

Copyright © 2009 by ScottMadden. All rights reserved. 1
Energy Efficiency is Being “Accepted” as a New Market-side Resource Providing Both Customer and Utility Benefits
Utility energy capacity, supply, and delivery benefits — 2007 Utility CEO survey — efficiency is #1 choice for avoiding expensive gas generation in a carbon-constrained world — 2007 and 2008 NERC 10-year LTRA (long-term resource assessment)
• Efficiency increases by 6 GWs • DSM provides 1.1% load reduction — equivalent to one year annual growth • Already providing grid reliability services — demand response (DR)/ancillary
— Energy efficiency projects to compete with power plants in PJM (March ‘09)
“GHG/Carbon-reduction” benefits — Energy efficiency included in RPS — EPRI’s PRISM technology study — efficiency is the earliest, least cost carbon reduction option — National Petroleum Council’s #1 strategy — moderate demand by increasing energy efficiency (July ‘07) — EPA notes emissions from US industry have declined over the past decade — energy efficiency is key (April ‘09)
Near-term job growth benefits (stimulus)
Rate increase mitigation in difficult economic times — customer retention and near-term economic growth
New legislation and regulatory policies are accelerating acceptance
— ARRA ’09 stimulus — weatherization assistance, block grants, state efficiency programs, Smart Grid
— NARUC/FERC Smart Grid Collaborative — proposed ARRA ‘09 Smart Grid funding criteria to DOE
— FERC NOPP — Smart Grid policy (March 19, 2009)
— Building on earlier legislation/policies (EISA ‘07 Title XIII Smart Grid, state energy efficiency/demand response, etc.)

Copyright © 2009 by ScottMadden. All rights reserved. 2
Energy Efficiency Provides Residential (and Small Commercial) Savings Benefits
Source: Feasibility of Energy Efficiency as an Eligible Resource, State of North Carolina study, December 2007.
Copyright © 2009 by ScottMadden. All rights reserved. 3
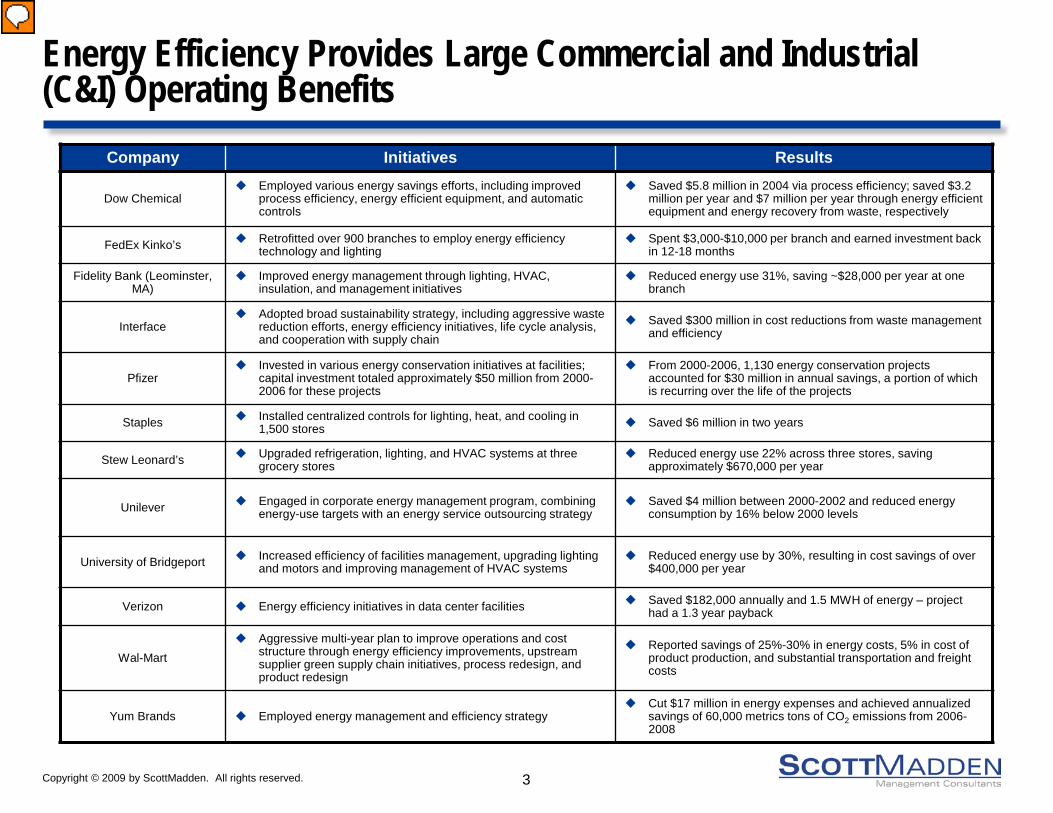
Energy Efficiency Provides Large Commercial and Industrial (C&I) Operating Benefits
Company Initiatives Results
Dow Chemical Employed various energy savings efforts, including improved
process efficiency, energy efficient equipment, and automatic controls
Saved $5.8 million in 2004 via process efficiency; saved $3.2 million per year and $7 million per year through energy efficient equipment and energy recovery from waste, respectively
FedEx Kinko’s Retrofitted over 900 branches to employ energy efficiency technology and lighting
Spent $3,000-$10,000 per branch and earned investment back in 12-18 months
Fidelity Bank (Leominster, MA)
Improved energy management through lighting, HVAC, insulation, and management initiatives
Reduced energy use 31%, saving ~$28,000 per year at one branch
Interface Adopted broad sustainability strategy, including aggressive waste
reduction efforts, energy efficiency initiatives, life cycle analysis, and cooperation with supply chain
Saved $300 million in cost reductions from waste management and efficiency
Pfizer Invested in various energy conservation initiatives at facilities;
capital investment totaled approximately $50 million from 2000-2006 for these projects
From 2000-2006, 1,130 energy conservation projects accounted for $30 million in annual savings, a portion of which is recurring over the life of the projects
Staples Installed centralized controls for lighting, heat, and cooling in 1,500 stores Saved $6 million in two years
Stew Leonard’s Upgraded refrigeration, lighting, and HVAC systems at three grocery stores
Reduced energy use 22% across three stores, saving approximately $670,000 per year
Unilever Engaged in corporate energy management program, combining energy-use targets with an energy service outsourcing strategy
Saved $4 million between 2000-2002 and reduced energy consumption by 16% below 2000 levels
University of Bridgeport Increased efficiency of facilities management, upgrading lighting and motors and improving management of HVAC systems
Reduced energy use by 30%, resulting in cost savings of over $400,000 per year
Verizon Energy efficiency initiatives in data center facilities Saved $182,000 annually and 1.5 MWH of energy – project had a 1.3 year payback
Wal-Mart Aggressive multi-year plan to improve operations and cost
structure through energy efficiency improvements, upstream supplier green supply chain initiatives, process redesign, and product redesign
Reported savings of 25%-30% in energy costs, 5% in cost of product production, and substantial transportation and freight costs
Yum Brands Employed energy management and efficiency strategy Cut $17 million in energy expenses and achieved annualized
savings of 60,000 metrics tons of CO2 emissions from 2006-2008
Copyright © 2009 by ScottMadden. All rights reserved. 4
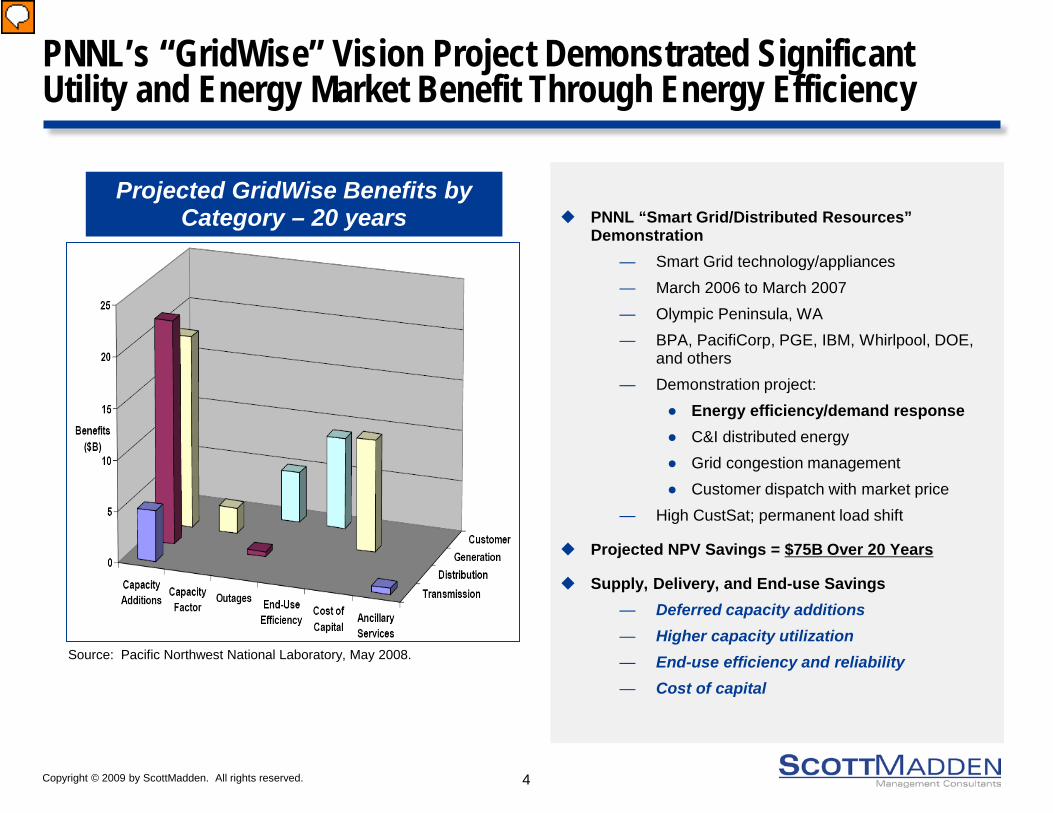
PNNL’s “GridWise” Vision Project Demonstrated Significant Utility and Energy Market Benefit Through Energy Efficiency
Projected GridWise Benefits by Category – 20 years
Source: Pacific Northwest National Laboratory, May 2008.
PNNL “Smart Grid/Distributed Resources” Demonstration
— Smart Grid technology/appliances — March 2006 to March 2007 — Olympic Peninsula, WA — BPA, PacifiCorp, PGE, IBM, Whirlpool, DOE,
and others — Demonstration project:
● Energy efficiency/demand response ● C&I distributed energy ● Grid congestion management ● Customer dispatch with market price
— High CustSat; permanent load shift
Projected NPV Savings = $75B Over 20 Years
Supply, Delivery, and End-use Savings — Deferred capacity additions — Higher capacity utilization — End-use efficiency and reliability — Cost of capital
Copyright © 2009 by ScottMadden. All rights reserved. 5
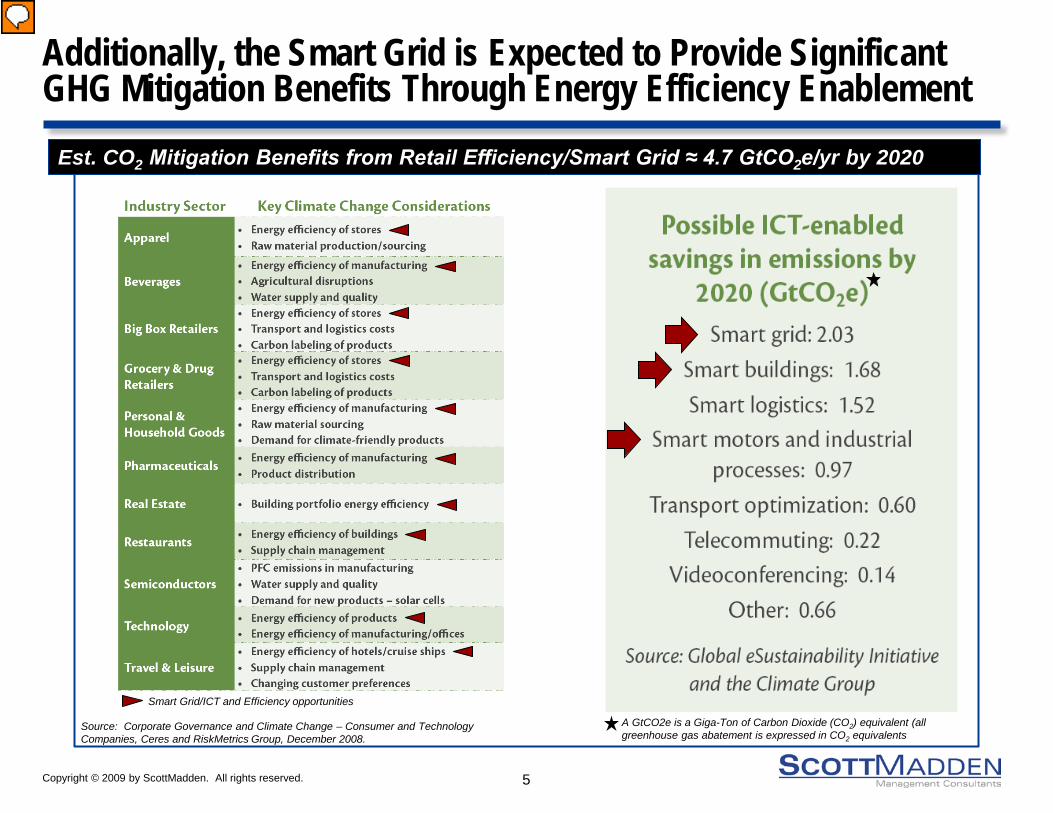
Additionally, the Smart Grid is Expected to Provide Significant GHG Mitigation Benefits Through Energy Efficiency Enablement
Est. CO2 Mitigation Benefits from Retail Efficiency/Smart Grid ≈ 4.7 GtCO2e/yr by 2020
Source: Corporate Governance and Climate Change – Consumer and Technology Companies, Ceres and RiskMetrics Group, December 2008.
A GtCO2e is a Giga-Ton of Carbon Dioxide (CO2) equivalent (all greenhouse gas abatement is expressed in CO2 equivalents
Smart Grid/ICT and Efficiency opportunities

Copyright © 2009 by ScottMadden. All rights reserved. 6
Traditional Utility Energy Efficiency Programs Are Not Designed to Capture These Customer and Utility Benefits
Comprised of “one-off” utility marketing products — Home/facility performance (i.e., weatherization, etc.) — Mechanical systems – lighting, HVAC, and water heating — Specific C&I end-use (e.g., food service commercial cooking)
Often viewed as “free-ridership” — customer paid incentive even though “net” benefit is provided — and erodes kWh sales
Do not reflect all benefits to specific customer segments/facility operations — Energy savings — Other operational efficiencies and flexibility — Higher sales and expanded product offerings — Smaller facility footprints — Other business benefits
Do not reflect all benefits to utility operations and planning — Energy/fuel cost benefits — IRP/capacity planning benefits — Reliability benefits — “active” energy efficiency/usage management such as demand response — CustSat — Capital deferrals and optimized capital planning — Image and legislative/regulatory/stakeholder engagement (intrinsic value)
Do not adequately measure and verify (M&V) benefits/value to the customer and utility

Copyright © 2009 by ScottMadden. All rights reserved. 7
Measurement and Verification (M&V) is a Key Element in Developing an Energy Efficiency Program
ScottMadden Combines Our Energy Efficiency Program Development with Strong M&V Qualifications and Capabilities
ScottMadden has an established energy efficiency methodology and has hands-on experience with utility clients. Additionally, we have two Partners who have passed the CMVP examination for certification as Energy Efficiency Measurement and Verification (M&V) professionals
The Association of Energy Engineers (AEE), in cooperation with the Efficiency Valuation Organization (EVO), has established the Certified Measurement and Verification Professional (CMVP) program with the dual purpose of recognizing the most qualified professionals in this growing area of the energy industry and raising the overall professional standards within the measurement and verification field
The International Performance Measurement & Verification Protocol (IPMVP), first established by the U.S. DOE, has become the internationally recognized protocol for performance measurement and verification (M&V). The IPMVP guidelines, built with the help of organizations from 16 countries and hundreds of individual experts from 25 nations, provides a consistent, reliable approach to M&V around the world
Since 1981, AEE has certified over 7,000 professionals within the energy industry. AEE's certifications are recognized by governmental agencies, including the U.S. Department of Energy and the U.S. Agency for International Development, as well as by utilities, end users, and energy service companies. When you earn the right to put the initials "CMVP" behind your name, you are distinguishing yourself among those involved professionally in areas requiring the application of accurate and reliable measurement and verification methodologies. You have demonstrated high levels of experience, competence, and specialized knowledge within your field
Copyright © 2009 by ScottMadden. All rights reserved. 8
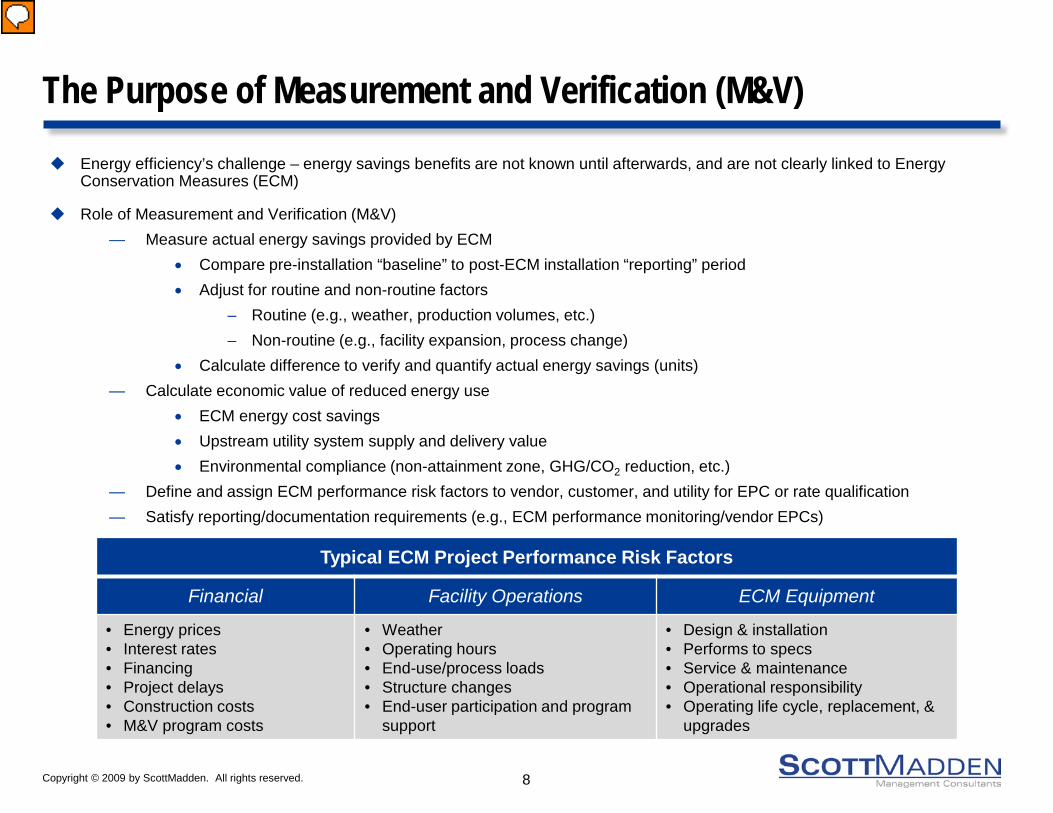
The Purpose of Measurement and Verification (M&V)
Energy efficiency’s challenge – energy savings benefits are not known until afterwards, and are not clearly linked to Energy Conservation Measures (ECM)
Role of Measurement and Verification (M&V) — Measure actual energy savings provided by ECM
• Compare pre-installation “baseline” to post-ECM installation “reporting” period • Adjust for routine and non-routine factors
– Routine (e.g., weather, production volumes, etc.) – Non-routine (e.g., facility expansion, process change)
• Calculate difference to verify and quantify actual energy savings (units) — Calculate economic value of reduced energy use
• ECM energy cost savings • Upstream utility system supply and delivery value • Environmental compliance (non-attainment zone, GHG/CO2 reduction, etc.)
— Define and assign ECM performance risk factors to vendor, customer, and utility for EPC or rate qualification — Satisfy reporting/documentation requirements (e.g., ECM performance monitoring/vendor EPCs)
Typical ECM Project Performance Risk Factors
Financial Facility Operations ECM Equipment
• Energy prices • Interest rates • Financing • Project delays • Construction costs • M&V program costs
• Weather • Operating hours • End-use/process loads • Structure changes • End-user participation and program
support
• Design & installation • Performs to specs • Service & maintenance • Operational responsibility • Operating life cycle, replacement, &
upgrades
Copyright © 2009 by ScottMadden. All rights reserved. 9
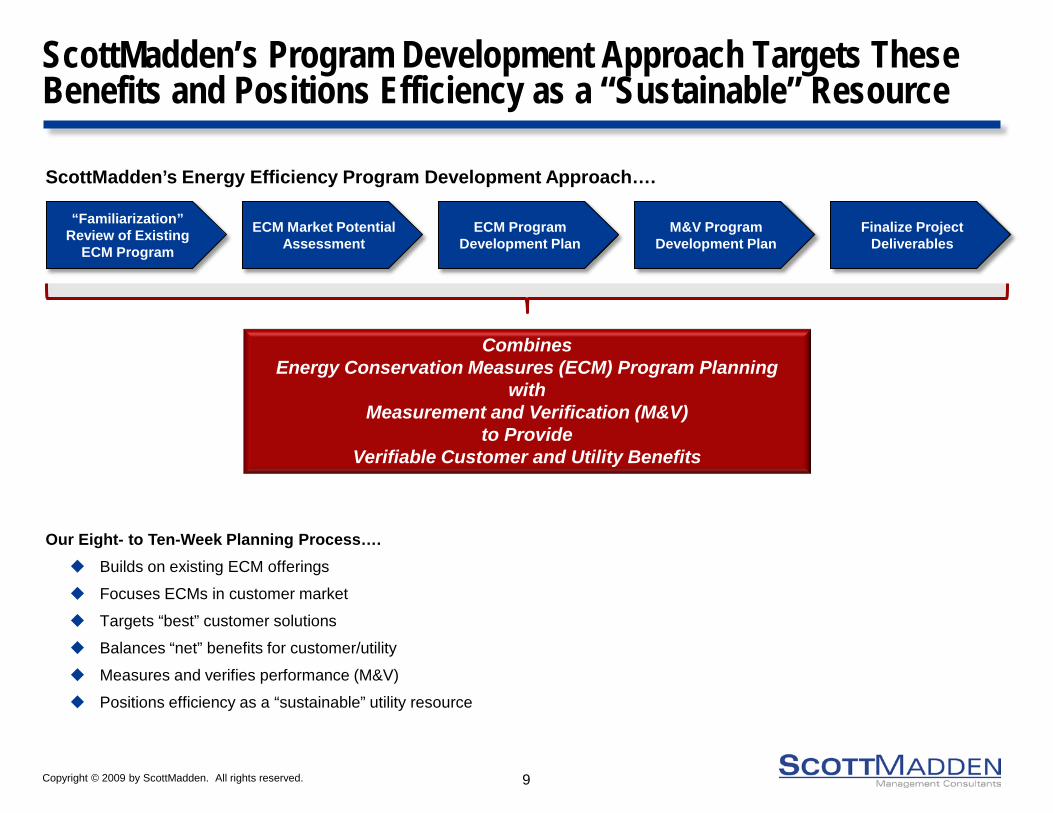
ScottMadden’s Program Development Approach Targets These Benefits and Positions Efficiency as a “Sustainable” Resource
“Familiarization” Review of Existing
ECM Program
ECM Market Potential Assessment
ECM Program Development Plan
M&V Program Development Plan
Finalize Project Deliverables
ScottMadden’s Energy Efficiency Program Development Approach….
Our Eight- to Ten-Week Planning Process…. Builds on existing ECM offerings
Focuses ECMs in customer market
Targets “best” customer solutions
Balances “net” benefits for customer/utility
Measures and verifies performance (M&V)
Positions efficiency as a “sustainable” utility resource
Combines Energy Conservation Measures (ECM) Program Planning
with Measurement and Verification (M&V)
to Provide Verifiable Customer and Utility Benefits
Copyright © 2009 by ScottMadden. All rights reserved. 10
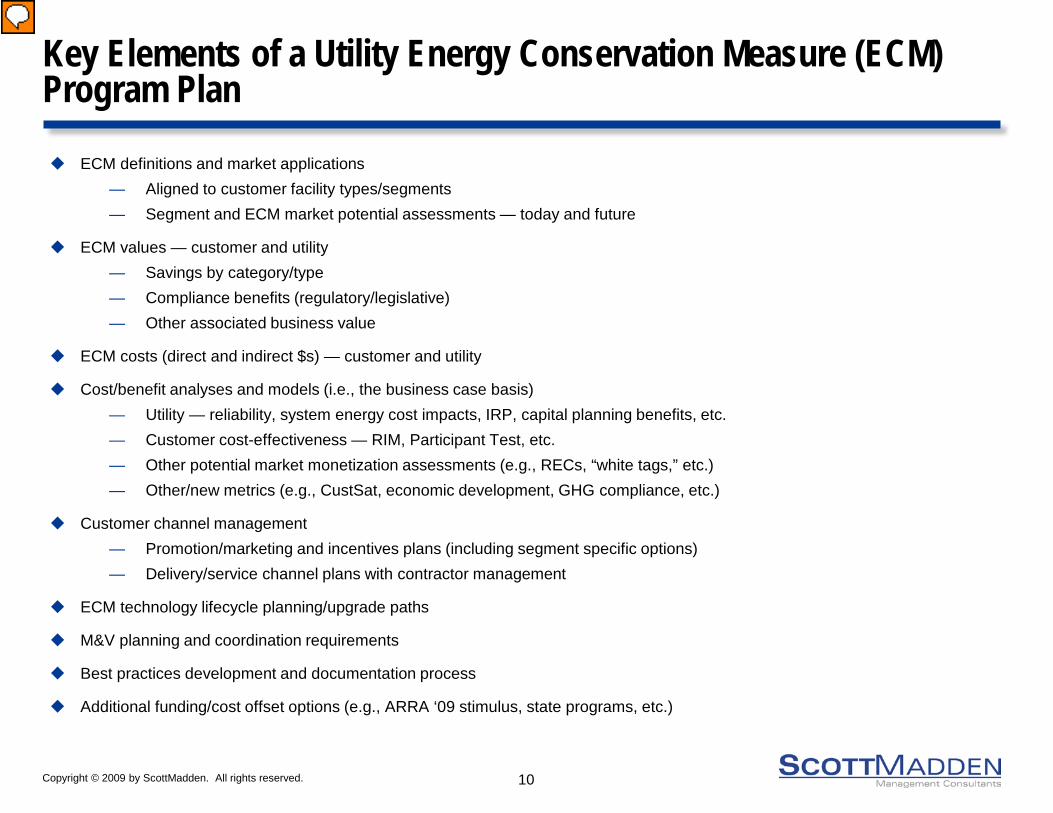
Key Elements of a Utility Energy Conservation Measure (ECM) Program Plan
ECM definitions and market applications — Aligned to customer facility types/segments — Segment and ECM market potential assessments — today and future
ECM values — customer and utility — Savings by category/type — Compliance benefits (regulatory/legislative) — Other associated business value
ECM costs (direct and indirect $s) — customer and utility
Cost/benefit analyses and models (i.e., the business case basis) — Utility — reliability, system energy cost impacts, IRP, capital planning benefits, etc. — Customer cost-effectiveness — RIM, Participant Test, etc. — Other potential market monetization assessments (e.g., RECs, “white tags,” etc.) — Other/new metrics (e.g., CustSat, economic development, GHG compliance, etc.)
Customer channel management — Promotion/marketing and incentives plans (including segment specific options) — Delivery/service channel plans with contractor management
ECM technology lifecycle planning/upgrade paths
M&V planning and coordination requirements
Best practices development and documentation process
Additional funding/cost offset options (e.g., ARRA ‘09 stimulus, state programs, etc.)
Copyright © 2009 by ScottMadden. All rights reserved. 11
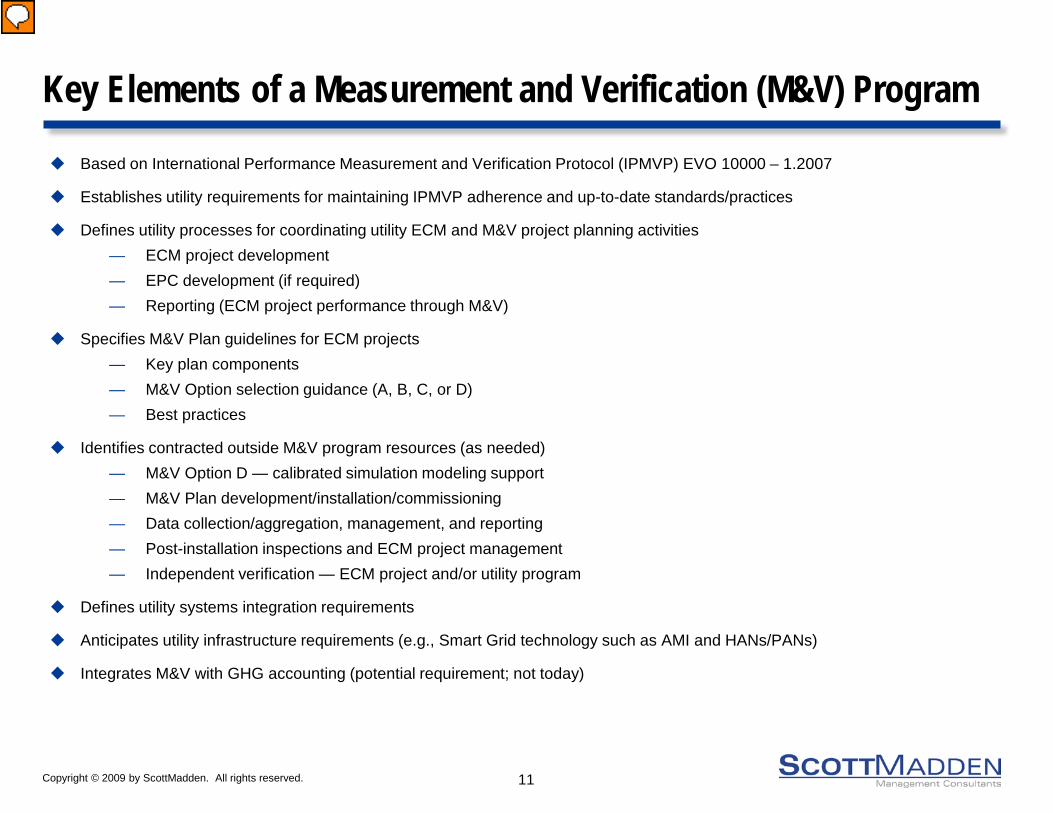
Key Elements of a Measurement and Verification (M&V) Program
Based on International Performance Measurement and Verification Protocol (IPMVP) EVO 10000 – 1.2007
Establishes utility requirements for maintaining IPMVP adherence and up-to-date standards/practices
Defines utility processes for coordinating utility ECM and M&V project planning activities — ECM project development — EPC development (if required) — Reporting (ECM project performance through M&V)
Specifies M&V Plan guidelines for ECM projects — Key plan components — M&V Option selection guidance (A, B, C, or D) — Best practices
Identifies contracted outside M&V program resources (as needed) — M&V Option D — calibrated simulation modeling support — M&V Plan development/installation/commissioning — Data collection/aggregation, management, and reporting — Post-installation inspections and ECM project management — Independent verification — ECM project and/or utility program
Defines utility systems integration requirements
Anticipates utility infrastructure requirements (e.g., Smart Grid technology such as AMI and HANs/PANs)
Integrates M&V with GHG accounting (potential requirement; not today)
Copyright © 2009 by ScottMadden. All rights reserved. 12
ScottMadden’s Energy Efficiency Development Objectives Focus on Capturing Benefits Specific to the Utility and Its Markets
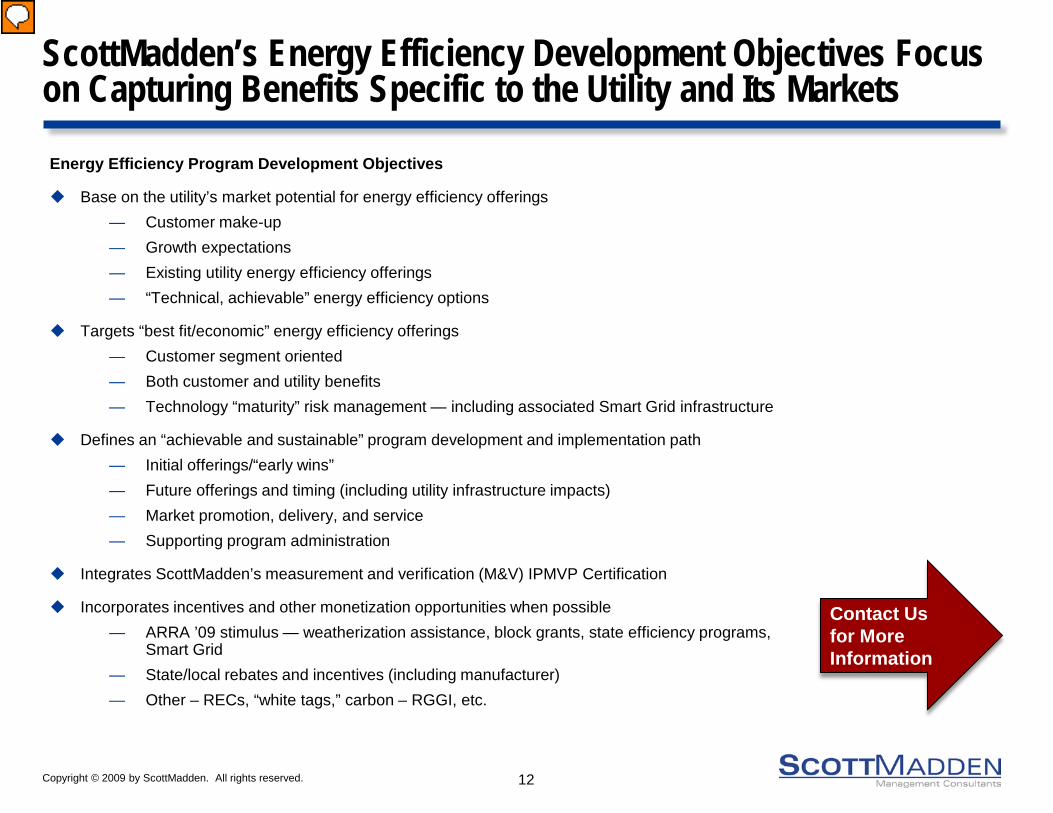
Energy Efficiency Program Development Objectives
Base on the utility’s market potential for energy efficiency offerings — Customer make-up — Growth expectations — Existing utility energy efficiency offerings — “Technical, achievable” energy efficiency options
Targets “best fit/economic” energy efficiency offerings — Customer segment oriented — Both customer and utility benefits — Technology “maturity” risk management — including associated Smart Grid infrastructure
Defines an “achievable and sustainable” program development and implementation path — Initial offerings/“early wins” — Future offerings and timing (including utility infrastructure impacts) — Market promotion, delivery, and service — Supporting program administration
Integrates ScottMadden’s measurement and verification (M&V) IPMVP Certification
Incorporates incentives and other monetization opportunities when possible — ARRA ’09 stimulus — weatherization assistance, block grants, state efficiency programs,
Smart Grid — State/local rebates and incentives (including manufacturer) — Other – RECs, “white tags,” carbon – RGGI, etc.
Contact Us for More Information
Copyright © 2009 by ScottMadden. All rights reserved. 13
Contact Us
Jere “Jake” Jacobi Partner
ScottMadden, Inc. Ten Piedmont Center
Suite 805 Atlanta, GA 30305
Phone: 404-814-0020 Mobile: 262-337-1352
For more information on Developing Utility Energy Efficiency Programs with Measurement and Verification, please contact us.